Score Meter
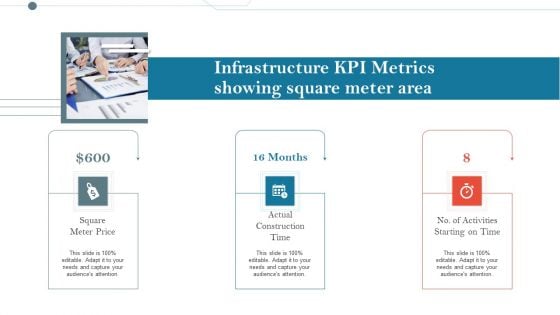
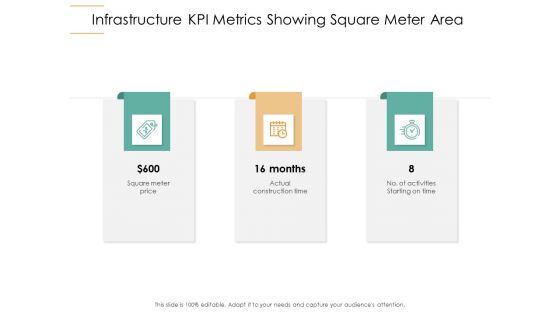
Construction Management Services And Action Plan Infrastructure KPI Metrics Showing Square Meter Area Information PDF
Presenting construction management services and action plan infrastructure kpi metrics showing square meter area information pdf to provide visual cues and insights. Share and navigate important information on three stages that need your due attention. This template can be used to pitch topics like infrastructure kpi metrics showing square meter area. In addtion, this PPT design contains high resolution images, graphics, etc, that are easily editable and available for immediate download.
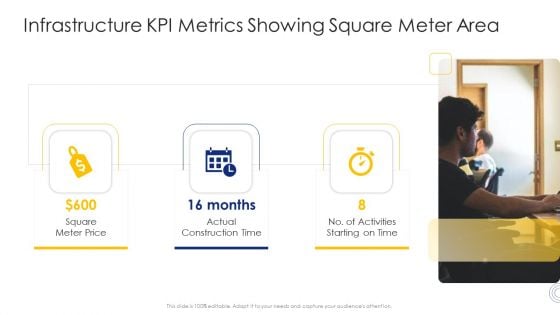
Construction Engineering And Industrial Facility Management Infrastructure KPI Metrics Showing Square Meter Area Ideas PDF
Presenting construction engineering and industrial facility management infrastructure kpi metrics showing square meter area ideas pdf to provide visual cues and insights. Share and navigate important information on three stages that need your due attention. This template can be used to pitch topics like square meter price, actual construction time, no of activities starting on time . In addtion, this PPT design contains high resolution images, graphics, etc, that are easily editable and available for immediate download.

Construction Management Services Infrastructure KPI Metrics Showing Square Meter Area Designs PDF
Presenting construction management services infrastructure kpi metrics showing square meter area designs pdf to provide visual cues and insights. Share and navigate important information on three stages that need your due attention. This template can be used to pitch topics like square meter price, actual construction time, activities. In addition, this PPT design contains high-resolution images, graphics, etc, that are easily editable and available for immediate download.
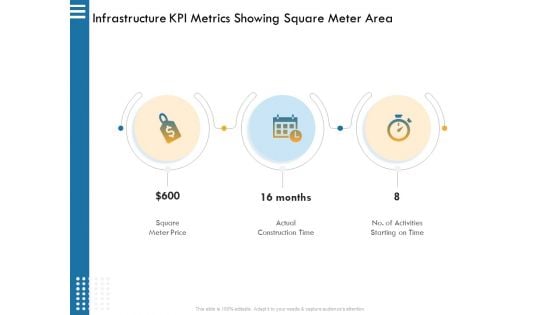
IT Infrastructure Governance Infrastructure KPI Metrics Showing Square Meter Area Ppt Infographics Guide PDF
Presenting it infrastructure governance infrastructure kpi metrics showing square meter area ppt infographics guide pdf. to provide visual cues and insights. Share and navigate important information on three stages that need your due attention. This template can be used to pitch topics like square meter price actual, construction time, no. activities starting time. In addtion, this PPT design contains high resolution images, graphics, etc, that are easily editable and available for immediate download.
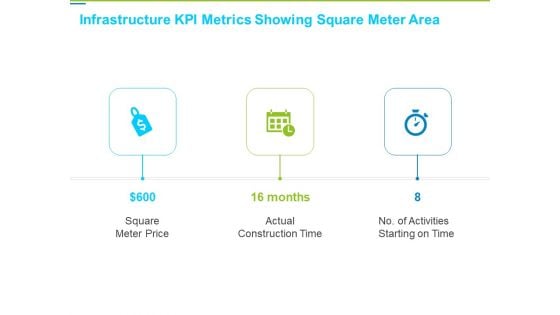
Framework Administration Infrastructure KPI Metrics Showing Square Meter Area Elements PDF
Presenting framework administration infrastructure kpi metrics showing square meter area elements pdf to provide visual cues and insights. Share and navigate important information on three stages that need your due attention. This template can be used to pitch topics like square meter price, actual construction time, no. of activities starting on time. In addition, this PPT design contains high-resolution images, graphics, etc, that are easily editable and available for immediate download.
Infrastructure Strategies Infrastructure KPI Metrics Showing Square Meter Area Ppt Outline Graphics Pictures PDF
Presenting infrastructure strategies infrastructure kpi metrics showing square meter area ppt outline graphics pictures pdf to provide visual cues and insights. Share and navigate important information on three stages that need your due attention. This template can be used to pitch topics like square meter price, actual construction time, no of activities starting on time. In addtion, this PPT design contains high resolution images, graphics, etc, that are easily editable and available for immediate download.
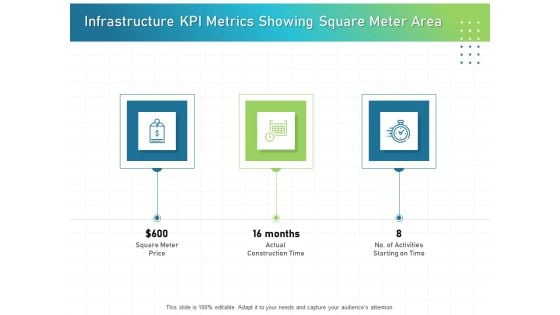
IT Infrastructure Administration Infrastructure KPI Metrics Showing Square Meter Area Guidelines PDF
Presenting it infrastructure administration infrastructure kpi metrics showing square meter area guidelines pdf to provide visual cues and insights. Share and navigate important information on three stages that need your due attention. This template can be used to pitch topics like square meter price, actual construction time, no of activities starting on time. In addtion, this PPT design contains high resolution images, graphics, etc, that are easily editable and available for immediate download.
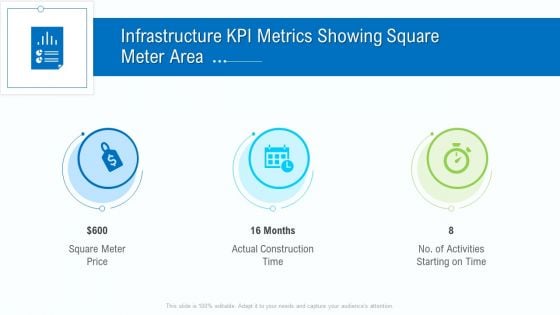
Business Activities Assessment Examples Infrastructure KPI Metrics Showing Square Meter Area Elements PDF
Presenting business activities assessment examples infrastructure kpi metrics showing square meter area elements pdf to provide visual cues and insights. Share and navigate important information on three stages that need your due attention. This template can be used to pitch topics like square meter price, actual construction time, activities starting on time. In addtion, this PPT design contains high resolution images, graphics, etc, that are easily editable and available for immediate download.
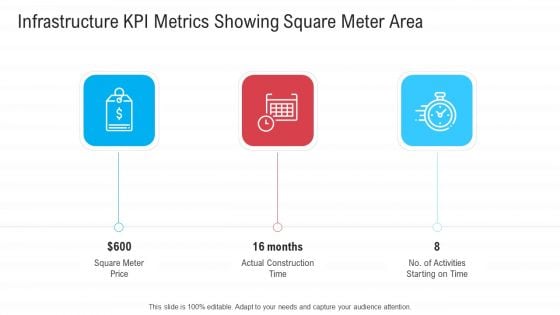
Infrastructure Designing And Administration Infrastructure KPI Metrics Showing Square Meter Area Guidelines PDF
Presenting infrastructure designing and administration infrastructure kpi metrics showing square meter area guidelines pdf to provide visual cues and insights. Share and navigate important information on three stages that need your due attention. This template can be used to pitch topics like square meter price, actual construction time, no of activities starting on time. In addtion, this PPT design contains high resolution images, graphics, etc, that are easily editable and available for immediate download.
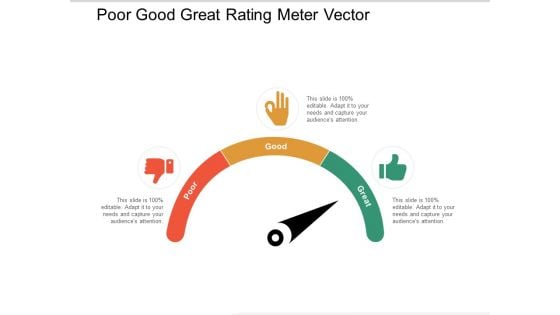
Poor Good Great Rating Meter Vector Ppt PowerPoint Presentation Show Slide Download
Presenting this set of slides with name poor good great rating meter vector ppt powerpoint presentation show slide download. This is a three stage process. The stages in this process are product quality, product improvement, rating scale. This is a completely editable PowerPoint presentation and is available for immediate download. Download now and impress your audience.

Picture Of Old Vintage Meter Ppt PowerPoint Presentation Infographic Template Sample
Presenting this set of slides with name picture of old vintage meter ppt powerpoint presentation infographic template sample. This is a one stage process. The stages in this process are weighing scale, measure, weighing machine. This is a completely editable PowerPoint presentation and is available for immediate download. Download now and impress your audience.
Red Yellow Green Meter With Emoticons For Feedback Ppt PowerPoint Presentation Ideas Template
Presenting this set of slides with name red yellow green meter with emoticons for feedback ppt powerpoint presentation ideas template. This is a three stage process. The stages in this process are product quality, product improvement, rating scale. This is a completely editable PowerPoint presentation and is available for immediate download. Download now and impress your audience.
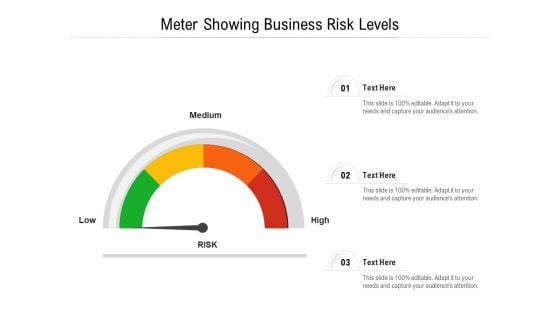
Meter Showing Business Risk Levels Ppt PowerPoint Presentation Show Slide PDF
Persuade your audience using this meter showing business risk levels ppt powerpoint presentation show slide pdf. This PPT design covers three stages, thus making it a great tool to use. It also caters to a variety of topics including low, medium, high. Download this PPT design now to present a convincing pitch that not only emphasizes the topic but also showcases your presentation skills.
Credit Administration Icon Indicating Good Repayment Score Guidelines PDF
Pitch your topic with ease and precision using this Credit Administration Icon Indicating Good Repayment Score Guidelines PDF. This layout presents information on Credit Administration Icon Indicating Good Repayment Score. It is also available for immediate download and adjustment. So, changes can be made in the color, design, graphics or any other component to create a unique layout.
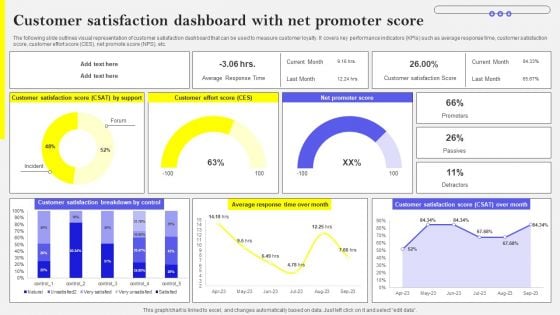
Customer Satisfaction Dashboard With Net Promoter Score Introduction PDF
The following slide outlines visual representation of customer satisfaction dashboard that can be used to measure customer loyalty. It covers key performance indicators KPIs such as average response time, customer satisfaction score, customer effort score CES, net promote score NPS, etc. Do you have to make sure that everyone on your team knows about any specific topic I yes, then you should give Customer Satisfaction Dashboard With Net Promoter Score Introduction PDF a try. Our experts have put a lot of knowledge and effort into creating this impeccable Customer Satisfaction Dashboard With Net Promoter Score Introduction PDF. You can use this template for your upcoming presentations, as the slides are perfect to represent even the tiniest detail. You can download these templates from the Slidegeeks website and these are easy to edit. So grab these today
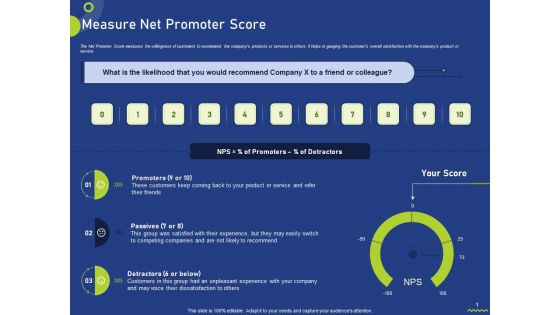
Measure Net Promoter Score Ppt Inspiration Design Ideas PDF
The Net Promoter Score measures the willingness of customers to recommend the companys products or services to others. It helps in gauging the customers overall satisfaction with the companys product or service. Deliver an awe-inspiring pitch with this creative measure net promoter score ppt inspiration design ideas pdf bundle. Topics like promoters, passives, detractors can be discussed with this completely editable template. It is available for immediate download depending on the needs and requirements of the user.
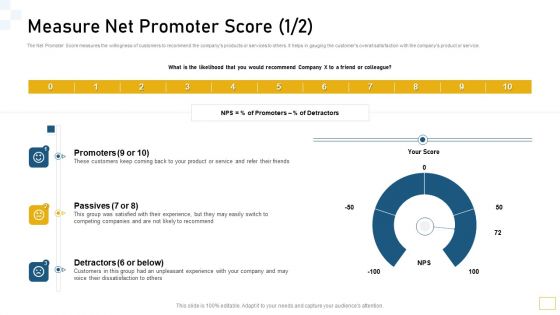
Guidelines Customer Conduct Assessment Measure Net Promoter Score Microsoft PDF
The Net Promoter Score measures the willingness of customers to recommend the companys products or services to others. It helps in gauging the customers overall satisfaction with the companys product or service. Deliver and pitch your topic in the best possible manner with this guidelines customer conduct assessment measure net promoter score microsoft pdf. Use them to share invaluable insights on promoters, detractors, passives and impress your audience. This template can be altered and modified as per your expectations. So, grab it now.

Track Client Health Score Using Key Performance Indicators Summary PDF
This slide illustrates various key performance indicators used to analyze the performance of products and helps in measuring customer health scores. It includes metrics such as customer sentiment, customer engagement, customer ROI and customer feedback. Persuade your audience using this Track Client Health Score Using Key Performance Indicators Summary PDF. This PPT design covers four stages, thus making it a great tool to use. It also caters to a variety of topics including Customer Sentiment, Customer Engagement, Customer ROI. Download this PPT design now to present a convincing pitch that not only emphasizes the topic but also showcases your presentation skills.
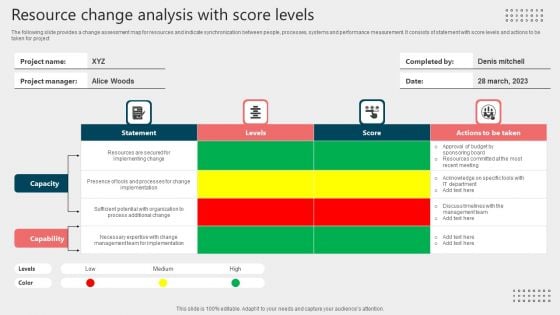
Resource Change Analysis With Score Levels Formats PDF
The following slide provides a change assessment map for resources and indicate synchronization between people, processes, systems and performance measurement. It consists of statement with score levels and actions to be taken for project. Pitch your topic with ease and precision using this Resource Change Analysis With Score Levels Formats PDF. This layout presents information on Capacity, Capability, Project Manager, Resource Change. It is also available for immediate download and adjustment. So, changes can be made in the color, design, graphics or any other component to create a unique layout.
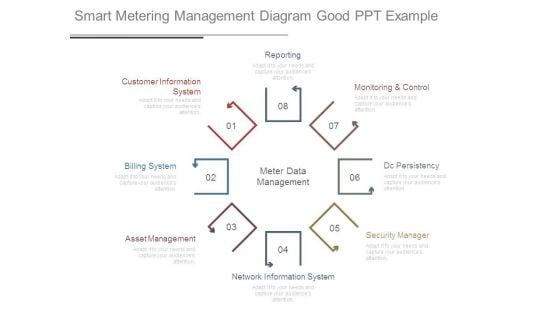
Smart Metering Management Diagram Good Ppt Example
This is a smart metering management diagram good ppt example. This is a eight stage process. The stages in this process are reporting, customer information system, billing system, asset management, network information system, security manager, dc persistency, monitoring and control, meter data management.
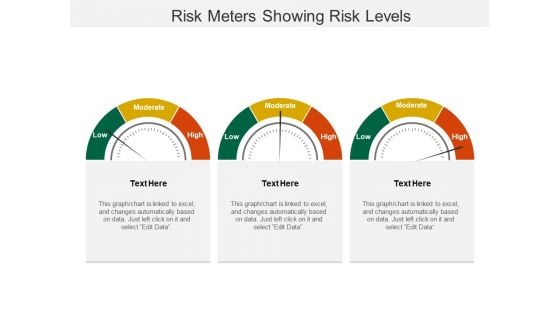
Risk Meters Showing Risk Levels Ppt PowerPoint Presentation Summary Example
This is a risk meters showing risk levels ppt powerpoint presentation summary example. This is a three stage process. The stages in this process are risk meter, risk speedometer, hazard meter.
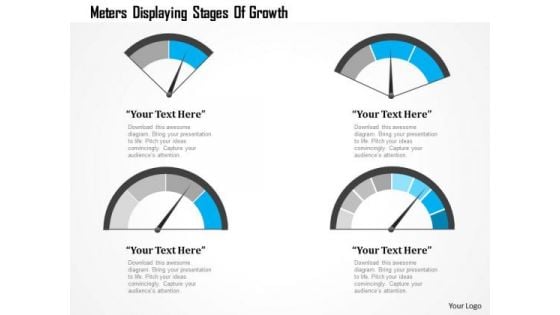
Business Diagram Meters Displaying Stages Of Growth Presentation Template
Graphic of four different meters has been used to craft this power point template. This PPT contains the concept of speed calculation. Use this PPT for your technology and mechanical topics in any presentations.

Business Diagram Three Meters For Speed Control Presentation Template
Graphic of three speedometers has been used to design this power point template. This diagram contains the concept of speed control. Amplify your thoughts via this appropriate business template.
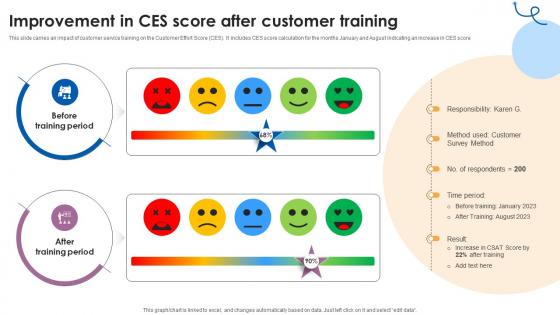
Improvement In CES Score After Customer Training Customer Service Training Ppt Sample
This slide carries an impact of customer service training on the Customer Effort Score CES. It includes CES score calculation for the months January and August indicating an increase in CES score This modern and well-arranged Improvement In CES Score After Customer Training Customer Service Training Ppt Sample provides lots of creative possibilities. It is very simple to customize and edit with the Powerpoint Software. Just drag and drop your pictures into the shapes. All facets of this template can be edited with Powerpoint, no extra software is necessary. Add your own material, put your images in the places assigned for them, adjust the colors, and then you can show your slides to the world, with an animated slide included. This slide carries an impact of customer service training on the Customer Effort Score CES. It includes CES score calculation for the months January and August indicating an increase in CES score
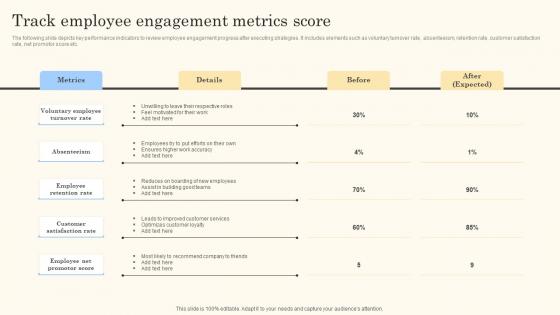
Track Employee Engagement Metrics Score Action Steps For Employee Engagement Slides Pdf
The following slide depicts key performance indicators to review employee engagement progress after executing strategies. It includes elements such as voluntary turnover rate, absenteeism, retention rate, customer satisfaction rate, net promotor score etc.Make sure to capture your audiences attention in your business displays with our gratis customizable Track Employee Engagement Metrics Score Action Steps For Employee Engagement Slides Pdf. These are great for business strategies, office conferences, capital raising or task suggestions. If you desire to acquire more customers for your tech business and ensure they stay satisfied, create your own sales presentation with these plain slides. The following slide depicts key performance indicators to review employee engagement progress after executing strategies. It includes elements such as voluntary turnover rate, absenteeism, retention rate, customer satisfaction rate, net promotor score etc.
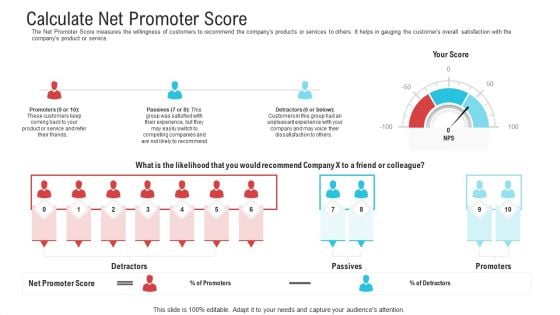
Objective To Improve Customer Experience Calculate Net Promoter Score Slides PDF
The Net Promoter Score measures the willingness of customers to recommend the companys products or services to others. It helps in gauging the customers overall satisfaction with the companys product or service.Deliver an awe-inspiring pitch with this creative objective to improve customer experience calculate net promoter score slides pdf. bundle. Topics like calculate net promoter score can be discussed with this completely editable template. It is available for immediate download depending on the needs and requirements of the user.
Techniques To Increase Customer Satisfaction Calculate Net Promoter Score Diagrams PDF
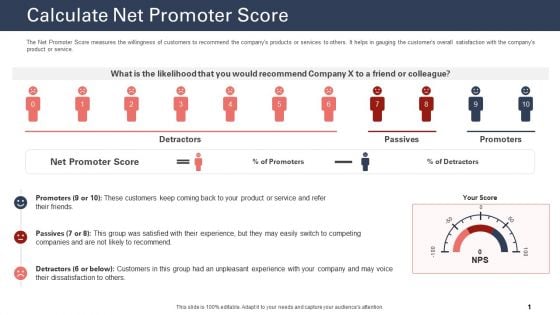
The Net Promoter Score measures the willingness of customers to recommend the companys products or services to others. It helps in gauging the customers overall satisfaction with the companys product or service. Deliver an awe inspiring pitch with this creative techniques to increase customer satisfaction calculate net promoter score diagrams pdf bundle. Topics like calculate net promoter score, product or service, net promoter score can be discussed with this completely editable template. It is available for immediate download depending on the needs and requirements of the user.
Quality Control Issues Dashboard With Element Score And Rule Summary PDF
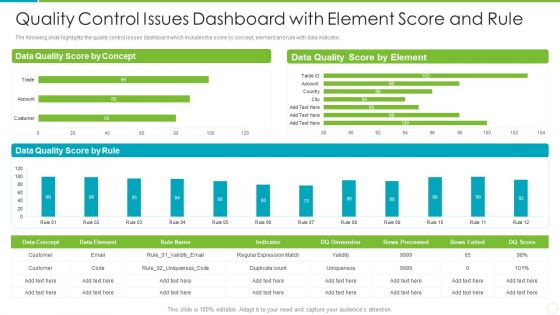
The following slide highlights the quality control issues dashboard which includes the score by concept, element and rule with data indicator. Showcasing this set of slides titled quality control issues dashboard with element score and rule summary pdf. The topics addressed in these templates are quality control issues dashboard with element score and rule. All the content presented in this PPT design is completely editable. Download it and make adjustments in color, background, font etc. as per your unique business setting.
Designing Great Client Experience Action Plan Calculate Net Promoter Score Ppt Gallery Ideas PDF
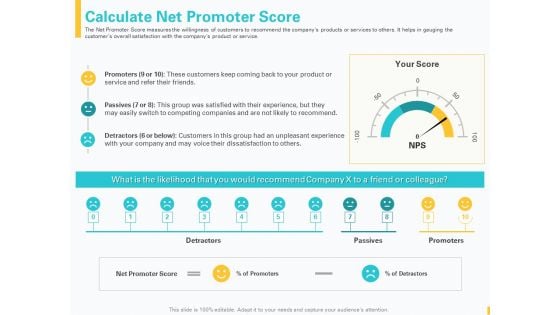
The Net Promoter Score measures the willingness of customers to recommend the companys products or services to others. It helps in gauging the customers overall satisfaction with the companys product or service. This is a designing great client experience action plan calculate net promoter score ppt gallery ideas pdf template with various stages. Focus and dispense information on one stages using this creative set, that comes with editable features. It contains large content boxes to add your information on topics like promoters, passives, detractors, customers, net promoter score. You can also showcase facts, figures, and other relevant content using this PPT layout. Grab it now.
Calculate Net Promoter Score Steps To Improve Customer Engagement For Business Development Icons PDF
The Net Promoter Score measures the willingness of customers to recommend the companys products or services to others. It helps in gauging the customers overall satisfaction with the companys product or service.Deliver an aweinspiring pitch with this creative calculate net promoter score steps to improve customer engagement for business development icons pdf bundle. Topics like detractors, passives, promoters, net promoter score can be discussed with this completely editable template. It is available for immediate download depending on the needs and requirements of the user.
Leader Assessing Project Score Based Key Performance Indicators Ppt PowerPoint Presentation Summary Icons PDF
Persuade your audience using this leader assessing project score based key performance indicators ppt powerpoint presentation summary icons pdf. This PPT design covers three stages, thus making it a great tool to use. It also caters to a variety of topics including leader assessing project score based key performance indicators. Download this PPT design now to present a convincing pitch that not only emphasizes the topic but also showcases your presentation skills.
Customer Effort Score Indicator Icon To Measure Required Actions Ppt File Sample PDF
Persuade your audience using this Customer Effort Score Indicator Icon To Measure Required Actions Ppt File Sample PDF. This PPT design covers four stages, thus making it a great tool to use. It also caters to a variety of topics including Customer, Effort Score Indicator, Icon To Measure, Required Actions. Download this PPT design now to present a convincing pitch that not only emphasizes the topic but also showcases your presentation skills.
Building Customer Experience Strategy For Business Calculate Net Promoter Score Professional PDF
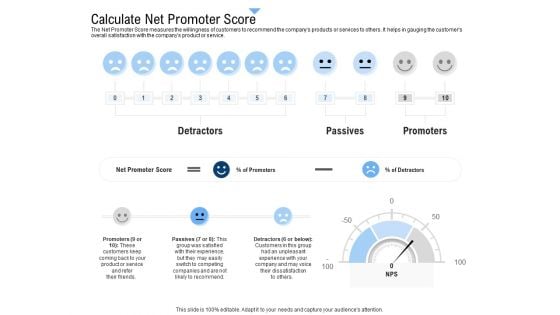
The Net Promoter Score measures the willingness of customers to recommend the companys products or services to others. It helps in gauging the customers overall satisfaction with the companys product or service. Deliver an awe inspiring pitch with this creative building customer experience strategy for business calculate net promoter score professional pdf bundle. Topics like customers, company, product can be discussed with this completely editable template. It is available for immediate download depending on the needs and requirements of the user.
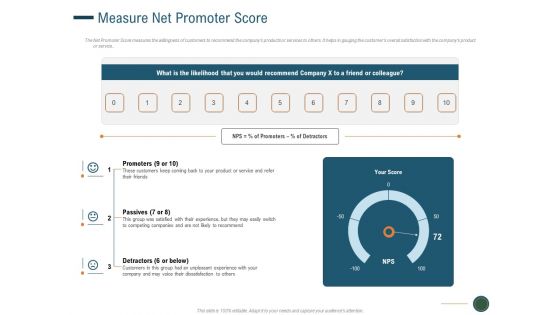
Enhance Profit Client Journey Analysis Measure Net Promoter Score Clipart PDF
The Net Promoter Score measures the willingness of customers to recommend the companys products or services to others. It helps in gauging the customers overall satisfaction with the companys product or service. This is a enhance profit client journey analysis measure net promoter score clipart pdf template with various stages. Focus and dispense information on three stages using this creative set, that comes with editable features. It contains large content boxes to add your information on topics like promoters, passives, detractors. You can also showcase facts, figures, and other relevant content using this PPT layout. Grab it now.
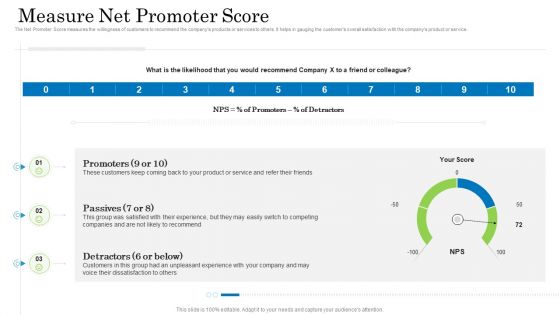
Customer Behavioral Data And Analytics Measure Net Promoter Score Mockup PDF
The Net Promoter Score measures the willingness of customers to recommend the companys products or services to others. It helps in gauging the customers overall satisfaction with the companys product or service. Deliver and pitch your topic in the best possible manner with this customer behavioral data and analytics measure net promoter score mockup pdf. Use them to share invaluable insights on promoters, passives, detractors and impress your audience. This template can be altered and modified as per your expectations. So, grab it now.
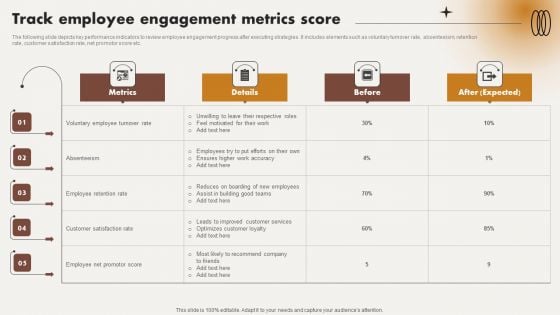
Analyzing And Improving Staff Work Satisfaction Track Employee Engagement Metrics Score Portrait PDF
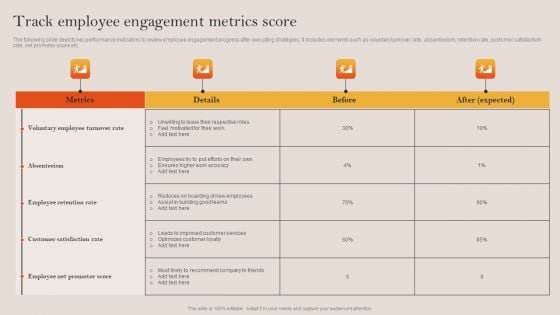
The following slide depicts key performance indicators to review employee engagement progress after executing strategies. It includes elements such as voluntary turnover rate, absenteeism, retention rate, customer satisfaction rate, net promotor score etc. Do you have an important presentation coming up Are you looking for something that will make your presentation stand out from the rest Look no further than Analyzing And Improving Staff Work Satisfaction Track Employee Engagement Metrics Score Portrait PDF. With our professional designs, you can trust that your presentation will pop and make delivering it a smooth process. And with Slidegeeks, you can trust that your presentation will be unique and memorable. So why wait Grab Analyzing And Improving Staff Work Satisfaction Track Employee Engagement Metrics Score Portrait PDF today and make your presentation stand out from the rest.
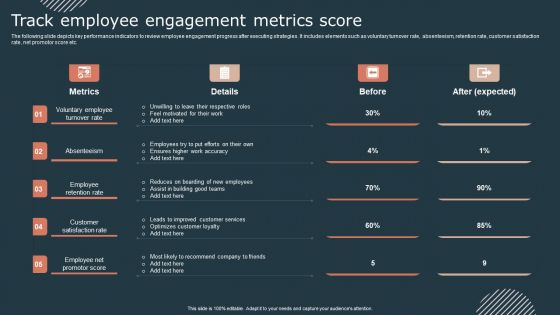
Effective Workforce Participation Action Planning Track Employee Engagement Metrics Score Background PDF
The following slide depicts key performance indicators to review employee engagement progress after executing strategies. It includes elements such as voluntary turnover rate, absenteeism, retention rate, customer satisfaction rate, net promotor score etc. Find highly impressive Effective Workforce Participation Action Planning Track Employee Engagement Metrics Score Background PDF on Slidegeeks to deliver a meaningful presentation. You can save an ample amount of time using these presentation templates. No need to worry to prepare everything from scratch because Slidegeeks experts have already done a huge research and work for you. You need to download Effective Workforce Participation Action Planning Track Employee Engagement Metrics Score Background PDF for your upcoming presentation. All the presentation templates are 100 percent editable and you can change the color and personalize the content accordingly. Download now.
Tactical Employee Engagement Action Planning Track Employee Engagement Metrics Score Themes PDF
The following slide depicts key performance indicators to review employee engagement progress after executing strategies. It includes elements such as voluntary turnover rate, absenteeism, retention rate, customer satisfaction rate, net promotor score etc. If you are looking for a format to display your unique thoughts, then the professionally designed Tactical Employee Engagement Action Planning Track Employee Engagement Metrics Score Themes PDF is the one for you. You can use it as a Google Slides template or a PowerPoint template. Incorporate impressive visuals, symbols, images, and other charts. Modify or reorganize the text boxes as you desire. Experiment with shade schemes and font pairings. Alter, share or cooperate with other people on your work. Download Tactical Employee Engagement Action Planning Track Employee Engagement Metrics Score Themes PDF and find out how to give a successful presentation. Present a perfect display to your team and make your presentation unforgettable.
Advanced Metering Infrastructure Digital Transformation Journey PPT Slide DT SS V
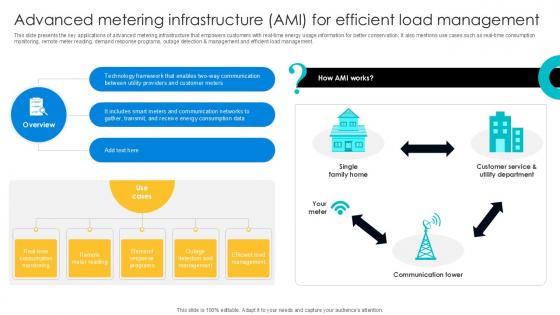
This slide presents the key applications of advanced metering infrastructure that empowers customers with real-time energy usage information for better conservation. It also mentions use cases such as real-time consumption monitoring, remote meter reading, demand response programs, outage detection and management and efficient load management. Boost your pitch with our creative Advanced Metering Infrastructure Digital Transformation Journey PPT Slide DT SS V. Deliver an awe-inspiring pitch that will mesmerize everyone. Using these presentation templates you will surely catch everyones attention. You can browse the ppts collection on our website. We have researchers who are experts at creating the right content for the templates. So you do not have to invest time in any additional work. Just grab the template now and use them. This slide presents the key applications of advanced metering infrastructure that empowers customers with real-time energy usage information for better conservation. It also mentions use cases such as real-time consumption monitoring, remote meter reading, demand response programs, outage detection and management and efficient load management.
Empowering The Future Key Components Of Advanced Metering Infrastructure IoT SS V
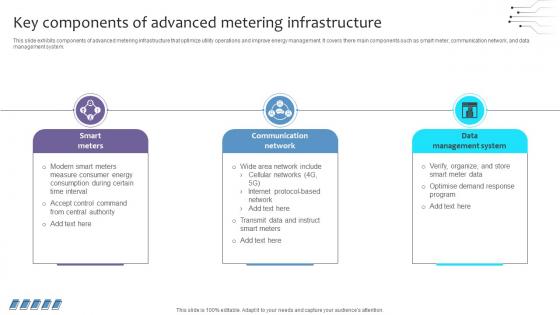
This slide exhibits components of advanced metering infrastructure that optimize utility operations and improve energy management. It covers there main components such as smart meter, communication network, and data management system. Do you have to make sure that everyone on your team knows about any specific topic I yes, then you should give Empowering The Future Key Components Of Advanced Metering Infrastructure IoT SS V a try. Our experts have put a lot of knowledge and effort into creating this impeccable Empowering The Future Key Components Of Advanced Metering Infrastructure IoT SS V. You can use this template for your upcoming presentations, as the slides are perfect to represent even the tiniest detail. You can download these templates from the Slidegeeks website and these are easy to edit. So grab these today This slide exhibits components of advanced metering infrastructure that optimize utility operations and improve energy management. It covers there main components such as smart meter, communication network, and data management system.

Empowering The Future Introduction To Smart Meters Overview And Role IoT SS V
This slide exhibits information about smart meters that enable efficient data collection on energy utilisation. It covers benefits such as real-time monitoring, accurate billing, and remote management. Are you searching for a Empowering The Future Introduction To Smart Meters Overview And Role IoT SS V that is uncluttered, straightforward, and original Its easy to edit, and you can change the colors to suit your personal or business branding. For a presentation that expresses how much effort you have put in, this template is ideal With all of its features, including tables, diagrams, statistics, and lists, its perfect for a business plan presentation. Make your ideas more appealing with these professional slides. Download Empowering The Future Introduction To Smart Meters Overview And Role IoT SS V from Slidegeeks today. This slide exhibits information about smart meters that enable efficient data collection on energy utilisation. It covers benefits such as real-time monitoring, accurate billing, and remote management.

Empowering The Future Challenges And Solutions In Advanced Metering Infrastructure IoT SS V
This slide exhibits AMI system challenges and appropriate solutions to enhance grid reliability. It includes challenges such as communication network challenges, network-based security threats, security standards, etc. Do you have an important presentation coming up Are you looking for something that will make your presentation stand out from the rest Look no further than Empowering The Future Challenges And Solutions In Advanced Metering Infrastructure IoT SS V. With our professional designs, you can trust that your presentation will pop and make delivering it a smooth process. And with Slidegeeks, you can trust that your presentation will be unique and memorable. So why wait Grab Empowering The Future Challenges And Solutions In Advanced Metering Infrastructure IoT SS V today and make your presentation stand out from the rest This slide exhibits AMI system challenges and appropriate solutions to enhance grid reliability. It includes challenges such as communication network challenges, network-based security threats, security standards, etc.
Empowering The Future Introduction To Advanced Metering Infrastructure With Role IoT SS V
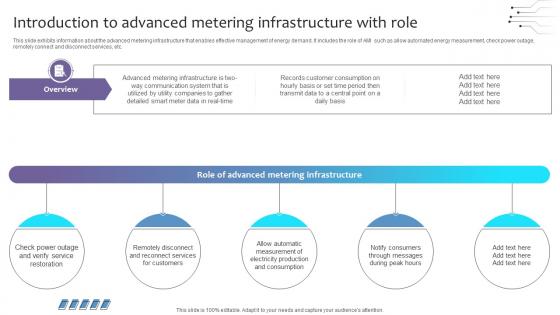
This slide exhibits information about the advanced metering infrastructure that enables effective management of energy demand. It includes the role of AMI such as allow automated energy measurement, check power outage, remotely connect and disconnect services, etc. This Empowering The Future Introduction To Advanced Metering Infrastructure With Role IoT SS V is perfect for any presentation, be it in front of clients or colleagues. It is a versatile and stylish solution for organizing your meetings. The Empowering The Future Introduction To Advanced Metering Infrastructure With Role IoT SS V features a modern design for your presentation meetings. The adjustable and customizable slides provide unlimited possibilities for acing up your presentation. Slidegeeks has done all the homework before launching the product for you. So, do not wait, grab the presentation templates today This slide exhibits information about the advanced metering infrastructure that enables effective management of energy demand. It includes the role of AMI such as allow automated energy measurement, check power outage, remotely connect and disconnect services, etc.
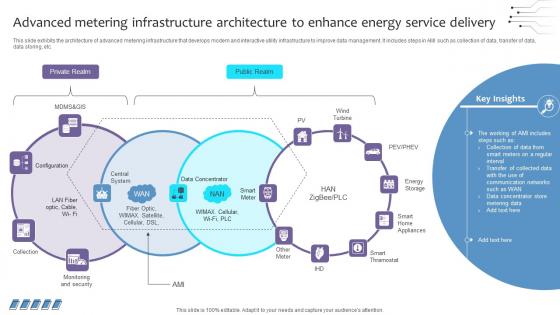
Empowering The Future Advanced Metering Infrastructure Architecture To Enhance IoT SS V
This slide exhibits the architecture of advanced metering infrastructure that develops modern and interactive utility infrastructure to improve data management. It includes steps in AMI such as collection of data, transfer of data, data storing, etc. There are so many reasons you need a Empowering The Future Advanced Metering Infrastructure Architecture To Enhance IoT SS V. The first reason is you can not spend time making everything from scratch, Thus, Slidegeeks has made presentation templates for you too. You can easily download these templates from our website easily. This slide exhibits the architecture of advanced metering infrastructure that develops modern and interactive utility infrastructure to improve data management. It includes steps in AMI such as collection of data, transfer of data, data storing, etc.
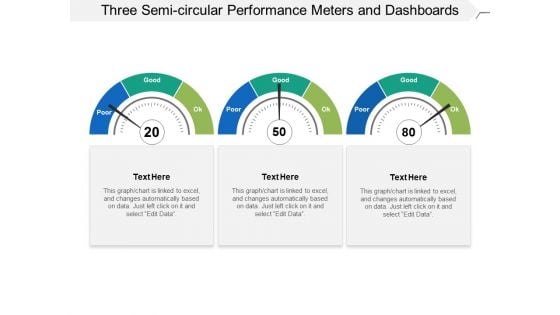
Three Semi Circular Performance Meters And Dashboards Ppt PowerPoint Presentation Slides Influencers
This is a three semi circular performance meters and dashboards ppt powerpoint presentation slides influencers. This is a three stage process. The stages in this process are fuel gauge, gas gauge, fuel containers.

Empowering The Future Key Benefits Of Data Management In Smart Metering IoT SS V
This slide highlights data management in smart metering in order to enhance the overall efficiency of energy transmission and distribution.it covers key aspects such as data collection, data recording, data storing, data transmission, and data display. Want to ace your presentation in front of a live audience Our Empowering The Future Key Benefits Of Data Management In Smart Metering IoT SS V can help you do that by engaging all the users towards you. Slidegeeks experts have put their efforts and expertise into creating these impeccable powerpoint presentations so that you can communicate your ideas clearly. Moreover, all the templates are customizable, and easy-to-edit and downloadable. Use these for both personal and commercial use. This slide highlights data management in smart metering in order to enhance the overall efficiency of energy transmission and distribution.it covers key aspects such as data collection, data recording, data storing, data transmission, and data display.
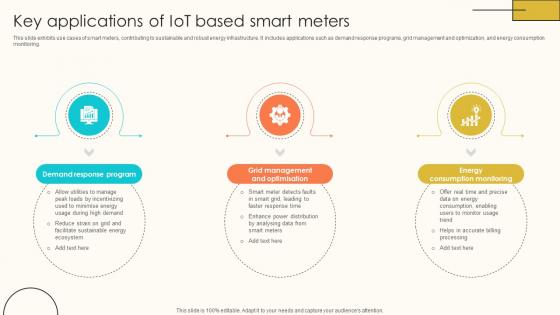
Key Applications Of IoT Based Smart Meters Internet Of Things Solutions To Enhance Energy IoT SS V
This slide exhibits use cases of smart meters, contributing to sustainable and robust energy infrastructure. It includes applications such as demand response programs, grid management and optimization, and energy consumption monitoring. The Key Applications Of IoT Based Smart Meters Internet Of Things Solutions To Enhance Energy IoT SS V is a compilation of the most recent design trends as a series of slides. It is suitable for any subject or industry presentation, containing attractive visuals and photo spots for businesses to clearly express their messages. This template contains a variety of slides for the user to input data, such as structures to contrast two elements, bullet points, and slides for written information. Slidegeeks is prepared to create an impression. This slide exhibits use cases of smart meters, contributing to sustainable and robust energy infrastructure. It includes applications such as demand response programs, grid management and optimization, and energy consumption monitoring.
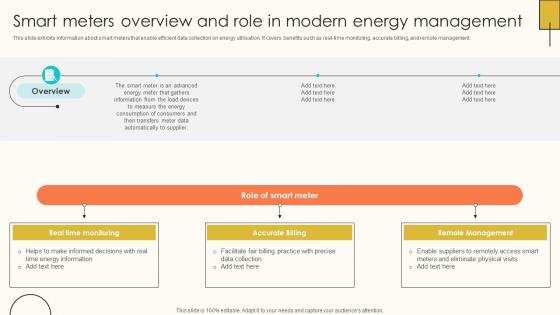
Smart Meters Overview And Role In Modern Internet Of Things Solutions To Enhance Energy IoT SS V
This slide exhibits information about smart meters that enable efficient data collection on energy utilisation. It covers benefits such as real-time monitoring, accurate billing, and remote management. Presenting this PowerPoint presentation, titled Smart Meters Overview And Role In Modern Internet Of Things Solutions To Enhance Energy IoT SS V, with topics curated by our researchers after extensive research. This editable presentation is available for immediate download and provides attractive features when used. Download now and captivate your audience. Presenting this Smart Meters Overview And Role In Modern Internet Of Things Solutions To Enhance Energy IoT SS V. Our researchers have carefully researched and created these slides with all aspects taken into consideration. This is a completely customizable Smart Meters Overview And Role In Modern Internet Of Things Solutions To Enhance Energy IoT SS V that is available for immediate downloading. Download now and make an impact on your audience. Highlight the attractive features available with our PPTs. This slide exhibits information about smart meters that enable efficient data collection on energy utilisation. It covers benefits such as real-time monitoring, accurate billing, and remote management.
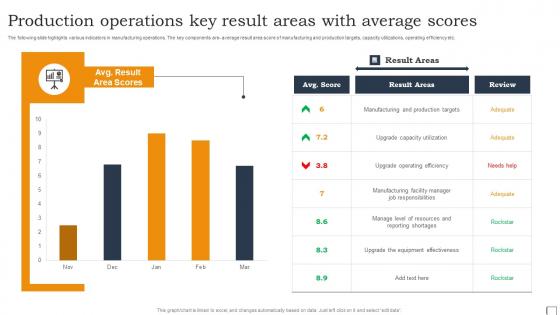
Production Operations Key Result Areas With Average Scores Structure Pdf
The following slide highlights various indicators in manufacturing operations. The key components are- average result area score of manufacturing and production targets, capacity utilizations, operating efficiency etc. Showcasing this set of slides titled Production Operations Key Result Areas With Average Scores Structure Pdf. The topics addressed in these templates are Result Areas. All the content presented in this PPT design is completely editable. Download it and make adjustments in color, background, font etc. as per your unique business setting. The following slide highlights various indicators in manufacturing operations. The key components are- average result area score of manufacturing and production targets, capacity utilizations, operating efficiency etc.
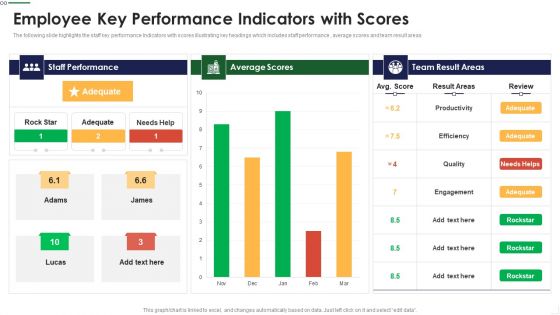
Employee Key Performance Indicators With Scores Themes PDF
The following slide highlights the staff key performance Indicators with scores illustrating key headings which includes staff performance , average scores and team result areas Pitch your topic with ease and precision using this Employee Key Performance Indicators With Scores Themes PDF This layout presents information on Staff Performance, Average Scores, Team Result It is also available for immediate download and adjustment. So, changes can be made in the color, design, graphics or any other component to create a unique layout.
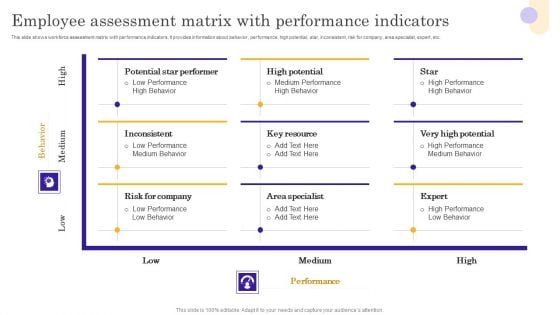
Vendor Performance Assessment Matrix With Scoring Metrics Infographics PDF
This slide shows workforce assessment matrix with performance indicators. It provides information about behavior, performance, high potential, star, inconsistent, risk for company, area specialist, expert, etc. Showcasing this set of slides titled Vendor Performance Assessment Matrix With Scoring Metrics Infographics PDF. The topics addressed in these templates are Potential Star Performer, High Potential, Inconsistent. All the content presented in this PPT design is completely editable. Download it and make adjustments in color, background, font etc. as per your unique business setting.
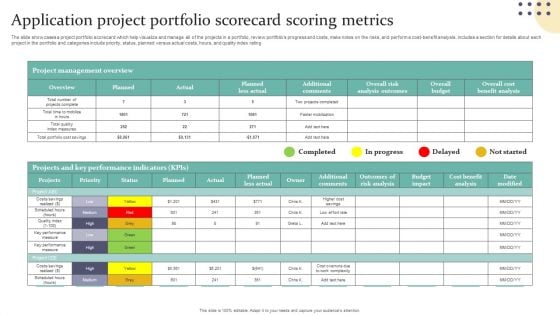
Application Project Portfolio Scorecard Scoring Metrics Information PDF
The slide showcases a project portfolio scorecard which help visualize and manage all of the projects in a portfolio, review portfolios progress and costs, make notes on the risks, and perform a cost-benefit analysis. includes a section for details about each project in the portfolio and categories include priority, status, planned versus actual costs, hours, and quality index rating. Showcasing this set of slides titled Application Project Portfolio Scorecard Scoring Metrics Information PDF. The topics addressed in these templates are Project Management Overview, Projects Key Performance Indicators, Additional Comments. All the content presented in this PPT design is completely editable. Download it and make adjustments in color, background, font etc. as per your unique business setting.
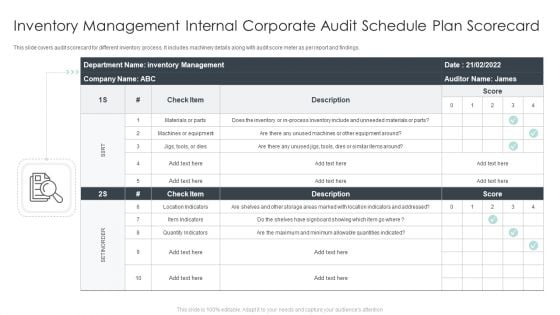
Inventory Management Internal Corporate Audit Schedule Plan Scorecard Topics PDF
This slide covers audit scorecard for different inventory process. It includes machinery details along with audit score meter as per report and findings. Showcasing this set of slides titled Inventory Management Internal Corporate Audit Schedule Plan Scorecard Topics PDF. The topics addressed in these templates are Equipment, Inventory, Materials. All the content presented in this PPT design is completely editable. Download it and make adjustments in color, background, font etc. as per your unique business setting.
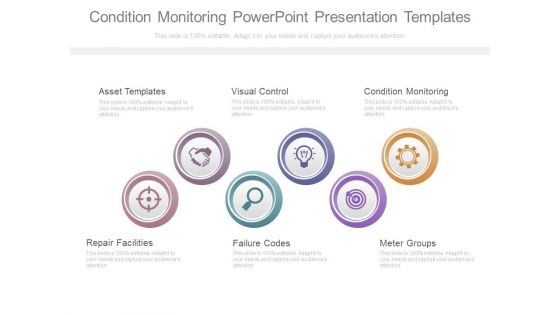
Condition Monitoring Powerpoint Presentation Templates
This is a condition monitoring powerpoint presentation templates. This is a six stage process. The stages in this process are asset templates, visual control, condition monitoring, repair facilities, failure codes, meter groups.
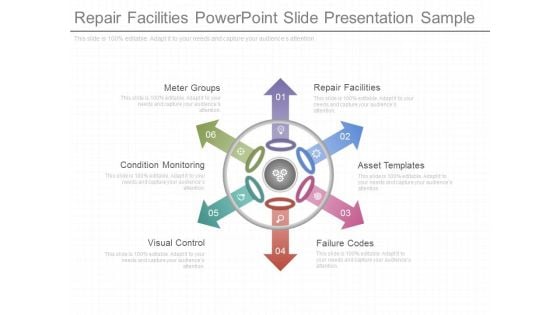
Repair Facilities Powerpoint Slide Presentation Sample
This is a repair facilities powerpoint slide presentation sample. This is a six stage process. The stages in this process are meter groups, condition monitoring, visual control, failure codes, asset templates, repair facilities.
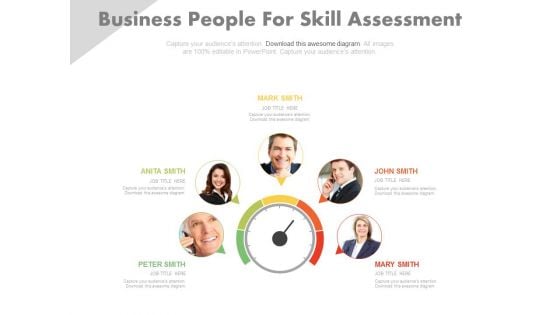
Dashboard For Employee Skill Assessment Powerpoint Slides
This innovative, stunningly beautiful dashboard has been designed for employee skill assessment. It contains graphics of meter with employee pictures. This PowerPoint template helps to display your information in a useful, simple and uncluttered way.
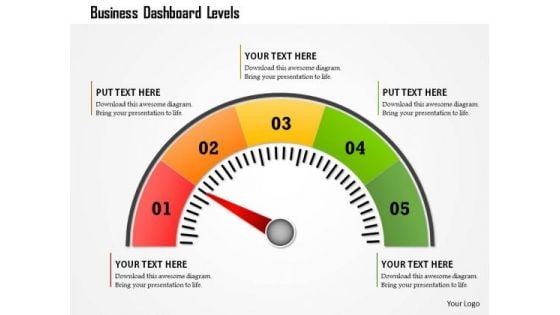
Business Framework Business Dashboard Levels PowerPoint Presentation
This business diagram displays colored meter with multiple levels. Use this diagram to display business process. This diagram can be used to indicate performance measures. This is an excellent diagram to impress your audiences.

Save Electricity Powerpoint Templates Microsoft
This is a save electricity powerpoint templates microsoft. This is a five stage process. The stages in this process are meter measures, save electricity, electricity production and consumption, excess power is exported, office solar photovoltaic array.
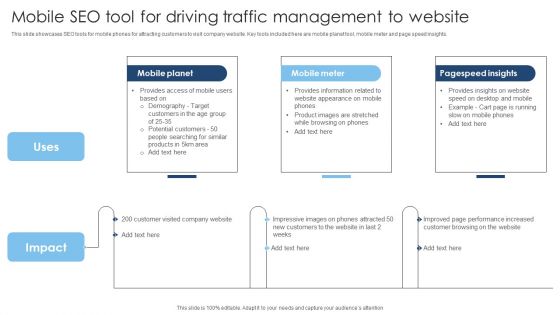
Mobile SEO Tool For Driving Traffic Management To Website Demonstration PDF
This slide showcases SEO tools for mobile phones for attracting customers to visit company website. Key tools included here are mobile planet tool, mobile meter and page speed insights. Presenting Mobile SEO Tool For Driving Traffic Management To Website Demonstration PDF to dispense important information. This template comprises three stages. It also presents valuable insights into the topics including Mobile Planet, Mobile Meter, Pagespeed Insights . This is a completely customizable PowerPoint theme that can be put to use immediately. So, download it and address the topic impactfully.
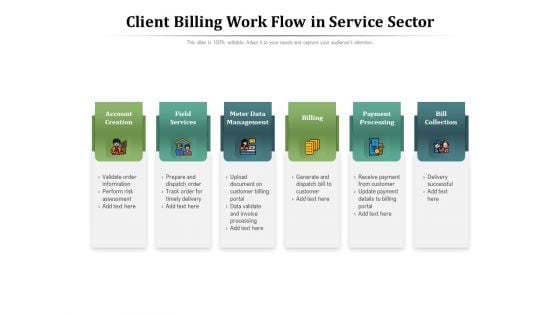
Client Billing Work Flow In Service Sector Ppt PowerPoint Presentation Layouts Slideshow PDF
Presenting this set of slides with name client billing work flow in service sector ppt powerpoint presentation layouts slideshow pdf. This is a six stage process. The stages in this process are account creation, field services, meter data management, billing payment processing, bill collection. This is a completely editable PowerPoint presentation and is available for immediate download. Download now and impress your audience.


 Continue with Email

 Home
Home


