Score Meter
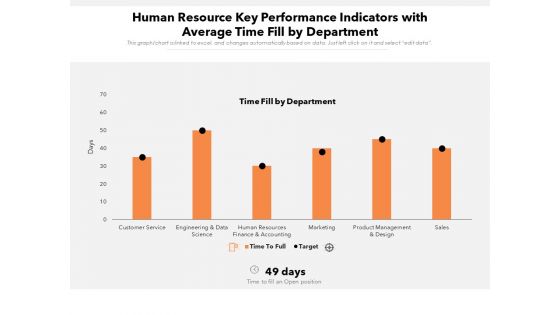
Human Resource Key Performance Indicators With Average Time Fill By Department Ppt PowerPoint Presentation Gallery Example Introduction PDF
Showcasing this set of slides titled human resource key performance indicators with average time fill by department ppt powerpoint presentation gallery example introduction pdf. The topics addressed in these templates are sales, service, finance. All the content presented in this PPT design is completely editable. Download it and make adjustments in color, background, font etc. as per your unique business setting.
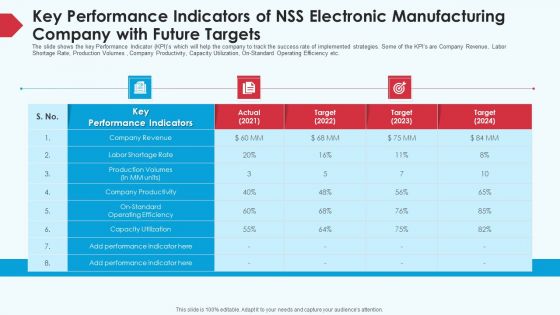
Key Performance Indicators Of NSS Electronic Manufacturing Company With Future Targets Ppt Model Rules PDF
The slide shows the key Performance Indicator KPI s which will help the company to track the success rate of implemented strategies. Some of the KPIs are Company Revenue, Labor Shortage Rate, Production Volumes , Company Productivity, Capacity Utilization, On-Standard Operating Efficiency etc. Deliver an awe inspiring pitch with this creative key performance indicators of NSS electronic manufacturing company with future targets ppt model rules pdf bundle. Topics like company revenue, production volumes, target, key performance indicators, 2021 to 2024 can be discussed with this completely editable template. It is available for immediate download depending on the needs and requirements of the user.
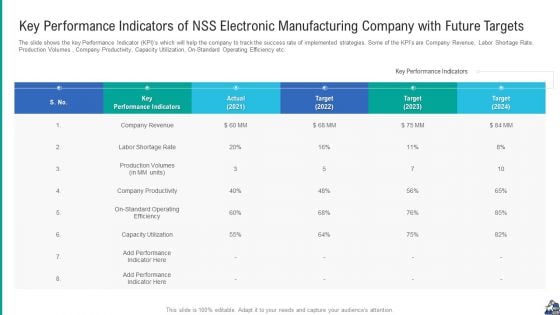
Key Performance Indicators Of NSS Electronic Manufacturing Company With Future Targets Topics PDF
The slide shows the key Performance Indicator KPIs which will help the company to track the success rate of implemented strategies. Some of the KPIs are Company Revenue, Labor Shortage Rate, Production Volumes , Company Productivity, Capacity Utilization, On-Standard Operating Efficiency etc. Deliver an awe inspiring pitch with this creative key performance indicators of nss electronic manufacturing company with future targets topics pdf bundle. Topics like key performance indicators of nss electronic manufacturing company with future targets can be discussed with this completely editable template. It is available for immediate download depending on the needs and requirements of the user.
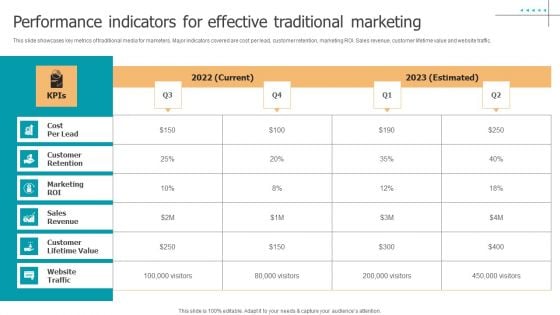
Techniques To Implement Performance Indicators For Effective Traditional Marketing Slides PDF
This slide showcases key metrics of traditional media for marketers. Major indicators covered are cost per lead, customer retention, marketing ROI. Sales revenue, customer lifetime value and website traffic. Are you in need of a template that can accommodate all of your creative concepts This one is crafted professionally and can be altered to fit any style. Use it with Google Slides or PowerPoint. Include striking photographs, symbols, depictions, and other visuals. Fill, move around, or remove text boxes as desired. Test out color palettes and font mixtures. Edit and save your work, or work with colleagues. Download Techniques To Implement Performance Indicators For Effective Traditional Marketing Slides PDF and observe how to make your presentation outstanding. Give an impeccable presentation to your group and make your presentation unforgettable.
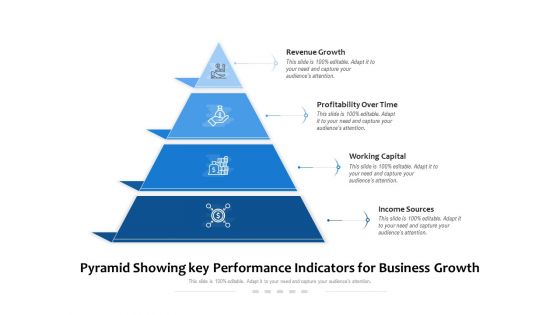
Pyramid Showing Key Performance Indicators For Business Growth Ppt PowerPoint Presentation Layouts Introduction PDF
Persuade your audience using this pyramid showing key performance indicators for business growth ppt powerpoint presentation layouts introduction pdf. This PPT design covers four stages, thus making it a great tool to use. It also caters to a variety of topics including revenue growth, profitability over time, working capital, income sources. Download this PPT design now to present a convincing pitch that not only emphasizes the topic but also showcases your presentation skills.
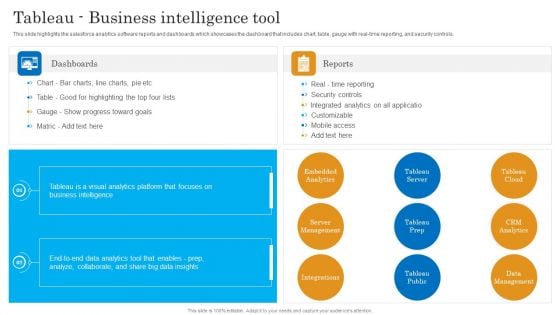
Tableau Business Intelligence Tool Salesforce Business Profile Diagrams PDF
This slide highlights the salesforce analytics software reports and dashboards which showcases the dashboard that includes chart, table, gauge with real-time reporting, and security controls. Deliver an awe inspiring pitch with this creative Tableau Business Intelligence Tool Salesforce Business Profile Diagrams PDF bundle. Topics like Server Management, Embedded Analytics, Security Controls can be discussed with this completely editable template. It is available for immediate download depending on the needs and requirements of the user.
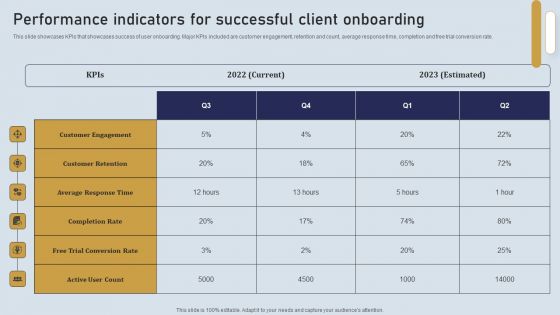
Onboarding Journey For Effective Client Communication Performance Indicators Successful Client Summary PDF
This slide showcases KPIs that showcases success of user onboarding. Major KPIs included are customer engagement, retention and count, average response time, completion and free trial conversion rate. Are you in need of a template that can accommodate all of your creative concepts This one is crafted professionally and can be altered to fit any style. Use it with Google Slides or PowerPoint. Include striking photographs, symbols, depictions, and other visuals. Fill, move around, or remove text boxes as desired. Test out color palettes and font mixtures. Edit and save your work, or work with colleagues. Download Onboarding Journey For Effective Client Communication Performance Indicators Successful Client Summary PDF and observe how to make your presentation outstanding. Give an impeccable presentation to your group and make your presentation unforgettable.
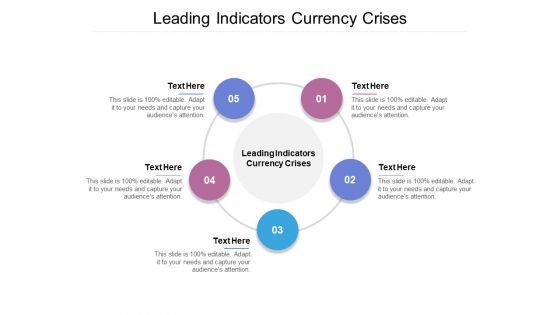
Leading Indicators Currency Crises Ppt PowerPoint Presentation File Background Designs Cpb
Presenting this set of slides with name latest multi level marketing ppt powerpoint presentation layouts display cpb. This is an editable Powerpoint four stages graphic that deals with topics like latest multi level marketing to help convey your message better graphically. This product is a premium product available for immediate download and is 100 percent editable in Powerpoint. Download this now and use it in your presentations to impress your audience.
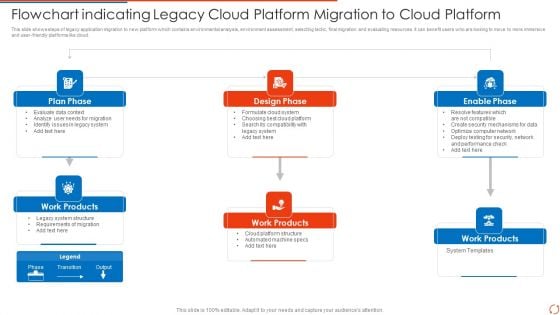
Flowchart Indicating Legacy Cloud Platform Migration To Cloud Platform Sample PDF
This slide shows steps of legacy application migration to new platform which contains environmental analysis, environment assessment, selecting tactic, final migration and evaluating resources. It can benefit users who are looking to move to more immersive and user-friendly platforms like cloud.Presenting Flowchart Indicating Legacy Cloud Platform Migration To Cloud Platform Sample PDF to dispense important information. This template comprises six stages. It also presents valuable insights into the topics including Plan Phase, Design Phase, Work Products. This is a completely customizable PowerPoint theme that can be put to use immediately. So, download it and address the topic impactfully.
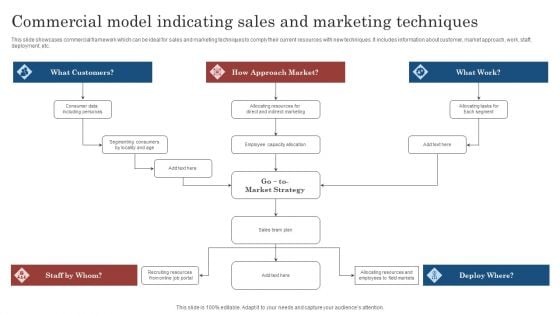
Commercial Model Indicating Sales And Marketing Techniques Ppt File Maker PDF
This slide showcases commercial framework which can be ideal for sales and marketing techniques to comply their current resources with new techniques. It includes information about customer, market approach, work, staff, deployment, etc. Persuade your audience using this Commercial Model Indicating Sales And Marketing Techniques Ppt File Maker PDF. This PPT design covers five stages, thus making it a great tool to use. It also caters to a variety of topics including Customers, Approach Market, Market Strategy . Download this PPT design now to present a convincing pitch that not only emphasizes the topic but also showcases your presentation skills.
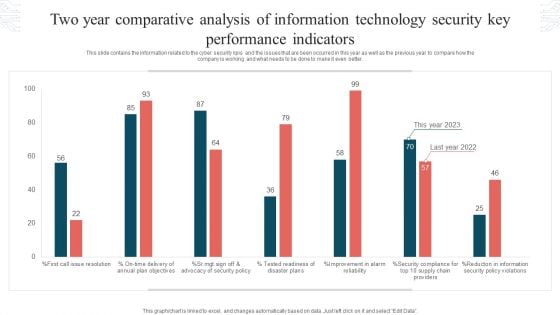
Two Year Comparative Analysis Of Information Technology Security Key Performance Indicators Graphics PDF
This slide contains the information related to the cyber security kpis and the issues that are been occurred in this year as well as the previous year to compare how the company is working and what needs to be done to make it even better. Showcasing this set of slides titled Two Year Comparative Analysis Of Information Technology Security Key Performance Indicators Graphics PDF. The topics addressed in these templates are Tested Readiness, Disaster Plans, Security Policy Violations. All the content presented in this PPT design is completely editable. Download it and make adjustments in color, background, font etc. as per your unique business setting.
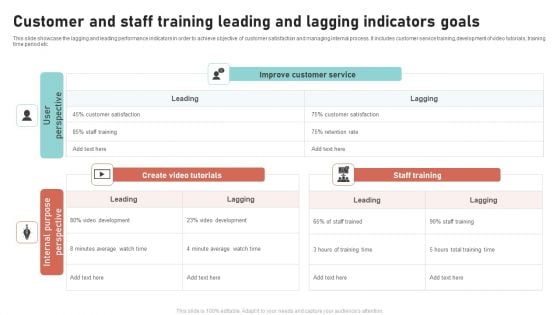
Customer And Staff Training Leading And Lagging Indicators Goals Clipart PDF
This slide showcase the lagging and leading performance indicators in order to achieve objective of customer satisfaction and managing internal process. It includes customer service training,development of video tutorials, training time period etc. Showcasing this set of slides titled Customer And Staff Training Leading And Lagging Indicators Goals Clipart PDF. The topics addressed in these templates are Customer And Staff, Training Leading, Lagging Indicators Goals. All the content presented in this PPT design is completely editable. Download it and make adjustments in color, background, font etc. as per your unique business setting.
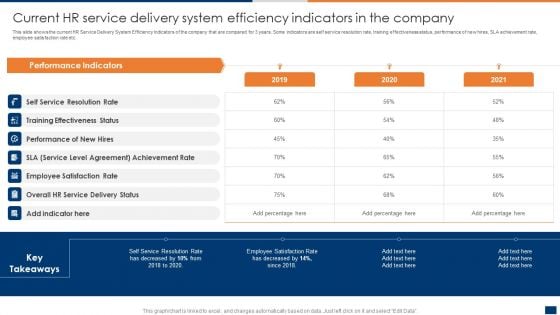
Current HR Service Delivery System Efficiency Indicators In The Company Ppt PowerPoint Presentation File Deck PDF
This slide shows the current HR Service Delivery System Efficiency Indicators of the company that are compared for 3 years. Some indicators are self service resolution rate, training effectiveness status, performance of new hires, SLA achievement rate, employee satisfaction rate etc. If you are looking for a format to display your unique thoughts, then the professionally designed Current HR Service Delivery System Efficiency Indicators In The Company Ppt PowerPoint Presentation File Deck PDF is the one for you. You can use it as a Google Slides template or a PowerPoint template. Incorporate impressive visuals, symbols, images, and other charts. Modify or reorganize the text boxes as you desire. Experiment with shade schemes and font pairings. Alter, share or cooperate with other people on your work. Download Current HR Service Delivery System Efficiency Indicators In The Company Ppt PowerPoint Presentation File Deck PDF and find out how to give a successful presentation. Present a perfect display to your team and make your presentation unforgettable.
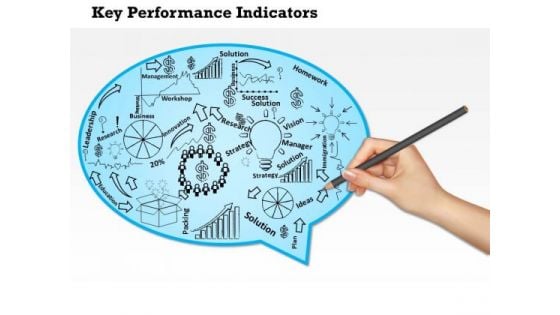
Business Diagram Key Performance Indicators Of A Company PowerPoint Ppt Presentation
Our above diagram provides framework of key performance indicators for a company. This slide contains human hand drawing some objects for terms like innovation strategy, research, solution, management and leadership. Download this diagram to make professional presentations.
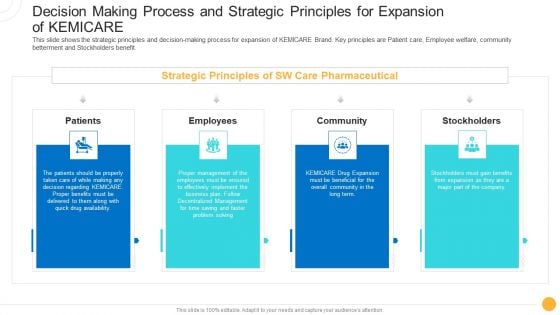
Drug Indicator Extension In A Pharmaceuticals Company Decision Making Process And Strategic Principles For Expansion Of KEMICARE Structure PDF
This slide shows the strategic principles and decision-making process for expansion of KEMICARE Brand. Key principles are Patient care, Employee welfare, community betterment and Stockholders benefit. Presenting drug indicator extension in a pharmaceuticals company decision making process and strategic principles for expansion of kemicare structure pdf to provide visual cues and insights. Share and navigate important information on four stages that need your due attention. This template can be used to pitch topics like patients, employees, community, stockholders. In addtion, this PPT design contains high resolution images, graphics, etc, that are easily editable and available for immediate download.
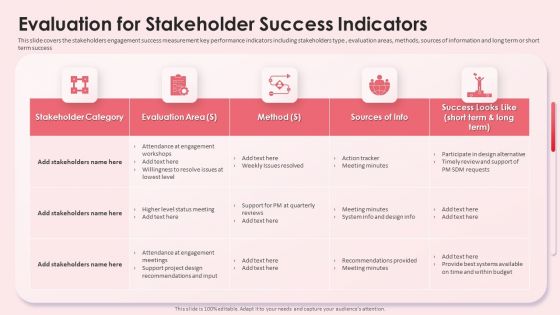
Evaluation For Stakeholder Success Indicators Impact Shareholder Decisions With Stakeholder Administration Clipart PDF
This slide covers the stakeholders engagement success measurement key performance indicators including stakeholders type , evaluation areas, methods, sources of information and long term or short term success. If you are looking for a format to display your unique thoughts, then the professionally designed Evaluation For Stakeholder Success Indicators Impact Shareholder Decisions With Stakeholder Administration Clipart PDF is the one for you. You can use it as a Google Slides template or a PowerPoint template. Incorporate impressive visuals, symbols, images, and other charts. Modify or reorganize the text boxes as you desire. Experiment with shade schemes and font pairings. Alter, share or cooperate with other people on your work. Download Evaluation For Stakeholder Success Indicators Impact Shareholder Decisions With Stakeholder Administration Clipart PDF and find out how to give a successful presentation. Present a perfect display to your team and make your presentation unforgettable.
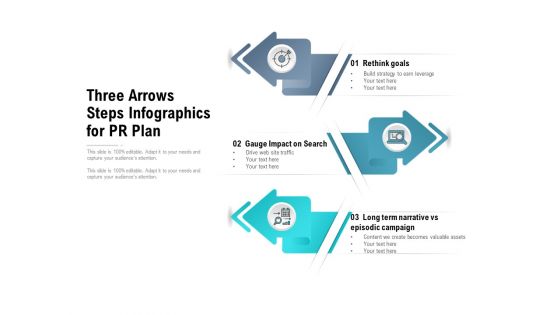
Three Arrows Steps Infographics For PR Plan Ppt PowerPoint Presentation Slides Design Templates
Presenting this set of slides with name three arrows steps infographics for pr plan ppt powerpoint presentation slides design templates. This is a three stage process. The stages in this process are rethink goals, gauge impact on search, long term narrative vs episodic campaign. This is a completely editable PowerPoint presentation and is available for immediate download. Download now and impress your audience.

Reaching Business Goals Performance Indicator Ppt PowerPoint Presentation Pictures Infographic Template
This is a reaching business goals performance indicator ppt powerpoint presentation pictures infographic template. This is a one stage process. The stages in this process are sales objectives, sales goal, achieving sales target.

Key Performance Indicator Analytics Dashboard Ppt PowerPoint Presentation Model Example Topics
This is a key performance indicator analytics dashboard ppt powerpoint presentation model example topics. This is a five stage process. The stages in this process are kpi proposal, kpi plan, kpi scheme.
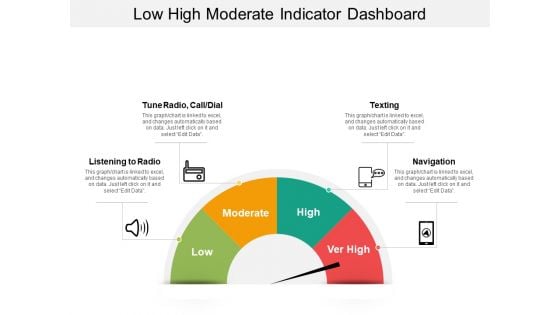
Low High Moderate Indicator Dashboard Ppt Powerpoint Presentation Infographic Template Example 2015
This is a low high moderate indicator dashboard ppt powerpoint presentation infographic template example 2015. This is a four stage process. The stages in this process are disturbance, distraction, interruption, diversion.
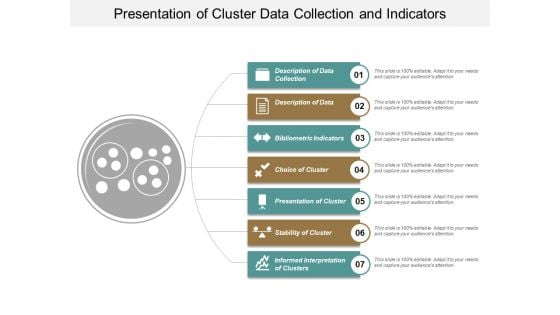
Presentation Of Cluster Data Collection And Indicators Ppt PowerPoint Presentation Model Structure
This is a presentation of cluster data collection and indicators ppt powerpoint presentation model structure. This is a seven stage process. The stages in this process are cluster analysis, cluster examination, cluster investigation.
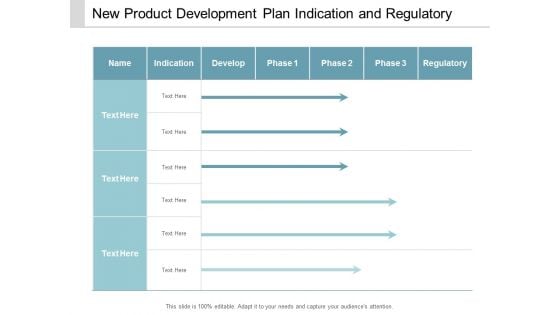
New Product Development Plan Indication And Regulatory Ppt Powerpoint Presentation Ideas Design Ideas
This is a new product development plan indication and regulatory ppt powerpoint presentation ideas design ideas. This is a three stage process. The stages in this process are product development pipeline, product development line, product development channel.
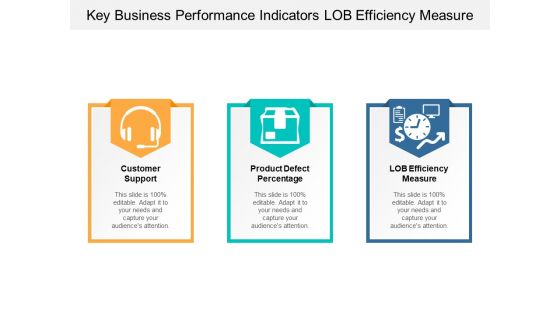
Key Business Performance Indicators Lob Efficiency Measure Ppt Powerpoint Presentation Infographics File Formats
This is a key business performance indicators lob efficiency measure ppt powerpoint presentation infographics file formats. This is a three stage process. The stages in this process are dashboard, kpi, metrics.
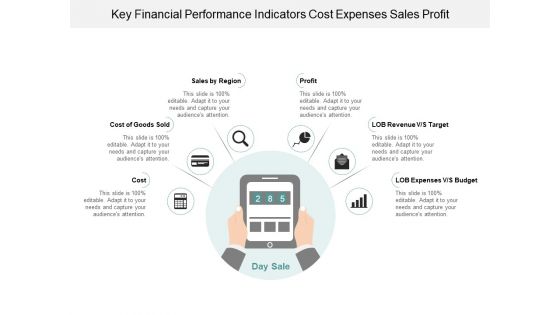
Key Financial Performance Indicators Cost Expenses Sales Profit Ppt Powerpoint Presentation Infographic Template Graphic Images
This is a key financial performance indicators cost expenses sales profit ppt powerpoint presentation infographic template graphic images. This is a six stage process. The stages in this process are dashboard, kpi, metrics.
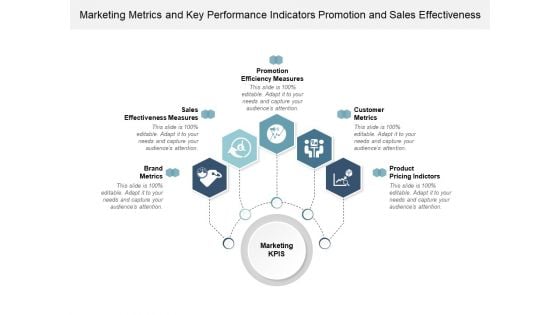
Marketing Metrics And Key Performance Indicators Promotion And Sales Effectiveness Ppt Powerpoint Presentation Infographics Graphics Example
This is a marketing metrics and key performance indicators promotion and sales effectiveness ppt powerpoint presentation infographics graphics example. This is a five stage process. The stages in this process are dashboard, kpi, metrics.
Performance Indicators Of Business Icons Ppt Powerpoint Presentation Infographics Graphics Template
This is a performance indicators of business icons ppt powerpoint presentation infographics graphics template. This is a four stage process. The stages in this process are dashboard, kpi, metrics.
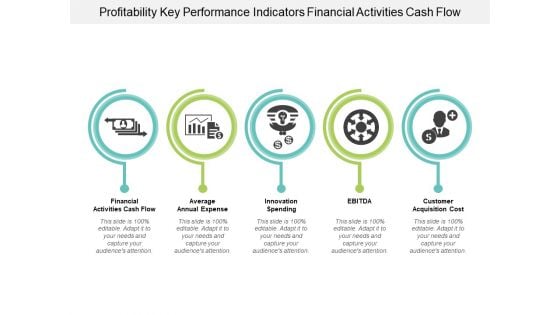
Profitability Key Performance Indicators Financial Activities Cash Flow Ppt Powerpoint Presentation Portfolio Clipart Images
This is a profitability key performance indicators financial activities cash flow ppt powerpoint presentation portfolio clipart images. This is a five stage process. The stages in this process are dashboard, kpi, metrics.
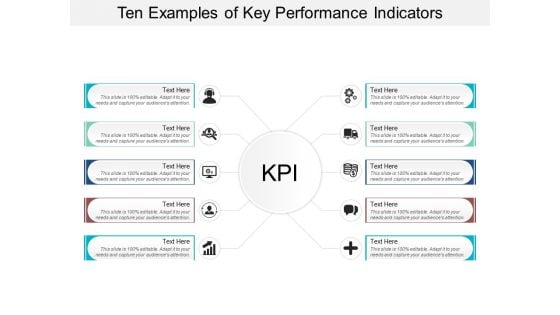
Ten Examples Of Key Performance Indicators Ppt Powerpoint Presentation Layouts Professional
This is a ten examples of key performance indicators ppt powerpoint presentation layouts professional. This is a ten stage process. The stages in this process are dashboard, kpi, metrics.
Data Statistics Charts And Key Performance Indicators Ppt Powerpoint Presentation Layouts Guide
This is a data statistics charts and key performance indicators ppt powerpoint presentation layouts guide. This is a four stage process. The stages in this process are business metrics, business kpi, business dashboard.
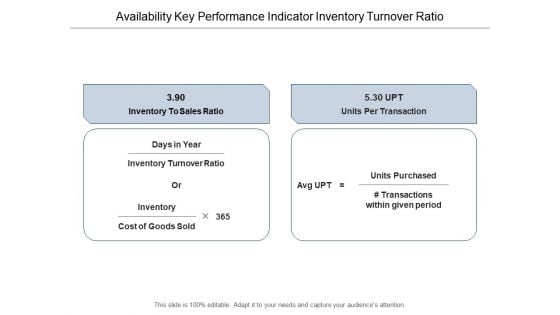
Availability Key Performance Indicator Inventory Turnover Ratio Ppt Powerpoint Presentation Layouts Graphics Download
This is a availability key performance indicator inventory turnover ratio ppt powerpoint presentation layouts graphics download. This is a two stage process. The stages in this process are availability kpi, availability dashboard, availability metrics.
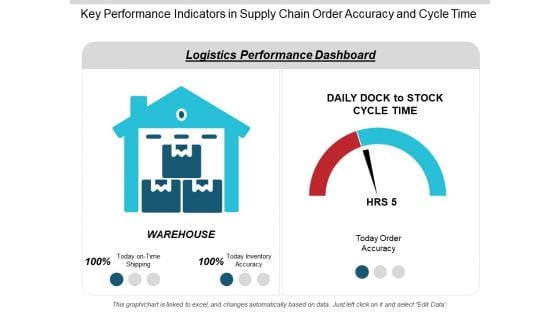
Key Performance Indicators In Supply Chain Order Accuracy And Cycle Time Ppt PowerPoint Presentation Infographics Slideshow
This is a key performance indicators in supply chain order accuracy and cycle time ppt powerpoint presentation infographics slideshow. This is a two stage process. The stages in this process are logistics performance, logistics dashboard, logistics kpis.
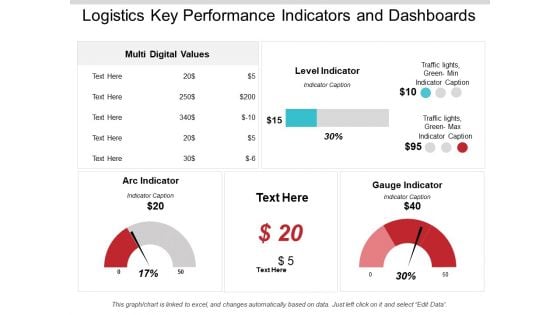
Logistics Key Performance Indicators And Dashboards Ppt PowerPoint Presentation Infographics Background Image
This is a logistics key performance indicators and dashboards ppt powerpoint presentation infographics background image. This is a three stage process. The stages in this process are logistics performance, logistics dashboard, logistics kpis.
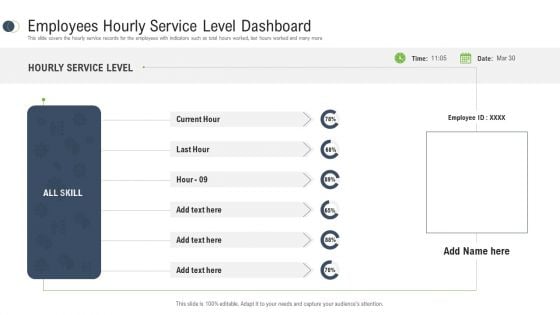
Consumer Complaint Procedure Employees Hourly Service Level Dashboard Ppt Infographics Professional PDF
This slide covers the hourly service records for the employees with indicators such as total hours worked, last hours worked and many more. Deliver and pitch your topic in the best possible manner with this consumer complaint procedure employees hourly service level dashboard ppt infographics professional pdf. Use them to share invaluable insights on employees hourly service level dashboard, hourly service level, skill and impress your audience. This template can be altered and modified as per your expectations. So, grab it now.
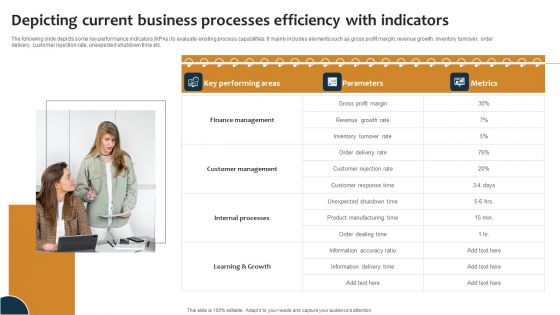
Improving Business Procedures Enterprise Resource Planning System Depicting Current Business Processe Professional PDF
The following slide depicts some key performance indicators KPAs to evaluate existing process capabilities. It mainly includes elements such as gross profit margin, revenue growth, inventory turnover, order delivery, customer rejection rate, unexpected shutdown time etc. Whether you have daily or monthly meetings, a brilliant presentation is necessary. Improving Business Procedures Enterprise Resource Planning System Depicting Current Business Processe Professional PDF can be your best option for delivering a presentation. Represent everything in detail using Improving Business Procedures Enterprise Resource Planning System Depicting Current Business Processe Professional PDF and make yourself stand out in meetings. The template is versatile and follows a structure that will cater to your requirements. All the templates prepared by Slidegeeks are easy to download and edit. Our research experts have taken care of the corporate themes as well. So, give it a try and see the results.
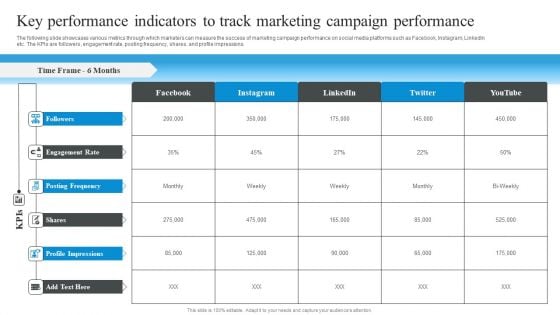
Market Evaluation Of IT Industry Key Performance Indicators To Track Marketing Campaign Performance Slides PDF
The following slide showcases various metrics through which marketers can measure the success of marketing campaign performance on social media platforms such as Facebook, Instagram, LinkedIn etc. The KPIs are followers, engagement rate, posting frequency, shares, and profile impressions. If you are looking for a format to display your unique thoughts, then the professionally designed Market Evaluation Of IT Industry Key Performance Indicators To Track Marketing Campaign Performance Slides PDF is the one for you. You can use it as a Google Slides template or a PowerPoint template. Incorporate impressive visuals, symbols, images, and other charts. Modify or reorganize the text boxes as you desire. Experiment with shade schemes and font pairings. Alter, share or cooperate with other people on your work. Download Market Evaluation Of IT Industry Key Performance Indicators To Track Marketing Campaign Performance Slides PDF and find out how to give a successful presentation. Present a perfect display to your team and make your presentation unforgettable.

Key Performance Indicators To Track Effectiveness Of Traditional Marketing Strategies Demonstration PDF
The following slide outlines different metrics through which marketing team can evaluate success of offline marketing techniques. The key metrics outlined in slide are reach, new visitors, patient satisfaction rate, revenue, and partnerships. Find highly impressive Key Performance Indicators To Track Effectiveness Of Traditional Marketing Strategies Demonstration PDF on Slidegeeks to deliver a meaningful presentation. You can save an ample amount of time using these presentation templates. No need to worry to prepare everything from scratch because Slidegeeks experts have already done a huge research and work for you. You need to download Key Performance Indicators To Track Effectiveness Of Traditional Marketing Strategies Demonstration PDF for your upcoming presentation. All the presentation templates are 100 percent editable and you can change the color and personalize the content accordingly. Download now
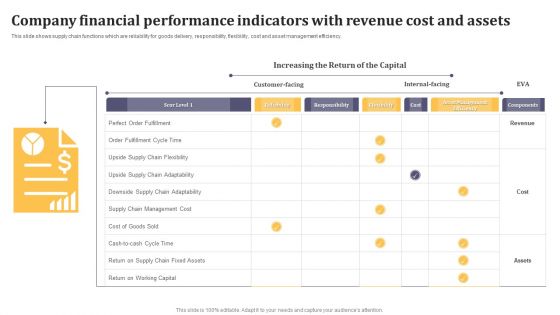
Company Financial Performance Indicators With Revenue Cost And Assets Background PDF
This slide shows supply chain functions which are reliability for goods delivery, responsibility, flexibility, cost and asset management efficiency. Showcasing this set of slides titled Company Financial Performance Indicators With Revenue Cost And Assets Background PDF. The topics addressed in these templates are Perfect Order Fulfillment, Cycle Time, Supply Chain, Management Cost. All the content presented in this PPT design is completely editable. Download it and make adjustments in color, background, font etc. as per your unique business setting.
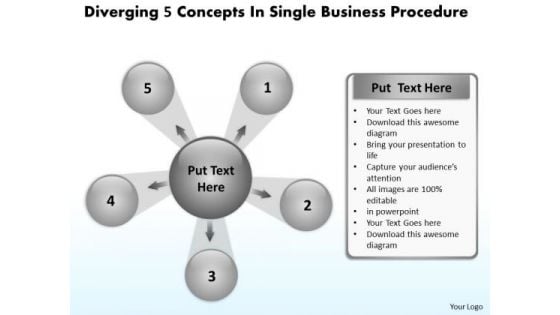
World Business PowerPoint Templates Procedure Cycle Layout Diagram
We present our world business powerpoint templates procedure Cycle Layout Diagram.Download and present our Leadership PowerPoint Templates because you know Coincidentally it will always point to the top. Use our Arrows PowerPoint Templates because this slide can help to bullet point your views. Present our Process and Flows PowerPoint Templates because they are the indicators of the path you have in mind. Download and present our Business PowerPoint Templates because the fruits of your labour are beginning to show.Enlighten them on the great plans you have for their enjoyment. Present our Circle Charts PowerPoint Templates because knowledge is power goes the popular saying.Use these PowerPoint slides for presentations relating to Arrows, Business, Chart, Circle, Company, Concept, Continuity, Continuous, Cycle, Dependency, Diagram, Direction, Dynamic, Endless, Feeds, Graph, Iteration, Iterative, Method, Path, Phase, Presentation, Process, Production, Progress, Progression, Report, Rotation, Sequence, Succession, Vector. The prominent colors used in the PowerPoint template are White, Gray, Black. Customers tell us our world business powerpoint templates procedure Cycle Layout Diagram will get their audience's attention. PowerPoint presentation experts tell us our Cycle PowerPoint templates and PPT Slides are Efficacious. We assure you our world business powerpoint templates procedure Cycle Layout Diagram are Spectacular. Customers tell us our Cycle PowerPoint templates and PPT Slides are Stylish. We assure you our world business powerpoint templates procedure Cycle Layout Diagram are Fantastic. People tell us our Chart PowerPoint templates and PPT Slides provide great value for your money. Be assured of finding the best projection to highlight your words. Let your thoughts exert some pressure. Our World Business PowerPoint Templates Procedure Cycle Layout Diagram will do the deed.
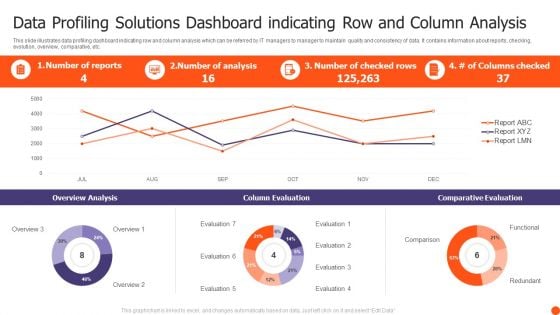
Data Profiling Solutions Dashboard Indicating Row And Column Analysis Summary PDF
This slide illustrates data profiling dashboard indicating row and column analysis which can be referred by IT managers to manager to maintain quality and consistency of data. It contains information about reports, checking, evolution, overview, comparative, etc. Showcasing this set of slides titled Data Profiling Solutions Dashboard Indicating Row And Column Analysis Summary PDF. The topics addressed in these templates are Overview Analysis, Column Evaluation, Comparative Evaluation. All the content presented in this PPT design is completely editable. Download it and make adjustments in color, background, font etc. as per your unique business setting.
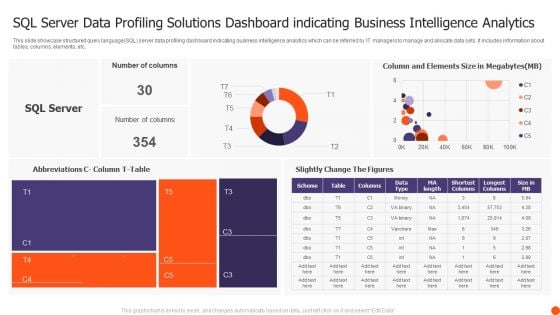
SQL Server Data Profiling Solutions Dashboard Indicating Business Intelligence Analytics Structure PDF
This slide showcase structured query language SQL server data profiling dashboard indicating business intelligence analytics which can be referred by IT managers to manage and allocate data sets. It includes information about tables, columns, elements, etc. Showcasing this set of slides titled SQL Server Data Profiling Solutions Dashboard Indicating Business Intelligence Analytics Structure PDF. The topics addressed in these templates are Number Columns, Slightly Change Figures, SQL Server. All the content presented in this PPT design is completely editable. Download it and make adjustments in color, background, font etc. as per your unique business setting.

Benchmarking Procedure Model To Improve Product Quality Structure PDF
This slide shows the benchmarking process model which focuses on areas, theme, measures and indicators that further includes leadership and direction, resources and procedures, product delivery, measurement and outcomes, etc.Showcasing this set of slides titled Benchmarking Procedure Model To Improve Product Quality Structure PDF The topics addressed in these templates are Financial Resources, Resources Procedures, Product Delivery All the content presented in this PPT design is completely editable. Download it and make adjustments in color, background, font etc. as per your unique business setting.
Steps Of Organization Scenario Planning Procedure Ppt Icon Visuals PDF
This slide represents the process to identify and understand the business requirements and derive business requirements which are to be addressed by the IT department. It includes steps of business scenario planning process such as identify key issues, brainstorm business factors etc. Persuade your audience using this Steps Of Organization Scenario Planning Procedure Ppt Icon Visuals PDF. This PPT design covers eight stages, thus making it a great tool to use. It also caters to a variety of topics including Brainstorm Business Factors, Outline External Factors, Describe Early Indicators. Download this PPT design now to present a convincing pitch that not only emphasizes the topic but also showcases your presentation skills.
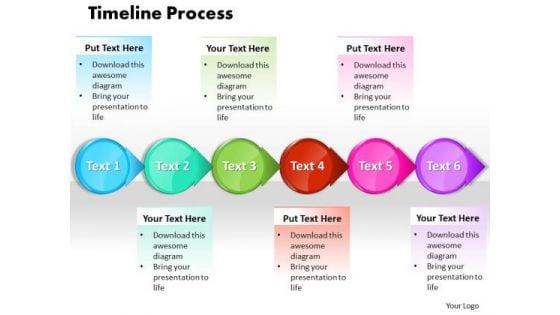
Ppt Steps Working With Slide Numbers A Process Timeline PowerPoint Templates
PPT steps working with slide numbers a process timeline PowerPoint Templates-This Business PowerPoint Diagram shows 3d linear abstraction to prevent Business losses. It uses six steps. It indicates employment, field, function, game, line, and livelihood. It is helpful to organize information. This PowerPoint slides are professionally animated. -PPT steps working with slide numbers a process timeline PowerPoint Templates-3d, Advertisement, Advertising, Arrow, Border, Business, Circles, Collection, Customer, Design, Element, Icon, Idea, Illustration, Info, Information, Isolated, Label, Light, Location, Needle, New, Notification, Notify, Point, Pointer, Promotion, Role, Rounded Venture into the unknown with our Ppt Steps Working With Slide Numbers A Process Timeline PowerPoint Templates. Your thoughts will move ahead sure-footedly.
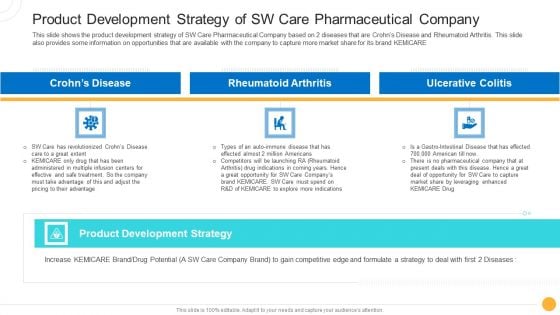
Drug Indicator Extension In A Pharmaceuticals Company Product Development Strategy Of SW Care Pharmaceutical Company Guidelines PDF
This slide shows the product development strategy of SW Care Pharmaceutical Company based on 2 diseases that are Crohns Disease and Rheumatoid Arthritis. This slide also provides some information on opportunities that are available with the company to capture more market share for its brand KEMICARE. Presenting drug indicator extension in a pharmaceuticals company product development strategy of sw care pharmaceutical company guidelines pdf to provide visual cues and insights. Share and navigate important information on three stages that need your due attention. This template can be used to pitch topics like crohns disease, rheumatoid arthritis, ulcerative colitis, product development strategy. In addtion, this PPT design contains high resolution images, graphics, etc, that are easily editable and available for immediate download.
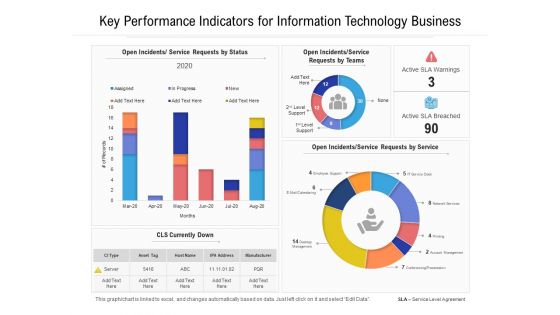
Key Performance Indicators For Information Technology Business Ppt PowerPoint Presentation File Graphics Example PDF
Presenting this set of slides with name key performance indicators for information technology business ppt powerpoint presentation file graphics example pdf. The topics discussed in these slides are service, manufacturer, management. This is a completely editable PowerPoint presentation and is available for immediate download. Download now and impress your audience.
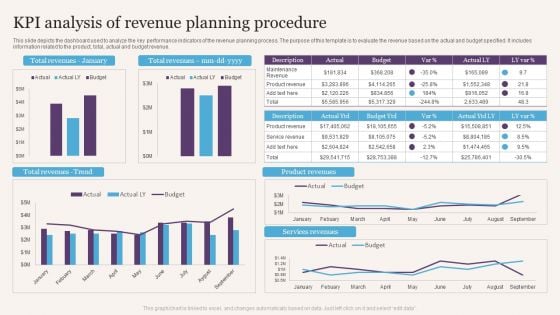
KPI Analysis Of Revenue Planning Procedure Professional PDF
This slide depicts the dashboard used to analyze the key performance indicators of the revenue planning process. The purpose of this template is to evaluate the revenue based on the actual and budget specified. It includes information related to the product, total, actual and budget revenue. Showcasing this set of slides titled KPI Analysis Of Revenue Planning Procedure Professional PDF. The topics addressed in these templates are Kpi Analysis, Revenue Planning Procedure. All the content presented in this PPT design is completely editable. Download it and make adjustments in color, background, font etc. as per your unique business setting.
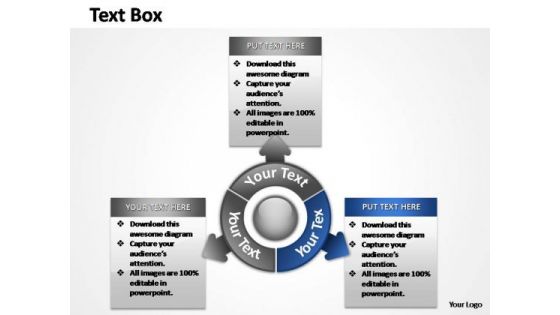
PowerPoint Theme Process Steps Ppt Presentation
Arrows Indicates the way to growth. Use this diagram for improved controls to drive your business towards the right direction Baseless fears can be a bane. Allay them with our PowerPoint Theme Process Steps Ppt Presentation.
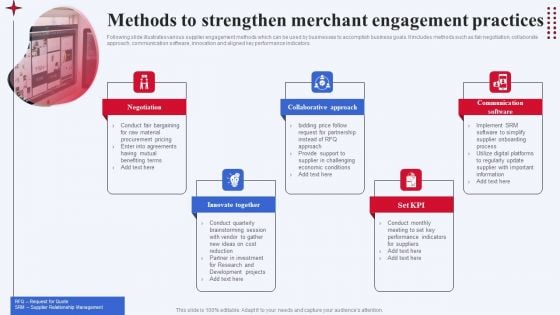
Methods To Strengthen Merchant Engagement Practices Topics PDF
Following slide illustrates various supplier engagement methods which can be used by businesses to accomplish business goals. It includes methods such as fair negotiation, collaborate approach, communication software, innovation and aligned key performance indicators. Persuade your audience using this Methods To Strengthen Merchant Engagement Practices Topics PDF. This PPT design covers five stages, thus making it a great tool to use. It also caters to a variety of topics including Negotiation, Innovate Together, Collaborative Approach. Download this PPT design now to present a convincing pitch that not only emphasizes the topic but also showcases your presentation skills.
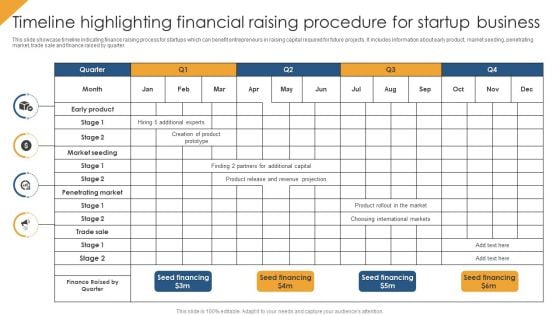
Timeline Highlighting Financial Raising Procedure For Startup Business Introduction PDF
This slide showcase timeline indicating finance raising process for startups which can benefit entrepreneurs in raising capital required for future projects. It includes information about early product, market seeding, penetrating market, trade sale and finance raised by quarter. Pitch your topic with ease and precision using this Timeline Highlighting Financial Raising Procedure For Startup Business Introduction PDF. This layout presents information on Market Seeding, Seed Financing, Penetrating Market. It is also available for immediate download and adjustment. So, changes can be made in the color, design, graphics or any other component to create a unique layout.
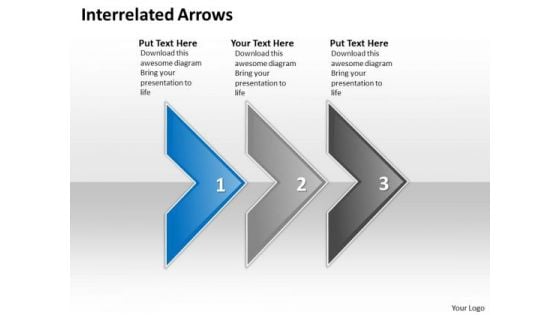
Ppt Interrelated Arrows Three Practice The PowerPoint Macro Steps Business Templates
PPT interrelated arrows three practice the powerpoint macro steps Business Templates-Use this graphical approach to represent global business issues such as financial data, stock market Exchange, increase in sales, corporate presentations and more. This image has been conceived to enable you to emphatically communicate your ideas in your Business, Marketing PPT presentation.-PPT interrelated arrows three practice the powerpoint macro steps Business Templates-Aim, Arrow, Arrowheads, Badge, Border, Click, Connection, Curve, Design, Direction, Download, Element, Fuchsia, Icon, Illustration, Indicator, Internet, Magenta, Mark, Object, Orientation, Pointer, Shadow, Shape, Sign Achieve high-performance with our Ppt Interrelated Arrows Three Practice The PowerPoint Macro Steps Business Templates. They will make you look good.
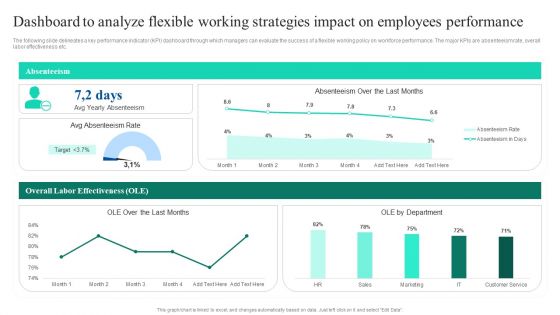
Adopting Flexible Work Policy Dashboard To Analyze Flexible Working Strategies Impact Template PDF
The following slide delineates a key performance indicator KPI dashboard through which managers can evaluate the success of a flexible working policy on workforce performance. The major KPIs are absenteeism rate, overall labor effectiveness etc. Do you have to make sure that everyone on your team knows about any specific topic I yes, then you should give Adopting Flexible Work Policy Dashboard To Analyze Flexible Working Strategies Impact Template PDF a try. Our experts have put a lot of knowledge and effort into creating this impeccable Adopting Flexible Work Policy Dashboard To Analyze Flexible Working Strategies Impact Template PDF. You can use this template for your upcoming presentations, as the slides are perfect to represent even the tiniest detail. You can download these templates from the Slidegeeks website and these are easy to edit. So grab these today.
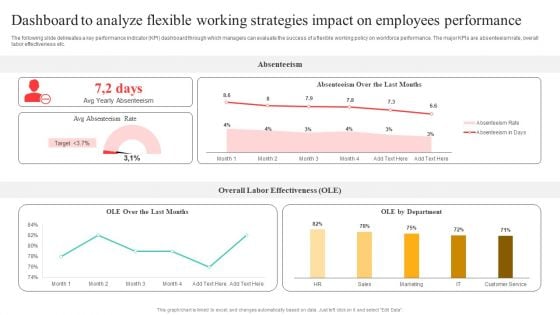
Flexible Working Policies And Guidelines Dashboard To Analyze Flexible Working Strategies Information PDF
The following slide delineates a key performance indicator KPI dashboard through which managers can evaluate the success of a flexible working policy on workforce performance. The major KPIs are absenteeism rate, overall labor effectiveness etc. Create an editable Flexible Working Policies And Guidelines Dashboard To Analyze Flexible Working Strategies Information PDF that communicates your idea and engages your audience. Whether youre presenting a business or an educational presentation, pre designed presentation templates help save time. Flexible Working Policies And Guidelines Dashboard To Analyze Flexible Working Strategies Information PDF is highly customizable and very easy to edit, covering many different styles from creative to business presentations. Slidegeeks has creative team members who have crafted amazing templates. So, go and get them without any delay.
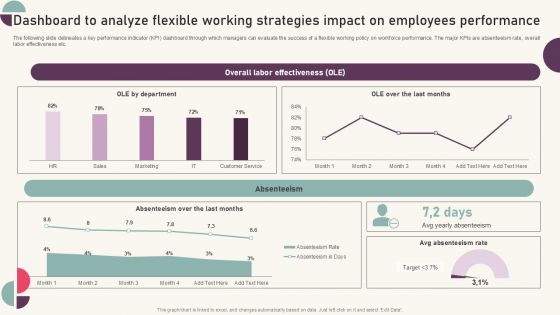
Tactics For Establishing Sustainable Hybrid Work Environment Dashboard To Analyze Flexible Working Strategies Topics PDF
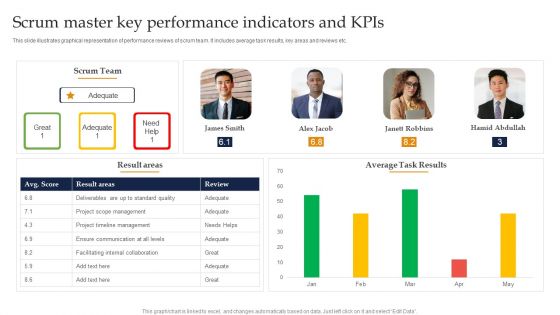
Scrum Master Key Performance Indicators And Kpis Ppt Gallery Files PDF
This slide illustrates graphical representation of performance reviews of scrum team. It includes average task results, key areas and reviews etc. Showcasing this set of slides titled Scrum Master Key Performance Indicators And Kpis Ppt Gallery Files PDF. The topics addressed in these templates are Scrum Team, Average Task Results, Project Timeline Management. All the content presented in this PPT design is completely editable. Download it and make adjustments in color, background, font etc. as per your unique business setting.
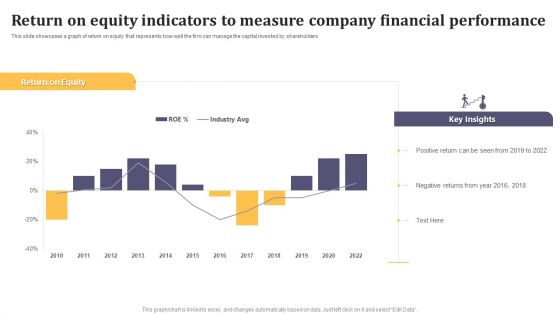
Return On Equity Indicators To Measure Company Financial Performance Mockup PDF
This slide showcases a graph of return on equity that represents how well the firm can manage the capital invested by shareholders. Pitch your topic with ease and precision using this Return On Equity Indicators To Measure Company Financial Performance Mockup PDF. This layout presents information on Return On Equity, Key Insights, Positive Return. It is also available for immediate download and adjustment. So, changes can be made in the color, design, graphics or any other component to create a unique layout.
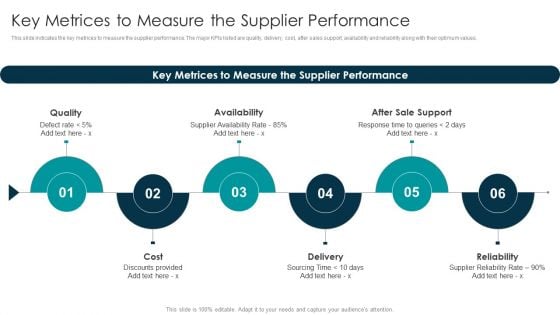
Tactical Approach For Vendor Reskilling Key Metrices To Measure The Supplier Performance Designs PDF
This slide indicates the key metrices to measure the supplier performance. The major KPIs listed are quality, delivery, cost, after sales support, availability and reliability along with their optimum values. Slidegeeks is here to make your presentations a breeze with Tactical Approach For Vendor Reskilling Key Metrices To Measure The Supplier Performance Designs PDF With our easy to use and customizable templates, you can focus on delivering your ideas rather than worrying about formatting. With a variety of designs to choose from, you are sure to find one that suits your needs. And with animations and unique photos, illustrations, and fonts, you can make your presentation pop. So whether you are giving a sales pitch or presenting to the board, make sure to check out Slidegeeks first.
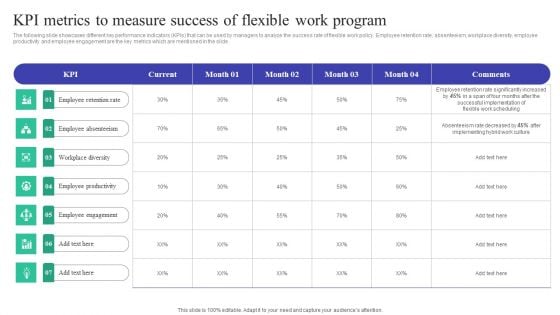
Implementing Adaptive Work Arrangements Kpi Metrics To Measure Success Of Flexible Work Program Elements PDF
The following slide showcases different key performance indicators KPIs that can be used by managers to analyze the success rate of flexible work policy. Employee retention rate, absenteeism, workplace diversity, employee productivity and employee engagement are the key metrics which are mentioned in the slide. Welcome to our selection of the Implementing Adaptive Work Arrangements Kpi Metrics To Measure Success Of Flexible Work Program Elements PDF. These are designed to help you showcase your creativity and bring your sphere to life. Planning and Innovation are essential for any business that is just starting out. This collection contains the designs that you need for your everyday presentations. All of our PowerPoints are 100 percent editable, so you can customize them to suit your needs. This multi purpose template can be used in various situations. Grab these presentation templates today.
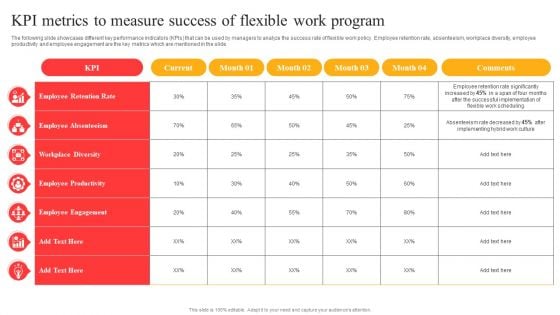
Flexible Working Policies And Guidelines Kpi Metrics To Measure Success Of Flexible Work Program Diagrams PDF
The following slide showcases different key performance indicators KPIs that can be used by managers to analyze the success rate of flexible work policy. Employee retention rate, absenteeism, workplace diversity, employee productivity and employee engagement are the key metrics which are mentioned in the slide. Coming up with a presentation necessitates that the majority of the effort goes into the content and the message you intend to convey. The visuals of a PowerPoint presentation can only be effective if it supplements and supports the story that is being told. Keeping this in mind our experts created Flexible Working Policies And Guidelines Kpi Metrics To Measure Success Of Flexible Work Program Diagrams PDF to reduce the time that goes into designing the presentation. This way, you can concentrate on the message while our designers take care of providing you with the right template for the situation.
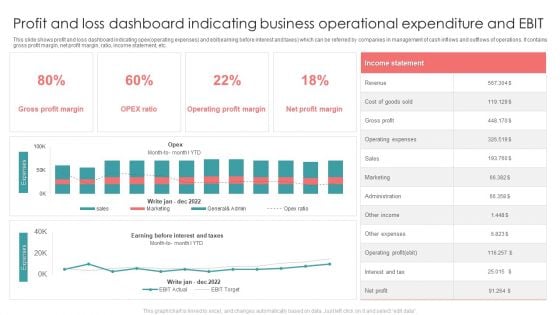
Profit And Loss Dashboard Indicating Business Operational Expenditure And EBIT Formats PDF
This slide shows profit and loss dashboard indicating opex operating expenses and ebit earning before interest and taxes which can be referred by companies in management of cash inflows and outflows of operations. It contains gross profit margin, net profit margin, ratio, income statement, etc. Showcasing this set of slides titled Profit And Loss Dashboard Indicating Business Operational Expenditure And EBIT Formats PDF. The topics addressed in these templates are Revenue, Gross Profit, Sales. All the content presented in this PPT design is completely editable. Download it and make adjustments in color, background, font etc. as per your unique business setting.
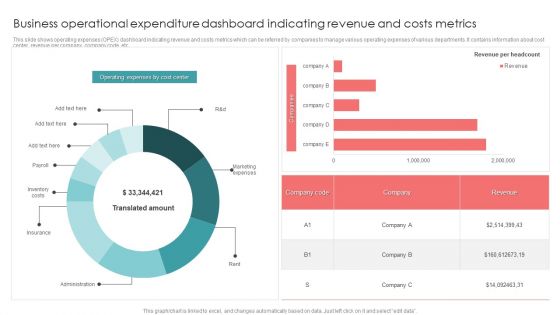
Business Operational Expenditure Dashboard Indicating Revenue And Costs Metrics Pictures PDF
This slide shows operating expenses OPEX dashboard indicating revenue and costs metrics which can be referred by companies to manage various operating expenses of various departments. It contains information about cost center, revenue per company, company code, etc. Pitch your topic with ease and precision using this Business Operational Expenditure Dashboard Indicating Revenue And Costs Metrics Pictures PDF. This layout presents information on Business Operational, Costs Metrics, Revenue. It is also available for immediate download and adjustment. So, changes can be made in the color, design, graphics or any other component to create a unique layout.


 Continue with Email

 Home
Home


