Score Meter
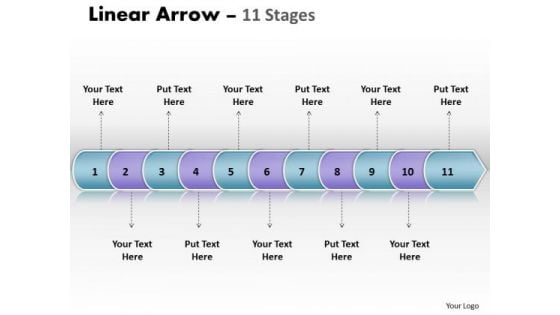
Usa Ppt Linear Arrow 11 Phase Diagram Business Management PowerPoint Image
USA PPT linear arrow 11 phase diagram business management powerpoint Image-This Linear Diagram is simple but nice enough to illustrate your thoughts and experiences to your staff. Explain in detail you assessment of the need for care to ensure continued smooth progress.-USA PPT linear arrow 11 phase diagram business management powerpoint Image-Arrow, Background, Collection, Completed, Concept, Confirmation, Design, Flow, Graph, Graphic, Illustration, Indication, Indicator, Information, Instruction, Interface, Internet, Layout, Measurement, Order, Phase, Pointer, Process, Progress, Reflection, Scale, Shape, Sign Deliberate on the evidence with our Usa Ppt Linear Arrow 11 Phase Diagram Business Management PowerPoint Image. Draw conclusions from the bare facts.
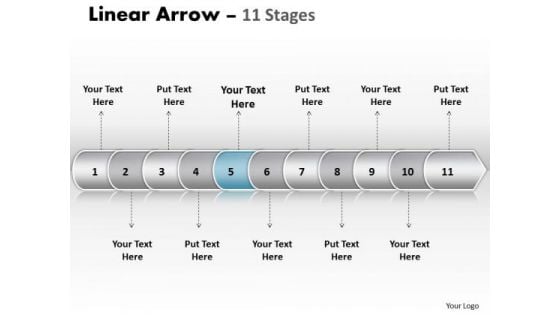
Usa Ppt Template Linear Arrow 11 Phase Diagram Time Management PowerPoint 6 Design
USA PPT template linear arrow 11 phase diagram time management powerpoint 6 design-This linear arrow chart makes information accessible throughout the organization with a collective, visible view of critical data from different perspectives and providing the tools to upcoming business scenarios and plan for change.-USA PPT template linear arrow 11 phase diagram time management powerpoint 6 design-Arrow, Background, Collection, Completed, Concept, Confirmation, Design, Flow, Graph, Graphic, Illustration, Indication, Indicator, Information, Instruction, Interface, Internet, Layout, Measurement, Order, Phase, Pointer, Process, Progress, Reflection, Scale, Shape, Sign Integrate teams with our Usa Ppt Template Linear Arrow 11 Phase Diagram Time Management PowerPoint 6 Design. Download without worries with our money back guaranteee.
Administering Logistics Activities In SCM Kpis To Track Transportation Management System Performance Icons PDF
This slide focuses on key performance indicators to track transportation management system performance which includes freight cost for each unit shipped, outbound and inbound freight costs, etc. Deliver and pitch your topic in the best possible manner with this Administering Logistics Activities In SCM Kpis To Track Transportation Management System Performance Icons PDF. Use them to share invaluable insights on Transportation, Management, System Performance and impress your audience. This template can be altered and modified as per your expectations. So, grab it now.
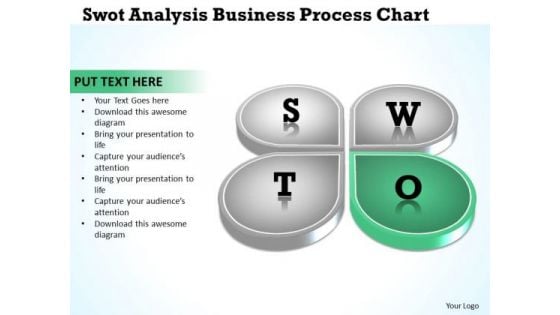
Business Logic Diagram Analysis PowerPoint Theme Process Chart Ppt Templates
We present our business logic diagram analysis powerpoint theme process chart ppt templates.Download and present our Business PowerPoint Templates because Our PowerPoint Templates and Slides are conceived by a dedicated team. Use them and give form to your wondrous ideas. Download and present our Shapes PowerPoint Templates because These PowerPoint Templates and Slides will give the updraft to your ideas. See them soar to great heights with ease. Use our Success PowerPoint Templates because You can Create a matrix with our PowerPoint Templates and Slides. Feel the strength of your ideas click into place. Download and present our Flow Charts PowerPoint Templates because You canTake a leap off the starting blocks with our PowerPoint Templates and Slides. They will put you ahead of the competition in quick time. Download and present our Process and Flows PowerPoint Templates because Our PowerPoint Templates and Slides will bullet point your ideas. See them fall into place one by one.Use these PowerPoint slides for presentations relating to Business, center, circle, circular, circulation, concept, control, cycle, development, diagram, direction, flow, graphic, green, idea, illustration, indicator, iterative, life, lifecycle, loop, management, method, mix, motion, movement, nature, pointer, process, propeller, quality, range, recycling, research, ring, rotation, round, schema, spectrum, spiral, step, strategy, success. The prominent colors used in the PowerPoint template are Green, Gray, White. People tell us our business logic diagram analysis powerpoint theme process chart ppt templates are designed by a team of presentation professionals. PowerPoint presentation experts tell us our circular PowerPoint templates and PPT Slides are designed by professionals Presenters tell us our business logic diagram analysis powerpoint theme process chart ppt templates are aesthetically designed to attract attention. We guarantee that they will grab all the eyeballs you need. Use our control PowerPoint templates and PPT Slides will impress their bosses and teams. Customers tell us our business logic diagram analysis powerpoint theme process chart ppt templates are designed by a team of presentation professionals. People tell us our circular PowerPoint templates and PPT Slides are aesthetically designed to attract attention. We guarantee that they will grab all the eyeballs you need. Dont ignore the perils of a boring presentation. Liven it up with our Business Logic Diagram Analysis PowerPoint Theme Process Chart Ppt Templates. Make sure your presentation gets the attention it deserves.
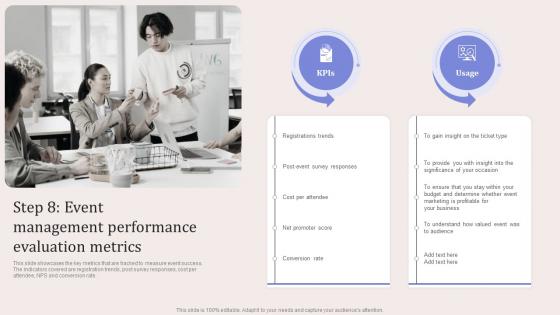
Step 8 Event Management Performance Virtual Event Promotion To Capture Professional Pdf
This slide showcases the key metrics that are tracked to measure event success. The indicators covered are registration trends, post survey responses, cost per attendee, NPS and conversion rate. Create an editable Step 8 Event Management Performance Virtual Event Promotion To Capture Professional Pdf that communicates your idea and engages your audience. Whether you are presenting a business or an educational presentation, pre-designed presentation templates help save time. Step 8 Event Management Performance Virtual Event Promotion To Capture Professional Pdf is highly customizable and very easy to edit, covering many different styles from creative to business presentations. Slidegeeks has creative team members who have crafted amazing templates. So, go and get them without any delay. This slide showcases the key metrics that are tracked to measure event success. The indicators covered are registration trends, post survey responses, cost per attendee, NPS and conversion rate.
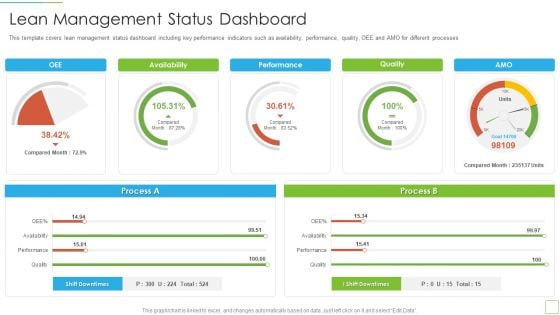
Hoshin Kanri Pitch Deck Lean Management Status Dashboard Designs PDF
This template covers lean management status dashboard including key performance indicators such as availability, performance, quality, OEE and AMO for different processes Deliver an awe inspiring pitch with this creative hoshin kanri pitch deck lean management status dashboard designs pdf bundle. Topics like lean management status dashboard can be discussed with this completely editable template. It is available for immediate download depending on the needs and requirements of the user.
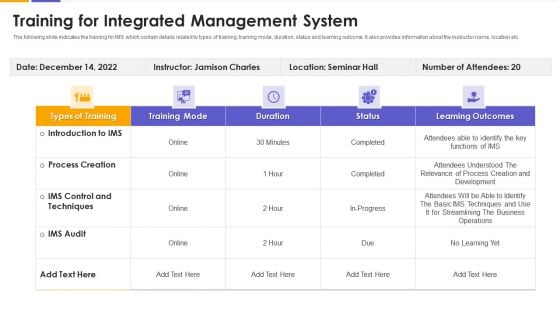
Training For Integrated Management System Background PDF
The following slide indicates the training for IMS which contain details related to types of training, training mode, duration, status and learning outcome. It also provides information about the instructor name, location etc. Pitch your topic with ease and precision using this training for integrated management system background pdf. This layout presents information on techniques, process creation, development. It is also available for immediate download and adjustment. So, changes can be made in the color, design, graphics or any other component to create a unique layout.
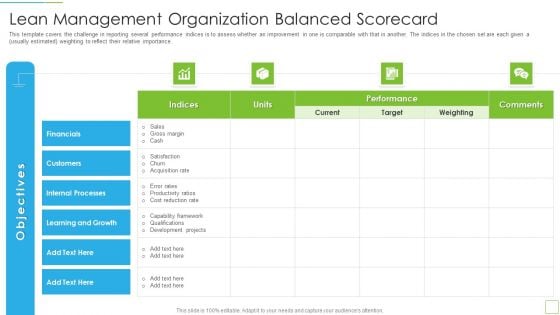
Hoshin Kanri Pitch Deck Lean Management Organization Balanced Scorecard Diagrams PDF
This template covers the challenge in reporting several performance indices is to assess whether an improvement in one is comparable with that in another. The indices in the chosen set are each given a usually estimated weighting to reflect their relative importance.Deliver and pitch your topic in the best possible manner with this hoshin kanri pitch deck lean management organization balanced scorecard diagrams pdf Use them to share invaluable insights on internal processes, learning and growth, customers and impress your audience. This template can be altered and modified as per your expectations. So, grab it now.

Adjacency Matrix Directed Graph In Powerpoint And Google Slides Cpb
Presenting our innovatively-designed set of slides titled Adjacency Matrix Directed Graph In Powerpoint And Google Slides Cpb. This completely editable PowerPoint graphic exhibits Adjacency Matrix Directed Graph that will help you convey the message impactfully. It can be accessed with Google Slides and is available in both standard screen and widescreen aspect ratios. Apart from this, you can download this well-structured PowerPoint template design in different formats like PDF, JPG, and PNG. So, click the download button now to gain full access to this PPT design. Introducing our dynamic PowerPoint PPT presentation on Current and Future Plans, meticulously crafted to guide businesses towards success. Unveil the latest trends and future finance strategies shaping industries, with a special focus on manufacturing and automotive sectors. Navigate through a comprehensive roadmap designed specifically for small businesses, offering strategic insights to ensure growth and resilience. Dive into the world of key performance indicators KPIs tailored for the evolving landscape of the e-commerce industry. Equip yourself with the knowledge needed to stay ahead, as this presentation seamlessly blends current insights with forward-thinking strategies, providing a holistic view for businesses striving to thrive in an ever-changing market. Elevate your business acumen with this indispensable tool for strategic planning.
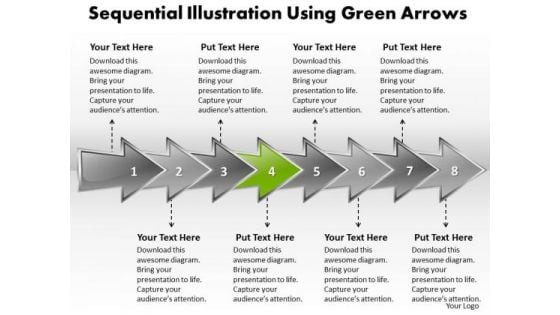
Ppt Sequential Model Using Shapes Arrows PowerPoint Templates
PPT sequential model using shapes arrows powerpoint Templates-This Diagram with an image of Even arrows helps you chart the course of your presentation. Use it to show related information. They are indicators of the path you have in mind.-PPT sequential model using shapes arrows powerpoint Templates-action, arrow, badge, banner, blank, business, button, collection, colorful, concern, connect, decoration, design, direction, element, financial, flow, graph, instruction, involve, label, link, method, navigation, operate, procedure, process, relate, sequence, sequent, series, shape, stage, step, successive, technique Make your audience listen and observe with our Ppt Sequential Model Using Shapes Arrows PowerPoint Templates. You will be at the top of your game.
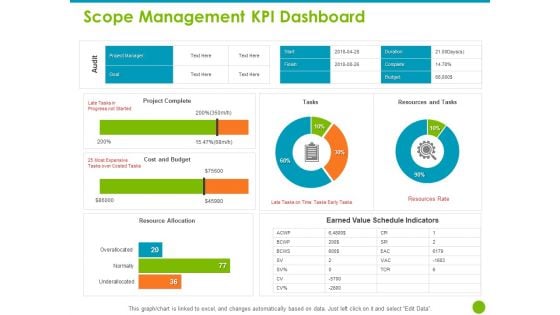
Project Capabilities Scope Management KPI Dashboard Ppt Slide Download PDF
Presenting this set of slides with name project capabilities scope management kpi dashboard ppt slide download pdf. The topics discussed in these slides are project complete, cost and budget, resource allocation, earned value schedule indicators, resources and tasks. This is a completely editable PowerPoint presentation and is available for immediate download. Download now and impress your audience.
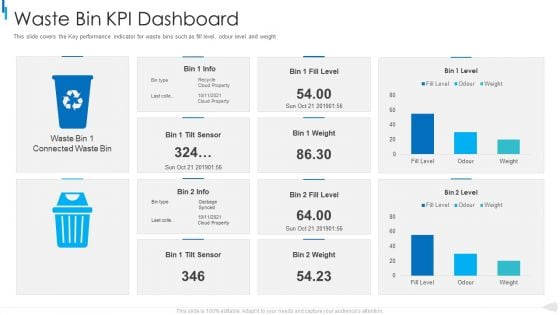
MSW Management Waste Bin Kpi Dashboard Clipart PDF
This slide covers the Key performance indicator for waste bins such as fill level, odour level and weight. Deliver an awe inspiring pitch with this creative MSW Management Waste Bin Kpi Dashboard Clipart Pdf bundle. Topics like waste bin kpi dashboard can be discussed with this completely editable template. It is available for immediate download depending on the needs and requirements of the user.
Waste Management Tracking Dashboard Resources Recycling And Waste Management Pictures PDF
This slide covers the key performance indicators for waste management including waste trucks tracker, green house gasses emissions, energy used and many more. Deliver an awe inspiring pitch with this creative waste management tracking dashboard resources recycling and waste management pictures pdf bundle. Topics like waste management tracking dashboard can be discussed with this completely editable template. It is available for immediate download depending on the needs and requirements of the user.

Vendor Management To Handle Purchase Checklist To Effectively Deploy Vendor Management Automation Pictures PDF
This slide depicts checklist to effectively introduce vendor management automation. It provides information about monitoring, key performance indicators KPIs, digital transformation, operational costs, outsourcing, etc. Deliver and pitch your topic in the best possible manner with this Vendor Management To Handle Purchase Checklist To Effectively Deploy Vendor Management Automation Pictures PDF. Use them to share invaluable insights on Managers Regularly, Performing According, Outsourcing Additional and impress your audience. This template can be altered and modified as per your expectations. So, grab it now.
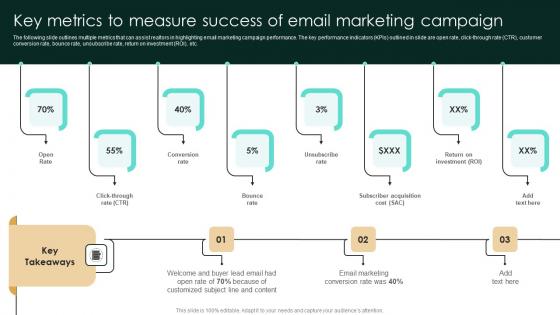
Key Metrics To Measure Success Of Email Marketing Campaign Diagrams Pdf
The following slide outlines multiple metrics that can assist realtors in highlighting email marketing campaign performance. The key performance indicators KPIs outlined in slide are open rate, click-through rate CTR, customer conversion rate, bounce rate, unsubscribe rate, return on investment ROI, etc. Retrieve professionally designed Key Metrics To Measure Success Of Email Marketing Campaign Diagrams Pdf to effectively convey your message and captivate your listeners. Save time by selecting pre-made slideshows that are appropriate for various topics, from business to educational purposes. These themes come in many different styles, from creative to corporate, and all of them are easily adjustable and can be edited quickly. Access them as PowerPoint templates or as Google Slides themes. You do not have to go on a hunt for the perfect presentation because Slidegeeks got you covered from everywhere. The following slide outlines multiple metrics that can assist realtors in highlighting email marketing campaign performance. The key performance indicators KPIs outlined in slide are open rate, click-through rate CTR, customer conversion rate, bounce rate, unsubscribe rate, return on investment ROI, etc.
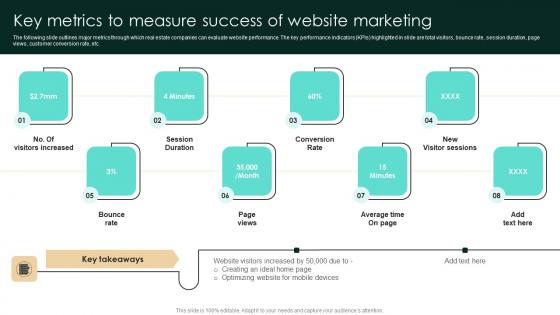
Key Metrics To Measure Success Of Website Marketing Strategic Real Estate Themes Pdf
The following slide outlines major metrics through which real estate companies can evaluate website performance. The key performance indicators KPIs highlighted in slide are total visitors, bounce rate, session duration, page views, customer conversion rate, etc. Presenting this PowerPoint presentation, titled Key Metrics To Measure Success Of Website Marketing Strategic Real Estate Themes Pdf with topics curated by our researchers after extensive research. This editable presentation is available for immediate download and provides attractive features when used. Download now and captivate your audience. Presenting this Key Metrics To Measure Success Of Website Marketing Strategic Real Estate Themes Pdf Our researchers have carefully researched and created these slides with all aspects taken into consideration. This is a completely customizable Key Metrics To Measure Success Of Website Marketing Strategic Real Estate Themes Pdf that is available for immediate downloading. Download now and make an impact on your audience. Highlight the attractive features available with our PPTs. The following slide outlines major metrics through which real estate companies can evaluate website performance. The key performance indicators KPIs highlighted in slide are total visitors, bounce rate, session duration, page views, customer conversion rate, etc.
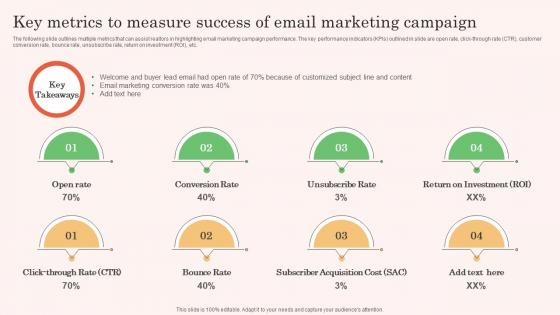
Key Metrics To Measure Success Of Email Real Estate Property Marketing Demonstration Pdf
The following slide outlines multiple metrics that can assist realtors in highlighting email marketing campaign performance. The key performance indicators KPIs outlined in slide are open rate, click-through rate CTR, customer conversion rate, bounce rate, unsubscribe rate, return on investment ROI, etc. Slidegeeks has constructed Key Metrics To Measure Success Of Email Real Estate Property Marketing Demonstration Pdf after conducting extensive research and examination. These presentation templates are constantly being generated and modified based on user preferences and critiques from editors. Here, you will find the most attractive templates for a range of purposes while taking into account ratings and remarks from users regarding the content. This is an excellent jumping-off point to explore our content and will give new users an insight into our top-notch PowerPoint Templates. The following slide outlines multiple metrics that can assist realtors in highlighting email marketing campaign performance. The key performance indicators KPIs outlined in slide are open rate, click-through rate CTR, customer conversion rate, bounce rate, unsubscribe rate, return on investment ROI, etc.
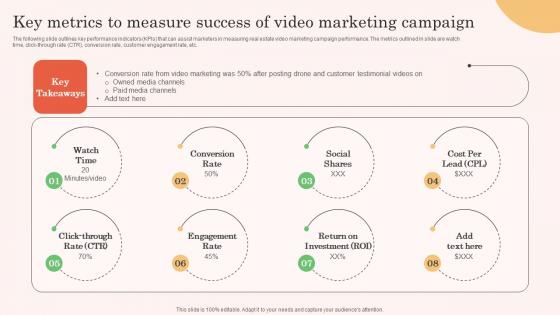
Key Metrics To Measure Success Of Video Real Estate Property Marketing Portrait Pdf
The following slide outlines key performance indicators KPIs that can assist marketers in measuring real estate video marketing campaign performance. The metrics outlined in slide are watch time, click-through rate CTR, conversion rate, customer engagement rate, etc.Here you can discover an assortment of the finest PowerPoint and Google Slides templates. With these templates, you can create presentations for a variety of purposes while simultaneously providing your audience with an eye-catching visual experience. Download Key Metrics To Measure Success Of Video Real Estate Property Marketing Portrait Pdf to deliver an impeccable presentation. These templates will make your job of preparing presentations much quicker, yet still, maintain a high level of quality. Slidegeeks has experienced researchers who prepare these templates and write high-quality content for you. Later on, you can personalize the content by editing the Key Metrics To Measure Success Of Video Real Estate Property Marketing Portrait Pdf. The following slide outlines key performance indicators KPIs that can assist marketers in measuring real estate video marketing campaign performance. The metrics outlined in slide are watch time, click-through rate CTR, conversion rate, customer engagement rate, etc.
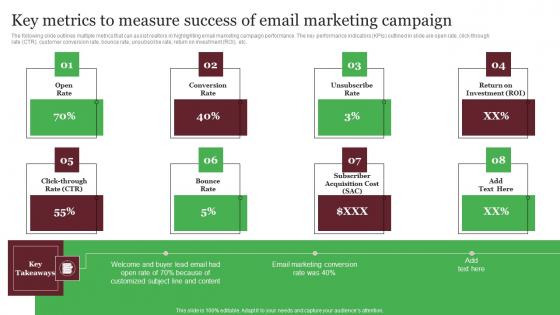
Key Metrics To Measure Success Of Email Marketing Campaign Out Of The Box Real Topics Pdf
The following slide outlines multiple metrics that can assist realtors in highlighting email marketing campaign performance. The key performance indicators KPIs outlined in slide are open rate, click-through rate CTR, customer conversion rate, bounce rate, unsubscribe rate, return on investment ROI, etc. Slidegeeks has constructed Key Metrics To Measure Success Of Email Marketing Campaign Out Of The Box Real Topics Pdf after conducting extensive research and examination. These presentation templates are constantly being generated and modified based on user preferences and critiques from editors. Here, you will find the most attractive templates for a range of purposes while taking into account ratings and remarks from users regarding the content. This is an excellent jumping-off point to explore our content and will give new users an insight into our top-notch PowerPoint Templates. The following slide outlines multiple metrics that can assist realtors in highlighting email marketing campaign performance. The key performance indicators KPIs outlined in slide are open rate, click-through rate CTR, customer conversion rate, bounce rate, unsubscribe rate, return on investment ROI, etc.
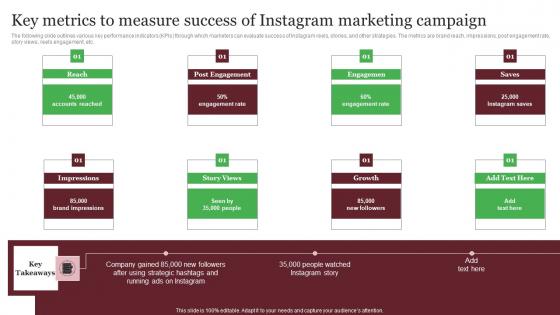
Key Metrics To Measure Success Of Instagram Marketing Campaign Out Of The Box Real Sample Pdf
The following slide outlines various key performance indicators KPIs through which marketers can evaluate success of Instagram reels, stories, and other strategies. The metrics are brand reach, impressions, post engagement rate, story views, reels engagement, etc. Presenting this PowerPoint presentation, titled Key Metrics To Measure Success Of Instagram Marketing Campaign Out Of The Box Real Sample Pdf with topics curated by our researchers after extensive research. This editable presentation is available for immediate download and provides attractive features when used. Download now and captivate your audience. Presenting this Key Metrics To Measure Success Of Instagram Marketing Campaign Out Of The Box Real Sample Pdf Our researchers have carefully researched and created these slides with all aspects taken into consideration. This is a completely customizable Key Metrics To Measure Success Of Instagram Marketing Campaign Out Of The Box Real Sample Pdf that is available for immediate downloading. Download now and make an impact on your audience. Highlight the attractive features available with our PPTs. The following slide outlines various key performance indicators KPIs through which marketers can evaluate success of Instagram reels, stories, and other strategies. The metrics are brand reach, impressions, post engagement rate, story views, reels engagement, etc.
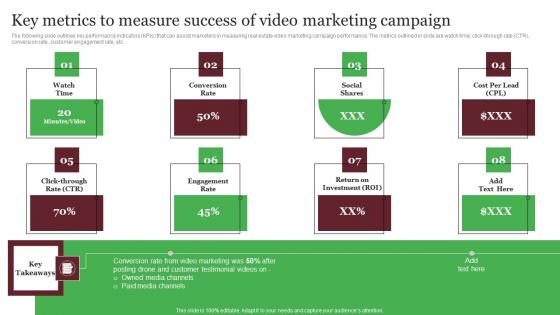
Key Metrics To Measure Success Of Video Marketing Campaign Out Of The Box Real Topics Pdf
The following slide outlines key performance indicators KPIs that can assist marketers in measuring real estate video marketing campaign performance. The metrics outlined in slide are watch time, click-through rate CTR, conversion rate, customer engagement rate, etc. Here you can discover an assortment of the finest PowerPoint and Google Slides templates. With these templates, you can create presentations for a variety of purposes while simultaneously providing your audience with an eye-catching visual experience. Download Key Metrics To Measure Success Of Video Marketing Campaign Out Of The Box Real Topics Pdf to deliver an impeccable presentation. These templates will make your job of preparing presentations much quicker, yet still, maintain a high level of quality. Slidegeeks has experienced researchers who prepare these templates and write high-quality content for you. Later on, you can personalize the content by editing the Key Metrics To Measure Success Of Video Marketing Campaign Out Of The Box Real Topics Pdf The following slide outlines key performance indicators KPIs that can assist marketers in measuring real estate video marketing campaign performance. The metrics outlined in slide are watch time, click-through rate CTR, conversion rate, customer engagement rate, etc.
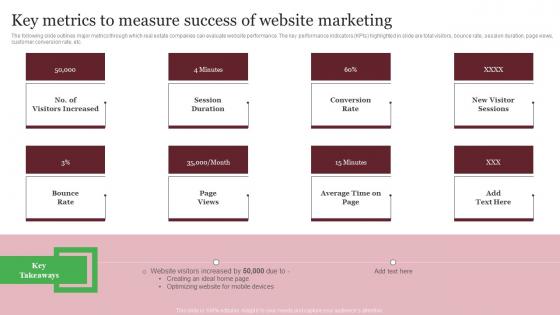
Key Metrics To Measure Success Of Website Marketing Out Of The Box Real Mockup Pdf
The following slide outlines major metrics through which real estate companies can evaluate website performance. The key performance indicators KPIs highlighted in slide are total visitors, bounce rate, session duration, page views, customer conversion rate, etc. This Key Metrics To Measure Success Of Website Marketing Out Of The Box Real Mockup Pdf from Slidegeeks makes it easy to present information on your topic with precision. It provides customization options, so you can make changes to the colors, design, graphics, or any other component to create a unique layout. It is also available for immediate download, so you can begin using it right away. Slidegeeks has done good research to ensure that you have everything you need to make your presentation stand out. Make a name out there for a brilliant performance. The following slide outlines major metrics through which real estate companies can evaluate website performance. The key performance indicators KPIs highlighted in slide are total visitors, bounce rate, session duration, page views, customer conversion rate, etc.
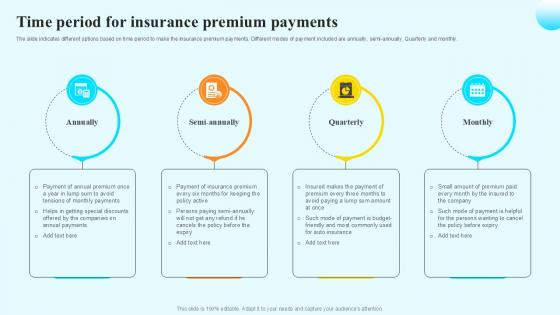
Time Period For Insurance Premium Steps By Step Guide For Claiming Car PPT Example
The slide indicates different options based on time period to make the insurance premium payments. Different modes of payment included are annually, semi-annually. Quarterly and monthly. Here you can discover an assortment of the finest PowerPoint and Google Slides templates. With these templates, you can create presentations for a variety of purposes while simultaneously providing your audience with an eye-catching visual experience. Download Time Period For Insurance Premium Steps By Step Guide For Claiming Car PPT Example to deliver an impeccable presentation. These templates will make your job of preparing presentations much quicker, yet still, maintain a high level of quality. Slidegeeks has experienced researchers who prepare these templates and write high-quality content for you. Later on, you can personalize the content by editing the Time Period For Insurance Premium Steps By Step Guide For Claiming Car PPT Example. The slide indicates different options based on time period to make the insurance premium payments. Different modes of payment included are annually, semi-annually. Quarterly and monthly.
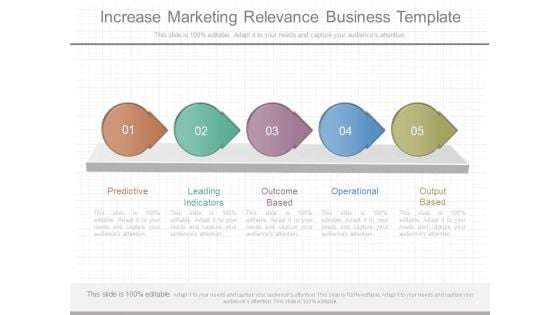
Increase Marketing Relevance Business Template
This is a increase marketing relevance business template. This is a five stage process. The stages in this process are predictive, leading indicators, outcome based, operational, output based.\n\n\n\n\n\n
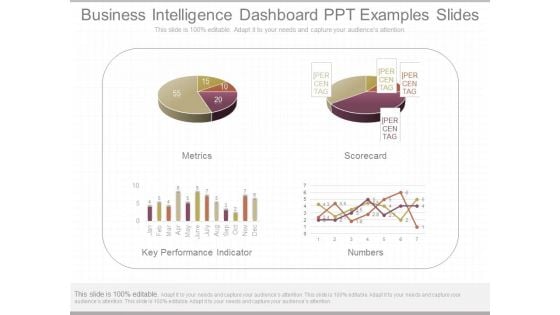
Business Intelligence Dashboard Ppt Examples Slides
This is a business intelligence dashboard ppt examples slides. This is a four stage process. The stages in this process are metrics, scorecard, key performance indicator, numbers.
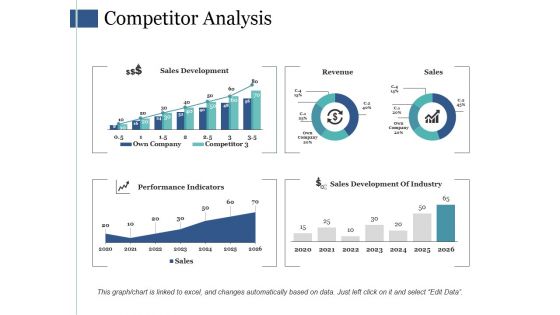
Competitor Analysis Ppt PowerPoint Presentation Slides Visuals
This is a competitor analysis ppt powerpoint presentation slides visuals. This is a four stage process. The stages in this process are sales development, revenue, sales, performance, indicators.
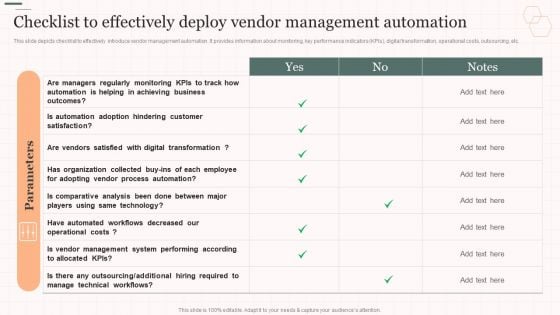
Checklist To Effectively Deploy Vendor Management Automation Vendor Management Strategies Download PDF
This slide depicts checklist to effectively introduce vendor management automation. It provides information about monitoring, key performance indicators KPIs, digital transformation, operational costs, outsourcing, etc. Deliver and pitch your topic in the best possible manner with this Checklist To Effectively Deploy Vendor Management Automation Vendor Management Strategies Download PDF. Use them to share invaluable insights on Automation Adoption, Regularly Monitoring, Organization Collected and impress your audience. This template can be altered and modified as per your expectations. So, grab it now.
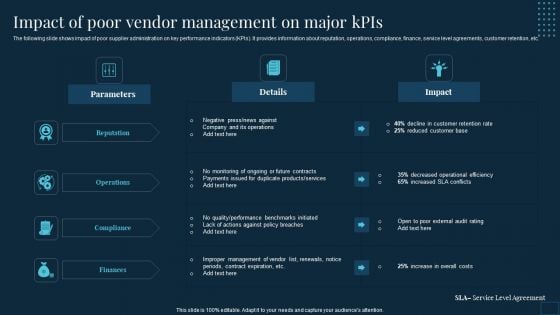
Vendor Management To Handle Purchase Impact Of Poor Vendor Management On Major Kpis Mockup PDF
The following slide shows impact of poor supplier administration on key performance indicators KPIs. It provides information about reputation, operations, compliance, finance, service level agreements, customer retention, etc. Deliver an awe inspiring pitch with this creative Vendor Management To Handle Purchase Impact Of Poor Vendor Management On Major Kpis Mockup PDF bundle. Topics like Decreased Operational, Improper Management, Poor External can be discussed with this completely editable template. It is available for immediate download depending on the needs and requirements of the user.
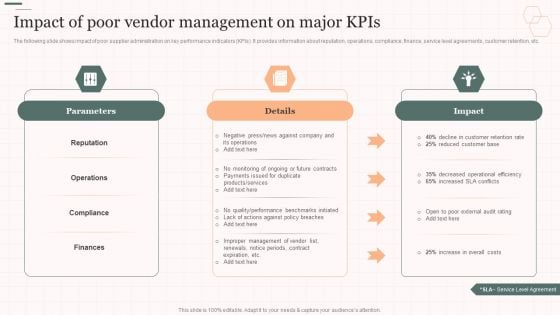
Impact Of Poor Vendor Management On Major Kpis Vendor Management Strategies Ideas PDF
The following slide shows impact of poor supplier administration on key performance indicators KPIs. It provides information about reputation, operations, compliance, finance, service level agreements, customer retention, etc. Deliver and pitch your topic in the best possible manner with this Impact Of Poor Vendor Management On Major Kpis Vendor Management Strategies Ideas PDF. Use them to share invaluable insights on Parameters, Decreased Operational, Compliance and impress your audience. This template can be altered and modified as per your expectations. So, grab it now.
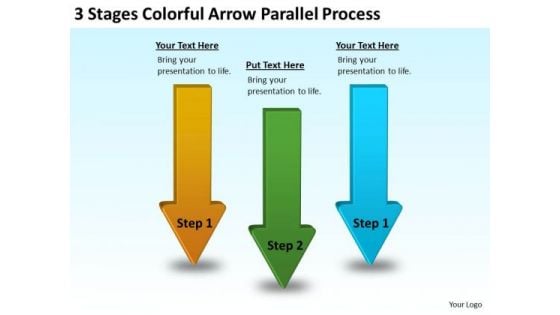
Serial Processing Vs Parallel Colorful Arrow PowerPoint Templates
We present our serial processing vs parallel colorful arrow PowerPoint templates.Present our Arrows PowerPoint Templates because It can be used to Set your controls for the heart of the sun. Our PowerPoint Templates and Slides will be the propellant to get you there. Present our Marketing PowerPoint Templates because You will get more than you ever bargained for. Use our Process and Flows PowerPoint Templates because Our PowerPoint Templates and Slides have the Brilliant backdrops. Guaranteed to illuminate the minds of your audience. Download and present our Shapes PowerPoint Templates because Our PowerPoint Templates and Slides will let you meet your Deadlines. Present our Business PowerPoint Templates because Our PowerPoint Templates and Slides are the chords of your song. String them along and provide the lilt to your views.Use these PowerPoint slides for presentations relating to Arrow, Banner, Bar, Collection, Completion, Concept, Confirmation, Design, Flow, Graph, Graphic, Illustration, Indication, Information, Instruction, Interface, Internet, Layout, Measurement, Modern, Number, Order, Phase, Pointer, Process, Progress, Reflection, Scale, Shape, Stage, Status, Step, Template, Two, Vector, Web, Web Design, Web Design Elements, Websites, Work Flow. The prominent colors used in the PowerPoint template are Green, Blue, Yellow. Customers tell us our serial processing vs parallel colorful arrow PowerPoint templates provide you with a vast range of viable options. Select the appropriate ones and just fill in your text. We assure you our Flow PowerPoint templates and PPT Slides are readymade to fit into any presentation structure. Use our serial processing vs parallel colorful arrow PowerPoint templates are effectively colour coded to prioritise your plans They automatically highlight the sequence of events you desire. You can be sure our Design PowerPoint templates and PPT Slides are effectively colour coded to prioritise your plans They automatically highlight the sequence of events you desire. PowerPoint presentation experts tell us our serial processing vs parallel colorful arrow PowerPoint templates provide you with a vast range of viable options. Select the appropriate ones and just fill in your text. The feedback we get is that our Bar PowerPoint templates and PPT Slides will help them to explain complicated concepts. Captain your team with elan. Create an aura about you with our Serial Processing Vs Parallel Colorful Arrow PowerPoint Templates.
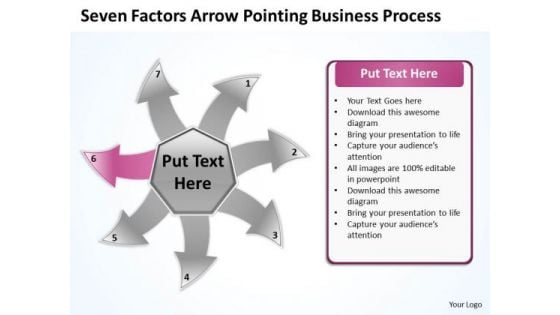
Free Business PowerPoint Templates Process Cycle Circular Flow Layout Chart
We present our free business powerpoint templates process cycle Circular Flow Layout Chart.Use our Communication PowerPoint Templates because the plans are in your head, stage by stage, year by year. Present our Arrows PowerPoint Templates because you have had your share of being a goldfish in a small bowl.you are ready to launch out and spread your wings. Download and present our Circle Charts PowerPoint Templates because they are the indicators of the path you have in mind. Download our Business PowerPoint Templates because your thoughts are pointed and sharp as arrows. Present our Shapes PowerPoint Templates because your group can behave steady in the top bracket.Use these PowerPoint slides for presentations relating to Arrow, Bio, Business, Chart, Circle, Concept, Control, Cycle, Design, Development, Diagram, Eco, Ecology, Environmental, Evaluate, Flow, Flowchart, Fresh, Graphic, Green, Idea, Infographic, Iterative, Life, Lifecycle, Management, Method, Model, Natural, Nature, Organic, Process, Quality, Recycle, Research, Schema, Spiral, Step, Strategy, Success, System. The prominent colors used in the PowerPoint template are Pink, Gray, White. Customers tell us our free business powerpoint templates process cycle Circular Flow Layout Chart are Adorable. Customers tell us our Concept PowerPoint templates and PPT Slides are Tranquil. Presenters tell us our free business powerpoint templates process cycle Circular Flow Layout Chart are Romantic. PowerPoint presentation experts tell us our Design PowerPoint templates and PPT Slides are Tranquil. Customers tell us our free business powerpoint templates process cycle Circular Flow Layout Chart are Efficient. Professionals tell us our Chart PowerPoint templates and PPT Slides provide you with a vast range of viable options. Select the appropriate ones and just fill in your text. Our Free Business PowerPoint Templates Process Cycle Circular Flow Layout Chart remain within bounds. They will never exceed their brief.
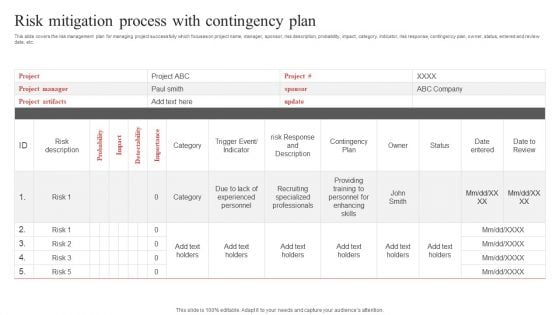
Risk Mitigation Process With Contingency Plan Ppt PowerPoint Presentation Gallery Templates PDF
This slide covers the risk management plan for managing project successfully which focuses on project name, manager, sponsor, risk description, probability, impact, category, indicator, risk response, contingency plan, owner, status, entered and review date, etc. Pitch your topic with ease and precision using this Risk Mitigation Process With Contingency Plan Ppt PowerPoint Presentation Gallery Templates PDF. This layout presents information on Risk Description, Contingency Plan, Project Artifacts. It is also available for immediate download and adjustment. So, changes can be made in the color, design, graphics or any other component to create a unique layout.
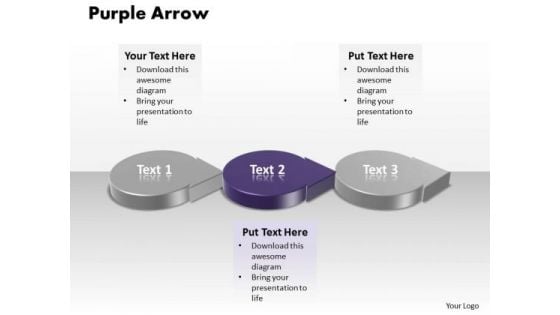
Ppt 3d Circular PowerPoint Graphics Arrows Showing Purple Stage Templates
PPT 3d circular powerpoint graphics arrows showing purple stage Templates-Use this PowerPoint diagram to define basic work and data flow and quality management processes to increase efficiency of your business.-PPT 3d circular powerpoint graphics arrows showing purple stage Templates-arrow, black, blue, bright, brown, button, cartography, circle, direction, fuchsia, glossy, green, icon, indicator, internet, light, map, modern, multicolor, nautical, navigation, orientation, pink, pointer, round, set, shadow, shiny, simple, star, vector Cruise along with our Ppt 3d Circular PowerPoint Graphics Arrows Showing Purple Stage Templates. Your thoughts will pick up the flow.

Business Diagram Two Warning Sign For Danger In Nuclear Area Presentation Template
This PowerPoint template has been designed with graphic of two warning sign for danger indication. The importance of safety in the work place can be defined with this diagram. Use this image to build quality presentation for your viewers.

Process Methodology Elements With Material Resources Ppt PowerPoint Presentation Show Elements PDF
Showcasing this set of slides titled process methodology elements with material resources ppt powerpoint presentation show elements pdf The topics addressed in these templates are methods, indicators, process, outputs, inputs. All the content presented in this PPT design is completely editable. Download it and make adjustments in color, background, font etc. as per your unique business setting.
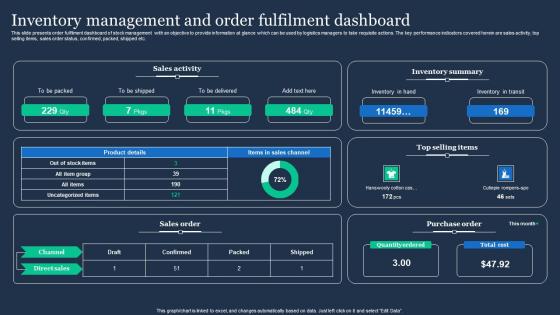
Inventory Management And Order Fulfilment Dashboard Slides Pdf
This slide presents order fulfilment dashboard of stock management with an objective to provide information at glance which can be used by logistics managers to take requisite actions. The key performance indicators covered herein are sales activity, top selling items, sales order status, confirmed, packed, shipped etc. Pitch your topic with ease and precision using this Inventory Management And Order Fulfilment Dashboard Slides Pdf. This layout presents information on Sales Activity, Inventory Summary, Sales Order. It is also available for immediate download and adjustment. So, changes can be made in the color, design, graphics or any other component to create a unique layout. This slide presents order fulfilment dashboard of stock management with an objective to provide information at glance which can be used by logistics managers to take requisite actions. The key performance indicators covered herein are sales activity, top selling items, sales order status, confirmed, packed, shipped etc.
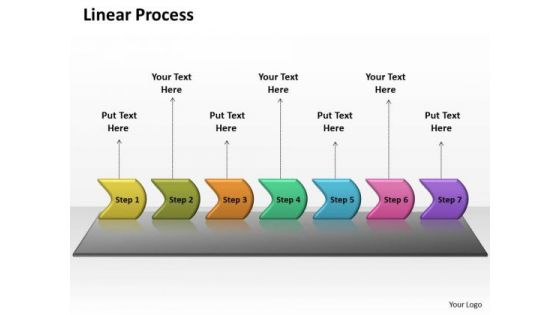
Ppt Seven Create PowerPoint Macro Linear Forging Process Slides Templates
PPT seven create powerpoint macro linear forging process slides Templates-This PowerPoint process diagram template helps you visualize your process with ease.The diagrams can be used to show linear process, flow etc-PPT seven create powerpoint macro linear forging process slides Templates-Aim, Arrow, Arrowheads, Badge, Border, Click, Connection, Curve, Design, Direction, Download, Element, Fuchsia, Icon, Illustration, Indicator, Internet, Magenta, Mark, Object, Orientation, Pointer, Shadow, Shape, Sign Whatever the nationality,our Ppt Seven Create PowerPoint Macro Linear Forging Process Slides Templates are relevant. They have no ethnic bias.
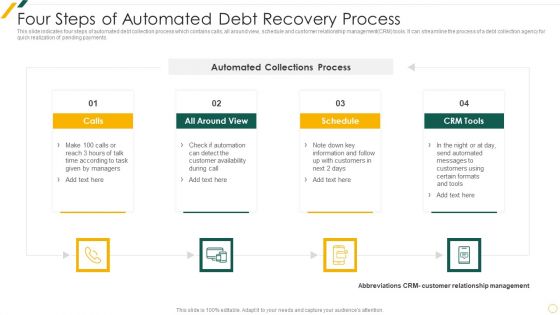
Four Steps Of Automated Debt Recovery Process Portrait PDF
This slide indicates four steps of automated debt collection process which contains calls, all around view, schedule and customer relationship managementCRM tools. It can streamline the process of a debt collection agency for quick realization of pending payments.Presenting Four Steps Of Automated Debt Recovery Process Portrait PDF to dispense important information. This template comprises four stages. It also presents valuable insights into the topics including Scheduled Reminders, Imbursement Reminder, Direct Contact This is a completely customizable PowerPoint theme that can be put to use immediately. So, download it and address the topic impactfully.
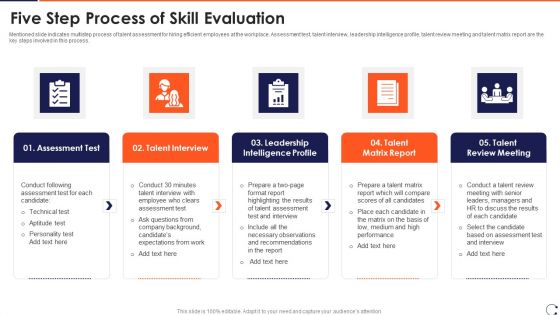
Five Step Process Of Skill Evaluation Sample PDF
Mentioned slide indicates multistep process of talent assessment for hiring efficient employees at the workplace. Assessment test, talent interview, leadership intelligence profile, talent review meeting and talent matrix report are the key steps involved in this process.Presenting Five Step Process Of Skill Evaluation Sample PDF to dispense important information. This template comprises five stages. It also presents valuable insights into the topics including Assessment Test, Talent Interview, Leadership Intelligence This is a completely customizable PowerPoint theme that can be put to use immediately. So, download it and address the topic impactfully.
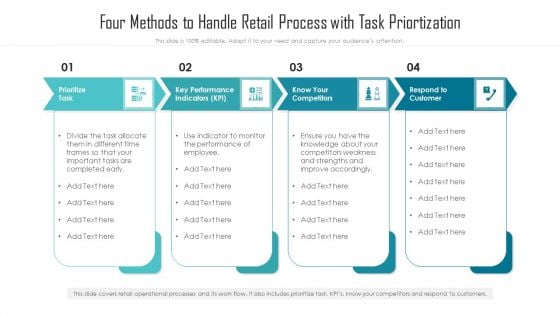
Four Methods To Handle Retail Process With Task Priortization Ppt Styles Show PDF
Presenting four methods to handle retail process with task priortization ppt styles show pdf to dispense important information. This template comprises four stages. It also presents valuable insights into the topics including prioritize task, key performance indicators, respond to customer. This is a completely customizable PowerPoint theme that can be put to use immediately. So, download it and address the topic impactfully.
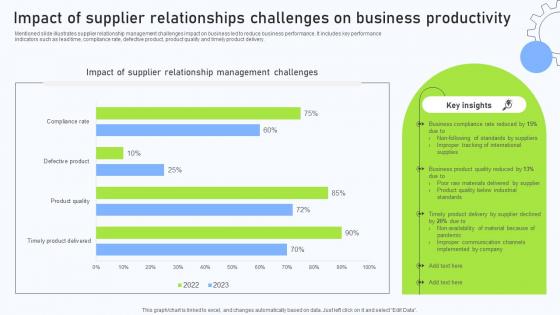
Relationship Management Automation Software Impact Of Supplier Relationships Challenges
Mentioned slide illustrates supplier relationship management challenges impact on business led to reduce business performance. It includes key performance indicators such as lead time, compliance rate, defective product, product quality and timely product delivery. Slidegeeks is one of the best resources for PowerPoint templates. You can download easily and regulate Relationship Management Automation Software Impact Of Supplier Relationships Challenges for your personal presentations from our wonderful collection. A few clicks is all it takes to discover and get the most relevant and appropriate templates. Use our Templates to add a unique zing and appeal to your presentation and meetings. All the slides are easy to edit and you can use them even for advertisement purposes. Mentioned slide illustrates supplier relationship management challenges impact on business led to reduce business performance. It includes key performance indicators such as lead time, compliance rate, defective product, product quality and timely product delivery.
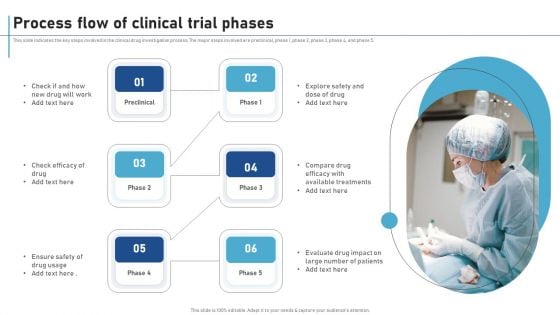
Process Flow Of Clinical Trial Phases New Clinical Drug Trial Process Introduction PDF
This slide indicates the key steps involved in the clinical drug investigation process. The major steps involved are preclinical, phase 1, phase 2, phase 3, phase 4, and phase 5. Welcome to our selection of the Process Flow Of Clinical Trial Phases New Clinical Drug Trial Process Introduction PDF. These are designed to help you showcase your creativity and bring your sphere to life. Planning and Innovation are essential for any business that is just starting out. This collection contains the designs that you need for your everyday presentations. All of our PowerPoints are 100 percent editable, so you can customize them to suit your needs. This multi-purpose template can be used in various situations. Grab these presentation templates today.
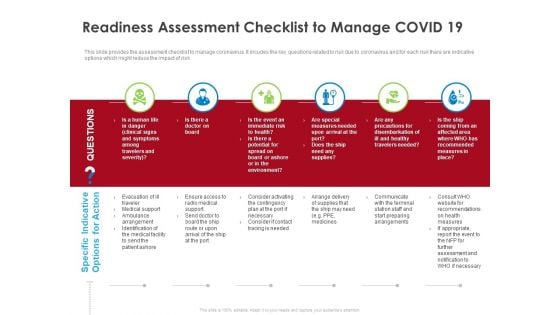
COVID 19 Risk Analysis Mitigation Policies Ocean Liner Sector Readiness Assessment Checklist To Manage COVID 19 Demonstration PDF
This slide provides the assessment checklist to manage coronavirus. It incudes the key questions related to risk due to coronavirus and for each risk there are indicative options which might reduce the impact of risk. This is a covid 19 risk analysis mitigation policies ocean liner sector readiness assessment checklist to manage covid 19 demonstration pdf template with various stages. Focus and dispense information on six stages using this creative set, that comes with editable features. It contains large content boxes to add your information on topics like measures, potential, environment, supplies, plan. You can also showcase facts, figures, and other relevant content using this PPT layout. Grab it now.
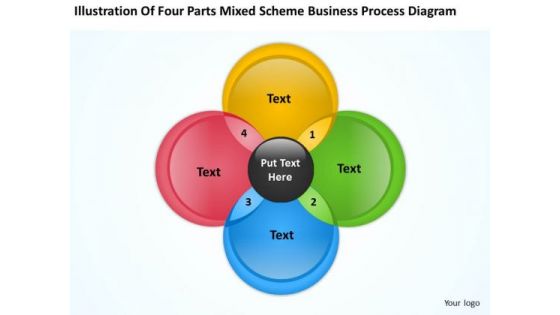
Mixed Scheme Business Process Diagram Creating Plan Step By PowerPoint Templates
We present our mixed scheme business process diagram creating plan step by PowerPoint templates.Download our Process and Flows PowerPoint Templates because Our PowerPoint Templates and Slides will give good value for money. They also have respect for the value of your time. Use our Flow Charts PowerPoint Templates because Our PowerPoint Templates and Slides will help you be quick off the draw. Just enter your specific text and see your points hit home. Download and present our Shapes PowerPoint Templates because Our PowerPoint Templates and Slides will generate and maintain the level of interest you desire. They will create the impression you want to imprint on your audience. Use our Business PowerPoint Templates because Our PowerPoint Templates and Slides will help you be quick off the draw. Just enter your specific text and see your points hit home. Use our Marketing PowerPoint Templates because These PowerPoint Templates and Slides will give the updraft to your ideas. See them soar to great heights with ease.Use these PowerPoint slides for presentations relating to Flow, process, schema, loop, turn, step, business, concept, vector, life, success, spectrum, rotation, recycling, diagram, circle, ring, graphic, propeller,pointer, idea, development, management, wheel, cycle, circulation, illustration, circular, system, strategy, round, research, range, iterative, center, direction, spiral,lifecycle, motion, method, quality, control, act, movement, blender, nature, mix, indicator. The prominent colors used in the PowerPoint template are Black, Yellow, Green. Your thoughts and our Mixed Scheme Business Process Diagram Creating Plan Step By PowerPoint Templates will get along famously. They will create an acclaimed team.
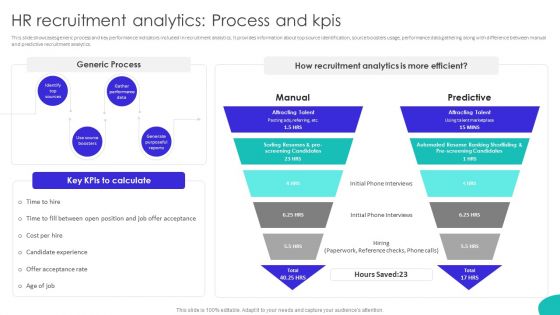
Improving Technology Based HR Recruitment Analytics Process And Kpis Designs PDF
This slide showcases generic process and key performance indicators included in recruitment analytics. It provides information about top source identification, source boosters usage, performance data gathering along with difference between manual and predictive recruitment analytics. Are you in need of a template that can accommodate all of your creative concepts This one is crafted professionally and can be altered to fit any style. Use it with Google Slides or PowerPoint. Include striking photographs, symbols, depictions, and other visuals. Fill, move around, or remove text boxes as desired. Test out color palettes and font mixtures. Edit and save your work, or work with colleagues. Download Improving Technology Based HR Recruitment Analytics Process And Kpis Designs PDF and observe how to make your presentation outstanding. Give an impeccable presentation to your group and make your presentation unforgettable.
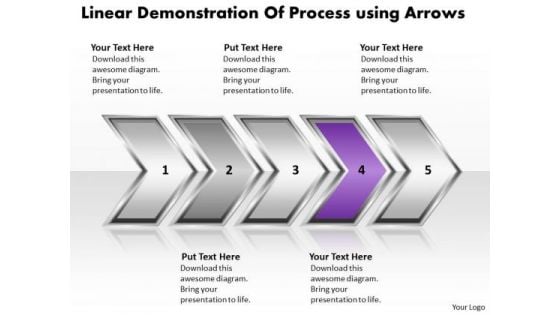
Ppt Linear Demonstration Of Marketing Process Business PowerPoint Templates
PPT linear demonstration of marketing process Business PowerPoint Templates-Highlight the key point in business process with these arrows attached having five stages in this PowerPoint diagram. It signifies appearance, attitude, bearing, condition, countenance, look, manner, mien etc. This PowerPoint Linear process diagram is used to show interrelated ideas or concepts. This diagram is useful in just about any type of presentation.-PPT linear demonstration of marketing process Business PowerPoint Templates-Aim, Arrow, Arrowheads, Badge, Border, Click, Connection, Curve, Design, Direction, Download, Element, Fuchsia, Icon, Illustration, Indicator, Internet, Magenta, Mark, Object, Orientation, Pointer, Shadow, Shape, Sign Blow away concerns with our Ppt Linear Demonstration Of Marketing Process Business PowerPoint Templates. You will come out on top.
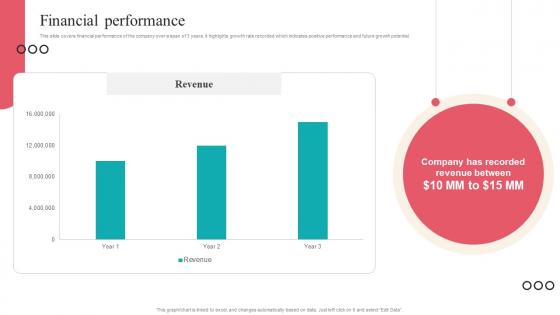
Financial Performance Camera Management Platform Investor Funding Elevator Pitch Deck
This slide covers financial performance of the company over a span of 3 years. It highlights growth rate recorded which indicates positive performance and future growth potential. From laying roadmaps to briefing everything in detail, our templates are perfect for you. You can set the stage with your presentation slides. All you have to do is download these easy-to-edit and customizable templates. Financial Performance Camera Management Platform Investor Funding Elevator Pitch Deck will help you deliver an outstanding performance that everyone would remember and praise you for. Do download this presentation today. This slide covers financial performance of the company over a span of 3 years. It highlights growth rate recorded which indicates positive performance and future growth potential.
Managing Technical And Non Various Kpis For Tracking Business Performance
Mentioned slide provide insights into various key performance indicators to determine business performance. It includes KPIs such as business financials, website traffic, customer case, customer engagement, conversion rate, customer retention, customer bounce rate, employee turnover, etc. Make sure to capture your audiences attention in your business displays with our gratis customizable Managing Technical And Non Various Kpis For Tracking Business Performance. These are great for business strategies, office conferences, capital raising or task suggestions. If you desire to acquire more customers for your tech business and ensure they stay satisfied, create your own sales presentation with these plain slides. Mentioned slide provide insights into various key performance indicators to determine business performance. It includes KPIs such as business financials, website traffic, customer case, customer engagement, conversion rate, customer retention, customer bounce rate, employee turnover, etc.
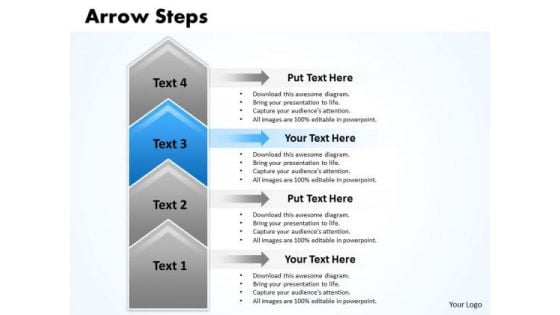
Business Ppt Arrow Create PowerPoint Macro 4 Stages Management Graphic
We present our Business PPT arrow create PowerPoint macro 4 stages management Graphic. Use our Arrows PowerPoint Templates because, designed to help bullet-point your views and thoughts. Use our Process and Flows PowerPoint Templates because, it is in your DNA to analyses possible causes to the minutest detail. Use our Business PowerPoint Templates because, they are indicators of the path you have in mind. Use our Marketing PowerPoint Templates because; in any endeavor people matter most. Use our Shapes PowerPoint Templates because; Blaze a brilliant trail from point to point. Use these PowerPoint slides for presentations relating to Algorithm, Arrow, Chart, Block, Diagram, Business, Chart, Connection, Design, Development, Diagram, Direction, Element, Flow, Chart, Flow, Diagram, Flowchart, Graph, Kind, Of, Diagram, Linear, Diagram, Management, Model, Module, Motion, Organization, Plan, Process, Arrows, Process, Chart, Process, Diagram, Process, Flow, Program, Section, Segment, Set, Sign, Solution, Strategy, Symbol, Technology. The prominent colors used in the PowerPoint template are Blue, Gray, and Black Get rid of the fat with our Business Ppt Arrow Create PowerPoint Macro 4 Stages Management Graphic. Get to the meat with your thoughts.
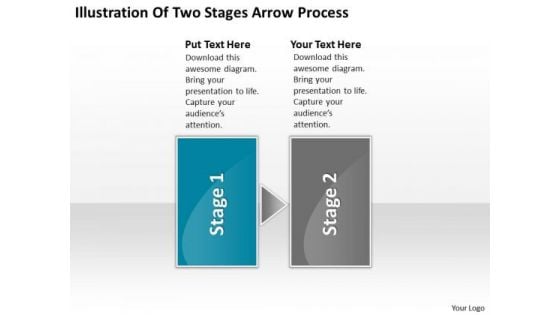
Illustration Of Two Stages Arrow Process Flowchart Program PowerPoint Templates
We present our illustration of two stages arrow process flowchart program PowerPoint templates.Use our Arrows PowerPoint Templates because watching them will strengthen your companys sinews. Present our Shapes PowerPoint Templates because you can Grab the attention of your team with this eye catching template signifying . Use our Business PowerPoint Templates because The foundation of the structure of your business is resilient and dependable. Convey this confidence to your colleagues and assure them of a great and enduring future. Present our Boxes PowerPoint Templates because the concept and strategy is your strength. Present our Communication PowerPoint Templates because it is the time to bond with family, friends, colleagues and any other group of your choice.Use these PowerPoint slides for presentations relating to arrow, background, banner, bar, blue, collection, completed, completion, concept, confirmation, design, five, flow, four, graph, graphic, illustration, indication, indicator, information, instruction, interface, internet, layout, measurement, modern, number, one, order, phase, pointer, process, progress, reflection, scale, send, set, shape, stage, status, step, template, three, two, vector, web, web design, web design elements, websites, work flow. The prominent colors used in the PowerPoint template are Blue, Gray, White. The feedback we get is that our illustration of two stages arrow process flowchart program PowerPoint templates are Perfect. PowerPoint presentation experts tell us our completion PowerPoint templates and PPT Slides are Wonderful. People tell us our illustration of two stages arrow process flowchart program PowerPoint templates are Amazing. Professionals tell us our completed PowerPoint templates and PPT Slides are Swanky. You can be sure our illustration of two stages arrow process flowchart program PowerPoint templates are Classic. We assure you our completed PowerPoint templates and PPT Slides are topically designed to provide an attractive backdrop to any subject. In the market,customer is king. Anoint him with our Illustration Of Two Stages Arrow Process Flowchart Program PowerPoint Templates.
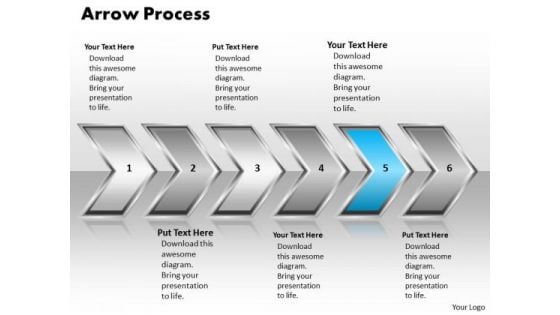
Ppt Pointing Arrow Process 6 Create PowerPoint Macro Templates
PPT pointing arrow process 6 create powerpoint macro Templates-Use this diagram as a method of graphically representing the flow of data as an information processing system. Use this PPT to represent data that is easy to comprehend and analyze. This PowerPoint diagram can be used in strategy, consulting and marketing presentations.-PPT pointing arrow process 6 create powerpoint macro Templates-Aim, Arrow, Arrowheads, Badge, Border, Click, Connection, Curve, Design, Direction, Download, Element, Fuchsia, Icon, Illustration, Indicator, Internet, Magenta, Mark, Object, Orientation, Pointer, Shadow, Shape, Sign There is one thing our Ppt Pointing Arrow Process 6 Create PowerPoint Macro Templates cannot do. They cannot be drab and dreary.
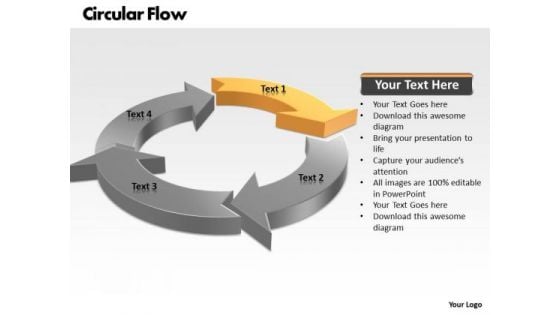
Ppt Circular Flow Process PowerPoint Presentation Chart 4 Stages Templates
PPT circular flow process powerpoint presentation chart 4 stages Templates-The diagrams are used to represent part whole relationship because results relationship etc. this is a 4 parts circle to express your ideas. They are indicators of the path you have in mind.-PPT circular flow process powerpoint presentation chart 4 stages Templates-Arrow, Chart, Circle, Circular, Circulation, Collection, Concept, Connection, Continuity, Cursor, Cycle, Cyclic, Diagram, Direction, Flow, Flowchart, Graph, Graphic, Group, Icon, Motion, Movement, Process, Progress, Recycle, Recycling, Refresh, Reload, Renew, Repetition, Return, Reuse, Ring, Rotation, Round, Sign, Six, Symbol Address eco-clubs with our Ppt Circular Flow Process PowerPoint Presentation Chart 4 Stages Templates. Advocate curbing of carbon emissions.
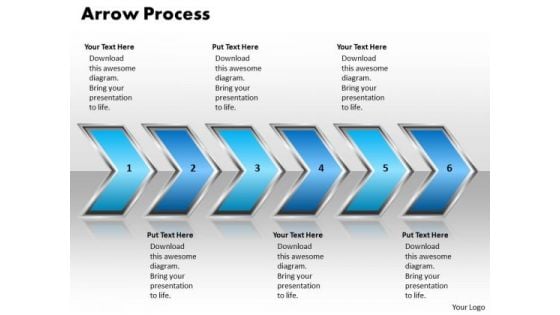
Ppt Arrow Pointing Process 6 Stages PowerPoint Templates
PPT arrow Pointing process 6 stages PowerPoint Templates-Use this diagram to provide a graphical view of different aspects of a business plan and the relationships between them. This diagram depicts process stages in a more understandable and vivid manner. -PPT arrow Pointing process 6 stages PowerPoint Templates-Aim, Arrow, Arrowheads, Badge, Border, Click, Connection, Curve, Design, Direction, Download, Element, Fuchsia, Icon, Illustration, Indicator, Internet, Magenta, Mark, Object, Orientation, Pointer, Shadow, Shape, Sign Give them a big deal with our Ppt Arrow Pointing Process 6 Stages PowerPoint Templates. The audience will be unabashedly appreciative.
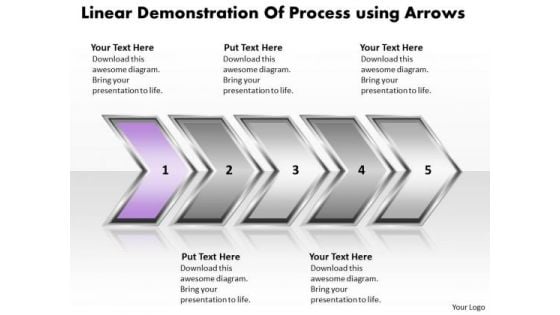
Ppt Linear Demonstration Of Process Business PowerPoint Templates
PPT linear demonstration of process Business PowerPoint Templates-This Diagram makes information accessible throughout the organization with a collective, visible view of critical data from different perspectives and providing the tools to upcoming business scenarios and plan for change. This image has been professionally designed to emphasize the concept of sequential process using vertical arrows.-PPT linear demonstration of process Business PowerPoint Templates-Aim, Arrow, Arrowheads, Badge, Border, Click, Connection, Curve, Design, Direction, Download, Element, Fuchsia, Icon, Illustration, Indicator, Internet, Magenta, Mark, Object, Orientation, Pointer, Shadow, Shape, Sign Exceed expectations with our Ppt Linear Demonstration Of Process Business PowerPoint Templates. Download without worries with our money back guaranteee.
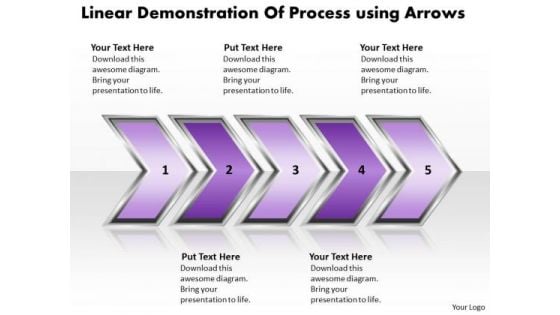
Ppt Linear Demonstration Of Process Using Arrows Business PowerPoint Templates
PPT linear demonstration of process using arrows Business PowerPoint Templates-Use this 3D PowerPoint Diagram to describe three stages of Continuous Process. It portrays beeline, Sequential, even, horizontal, in bee line, linear , nonstop, not crooked, point-blank, right, straight, straightaway, though, true, unbroken etc. You can apply other 3D Styles and shapes to the slide to enhance your presentations.-PPT linear demonstration of process using arrows Business PowerPoint Templates-Aim, Arrow, Arrowheads, Badge, Border, Click, Connection, Curve, Design, Direction, Download, Element, Fuchsia, Icon, Illustration, Indicator, Internet, Magenta, Mark, Object, Orientation, Pointer, Shadow, Shape, Sign Finally find answers with our Ppt Linear Demonstration Of Process Using Arrows Business PowerPoint Templates. Your efforts will culminate in success.
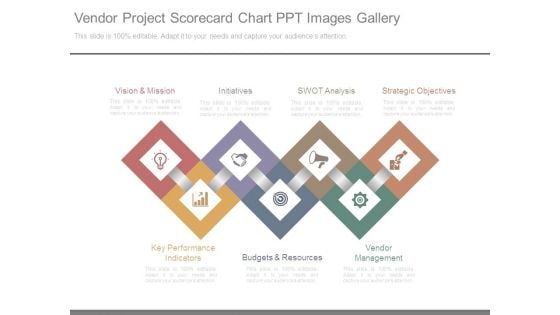
Vendor Project Scorecard Chart Ppt Images Gallery
This is a vendor project scorecard chart ppt images gallery. This is a seven stage process. The stages in this process are vision and mission, initiatives, swot analysis, strategic objectives, vendor management, budgets and resources, key performance indicators.
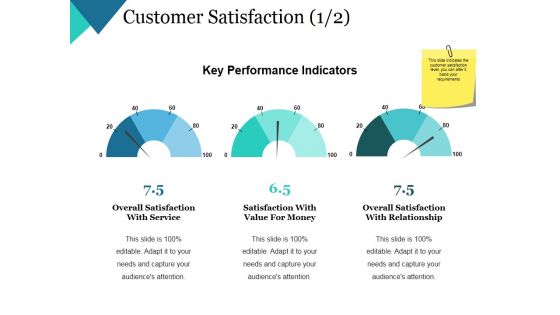
Customer Satisfaction Template 1 Ppt PowerPoint Presentation Pictures Gridlines
This is a customer satisfaction template 1 ppt powerpoint presentation pictures gridlines. This is a three stage process. The stages in this process are key performance indicators, business, management, strategy, dashboard.
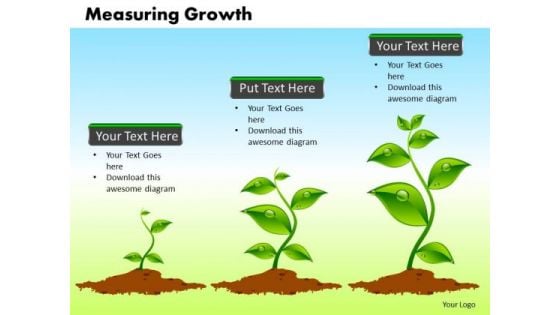
Business Process PowerPoint Templates Business Measuring Growth Ppt Slides
Business Process PowerPoint Templates Business Measuring Growth PPT Slides-This Diagram shows growing plants that is a conceptual representation for measuring growth -Business Process PowerPoint Templates Business Measuring Growth PPT Slides-This template can be used for presentations relating to Accounting, Accounts, Analysis, Business, Capital, Cash, Coins, Concept, Conceptual, Corporate, Data, Detail, Earnings, Evaluate, Finance, Financial, Gains, Golden, Green, Growing, Growth, Hand, Income, Increasing, Indicator, Measuring With our Business Process PowerPoint Templates Business Measuring Growth Ppt Slides there is no dearth of ideas. They crop up everywhere.
Ppt 2 State Diagram Linear Procurement Process PowerPoint Presentation Templates
PPT 2 state diagram linear procurement process powerpoint presentation Templates-Our Template designs are State of the Art. This one depicts the popular linear chart. The structure of our template allows you to effectively highlight the key issues concerning the growth of your business.-PPT 2 state diagram linear procurement process powerpoint presentation Templates-Aim, Arrow, Arrowheads, Badge, Border, Click, Connection, Curve, Design, Direction, Download, Element, Fuchsia, Icon, Illustration, Indicator, Internet, Magenta, Mark, Object, Orientation, Pointer, Shadow, Shape, Sign You know you have the feel for it. Confidently address your audience with our Ppt 2 State Diagram Linear Procurement Process PowerPoint Presentation Templates.
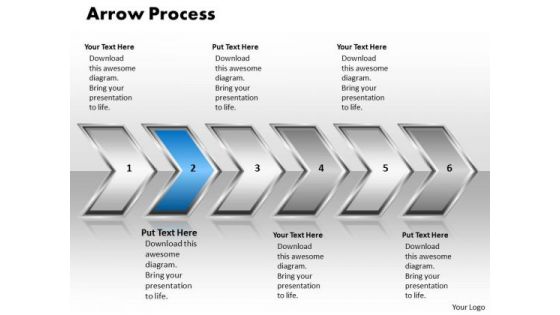
Ppt Arrow Pointing Curved Process 6 Phase Diagram PowerPoint Templates
PPT arrow Pointing curved process 6 phase diagram PowerPoint Templates-Clear thinking is your strength transmits your thoughts to your eager team. Use this diagram to evolve the strategy to take you down the required path with appropriate, efficient and effective marketing along the way.-PPT arrow Pointing curved process 6 phase diagram PowerPoint Templates-Aim, Arrow, Arrowheads, Badge, Border, Click, Connection, Curve, Design, Direction, Download, Element, Fuchsia, Icon, Illustration, Indicator, Internet, Magenta, Mark, Object, Orientation, Pointer, Shadow, Shape, Sign Make the event with our Ppt Arrow Pointing Curved Process 6 Phase Diagram PowerPoint Templates. Your thoughts will be really happening.


 Continue with Email

 Home
Home


