Score Meter
Kpi Leading Indicators Dashboard Diagram Powerpoint Guide
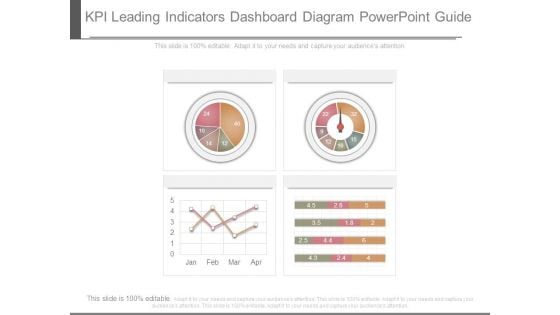
This is a kpi leading indicators dashboard diagram powerpoint guide. This is a four stage process. The stages in this process are business, success, process.

Leading Indicators Operational Ppt Powerpoint Layout
This is a leading indicators operational ppt powerpoint layout. This is a four stage process. The stages in this process are activity based, operational, outcome based, leading indicators.
Current Key Account Management Performance Indicators Pictures PDF
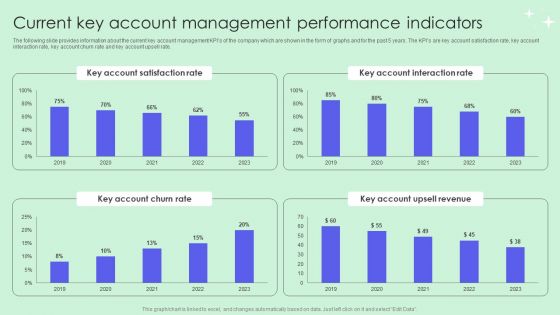
The following slide provides information about the current key account management KPIs of the company which are shown in the form of graphs and for the past 5 years. The KPIs are key account satisfaction rate, key account interaction rate, key account churn rate and key account upsell rate. Are you in need of a template that can accommodate all of your creative concepts This one is crafted professionally and can be altered to fit any style. Use it with Google Slides or PowerPoint. Include striking photographs, symbols, depictions, and other visuals. Fill, move around, or remove text boxes as desired. Test out color palettes and font mixtures. Edit and save your work, or work with colleagues. Download Current Key Account Management Performance Indicators Pictures PDF and observe how to make your presentation outstanding. Give an impeccable presentation to your group and make your presentation unforgettable.
Sustainable Manufacturing Indicators To Manage Production Activities Clipart PDF
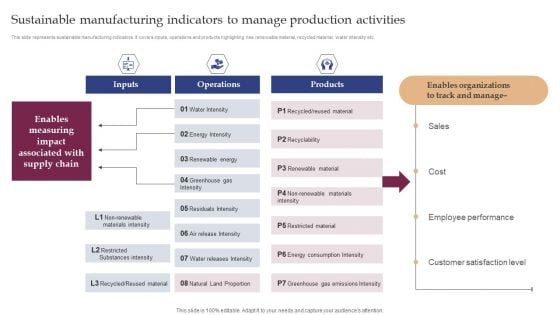
This slide represents sustainable manufacturing indicators. It covers inputs, operations and products highlighting nee renewable material, recycled material, water intensity etc. Boost your pitch with our creative Sustainable Manufacturing Indicators To Manage Production Activities Clipart PDF. Deliver an awe-inspiring pitch that will mesmerize everyone. Using these presentation templates you will surely catch everyones attention. You can browse the ppts collection on our website. We have researchers who are experts at creating the right content for the templates. So you dont have to invest time in any additional work. Just grab the template now and use them.

Call Center Process Key Performance Indicator Dashboard Mockup PDF
This slide showcases call center process measurements and key performance indicators so managers and teams can keep track of and improve performance . It includes received calls, calculating speed of answering calls , ended calls before starting conversations , average calls per minute etc. Showcasing this set of slides titled Call Center Process Key Performance Indicator Dashboard Mockup PDF. The topics addressed in these templates are Received Calls, Conversation, Abandon Rate. All the content presented in this PPT design is completely editable. Download it and make adjustments in color, background, font etc. as per your unique business setting.
Key Performance Indicators Examples Ppt Presentation
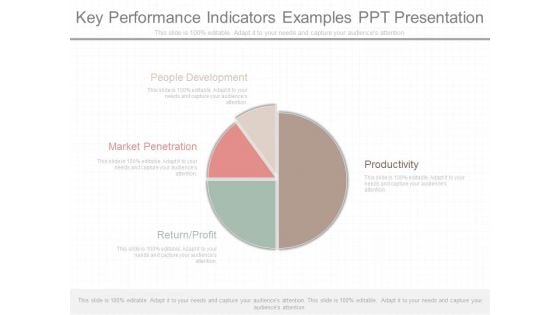
This is a key performance indicators examples ppt presentation. This is a four stage process. The stages in this process are people development, productivity, market penetration, return profit.
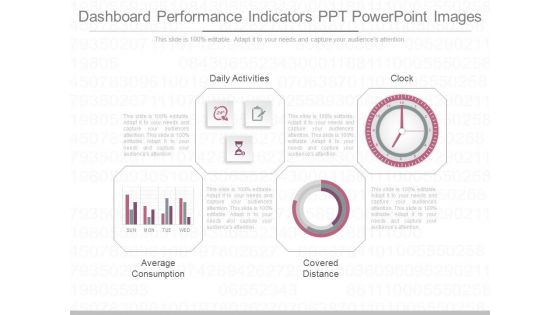
Dashboard Performance Indicators Ppt Powerpoint Images
This is a dashboard performance indicators ppt powerpoint images. This is a four stage process. The stages in this process are daily activities, average consumption, covered distance, clock.
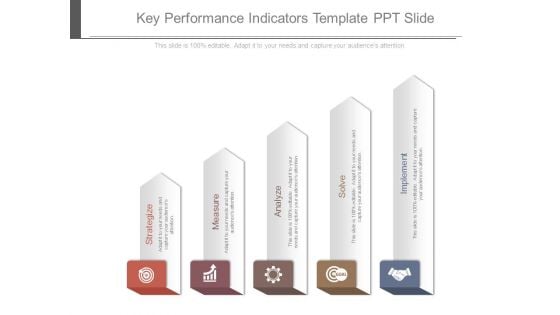
Key Performance Indicators Template Ppt Slide
This is a key performance indicators template ppt slide. This is a five stage process. The stages in this process are strategize, measure, analyze, solve, implement.
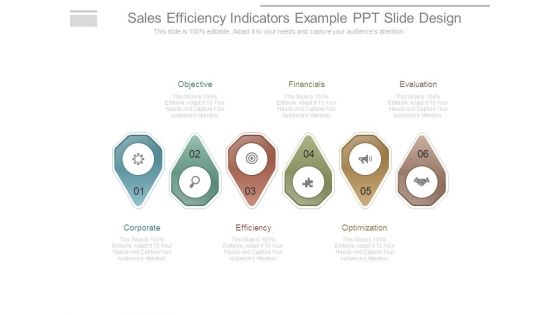
Sales Efficiency Indicators Example Ppt Slide Design
This is a sales efficiency indicators example ppt slide design. This is a six stage process. The stages in this process are objective, financials, evaluation, corporate, efficiency, optimization.
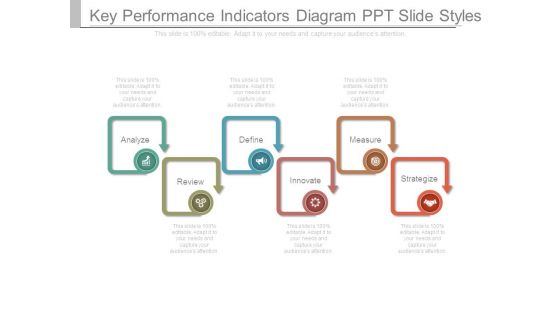
Key Performance Indicators Diagram Ppt Slide Styles
This is a key performance indicators diagram ppt slide styles. This is a six stage process. The stages in this process are analyze, define, measure, review, innovate, strategize.
Key Performance Indicators Table Powerpoint Slide
This is a key performance indicators table powerpoint slide. This is a eight stage process. The stages in this process are business, marketing.
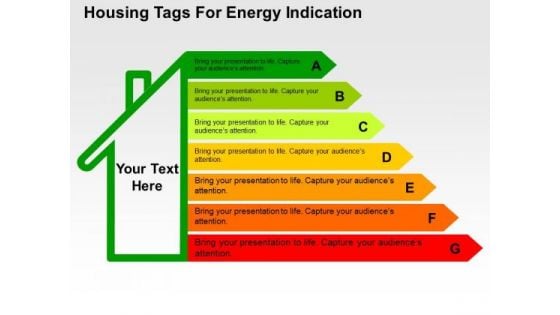
Housing Tags For Energy Indication PowerPoint Template
This business diagram has been designed with graphic of housing tags. This diagram contains the concept of energy saving. This diagram slide can be used to make impressive presentations.
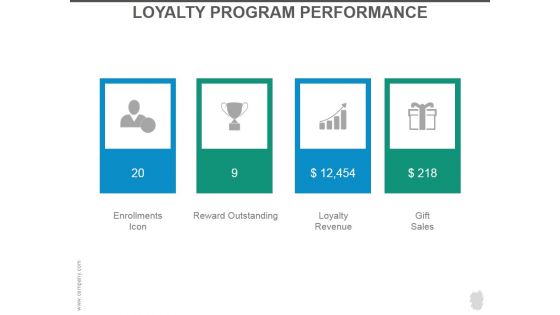
Loyalty Program Performance Ppt PowerPoint Presentation Slides
This is a loyalty program performance ppt powerpoint presentation slides. This is a four stage process. The stages in this process are enrollments icon, reward outstanding, loyalty revenue, gift sales.
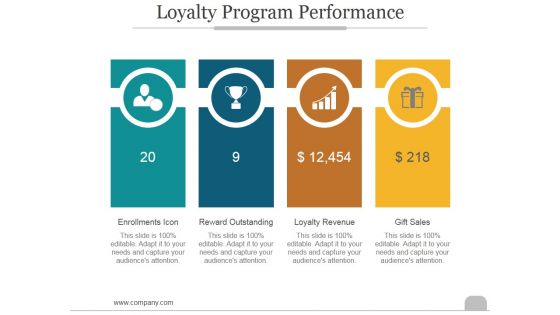
Loyalty Program Performance Ppt PowerPoint Presentation Introduction
This is a loyalty program performance ppt powerpoint presentation introduction. This is a four stage process. The stages in this process are enrollments icon, reward outstanding, loyalty revenue, gift sales.
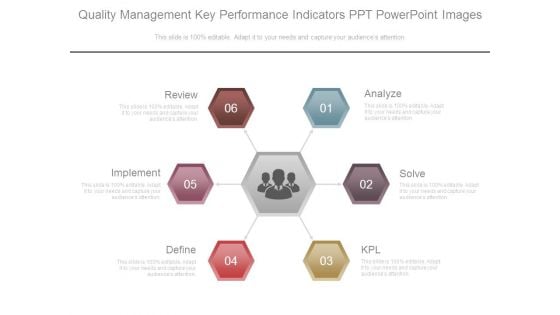
Quality Management Key Performance Indicators Ppt Powerpoint Images
This is a quality management key performance indicators ppt powerpoint images. This is a six stage process. The stages in this process are review, implement, define, kpl, solve, analyze.
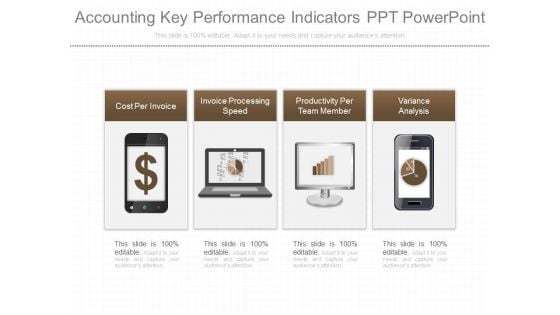
Accounting Key Performance Indicators Ppt Powerpoint
This is a accounting key performance indicators ppt powerpoint. This is a four stage process. The stages in this process are cost per invoice, invoice processing speed, productivity per team member, variance analysis.
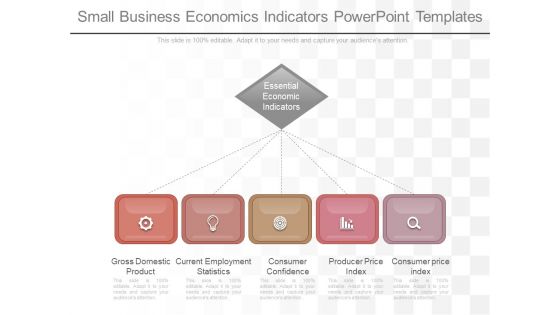
Small Business Economics Indicators Powerpoint Templates
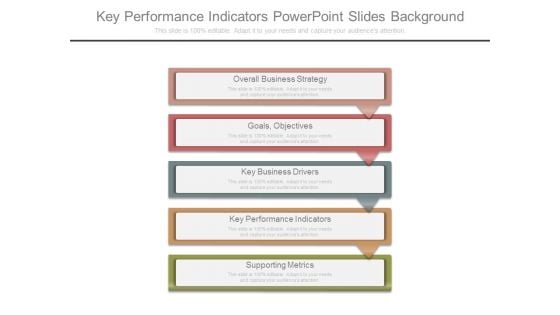
Key Performance Indicators Powerpoint Slides Background
This is a key performance indicators powerpoint slides background. This is a five stage process. The stages in this process are overall business strategy, goals, objectives, key business drivers, key performance indicators, supporting metrics.
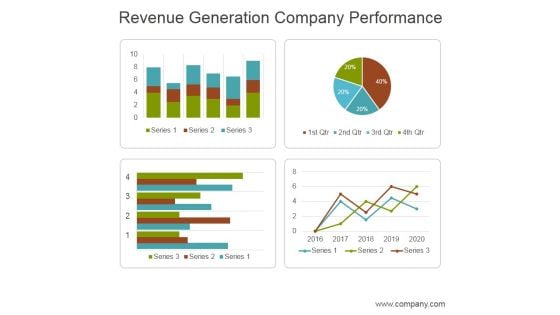
Revenue Generation Company Performance Ppt PowerPoint Presentation Layouts
This is a revenue generation company performance ppt powerpoint presentation layouts. This is a four stage process. The stages in this process are business, marketing, management, revenue, performance.
Company Financial Performance Indicators Dashboard With Working Capital And Cash Conversion Icons PDF
This slide shows dashboard of finance KPIs . It covers working capital, cash conversion cycle, vendor payment error rate ,current assets and liabilities. Showcasing this set of slides titled Company Financial Performance Indicators Dashboard With Working Capital And Cash Conversion Icons PDF. The topics addressed in these templates are Current Working Capital, Current Liabilities, Working Capital. All the content presented in this PPT design is completely editable. Download it and make adjustments in color, background, font etc. as per your unique business setting.
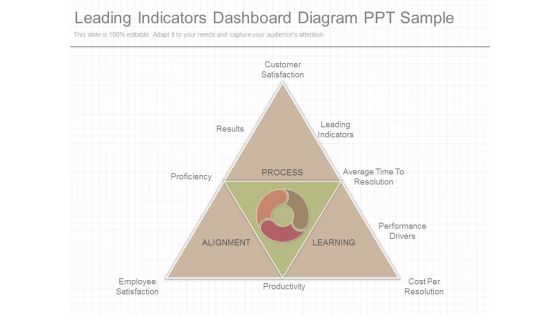
Leading Indicators Dashboard Diagram Ppt Sample
This is a leading indicators dashboard diagram ppt sample. This is a five stage process. The stages in this process are customer satisfaction, leading indicators, average time to resolution, performance drivers, cost per resolution, productivity, employee satisfaction, proficiency, results, process, learning, alignment.

Perspective Performance Indicator Ppt Powerpoint Slide Designs
This is a perspective performance indicator ppt powerpoint slide designs. This is a seven stage process. The stages in this process are performance indicator, perspective, unit, description formula, data source, measurement instrument, method of test how, frequency when, decision criteria, data collector who, owner, baseline, target, process diagram or drawings.
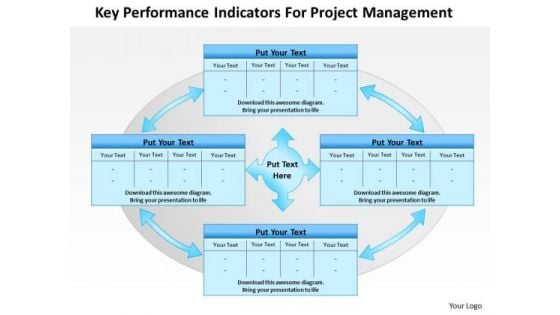
Business Framework Key Performance Indicators For Project Management PowerPoint Presentation
Our above diagram provides framework of key performance indicators for project management. It contains four interconnected text boxes. Download this diagram to make professional presentations on project management. This diagram enables the users to create their own display of the required processes in an easy way.
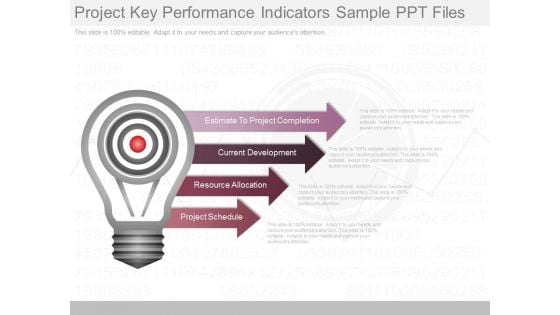
Project Key Performance Indicators Sample Ppt Files
This is a project key performance indicators sample ppt files. This is a four stage process. The stages in this process are estimate to project completion, current development, resource allocation, project schedule.
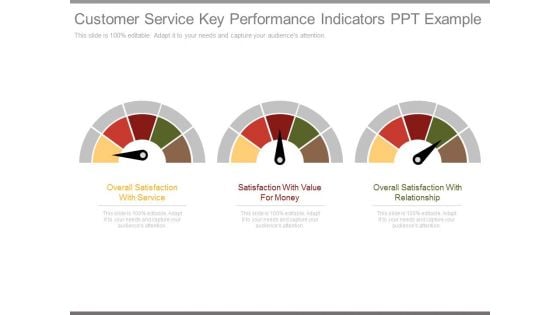
Customer Service Key Performance Indicators Ppt Example
This is a customer service key performance indicators ppt example. This is a three stage process. The stages in this process are overall satisfaction with service, satisfaction with value for money, overall satisfaction with relationship.
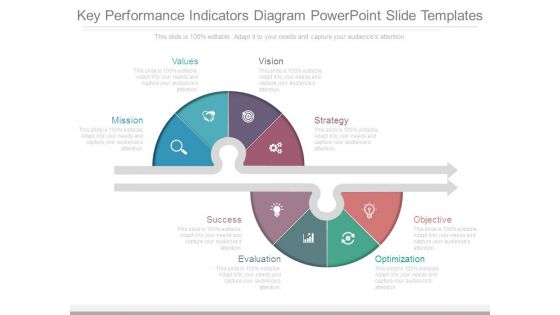
Key Performance Indicators Diagram Powerpoint Slide Templates
This is a key performance indicators diagram powerpoint slide templates. This is a eight stage process. The stages in this process are mission, values, vision, strategy, success, evaluation, optimization, objective.

Indicating Key Targets And Deadline Powerpoint Ideas
This is a indicating key targets and deadline powerpoint ideas. This is a four stage process. The stages in this process are jan, feb, mar, apr, may, jun, jul, aug, sep, oct, nov, dec.
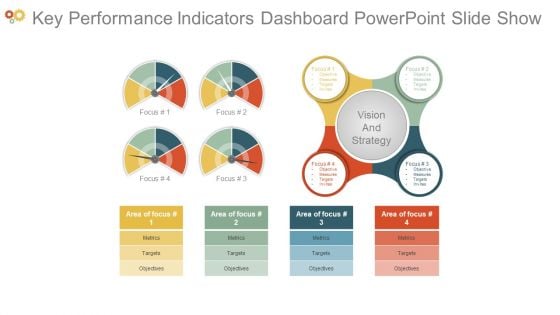
Key Performance Indicators Dashboard Powerpoint Slide Show
This is a key performance indicators dashboard powerpoint slide show. This is a four stage process. The stages in this process are focus, objective, measures, targets, invites, vision and strategy, area of focus, metrics, objectives.
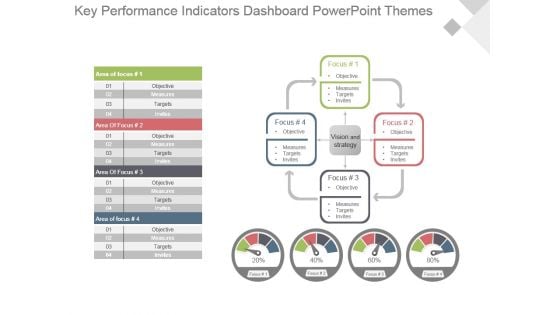
Key Performance Indicators Dashboard Powerpoint Themes
This is a key performance indicators dashboard powerpoint themes. This is a four stage process. The stages in this process are focus, objective, measures, targets, invites, vision and strategy, area of focus.
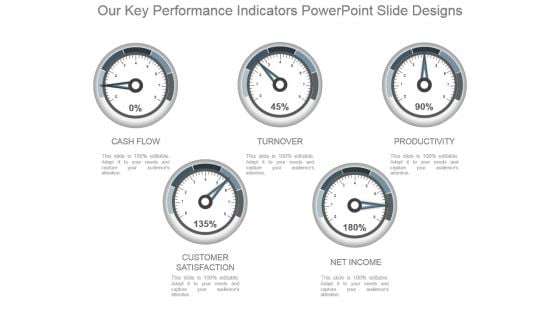
Our Key Performance Indicators Powerpoint Slide Designs
This is a our key performance indicators powerpoint slide designs. This is a five stage process. The stages in this process are cash flow, turnover, productivity, customer satisfaction, net income.
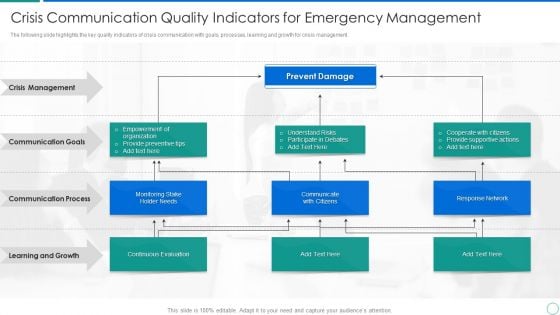
Crisis Communication Quality Indicators For Emergency Management Pictures PDF
The following slide highlights the key quality indicators of crisis communication with goals, processes, learning and growth for crisis management. Showcasing this set of slides titled crisis communication quality indicators for emergency management pictures pdf. The topics addressed in these templates are communication process, learning and growth, communication goals. All the content presented in this PPT design is completely editable. Download it and make adjustments in color, background, font etc. as per your unique business setting.
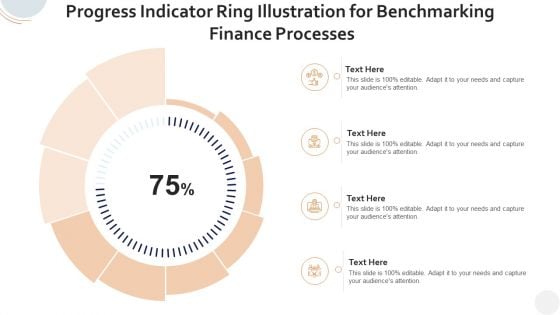
Progress Indicator Ring Illustration For Benchmarking Finance Processes Clipart PDF
Pitch your topic with ease and precision using this progress indicator ring illustration for benchmarking finance processes clipart pdf. This layout presents information on progress indicator ring illustration for benchmarking finance processes. It is also available for immediate download and adjustment. So, changes can be made in the color, design, graphics or any other component to create a unique layout.
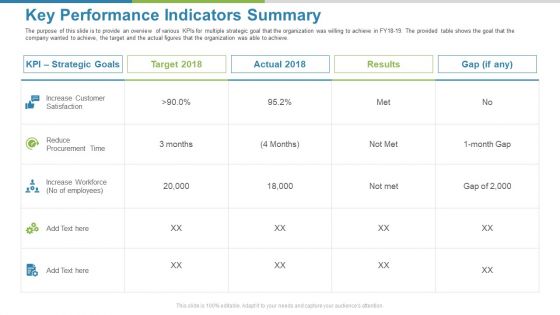
Work Execution Liability Key Performance Indicators Summary Ppt Show Slides PDF
The purpose of this slide is to provide an overview of various KPIs for multiple strategic goal that the organization was willing to achieve in FY18-19. The provided table shows the goal that the company wanted to achieve, the target and the actual figures that the organization was able to achieve. Deliver and pitch your topic in the best possible manner with this work execution liability key performance indicators summary ppt show slides pdf. Use them to share invaluable insights on strategic goals, target, actual, results, gap and impress your audience. This template can be altered and modified as per your expectations. So, grab it now.
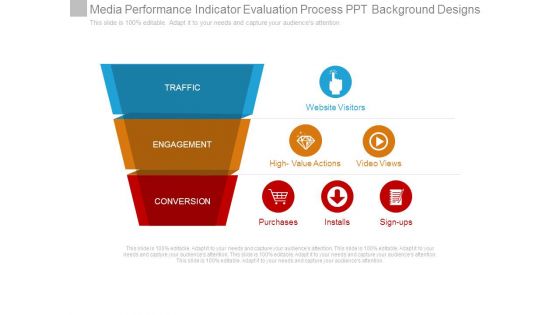
Media Performance Indicator Evaluation Process Ppt Background Designs
This is a media performance indicator evaluation process ppt background designs. This is a three stage process. The stages in this process are traffic, engagement, conversion, website visitors, high value actions, video views, purchases, installs, sign ups.
Sales Order Processing Performance Tracking Indicators Graphics PDF
The following slide showcases key performance indicators for sales order fulfilment to meet customer expectations, specifications, deliver goods on time, compare order fulfilment against past orders. It includes elements such as category, key performance indicators, expected rate and actual rate. Showcasing this set of slides titled Sales Order Processing Performance Tracking Indicators Graphics PDF. The topics addressed in these templates are Customer Metrics, Inbound Metrics, Financial Metrics. All the content presented in this PPT design is completely editable. Download it and make adjustments in color, background, font etc. as per your unique business setting.
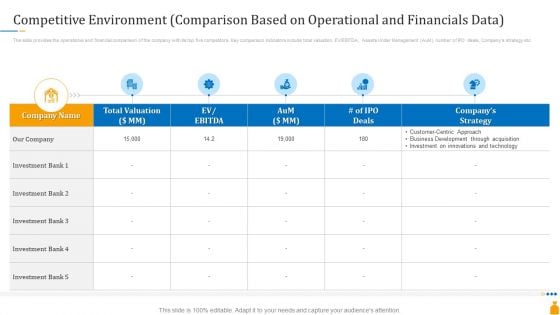
Financial Banking PPT Competitive Environment Comparison Based On Operational And Financials Data Mockup PDF
The slide provides the operational and financial comparison of the company with its top five competitors. Key comparison indicators include total valuation, EV or EBITDA, Assets Under Management AuM, number of IPO deals, Companys strategy etc. Deliver an awe-inspiring pitch with this creative financial banking ppt competitive environment comparison based on operational and financials data mockup pdf bundle. Topics like operational, financial comparison, key comparison, management, strategy can be discussed with this completely editable template. It is available for immediate download depending on the needs and requirements of the user.
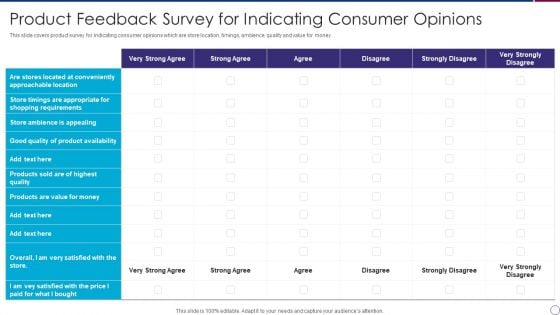
Product Feedback Survey For Indicating Consumer Opinions Diagrams PDF
This slide covers product survey for indicating consumer opinions which are store location, timings, ambience, quality and value for money.Showcasing this set of slides titled Product Feedback Survey For Indicating Consumer Opinions Diagrams PDF The topics addressed in these templates are Approachable Location, Product Availability, Ambience Appealing All the content presented in this PPT design is completely editable. Download it and make adjustments in color, background, font etc. as per your unique business setting.
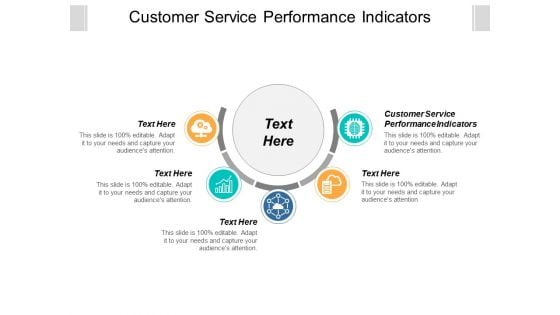
Customer Service Performance Indicators Ppt Powerpoint Presentation Ideas Slide Cpb
This is a customer service performance indicators ppt powerpoint presentation ideas slide cpb. This is a five stage process. The stages in this process are customer service performance indicators.
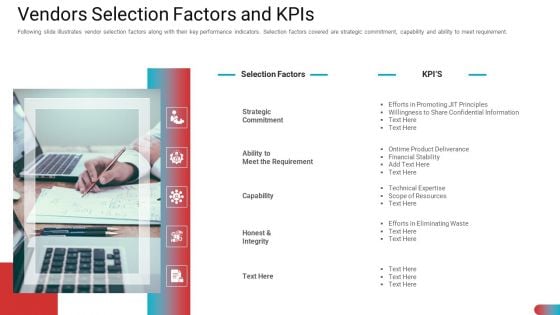
Benchmarking Vendor Operation Control Procedure Vendors Selection Factors And Kpis Background PDF
Following slide illustrates vendor selection factors along with their key performance indicators. Selection factors covered are strategic commitment, capability and ability to meet requirement. This is abenchmarking vendor operation control procedure vendors selection factors and kpis background pdf. template with various stages. Focus and dispense information on five stages using this creative set, that comes with editable features. It contains large content boxes to add your information on topics like strategic commitment, honest and integrity, ability to meet the requirement . You can also showcase facts, figures, and other relevant content using this PPT layout. Grab it now.
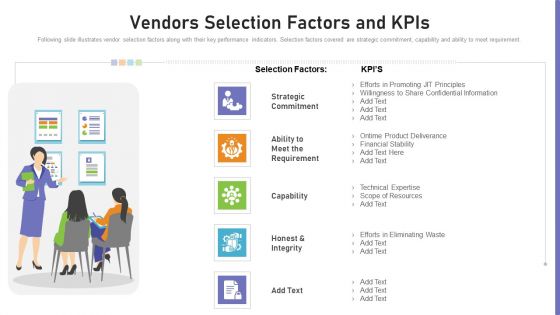
Benchmarking Supplier Operation Control Procedure Vendors Selection Factors And Kpis Demonstration PDF
Following slide illustrates vendor selection factors along with their key performance indicators. Selection factors covered are strategic commitment, capability and ability to meet requirement. This is a benchmarking supplier operation control procedure vendors selection factors and kpis demonstration pdf template with various stages. Focus and dispense information on five stages using this creative set, that comes with editable features. It contains large content boxes to add your information on topics like capability, strategic commitment. You can also showcase facts, figures, and other relevant content using this PPT layout. Grab it now.
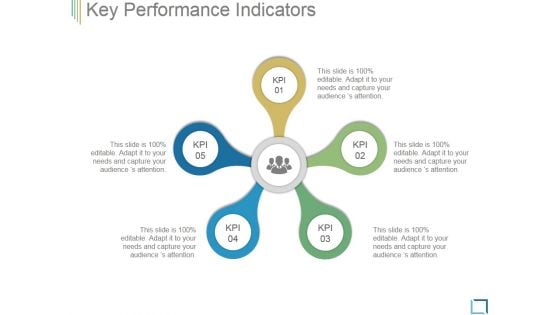
Key Performance Indicators Template 1 Ppt PowerPoint Presentation Background Designs
This is a key performance indicators template 1 ppt powerpoint presentation background designs. This is a five stage process. The stages in this process are business, management, process, strategy, success.
Performance Indicators Business Ppt PowerPoint Presentation Inspiration Design Templates
This is a performance indicators business ppt powerpoint presentation inspiration design templates. This is a four stage process. The stages in this process are performance indicators business.
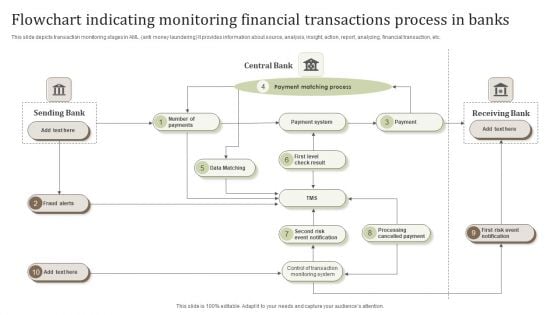
Flowchart Indicating Monitoring Financial Transactions Process In Banks Pictures PDF
This slide depicts transaction monitoring stages in AML anti money laundering It provides information about source, analysis, insight, action, report, analyzing, financial transaction, etc.Persuade your audience using this Flowchart Indicating Monitoring Financial Transactions Process In Banks Pictures PDF. This PPT design covers one stage, thus making it a great tool to use. It also caters to a variety of topics including Payment Matching Process, Cancelled Payment, Cancelled Payment. Download this PPT design now to present a convincing pitch that not only emphasizes the topic but also showcases your presentation skills.
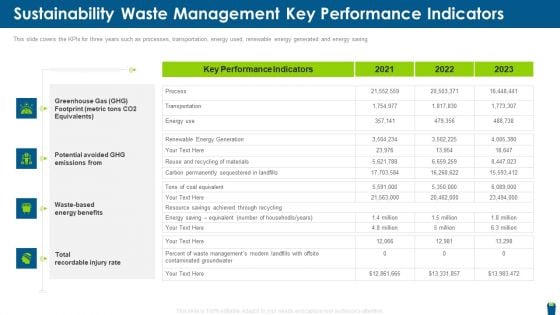
Sustainability Waste Management Key Performance Indicators Summary PDF
This slide covers the KPIs for three years such as processes, transportation, energy used, renewable energy generated and energy saving. Deliver an awe inspiring pitch with this creative sustainability waste management key performance indicators summary pdf bundle. Topics like metric, equivalent, rate, management, performance can be discussed with this completely editable template. It is available for immediate download depending on the needs and requirements of the user.
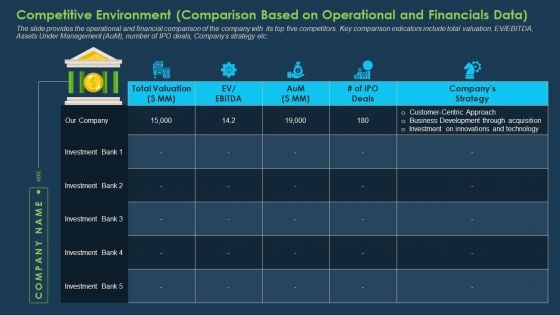
Competitive Environment Comparison Based On Operational And Financials Data Designs PDF
The slide provides the operational and financial comparison of the company with its top five competitors. Key comparison indicators include total valuation, EV or EBITDA, Assets Under Management AuM, number of IPO deals, Companys strategy etc. Deliver and pitch your topic in the best possible manner with this competitive environment comparison based on operational and financials data designs pdf. Use them to share invaluable insights on competitive environment, comparison, operational and financials data and impress your audience. This template can be altered and modified as per your expectations. So, grab it now.
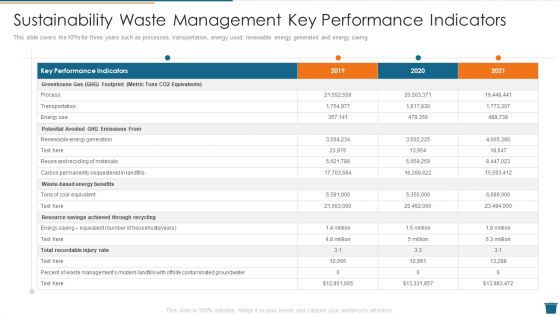
Sustainability Waste Management Key Performance Indicators Inspiration PDF
This slide covers the KPIs for three years such as processes, transportation, energy used, renewable energy generated and energy saving Deliver and pitch your topic in the best possible manner with this sustainability waste management key performance indicators inspiration pdf. Use them to share invaluable insights on recycling of materials, achieved, potential and impress your audience. This template can be altered and modified as per your expectations. So, grab it now.
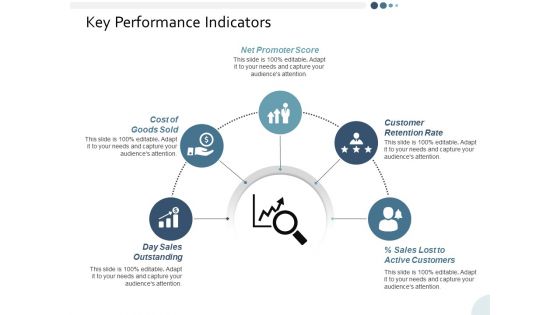
Key Performance Indicators Ppt PowerPoint Presentation Gallery Gridlines
This is a key performance indicators ppt powerpoint presentation gallery gridlines. This is a five stage process. The stages in this process are business, management, strategy, analysis, icons.
Painpoints Icon Indicating Poor Customer Experience Mockup PDF
Showcasing this set of slides titled painpoints icon indicating poor customer experience mockup pdf. The topics addressed in these templates are painpoints icon indicating poor customer experience. All the content presented in this PPT design is completely editable. Download it and make adjustments in color, background, font etc. as per your unique business setting.
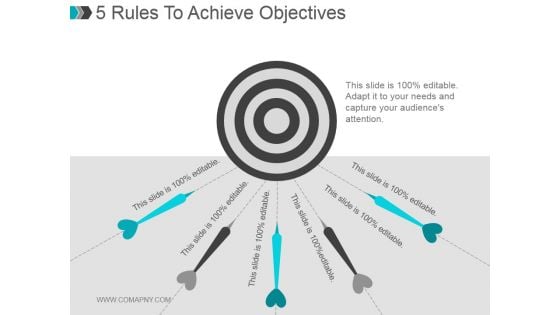
5 Rules To Achieve Objectives Ppt PowerPoint Presentation Slide
This is a 5 rules to achieve objectives ppt powerpoint presentation slide. This is a one stage process. The stages in this process are business, arrows, target, strategy, success.
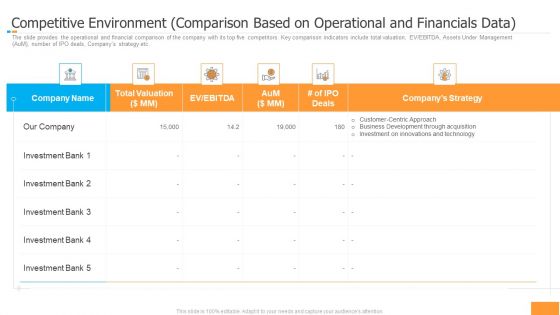
Funding Pitch Book Outline Competitive Environment Comparison Based On Operational And Financials Data Portrait PDF
The slide provides the operational and financial comparison of the company with its top five competitors. Key comparison indicators include total valuation, EV or EBITDA, Assets Under Management AuM, number of IPO deals, Companys strategy etc. Deliver an awe inspiring pitch with this creative funding pitch book outline competitive environment comparison based on operational and financials data portrait pdf bundle. Topics like investment, business, development, technology, innovations can be discussed with this completely editable template. It is available for immediate download depending on the needs and requirements of the user.
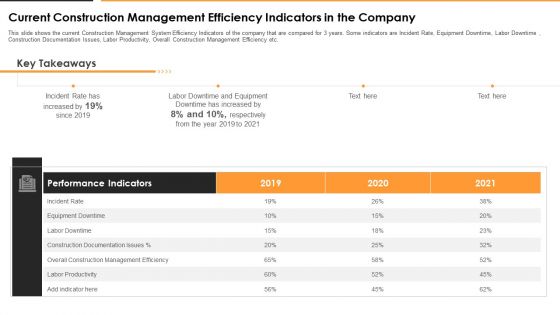
Current Construction Management Efficiency Indicators In The Company Brochure PDF
This slide shows the current Construction Management System Efficiency Indicators of the company that are compared for 3 years. Some indicators are Incident Rate, Equipment Downtime, Labor Downtime , Construction Documentation Issues, Labor Productivity, Overall Construction Management Efficiency etc. Deliver and pitch your topic in the best possible manner with this current construction management efficiency indicators in the company brochure pdf. Use them to share invaluable insights on performance indicators, incident rate, equipment downtime, management and impress your audience. This template can be altered and modified as per your expectations. So, grab it now.
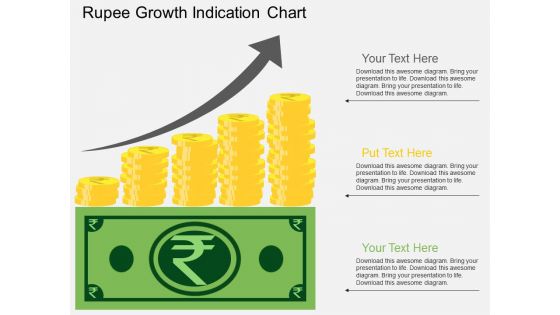
Rupee Growth Indication Chart Powerpoint Template
This business diagram displays rupee growth chart. This business diagram has been designed to implement strategic plan. Use this diagram to depict financial planning process in your presentations.
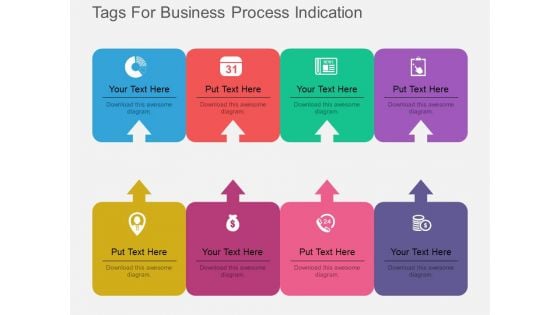
Eight Tags For Business Process Indication Powerpoint Template
Our above PPT slide contains graphics of eight text tags with icons. This PowerPoint template may be used to display business process steps. Use this diagram to impart more clarity to data and to create more sound impact on viewers.
Business Meeting Plan Icon Indicating Manager Presenting Objectives Diagrams PDF
Pitch your topic with ease and precision using this business meeting plan icon indicating manager presenting objectives diagrams pdf This layout presents information on business meeting plan icon indicating manager presenting objectives It is also available for immediate download and adjustment. So, changes can be made in the color, design, graphics or any other component to create a unique layout.
Performance Coaching Icon Indicating Manager Giving Improvement Advice Topics PDF
Presenting Performance Coaching Icon Indicating Manager Giving Improvement Advice Topics PDF to dispense important information. This template comprises three stages. It also presents valuable insights into the topics including Performance Coaching, Icon Indicating Manager, Giving Improvement Advice. This is a completely customizable PowerPoint theme that can be put to use immediately. So, download it and address the topic impactfully.
Risk Management Icon Indicating Threat Assessment Download PDF
Presenting Risk Management Icon Indicating Threat Assessment Download PDF to dispense important information. This template comprises four stages. It also presents valuable insights into the topics including Risk Management Icon Indicating, Threat Assessment. This is a completely customizable PowerPoint theme that can be put to use immediately. So, download it and address the topic impactfully.
Enterprise Risk Management Report With Key Indicators Icon Inspiration PDF
Presenting Enterprise Risk Management Report With Key Indicators Icon Inspiration PDF to dispense important information. This template comprises three stages. It also presents valuable insights into the topics including Enterprise Risk Management Report, Key Indicators Icon. This is a completely customizable PowerPoint theme that can be put to use immediately. So, download it and address the topic impactfully.
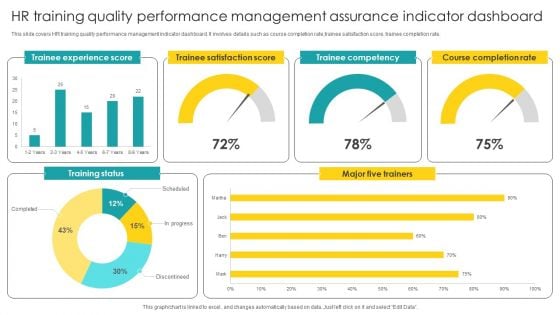
HR Training Quality Performance Management Assurance Indicator Dashboard Structure PDF
Showcasing this set of slides titled HR Training Quality Performance Management Assurance Indicator Dashboard Structure PDF. The topics addressed in these templates are Performance Management, Assurance Indicator Dashboard. All the content presented in this PPT design is completely editable. Download it and make adjustments in color, background, font etc. as per your unique business setting.
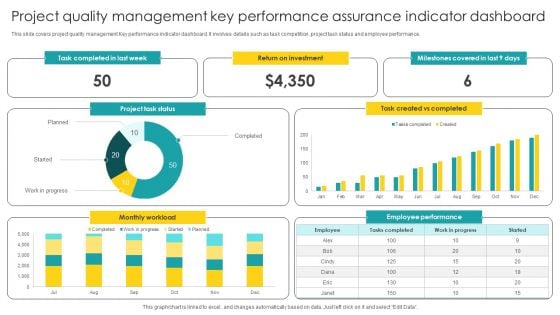
Project Quality Management Key Performance Assurance Indicator Dashboard Guidelines PDF
Pitch your topic with ease and precision using this Project Quality Management Key Performance Assurance Indicator Dashboard Guidelines PDF. This layout presents information on Management Key, Performance Assurance, Indicator Dashboard. It is also available for immediate download and adjustment. So, changes can be made in the color, design, graphics or any other component to create a unique layout.
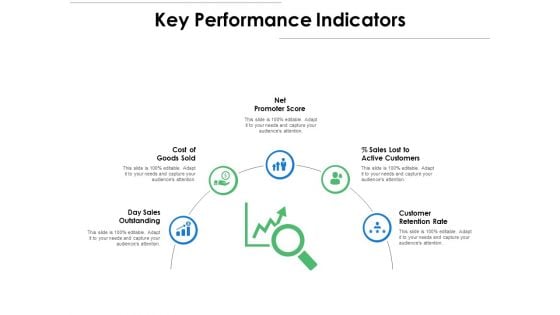
Key Performance Indicators Ppt PowerPoint Presentation Show Graphics Design
Presenting this set of slides with name key performance indicators ppt powerpoint presentation show graphics design. This is a five stage process. The stages in this process are business, management, planning, strategy, marketing. This is a completely editable PowerPoint presentation and is available for immediate download. Download now and impress your audience.


 Continue with Email

 Home
Home


