Score Meter
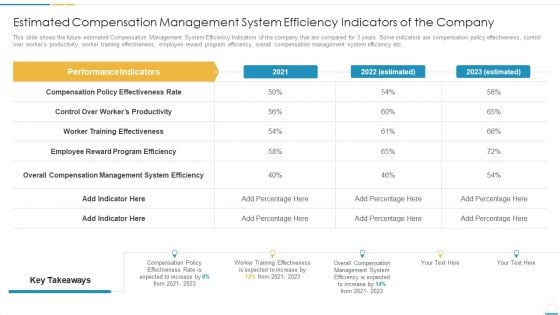
Estimated Compensation Management System Efficiency Indicators Of The Company Formats PDF
This slide shows the future estimated Compensation Management System Efficiency Indicators of the company that are compared for 3 years. Some indicators are compensation policy effectiveness, control over workers productivity, worker training effectiveness, employee reward program efficiency, overall compensation management system efficiency etc. Deliver and pitch your topic in the best possible manner with this estimated compensation management system efficiency indicators of the company formats pdf. Use them to share invaluable insights on management system, productivity, rate and impress your audience. This template can be altered and modified as per your expectations. So, grab it now.
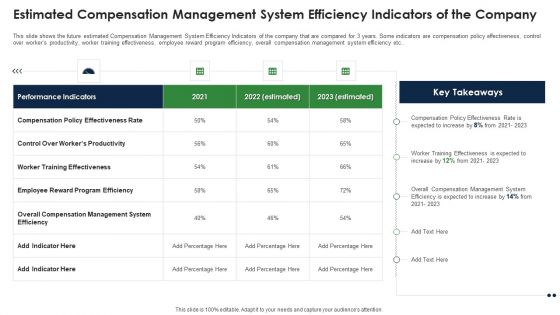
Estimated Compensation Management System Efficiency Indicators Of The Company Diagrams PDF
This slide shows the future estimated Compensation Management System Efficiency Indicators of the company that are compared for 3 years. Some indicators are compensation policy effectiveness, control over workers productivity, worker training effectiveness, employee reward program efficiency, overall compensation management system efficiency etc. Deliver an awe inspiring pitch with this creative estimated compensation management system efficiency indicators of the company diagrams pdf bundle. Topics like compensation, effectiveness, training, management can be discussed with this completely editable template. It is available for immediate download depending on the needs and requirements of the user.
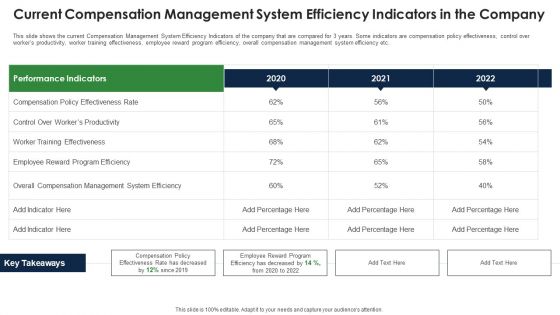
Current Compensation Management System Efficiency Indicators In The Company Template PDF
This slide shows the current Compensation Management System Efficiency Indicators of the company that are compared for 3 years. Some indicators are compensation policy effectiveness, control over workers productivity, worker training effectiveness, employee reward program efficiency, overall compensation management system efficiency etc. Deliver an awe inspiring pitch with this creative current compensation management system efficiency indicators in the company template pdf bundle. Topics like compensation, effectiveness, compensation, performance can be discussed with this completely editable template. It is available for immediate download depending on the needs and requirements of the user.
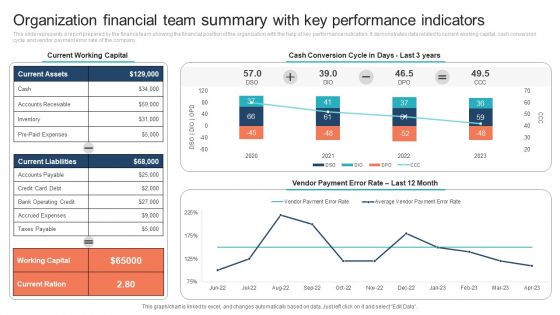
Organization Financial Team Summary With Key Performance Indicators Clipart PDF
This slide represents a report prepared by the finance team showing the financial position of the organization with the help of key performance indicators. It demonstrates data related to current working capital, cash conversion cycle and vendor payment error rate of the company. Pitch your topic with ease and precision using this Organization Financial Team Summary With Key Performance Indicators Clipart PDF. This layout presents information on Current Working Capital, Cash Conversion Cycle. It is also available for immediate download and adjustment. So, changes can be made in the color, design, graphics or any other component to create a unique layout.
IT Performance Indicators Ppt PowerPoint Presentation Styles Graphic Tips Cpb
Presenting this set of slides with name it performance indicators ppt powerpoint presentation styles graphic tips cpb. This is an editable Powerpoint five stages graphic that deals with topics like it performance indicators to help convey your message better graphically. This product is a premium product available for immediate download and is 100 percent editable in Powerpoint. Download this now and use it in your presentations to impress your audience.
Sales Key Performance Indicators Ppt PowerPoint Presentation Professional Portfolio Cpb
Presenting this set of slides with name sales key performance indicators ppt powerpoint presentation professional portfolio cpb. This is an editable Powerpoint two stages graphic that deals with topics like sales key performance indicators to help convey your message better graphically. This product is a premium product available for immediate download and is 100 percent editable in Powerpoint. Download this now and use it in your presentations to impress your audience.

Small Business Economic Indicators Ppt PowerPoint Presentation Summary Gridlines Cpb
Presenting this set of slides with name small business economic indicators ppt powerpoint presentation summary gridlines cpb. This is an editable Powerpoint four stages graphic that deals with topics like small business economic indicators to help convey your message better graphically. This product is a premium product available for immediate download and is 100 percent editable in Powerpoint. Download this now and use it in your presentations to impress your audience.
Matrix Capturing Quality Indicators Ppt PowerPoint Presentation Guide Cpb Pdf
Presenting this set of slides with name matrix capturing quality indicators ppt powerpoint presentation guide cpb pdf. This is an editable Powerpoint four stages graphic that deals with topics like matrix capturing quality indicators to help convey your message better graphically. This product is a premium product available for immediate download and is 100 percent editable in Powerpoint. Download this now and use it in your presentations to impress your audience.
Mitigating Cybersecurity Threats And Vulnerabilities Addressing Indicators Associated Icons PDF
This slide provides details regarding indicators associated to insider threats in terms of traits, demeanor and goals, etc. Presenting mitigating cybersecurity threats and vulnerabilities addressing indicators associated icons pdf to provide visual cues and insights. Share and navigate important information on four stages that need your due attention. This template can be used to pitch topics like user accounts, authentication levels, data exfiltration. In addtion, this PPT design contains high resolution images, graphics, etc, that are easily editable and available for immediate download.
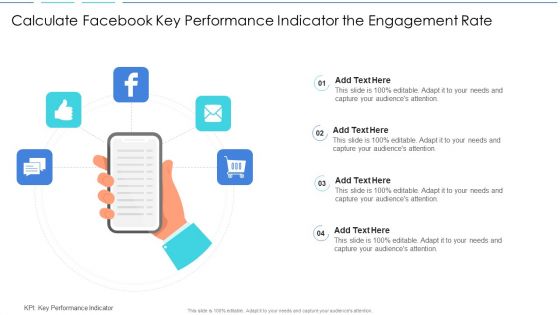
Calculate Facebook Key Performance Indicator The Engagement Rate Background PDF
Persuade your audience using this calculate facebook key performance indicator the engagement rate background pdf. This PPT design covers four stages, thus making it a great tool to use. It also caters to a variety of topics including calculate facebook key performance indicator the engagement rate. Download this PPT design now to present a convincing pitch that not only emphasizes the topic but also showcases your presentation skills.
Icon For Risk Metrics Performance Indicators Dashboard Designs PDF
Persuade your audience using this Icon For Risk Metrics Performance Indicators Dashboard Designs PDF. This PPT design covers four stages, thus making it a great tool to use. It also caters to a variety of topics including Icon For Risk Metrics Performance Indicators Dashboard. Download this PPT design now to present a convincing pitch that not only emphasizes the topic but also showcases your presentation skills.
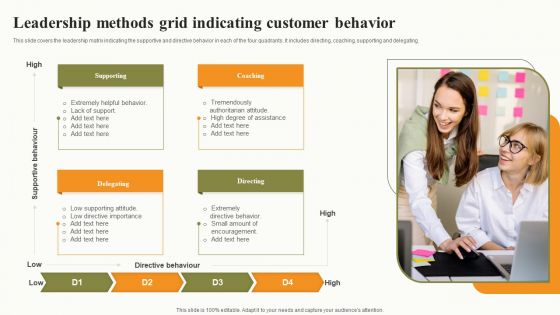
Leadership Methods Grid Indicating Customer Behavior Graphics PDF
This slide covers the leadership matrix indicating the supportive and directive behavior in each of the four quadrants. It includes directing, coaching, supporting and delegating. Presenting Leadership Methods Grid Indicating Customer Behavior Graphics PDF to dispense important information. This template comprises four stages. It also presents valuable insights into the topics including Directing, Supporting, Coaching, Delegating. This is a completely customizable PowerPoint theme that can be put to use immediately. So, download it and address the topic impactfully.
Indication Traffic Direction PowerPoint Slides And Ppt Diagram Templates
Indication Traffic Direction PowerPoint Slides And PPT Diagram Templates-These high quality powerpoint pre-designed slides and powerpoint templates have been carefully created by our professional team to help you impress your audience. All slides have been created and are 100% editable in powerpoint. Each and every property of any graphic - color, size, orientation, shading, outline etc. can be modified to help you build an effective powerpoint presentation. Any text can be entered at any point in the powerpoint template or slide. Simply DOWNLOAD, TYPE and PRESENT! Decrease conflict with your thoughts.Enable communication with our Indication Traffic Direction PowerPoint Slides And Ppt Diagram Templates.
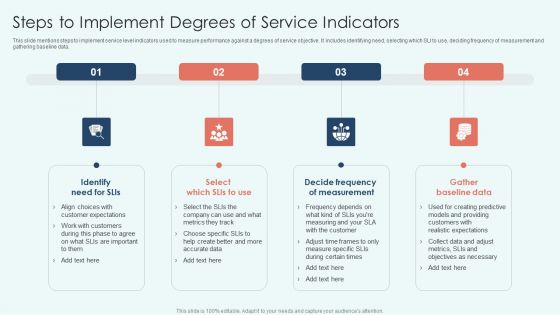
Steps To Implement Degrees Of Service Indicators Clipart PDF
This slide mentions steps to implement service level indicators used to measure performance against a degrees of service objective. It includes identifying need, selecting which SLI to use, deciding frequency of measurement and gathering baseline data.Persuade your audience using this Steps To Implement Degrees Of Service Indicators Clipart PDF. This PPT design covers three stages, thus making it a great tool to use. It also caters to a variety of topics including Decide Frequency, Gather Baseline, Objectives Necessary. Download this PPT design now to present a convincing pitch that not only emphasizes the topic but also showcases your presentation skills.
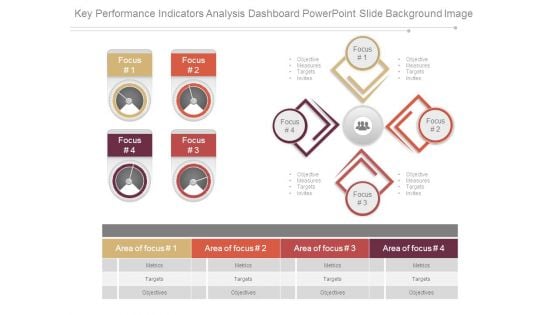
Key Performance Indicators Analysis Dashboard Powerpoint Slide Background Image
This is a key performance indicators analysis dashboard powerpoint slide background image. This is a four stage process. The stages in this process are focus, objective measures targets invites, area of focus, metrics, targets, objectives.
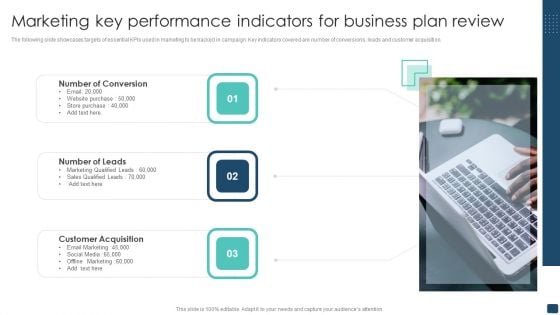
Marketing Key Performance Indicators For Business Plan Review Template PDF
The following slide showcases targets of essential KPIs used in marketing to be tracked in campaign. Key indicators covered are number of conversions, leads and customer acquisition. Presenting Marketing Key Performance Indicators For Business Plan Review Template PDF to dispense important information. This template comprises three stages. It also presents valuable insights into the topics including Number Of Conversion, Number Of Leads, Customer Acquisition. This is a completely customizable PowerPoint theme that can be put to use immediately. So, download it and address the topic impactfully.
Pharmaceutical Marketing Strategies Key Performance Indicators Icons PDF
Presenting pharmaceutical marketing strategies key performance indicators icons pdf to provide visual cues and insights. Share and navigate important information on three stages that need your due attention. This template can be used to pitch topics like organizational readiness, market readiness, launch success. In addtion, this PPT design contains high resolution images, graphics, etc, that are easily editable and available for immediate download.
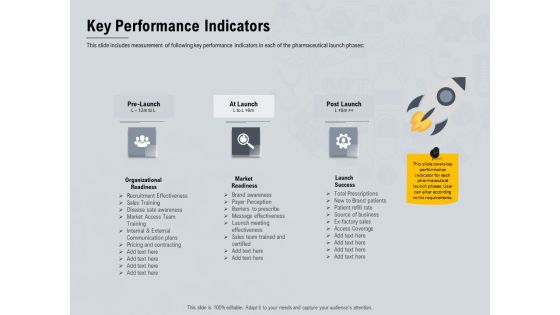
Healthcare Merchandising Key Performance Indicators Ppt Portfolio Maker PDF
Presenting healthcare merchandising key performance indicators ppt portfolio maker pdf to provide visual cues and insights. Share and navigate important information on three stages that need your due attention. This template can be used to pitch topics like organizational readiness, market readiness, launch success. In addtion, this PPT design contains high resolution images, graphics, etc, that are easily editable and available for immediate download.
Sales By Lead Source Performance Indicator Icons PDF
Are you in need of a template that can accommodate all of your creative concepts This one is crafted professionally and can be altered to fit any style. Use it with Google Slides or PowerPoint. Include striking photographs, symbols, depictions, and other visuals. Fill, move around, or remove text boxes as desired. Test out color palettes and font mixtures. Edit and save your work, or work with colleagues. Download Sales By Lead Source Performance Indicator Icons PDF and observe how to make your presentation outstanding. Give an impeccable presentation to your group and make your presentation unforgettable.
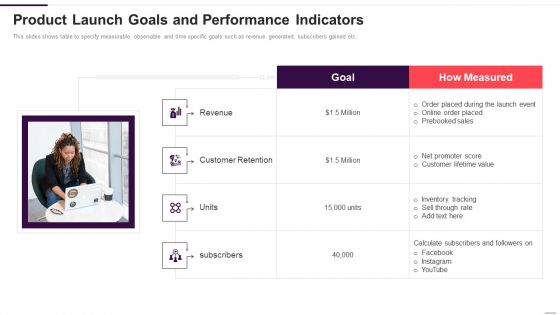
Product Launch Goals And Performance Indicators Guidelines PDF
This slides shows table to specify measurable, observable and time specific goals such as revenue generated, subscribers gained etc. This is a product launch goals and performance indicators guidelines pdf template with various stages. Focus and dispense information on one stages using this creative set, that comes with editable features. It contains large content boxes to add your information on topics like revenue, goal, customer retention. You can also showcase facts, figures, and other relevant content using this PPT layout. Grab it now.

Performance Indicators Of PPC Marketing Campaigns Themes PDF
This slide exhibits elements of pay per click campaigns that helps to increase website advertisement traffic. It contains three points search engine marketing, ad rank and cost per mille. Presenting Performance Indicators Of PPC Marketing Campaigns Themes PDF to dispense important information. This template comprises three stages. It also presents valuable insights into the topics including Determines, Search Engine Marketing, Advertisement. This is a completely customizable PowerPoint theme that can be put to use immediately. So, download it and address the topic impactfully.
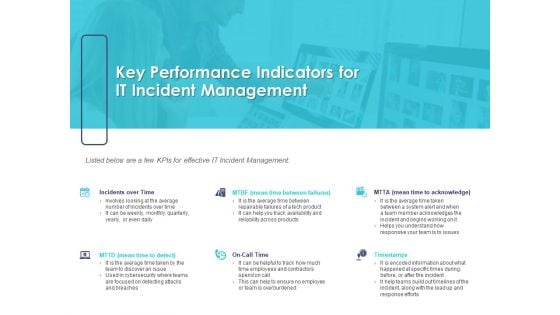
Managing ITIL Incidents Planning Key Performance Indicators For IT Incident Management Diagrams PDF
Presenting this set of slides with name managing itil incidents planning key performance indicators for it incident management diagrams pdf. This is a six stage process. The stages in this process are management, effective, acknowledge, cybersecurity. This is a completely editable PowerPoint presentation and is available for immediate download. Download now and impress your audience.
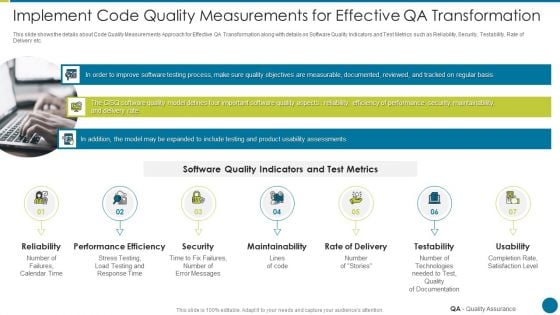
QA Modification For Product Quality Development And Consumer Satisfaction Implement Code Quality Brochure PDF
This slide shows the details about Code Quality Measurements Approach for Effective QA Transformation along with details on Software Quality Indicators and Test Metrics such as Reliability, Security, Testability, Rate of Delivery etc. Presenting qa modification for product quality development and consumer satisfaction implement code quality brochure pdf to provide visual cues and insights. Share and navigate important information on seven stages that need your due attention. This template can be used to pitch topics like reliability, performance efficiency, security, maintainability, rate of delivery. In addtion, this PPT design contains high resolution images, graphics, etc, that are easily editable and available for immediate download.
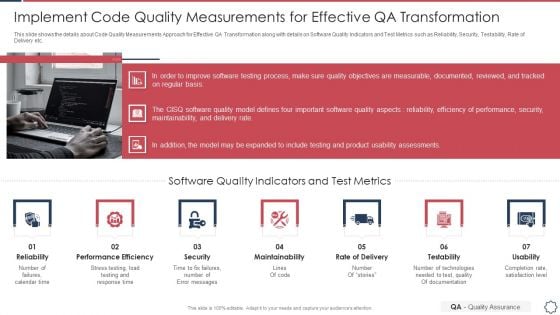
Quality Assurance Transformation Strategies To Improve Business Performance Efficiency Implement Code Quality Measurements Infographics PDF
This slide shows the details about Code Quality Measurements Approach for Effective QA Transformation along with details on Software Quality Indicators and Test Metrics such as Reliability, Security, Testability, Rate of Delivery etc. Presenting quality assurance transformation strategies to improve business performance efficiency implement code quality measurements infographics pdf to provide visual cues and insights. Share and navigate important information on seven stages that need your due attention. This template can be used to pitch topics like performance efficiency, maintainability, rate of delivery, testability, usability. In addtion, this PPT design contains high resolution images, graphics, etc, that are easily editable and available for immediate download.
Business Performance Indicators Ppt PowerPoint Presentation Visual Aids Diagrams Cpb
This is a business performance indicators ppt powerpoint presentation visual aids diagrams cpb. This is a four stage process. The stages in this process are business performance indicators.

Key Performance Indicators KPI Ppt PowerPoint Presentation Infographics Cpb
This is a key performance indicators kpi ppt powerpoint presentation infographics cpb. This is a five stage process. The stages in this process are key performance indicators kpi.
Customer Churn Indicator Ppt PowerPoint Presentation Infographic Template Designs Cpb
This is a customer churn indicator ppt powerpoint presentation infographic template designs cpb. This is a four stage process. The stages in this process are customer churn indicator.
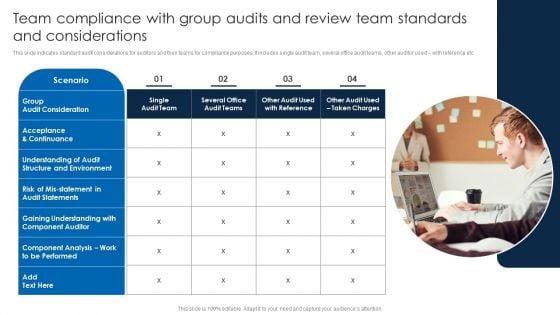
Team Compliance With Group Audits And Review Team Standards And Considerations Background PDF
This slide indicates standard audit considerations for auditors and their teams for compliance purposes. It includes single audit team, several office audit teams, other auditor used with reference etc. Presenting Team Compliance With Group Audits And Review Team Standards And Considerations Background PDF to dispense important information. This template comprises one stage. It also presents valuable insights into the topics including Gaining Understanding, Structure Environment, Acceptance Continuance. This is a completely customizable PowerPoint theme that can be put to use immediately. So, download it and address the topic impactfully.
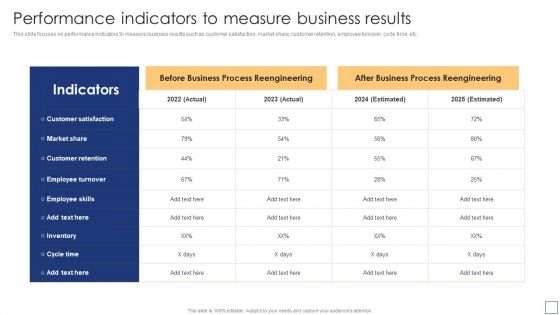
Business Process Redesigning Performance Indicators To Measure Business Results Summary PDF
This slide focuses on performance indicators to measure business results such as customer satisfaction, market share, customer retention, employee turnover, cycle time, etc. Are you in need of a template that can accommodate all of your creative concepts This one is crafted professionally and can be altered to fit any style. Use it with Google Slides or PowerPoint. Include striking photographs, symbols, depictions, and other visuals. Fill, move around, or remove text boxes as desired. Test out color palettes and font mixtures. Edit and save your work, or work with colleagues. Download Business Process Redesigning Performance Indicators To Measure Business Results Summary PDF and observe how to make your presentation outstanding. Give an impeccable presentation to your group and make your presentation unforgettable.

Business Restructuring Process Performance Indicators To Measure Business Results Slides PDF
This slide focuses on performance indicators to measure business results such as customer satisfaction, market share, customer retention, employee turnover, cycle time, etc. Are you in need of a template that can accommodate all of your creative concepts This one is crafted professionally and can be altered to fit any style. Use it with Google Slides or PowerPoint. Include striking photographs, symbols, depictions, and other visuals. Fill, move around, or remove text boxes as desired. Test out color palettes and font mixtures. Edit and save your work, or work with colleagues. Download Business Restructuring Process Performance Indicators To Measure Business Results Slides PDF and observe how to make your presentation outstanding. Give an impeccable presentation to your group and make your presentation unforgettable.
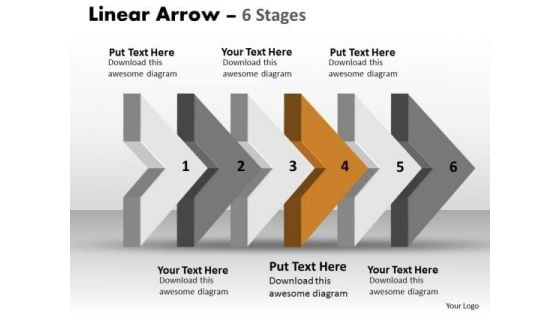
Ppt Theme 3d Linear Procedure To Show 6 Steps Working With Slide Numbers Business Plan 5 Image
We present our PPT Theme 3d linear procedure to show 6 steps working with slide numbers business plan 5 Image. Use our Arrows PowerPoint Templates because; illustrate these thoughts with this slide. Use our Symbol PowerPoint Templates because, your brain is always churning out ideas like cogs in a wheel. Use our Business PowerPoint Templates because, Marketing Strategy Business Template:- Maximizing sales of your product is the intended destination. Use our Process and Flows PowerPoint Templates because, Timelines Display: - You have developed a vision of where you want to be a few years from now. Use our Marketing PowerPoint Templates because, Original thinking is the need of the hour. Use these PowerPoint slides for presentations relating to Aim, Angle, Arrow, Arrowheads, Badge, Banner, Connection, Curve, Design, Direction, Download, Element, Fuchsia, Icon, Illustration, Indicator, Internet, Label, Link, Magenta, Mark, Marker, Next, Object, Orientation, Pointer, Shadow, Shape, Signs, Symbol. The prominent colors used in the PowerPoint template are Yellow, Gray, and White Create a business with our Ppt Theme 3d Linear Procedure To Show 6 Steps Working With Slide Numbers Business Plan 5 Image. Just download, type and present.
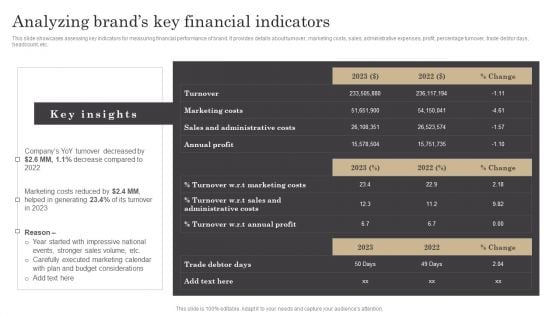
Analyzing Brands Key Financial Indicators Ppt Infographic Template Slides PDF
This slide showcases assessing key indicators for measuring financial performance of brand. It provides details about turnover, marketing costs, sales, administrative expenses, profit, percentage turnover, trade debtor days, headcount, etc. Are you in need of a template that can accommodate all of your creative concepts This one is crafted professionally and can be altered to fit any style. Use it with Google Slides or PowerPoint. Include striking photographs, symbols, depictions, and other visuals. Fill, move around, or remove text boxes as desired. Test out color palettes and font mixtures. Edit and save your work, or work with colleagues. Download Analyzing Brands Key Financial Indicators Ppt Infographic Template Slides PDF and observe how to make your presentation outstanding. Give an impeccable presentation to your group and make your presentation unforgettable.
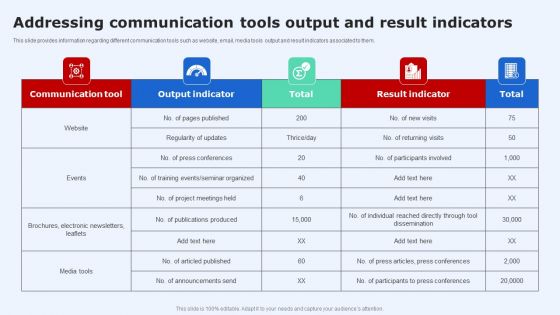
Addressing Communication Tools Output And Result Indicators Infographics PDF
This slide provides information regarding different communication tools such as website, email, media tools output and result indicators associated to them. Are you in need of a template that can accommodate all of your creative concepts This one is crafted professionally and can be altered to fit any style. Use it with Google Slides or PowerPoint. Include striking photographs, symbols, depictions, and other visuals. Fill, move around, or remove text boxes as desired. Test out color palettes and font mixtures. Edit and save your work, or work with colleagues. Download Addressing Communication Tools Output And Result Indicators Infographics PDF and observe how to make your presentation outstanding. Give an impeccable presentation to your group and make your presentation unforgettable.

Rural Economic Development Framework Ppt Inspiration
This is a rural economic development framework ppt inspiration. This is a four stage process. The stages in this process are explore regional wealth building, identify a market opportunity, construct a wealth works value chain, gauge wealth building impact.

Comprehensive Guide On Current Strategies Step 5 Check Product Labels As Per Standards Given By Codex
The slide showcases step five and the final step i.e. to check product labels indicating properties of the food product within the package. The slide contains elements such as product identity, ingredient listing, net quantity etc. Boost your pitch with our creative Comprehensive Guide On Current Strategies Step 5 Check Product Labels As Per Standards Given By Codex. Deliver an awe-inspiring pitch that will mesmerize everyone. Using these presentation templates you will surely catch everyones attention. You can browse the ppts collection on our website. We have researchers who are experts at creating the right content for the templates. So you do not have to invest time in any additional work. Just grab the template now and use them. The slide showcases step five and the final step i.e. to check product labels indicating properties of the food product within the package. The slide contains elements such as product identity, ingredient listing, net quantity etc.
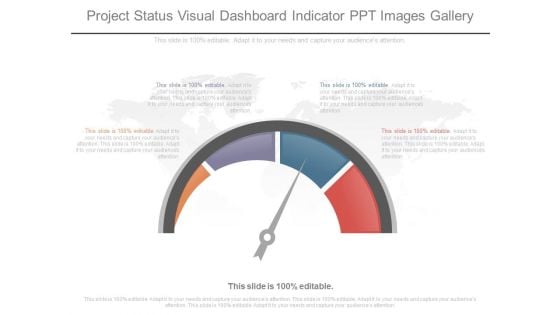
Project Status Visual Dashboard Indicator Ppt Images Gallery
This is a project status visual dashboard indicator ppt images gallery. This is a four stage process. The stages in this process are business, marketing, dashboard, measure, presentation.
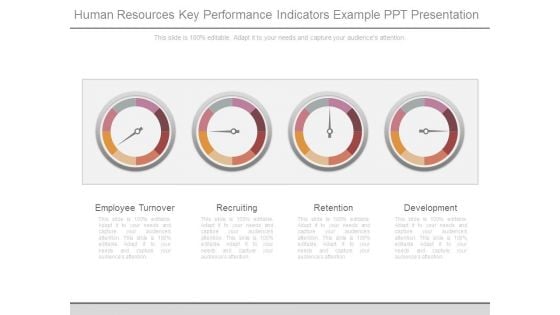
Human Resources Key Performance Indicators Example Ppt Presentation
This is a human resources key performance indicators example ppt presentation. This is a four stage process. The stages in this process are employee turnover, recruiting, retention, development.

Performance Indicators For Web Strategy Example Of Ppt
This is a performance indicators for web strategy example of ppt. This is a three stage process. The stages in this process are market, strategy, culture.
Financial Key Performance Indicators Table Powerpoint Slide Deck
This is a financial key performance indicators table powerpoint slide deck. This is a six stage process. The stages in this process are business, strategy, marketing, success, table.
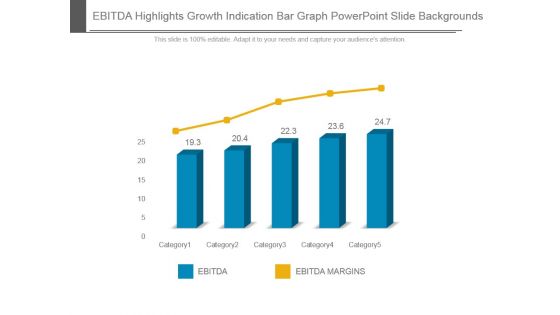
Ebitda Highlights Growth Indication Bar Graph Powerpoint Slide Backgrounds
This is a ebitda highlights growth indication bar graph powerpoint slide backgrounds. This is a five stage process. The stages in this process are ebitda, ebitda margins, category.
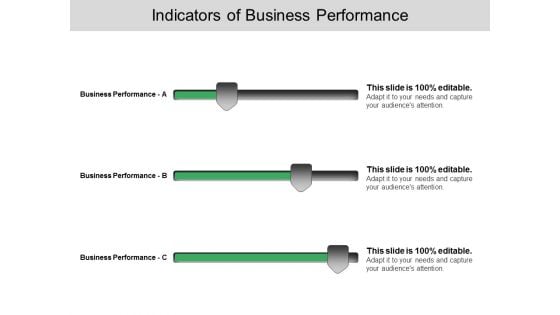
Indicators Of Busines Performance Ppt PowerPoint Presentation Infographics Influencers
This is a indicators of busines performance ppt powerpoint presentation infographics influencers. This is a three stage process. The stages in this process are cost reduction strategies.
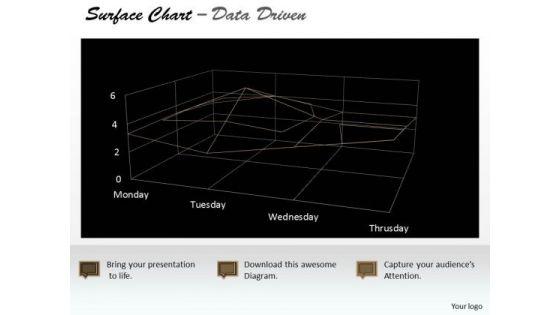
Data Analysis Template Driven Surface Chart Indicating Areas PowerPoint Slides Templates
Highlight Your Drive With Our data analysis template driven surface chart indicating areas powerpoint slides Templates . Prove The Fact That You Have Control.
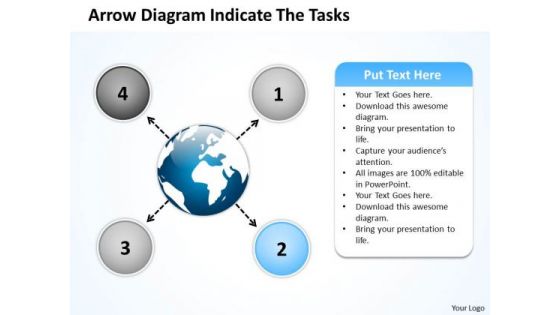
Arrow Diagram Indicate The Tasks Circular Flow Layout Process PowerPoint Slide
We present our arrow diagram indicate the tasks Circular Flow Layout Process PowerPoint Slide.Use our Process and Flows PowerPoint Templates because the atmosphere in the worplace is electric. Download and present our Arrows PowerPoint Templates because you know that the core of any organisation is the people who work for it. Use our Business PowerPoint Templates because the majestic tiger lord of all it surveys.It exudes power even when it is in repose. Download and present our Circle Charts PowerPoint Templates because you have a handle on all the targets, a master of the game, the experienced and consummate juggler. Download our Flow Charts PowerPoint Templates because this Layout can explain the relevance of the different layers and stages in getting down to your core competence, ability and desired result.Use these PowerPoint slides for presentations relating to Arrows, choice, connect, design, direction, flows, four, info graph, instruction, layout, manual, marketing, modern, one, option, order, page, paper, pointing, process, product, promotion, sequence, simple, special, step, symbol. The prominent colors used in the PowerPoint template are Blue light, Blue, Black. Presenters tell us our arrow diagram indicate the tasks Circular Flow Layout Process PowerPoint Slide are Stylish. Professionals tell us our info PowerPoint templates and PPT Slides are Fashionable. PowerPoint presentation experts tell us our arrow diagram indicate the tasks Circular Flow Layout Process PowerPoint Slide will make the presenter look like a pro even if they are not computer savvy. The feedback we get is that our connect PowerPoint templates and PPT Slides are Fashionable. Use our arrow diagram indicate the tasks Circular Flow Layout Process PowerPoint Slide are Zippy. Use our four PowerPoint templates and PPT Slides are Royal. Be a proactive manager with our Arrow Diagram Indicate The Tasks Circular Flow Layout Process PowerPoint Slide. They will make you look good.
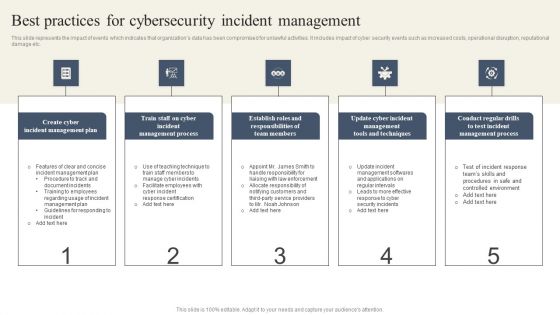
CYBER Security Breache Response Strategy Best Practices For Cybersecurity Incident Management Ideas PDF
This slide represents the impact of events which indicates that organizations data has been compromised for unlawful activities. It includes impact of cyber security events such as increased costs, operational disruption, reputational damage etc. Boost your pitch with our creative CYBER Security Breache Response Strategy Best Practices For Cybersecurity Incident Management Ideas PDF. Deliver an awe-inspiring pitch that will mesmerize everyone. Using these presentation templates you will surely catch everyones attention. You can browse the ppts collection on our website. We have researchers who are experts at creating the right content for the templates. So you do not have to invest time in any additional work. Just grab the template now and use them.
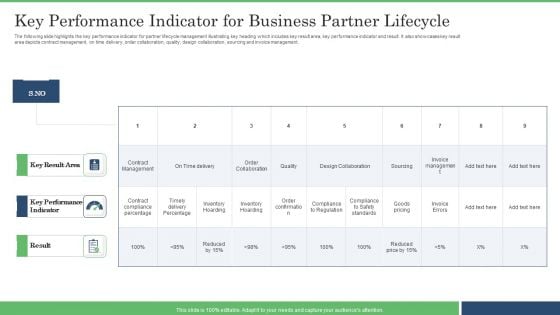
Key Performance Indicator For Business Partner Lifecycle Brochure PDF
The following slide highlights the key performance indicator for partner lifecycle management illustrating key heading which includes key result area, key performance indicator and result. It also showcases key result area depicts contract management, on time delivery, order collaboration, quality, design collaboration, sourcing and invoice management. Showcasing this set of slides titled Key Performance Indicator For Business Partner Lifecycle Brochure PDF. The topics addressed in these templates are Key Performance Indicator, Inventory Hoarding, Design Collaboration. All the content presented in this PPT design is completely editable. Download it and make adjustments in color, background, font etc. as per your unique business setting.
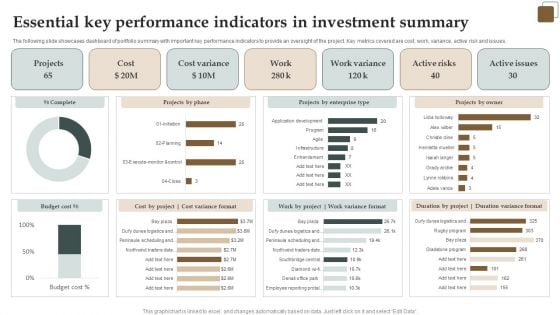
Essential Key Performance Indicators In Investment Summary Demonstration PDF
The following slide showcases dashboard of portfolio summary with important key performance indicators to provide an oversight of the project. Key metrics covered are cost, work, variance, active risk and issues. Showcasing this set of slides titled Essential Key Performance Indicators In Investment Summary Demonstration PDF. The topics addressed in these templates are Cost, Active Risks, Projects. All the content presented in this PPT design is completely editable. Download it and make adjustments in color, background, font etc. as per your unique business setting.
Team Performance Indicators Business Finance Ppt PowerPoint Presentation Icon Clipart
This is a team performance indicators business finance ppt powerpoint presentation icon clipart. This is a two stage process. The stages in this process are team, performance, indicators, business, finance.
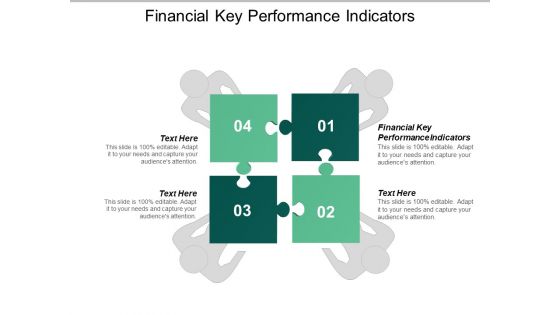
Financial Key Performance Indicators Ppt PowerPoint Presentation Ideas Aids Cpb
This is a financial key performance indicators ppt powerpoint presentation ideas aids cpb. This is a four stage process. The stages in this process are financial key performance indicators.

Sustainability Waste Management Key Performance Indicators Resources Recycling And Waste Management Background PDF
This slide covers the KPIs for three years such as processes, transportation, energy used, renewable energy generated and energy saving. Deliver an awe inspiring pitch with this creative sustainability waste management key performance indicators resources recycling and waste management background pdf bundle. Topics like sustainability waste management key performance indicators can be discussed with this completely editable template. It is available for immediate download depending on the needs and requirements of the user.
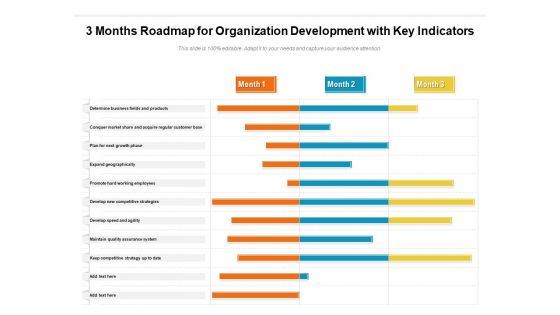
3 Months Roadmap For Organization Development With Key Indicators Guidelines
Presenting the 3 months roadmap for organization development with key indicators guidelines. The template includes a roadmap that can be used to initiate a strategic plan. Not only this, the PowerPoint slideshow is completely editable and you can effortlessly modify the font size, font type, and shapes according to your needs. This PPT slide can be easily reached in standard screen and widescreen aspect ratios. The set is also available in various formats like PDF, PNG, and JPG. So download and use it multiple times as per your knowledge.
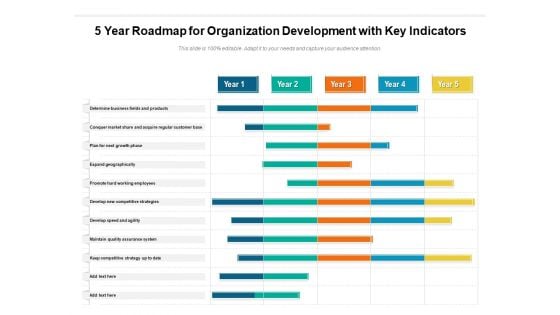
5 Year Roadmap For Organization Development With Key Indicators Clipart
Presenting the 5 year roadmap for organization development with key indicators clipart. The template includes a roadmap that can be used to initiate a strategic plan. Not only this, the PowerPoint slideshow is completely editable and you can effortlessly modify the font size, font type, and shapes according to your needs. This PPT slide can be easily reached in standard screen and widescreen aspect ratios. The set is also available in various formats like PDF, PNG, and JPG. So download and use it multiple times as per your knowledge.
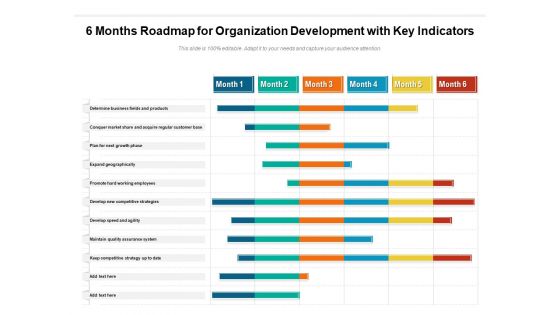
6 Months Roadmap For Organization Development With Key Indicators Topics
Presenting the 6 months roadmap for organization development with key indicators topics. The template includes a roadmap that can be used to initiate a strategic plan. Not only this, the PowerPoint slideshow is completely editable and you can effortlessly modify the font size, font type, and shapes according to your needs. This PPT slide can be easily reached in standard screen and widescreen aspect ratios. The set is also available in various formats like PDF, PNG, and JPG. So download and use it multiple times as per your knowledge.
Half Yearly Roadmap For Organization Development With Key Indicators Icons
Presenting the half yearly roadmap for organization development with key indicators icons. The template includes a roadmap that can be used to initiate a strategic plan. Not only this, the PowerPoint slideshow is completely editable and you can effortlessly modify the font size, font type, and shapes according to your needs. This PPT slide can be easily reached in standard screen and widescreen aspect ratios. The set is also available in various formats like PDF, PNG, and JPG. So download and use it multiple times as per your knowledge.
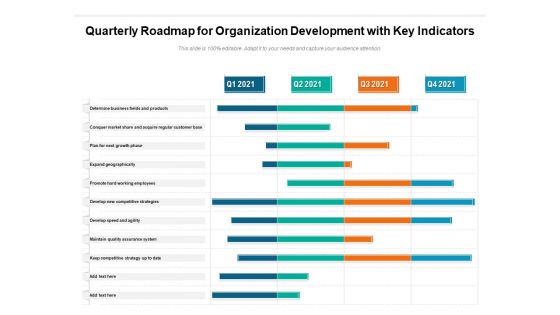
Quarterly Roadmap For Organization Development With Key Indicators Sample
Presenting the quarterly roadmap for organization development with key indicators sample. The template includes a roadmap that can be used to initiate a strategic plan. Not only this, the PowerPoint slideshow is completely editable and you can effortlessly modify the font size, font type, and shapes according to your needs. This PPT slide can be easily reached in standard screen and widescreen aspect ratios. The set is also available in various formats like PDF, PNG, and JPG. So download and use it multiple times as per your knowledge.
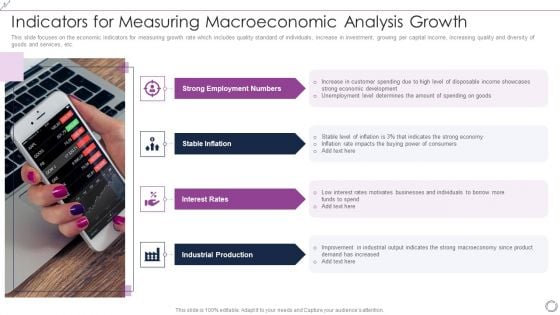
Indicators For Measuring Macroeconomic Analysis Growth Slides PDF
This slide focuses on the economic indicators for measuring growth rate which includes quality standard of individuals, increase in investment, growing per capital income, increasing quality and diversity of goods and services, etc. PresentingIndicators For Measuring Macroeconomic Analysis Growth Slides PDF to dispense important information. This template comprises four stages. It also presents valuable insights into the topics including Strong Employment Numbers, Stable Inflation, Interest Rates, Industrial Production. This is a completely customizable PowerPoint theme that can be put to use immediately. So, download it and address the topic impactfully.
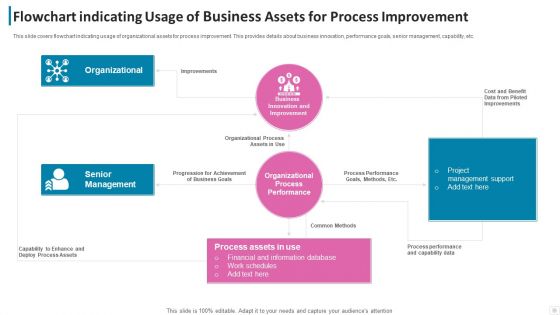
Flowchart Indicating Usage Of Business Assets For Process Improvement Formats PDF
This slide covers flowchart indicating usage of organizational assets for process improvement. This provides details about business innovation, performance goals, senior management, capability, etc. Pitch your topic with ease and precision using this flowchart indicating usage of business assets for process improvement formats pdf. This layout presents information on organizational, senior management, organizational process. It is also available for immediate download and adjustment. So, changes can be made in the color, design, graphics or any other component to create a unique layout.
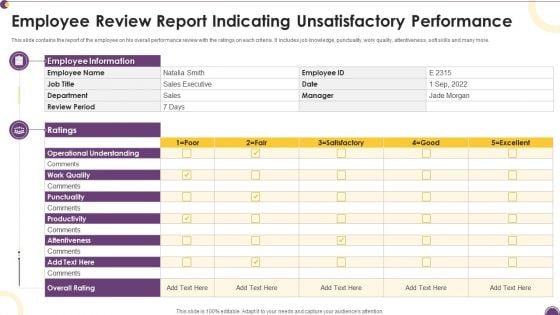
Employee Review Report Indicating Unsatisfactory Performance Themes PDF
This slide contains the report of the employee on his overall performance review with the ratings on each criteria. It includes job knowledge, punctuality, work quality, attentiveness, soft skills and many more.Pitch your topic with ease and precision using this Employee Review Report Indicating Unsatisfactory Performance Themes PDF. This layout presents information on Operational Understanding, Employee Information, Punctuality. It is also available for immediate download and adjustment. So, changes can be made in the color, design, graphics or any other component to create a unique layout.
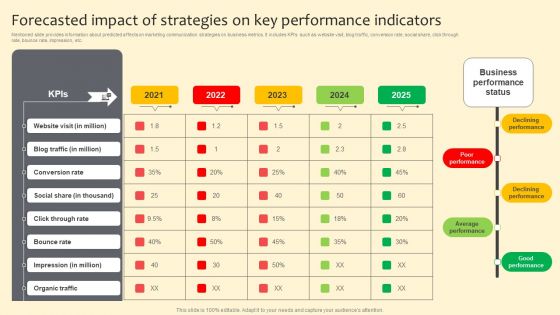
Forecasted Impact Of Strategies On Key Performance Indicators Slides PDF
Mentioned slide provides information about predicted affects on marketing communication strategies on business metrics. It includes KPIs such as website visit, blog traffic, conversion rate, social share, click through rate, bounce rate, impression, etc. Boost your pitch with our creative Forecasted Impact Of Strategies On Key Performance Indicators Slides PDF. Deliver an awe inspiring pitch that will mesmerize everyone. Using these presentation templates you will surely catch everyones attention. You can browse the ppts collection on our website. We have researchers who are experts at creating the right content for the templates. So you do not have to invest time in any additional work. Just grab the template now and use them.
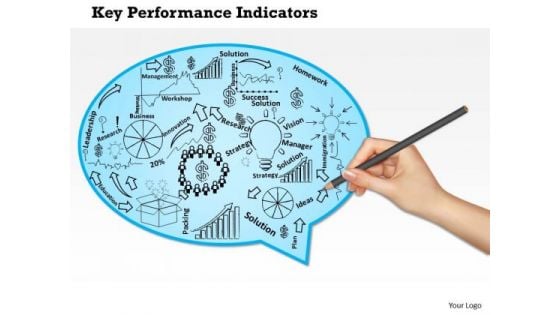
Business Framework Key Performance Indicators Of A Company PowerPoint Presentation
Our above diagram provides framework of key performance indicators for a company. This slide contains human hand drawing some objects for terms like innovation strategy, research, solution, management and leadership. Download this diagram to make professional presentations.
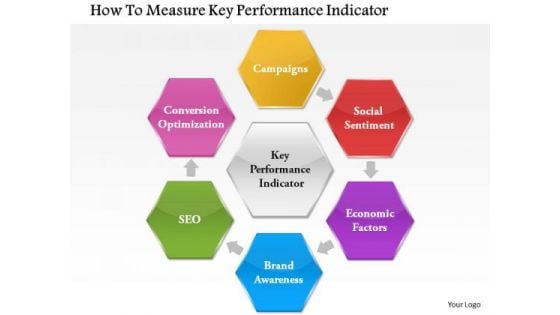
Business Framework How To Measure Key Performance Indicator PowerPoint Presentation
This Power Point diagram slide has been crafted with graphic of flower petal diagram. This PPT slide contains the concept of measuring the key performance and indicate it. Use this PPT slide for your management related presentation.


 Continue with Email

 Home
Home


