Snapshot

Magnifying Glass Testing Ppt PowerPoint Presentation Infographics Layout Ideas
This is a magnifying glass testing ppt powerpoint presentation infographics layout ideas. This is a five stage process. The stages in this process are technology, icons, strategy, analysis, marketing.
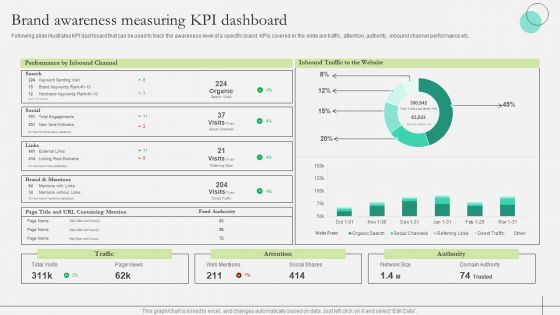
Comprehensive Guide To Strengthen Brand Equity Brand Awareness Measuring KPI Dashboard Rules PDF
Following slide illustrates KPI dashboard that can be used to track the awareness level of a specific brand. KPIs covered in the slide are traffic, attention, authority, inbound channel performance etc. Are you searching for a Comprehensive Guide To Strengthen Brand Equity Brand Awareness Measuring KPI Dashboard Rules PDF that is uncluttered, straightforward, and original Its easy to edit, and you can change the colors to suit your personal or business branding. For a presentation that expresses how much effort you have put in, this template is ideal With all of its features, including tables, diagrams, statistics, and lists, its perfect for a business plan presentation. Make your ideas more appealing with these professional slides. Download Comprehensive Guide To Strengthen Brand Equity Brand Awareness Measuring KPI Dashboard Rules PDF from Slidegeeks today.
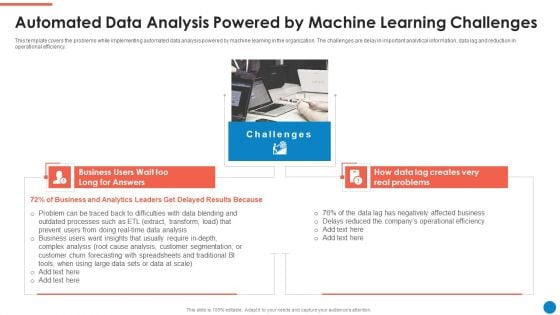
Data And Analytics Playbook Automated Data Analysis Powered By Machine Themes PDF
This template covers the problems while implementing automated data analysis powered by machine learning in the organization. The challenges are delay in important analytical information, data lag and reduction in operational efficiency. Presenting Data And Analytics Playbook Automated Data Analysis Powered By Machine Themes PDF to provide visual cues and insights. Share and navigate important information on two stages that need your due attention. This template can be used to pitch topics like Challenges, Data Lag Creates, Real Problems, Business Users. In addtion, this PPT design contains high resolution images, graphics, etc, that are easily editable and available for immediate download.
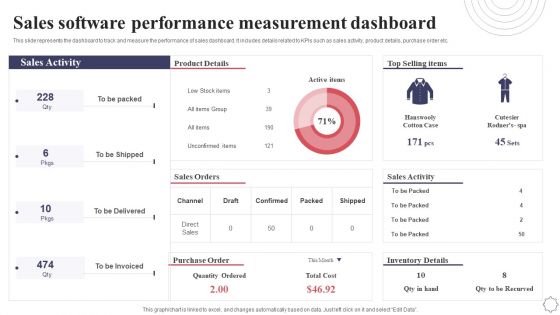
Sales Software Performance Measurement Dashboard Application Deployment Project Plan Introduction PDF
This slide represents the dashboard to track and measure the performance of sales dashboard. It includes details related to KPIs such as sales activity, product details, purchase order etc. Welcome to our selection of the Sales Software Performance Measurement Dashboard Application Deployment Project Plan Introduction PDF. These are designed to help you showcase your creativity and bring your sphere to life. Planning and Innovation are essential for any business that is just starting out. This collection contains the designs that you need for your everyday presentations. All of our PowerPoints are 100 percent editable, so you can customize them to suit your needs. This multi purpose template can be used in various situations. Grab these presentation templates today.
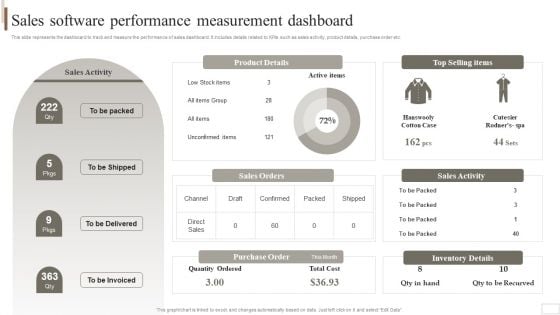
Strategic Plan For Enterprise Sales Software Performance Measurement Dashboard Template PDF
This slide represents the dashboard to track and measure the performance of sales dashboard. It includes details related to KPIs such as sales activity, product details, purchase order etc. Welcome to our selection of the Strategic Plan For Enterprise Sales Software Performance Measurement Dashboard Template PDF. These are designed to help you showcase your creativity and bring your sphere to life. Planning and Innovation are essential for any business that is just starting out. This collection contains the designs that you need for your everyday presentations. All of our PowerPoints are 100 percent editable, so you can customize them to suit your needs. This multi-purpose template can be used in various situations. Grab these presentation templates today.
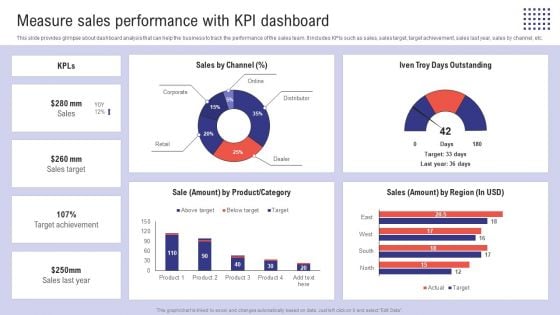
Planning Sales Campaign To Improve Measure Sales Performance With Kpi Dashboard Topics PDF
This slide provides glimpse about dashboard analysis that can help the business to track the performance of the sales team. It includes KPIs such as sales, sales target, target achievement, sales last year, sales by channel, etc. Explore a selection of the finest Planning Sales Campaign To Improve Measure Sales Performance With Kpi Dashboard Topics PDF here. With a plethora of professionally designed and pre-made slide templates, you can quickly and easily find the right one for your upcoming presentation. You can use our Planning Sales Campaign To Improve Measure Sales Performance With Kpi Dashboard Topics PDF to effectively convey your message to a wider audience. Slidegeeks has done a lot of research before preparing these presentation templates. The content can be personalized and the slides are highly editable. Grab templates today from Slidegeeks.
Planning Transnational Technique To Improve International Scope Dashboard For Tracking Post Expansion Sales Introduction PDF
This slide covers the dashboard for analyzing fast food business sales by region. It includes KPIs such as sales, sales target, target achievement, gross profit, gross profit margin, sales by channels, sales growth, etc. Find highly impressive Planning Transnational Technique To Improve International Scope Dashboard For Tracking Post Expansion Sales Introduction PDF on Slidegeeks to deliver a meaningful presentation. You can save an ample amount of time using these presentation templates. No need to worry to prepare everything from scratch because Slidegeeks experts have already done a huge research and work for you. You need to download Planning Transnational Technique To Improve International Scope Dashboard For Tracking Post Expansion Sales Introduction PDF for your upcoming presentation. All the presentation templates are 100 percent editable and you can change the color and personalize the content accordingly. Download now.
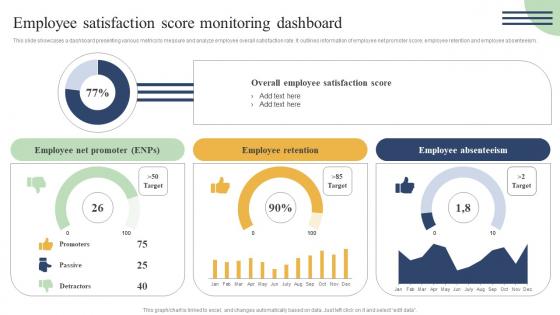
Action Measures To Build Staff Employee Satisfaction Score Monitoring Dashboard Introduction Pdf
This slide showcases a dashboard presenting various metrics to measure and analyze employee overall satisfaction rate. It outlines information of employee net promoter score, employee retention and employee absenteeism. Do you have an important presentation coming up Are you looking for something that will make your presentation stand out from the rest Look no further than Action Measures To Build Staff Employee Satisfaction Score Monitoring Dashboard Introduction Pdf. With our professional designs, you can trust that your presentation will pop and make delivering it a smooth process. And with Slidegeeks, you can trust that your presentation will be unique and memorable. So why wait Grab Action Measures To Build Staff Employee Satisfaction Score Monitoring Dashboard Introduction Pdf today and make your presentation stand out from the rest. This slide showcases a dashboard presenting various metrics to measure and analyze employee overall satisfaction rate. It outlines information of employee net promoter score, employee retention and employee absenteeism.
Optimizing Client Lead Handling Enhanced Lead Performance Tracking Dashboard Download Pdf
This slide covers the KPI dashboard for tracking improved lead management system performance. It includes metrics such as visitors, social media followers, email subscribers, organic leads, etc. Find highly impressive Optimizing Client Lead Handling Enhanced Lead Performance Tracking Dashboard Download Pdf on Slidegeeks to deliver a meaningful presentation. You can save an ample amount of time using these presentation templates. No need to worry to prepare everything from scratch because Slidegeeks experts have already done a huge research and work for you. You need to download Optimizing Client Lead Handling Enhanced Lead Performance Tracking Dashboard Download Pdf for your upcoming presentation. All the presentation templates are 100 percent editable and you can change the color and personalize the content accordingly. Download now. This slide covers the KPI dashboard for tracking improved lead management system performance. It includes metrics such as visitors, social media followers, email subscribers, organic leads, etc.
Guide To Winning Tourism Tourism Marketing Expenditure Tracking Dashboard Topics Pdf
This slide represents key metrics dashboard to analyze the expenses incurred in tourism marketing campaign and demographics of target audience. It includes details related to number of air travels and land travels etc, This Guide To Winning Tourism Tourism Marketing Expenditure Tracking Dashboard Topics Pdf is perfect for any presentation, be it in front of clients or colleagues. It is a versatile and stylish solution for organizing your meetings. The Guide To Winning Tourism Tourism Marketing Expenditure Tracking Dashboard Topics Pdf features a modern design for your presentation meetings. The adjustable and customizable slides provide unlimited possibilities for acing up your presentation. Slidegeeks has done all the homework before launching the product for you. So, do not wait, grab the presentation templates today This slide represents key metrics dashboard to analyze the expenses incurred in tourism marketing campaign and demographics of target audience. It includes details related to number of air travels and land travels etc
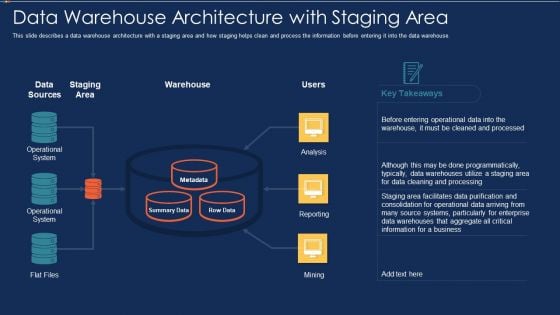
Data Warehousing IT Data Warehouse Architecture With Staging Area Ppt Styles Objects PDF
This slide describes a data warehouse architecture with a staging area and how staging helps clean and process the information before entering it into the data warehouse. Presenting data warehousing it data warehouse architecture with staging area ppt styles objects pdf to provide visual cues and insights. Share and navigate important information on three stages that need your due attention. This template can be used to pitch topics like operational system, analysis, reporting, mining, flat files. In addtion, this PPT design contains high resolution images, graphics, etc, that are easily editable and available for immediate download.
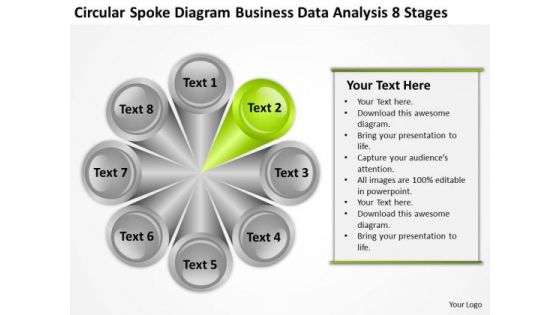
Business Data Analysis 8 Stages Ppt Plan Example PowerPoint Templates
We present our business data analysis 8 stages ppt plan example PowerPoint templates.Download and present our Process and Flows PowerPoint Templates because Our PowerPoint Templates and Slides will bullet point your ideas. See them fall into place one by one. Download our Circle Charts PowerPoint Templates because These PowerPoint Templates and Slides will give the updraft to your ideas. See them soar to great heights with ease. Present our Shapes PowerPoint Templates because Our PowerPoint Templates and Slides help you meet the demand of the Market. Just browse and pick the slides that appeal to your intuitive senses. Download our Flow Charts PowerPoint Templates because Our PowerPoint Templates and Slides are created by a hardworking bunch of busybees. Always flitting around with solutions gauranteed to please. Use our Business PowerPoint Templates because Our PowerPoint Templates and Slides will bullet point your ideas. See them fall into place one by one.Use these PowerPoint slides for presentations relating to Abstract, business, catalog, chart, circle, colors, cross, demonstration, description, design, diagram, futuristic, glossy, goals,illustration, information, interface, internet, isolated, level, list, marketing, model, multiple, navigation, network, pattern, presentation, registry, report, space, sphere, statement, statistics, steps, structure, wheel. The prominent colors used in the PowerPoint template are Gray, Green, White. Our Business Data Analysis 8 Stages Ppt Plan Example PowerPoint Templates offer easy availability and access. You will find them always around.
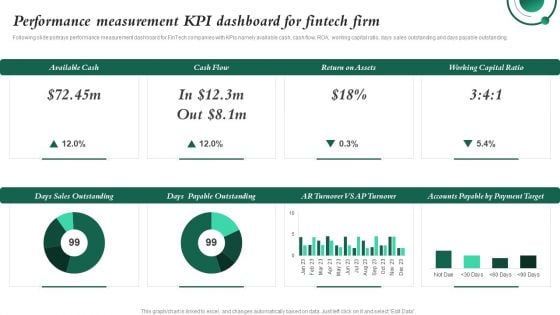
Performance Measurement KPI Dashboard For Fintech Firm Investment In Latest Technology To Ensure Portrait PDF
Following slide portrays performance measurement dashboard for FinTech companies with KPIs namely available cash, cash flow, ROA, working capital ratio, days sales outstanding and days payable outstanding.Whether you have daily or monthly meetings, a brilliant presentation is necessary. Performance Measurement KPI Dashboard For Fintech Firm Investment In Latest Technology To Ensure Portrait PDF can be your best option for delivering a presentation. Represent everything in detail using Performance Measurement KPI Dashboard For Fintech Firm Investment In Latest Technology To Ensure Portrait PDF and make yourself stand out in meetings. The template is versatile and follows a structure that will cater to your requirements. All the templates prepared by Slidegeeks are easy to download and edit. Our research experts have taken care of the corporate themes as well. So, give it a try and see the results.
Dashboard For Tracking Impact Of Transport Automation Optimizing Automated Supply Chain And Logistics Inspiration PDF
This slide covers the dashboard for tracking vehicle efficiency after transport automation. It include KPIs such as truck turnaround time, average revenue per hour, truckload capacity, transit time, on-time pickup, and average revenue per mile. Whether you have daily or monthly meetings, a brilliant presentation is necessary. Dashboard For Tracking Impact Of Transport Automation Optimizing Automated Supply Chain And Logistics Inspiration PDF can be your best option for delivering a presentation. Represent everything in detail using Dashboard For Tracking Impact Of Transport Automation Optimizing Automated Supply Chain And Logistics Inspiration PDF and make yourself stand out in meetings. The template is versatile and follows a structure that will cater to your requirements. All the templates prepared by Slidegeeks are easy to download and edit. Our research experts have taken care of the corporate themes as well. So, give it a try and see the results.
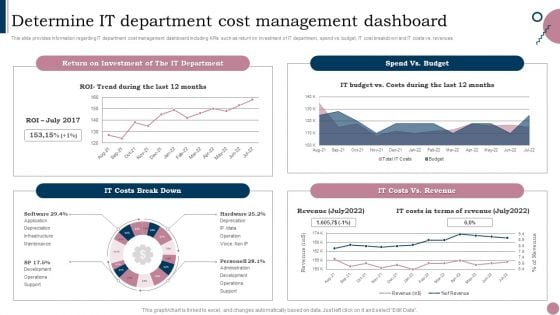
Cios Guide To Optimize Determine IT Department Cost Management Dashboard Ideas PDF
This slide provides information regarding IT department cost management dashboard including KPIs such as return on investment of IT department, spend vs. budget, IT cost breakdown and IT costs vs. revenues. Find highly impressive Cios Guide To Optimize Determine IT Department Cost Management Dashboard Ideas PDF on Slidegeeks to deliver a meaningful presentation. You can save an ample amount of time using these presentation templates. No need to worry to prepare everything from scratch because Slidegeeks experts have already done a huge research and work for you. You need to download Cios Guide To Optimize Determine IT Department Cost Management Dashboard Ideas PDF for your upcoming presentation. All the presentation templates are 100 percent editable and you can change the color and personalize the content accordingly. Download now.
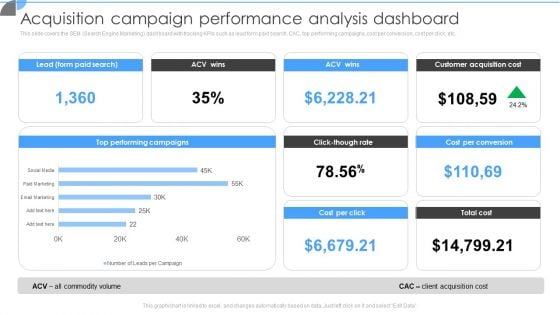
Customer Acquisition Approaches To Enhance Organization Growth Acquisition Campaign Performance Analysis Dashboard Information PDF
This slide covers the SEM Search Engine Marketing dashboard with tracking KPIs such as lead form paid search, CAC, top performing campaigns, cost per conversion, cost per click, etc. If you are looking for a format to display your unique thoughts, then the professionally designed Customer Acquisition Approaches To Enhance Organization Growth Acquisition Campaign Performance Analysis Dashboard Information PDF is the one for you. You can use it as a Google Slides template or a PowerPoint template. Incorporate impressive visuals, symbols, images, and other charts. Modify or reorganize the text boxes as you desire. Experiment with shade schemes and font pairings. Alter, share or cooperate with other people on your work. Download Customer Acquisition Approaches To Enhance Organization Growth Acquisition Campaign Performance Analysis Dashboard Information PDF and find out how to give a successful presentation. Present a perfect display to your team and make your presentation unforgettable.
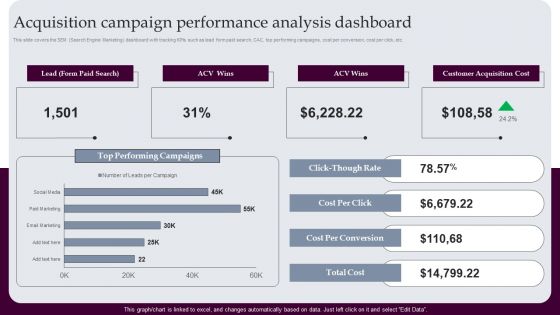
Acquisition Campaign Performance Analysis Dashboard Strategies For Acquiring Consumers Themes PDF
This slide covers the SEM Search Engine Marketing dashboard with tracking KPIs such as lead form paid search, CAC, top performing campaigns, cost per conversion, cost per click, etc. Crafting an eye-catching presentation has never been more straightforward. Let your presentation shine with this tasteful yet straightforward Acquisition Campaign Performance Analysis Dashboard Strategies For Acquiring Consumers Themes PDF template. It offers a minimalistic and classy look that is great for making a statement. The colors have been employed intelligently to add a bit of playfulness while still remaining professional. Construct the ideal Acquisition Campaign Performance Analysis Dashboard Strategies For Acquiring Consumers Themes PDF that effortlessly grabs the attention of your audience Begin now and be certain to wow your customers.
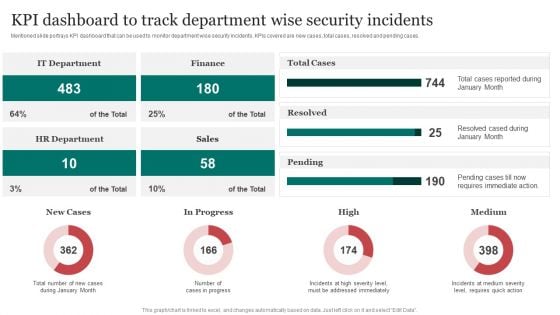
Kpi Dashboard To Track Department Wise Improving Cybersecurity With Incident Guidelines PDF
Mentioned slide portrays KPI dashboard that can be used to monitor department wise security incidents. KPIs covered are new cases, total cases, resolved and pending cases.This Kpi Dashboard To Track Department Wise Improving Cybersecurity With Incident Guidelines PDF is perfect for any presentation, be it in front of clients or colleagues. It is a versatile and stylish solution for organizing your meetings. The Kpi Dashboard To Track Department Wise Improving Cybersecurity With Incident Guidelines PDF features a modern design for your presentation meetings. The adjustable and customizable slides provide unlimited possibilities for acing up your presentation. Slidegeeks has done all the homework before launching the product for you. So, do not wait, grab the presentation templates today
Integrating AI To Enhance Dashboard For Tracking Impact Of Supply Chain Automation Themes PDF
This slide covers the dashboard for back-end tracking of overall impact automation. It include KPIs such as retailer capacity, warehouse capacity, truck efficiency, time to reach warehouse, sustainability, etc. Do you have an important presentation coming up Are you looking for something that will make your presentation stand out from the rest Look no further than Integrating AI To Enhance Dashboard For Tracking Impact Of Supply Chain Automation Themes PDF. With our professional designs, you can trust that your presentation will pop and make delivering it a smooth process. And with Slidegeeks, you can trust that your presentation will be unique and memorable. So why wait Grab Integrating AI To Enhance Dashboard For Tracking Impact Of Supply Chain Automation Themes PDF today and make your presentation stand out from the rest.
Integrating AI To Enhance Dashboard For Tracking Impact Of Transport Automation Template PDF
This slide covers the dashboard for tracking vehicle efficiency after transport automation. It include KPIs such as truck turnaround time, average revenue per hour, truckload capacity, transit time, on-time pickup, and average revenue per mile. Whether you have daily or monthly meetings, a brilliant presentation is necessary. Integrating AI To Enhance Dashboard For Tracking Impact Of Transport Automation Template PDF can be your best option for delivering a presentation. Represent everything in detail using Integrating AI To Enhance Dashboard For Tracking Impact Of Transport Automation Template PDF and make yourself stand out in meetings. The template is versatile and follows a structure that will cater to your requirements. All the templates prepared by Slidegeeks are easy to download and edit. Our research experts have taken care of the corporate themes as well. So, give it a try and see the results.
Integrating AI To Enhance Dashboard For Tracking Impact Of Warehouse House Automation Professional PDF
This slide covers the dashboard with after automation warehouse overview. It include KPIs such as autonomous robots status, robotic arms status, battery level, performance, time to return, etc. Find highly impressive Integrating AI To Enhance Dashboard For Tracking Impact Of Warehouse House Automation Professional PDF on Slidegeeks to deliver a meaningful presentation. You can save an ample amount of time using these presentation templates. No need to worry to prepare everything from scratch because Slidegeeks experts have already done a huge research and work for you. You need to download Integrating AI To Enhance Dashboard For Tracking Impact Of Warehouse House Automation Professional PDF for your upcoming presentation. All the presentation templates are 100 percent editable and you can change the color and personalize the content accordingly. Download now.
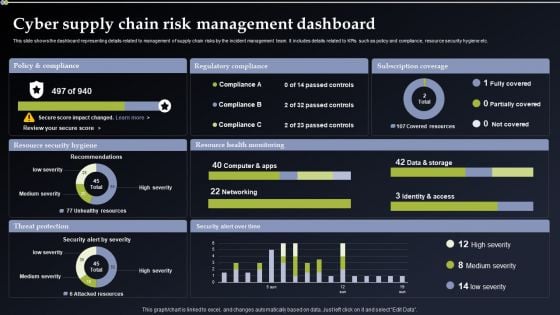
Deploying Cyber Security Incident Response Administration Cyber Supply Chain Risk Management Dashboard Themes PDF
This slide shows the dashboard representing details related to management of supply chain risks by the incident management team. It includes details related to KPIs such as policy and compliance, resource security hygiene etc. Do you have an important presentation coming up Are you looking for something that will make your presentation stand out from the rest Look no further than Deploying Cyber Security Incident Response Administration Cyber Supply Chain Risk Management Dashboard Themes PDF. With our professional designs, you can trust that your presentation will pop and make delivering it a smooth process. And with Slidegeeks, you can trust that your presentation will be unique and memorable. So why wait Grab Deploying Cyber Security Incident Response Administration Cyber Supply Chain Risk Management Dashboard Themes PDF today and make your presentation stand out from the rest.
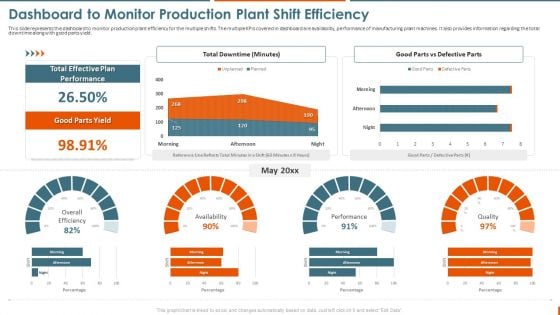
Maintenance Administration Dashboard To Monitor Production Plant Shift Efficiency Diagrams PDF
This slide represents the dashboard to monitor production plant efficiency for the multiple shifts. The multiple KPIs covered in dashboard are availability, performance of manufacturing plant machines. It also provides information regarding the total downtime along with good parts yield. Want to ace your presentation in front of a live audience Our Maintenance Administration Dashboard To Monitor Production Plant Shift Efficiency Diagrams PDF can help you do that by engaging all the users towards you. Slidegeeks experts have put their efforts and expertise into creating these impeccable powerpoint presentations so that you can communicate your ideas clearly. Moreover, all the templates are customizable, and easy-to-edit and downloadable. Use these for both personal and commercial use.
Streamlining Operations With Supply Chain Automation Dashboard For Tracking Impact Of Transport Automation Demonstration PDF
This slide covers the dashboard for tracking vehicle efficiency after transport automation. It include KPIs such as truck turnaround time, average revenue per hour, truckload capacity, transit time, on-time pickup, and average revenue per mile. Do you have to make sure that everyone on your team knows about any specific topic I yes, then you should give Streamlining Operations With Supply Chain Automation Dashboard For Tracking Impact Of Transport Automation Demonstration PDF a try. Our experts have put a lot of knowledge and effort into creating this impeccable Streamlining Operations With Supply Chain Automation Dashboard For Tracking Impact Of Transport Automation Demonstration PDF. You can use this template for your upcoming presentations, as the slides are perfect to represent even the tiniest detail. You can download these templates from the Slidegeeks website and these are easy to edit. So grab these today.
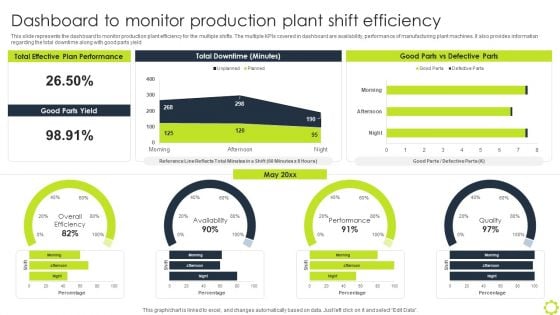
Machine Repairing And Servicing Dashboard To Monitor Production Plant Shift Structure PDF
This slide represents the dashboard to monitor production plant efficiency for the multiple shifts. The multiple KPIs covered in dashboard are availability, performance of manufacturing plant machines. It also provides information regarding the total downtime along with good parts yield. Slidegeeks is one of the best resources for PowerPoint templates. You can download easily and regulate Machine Repairing And Servicing Dashboard To Monitor Production Plant Shift Structure PDF for your personal presentations from our wonderful collection. A few clicks is all it takes to discover and get the most relevant and appropriate templates. Use our Templates to add a unique zing and appeal to your presentation and meetings. All the slides are easy to edit and you can use them even for advertisement purposes.

Brand Management Strategy To Increase Awareness Brand Awareness Measuring KPI Dashboard Mockup PDF
Following slide illustrates KPI dashboard that can be used to track the awareness level of a specific brand. KPIs covered in the slide are traffic, attention, authority, inbound channel performance etc. Do you have to make sure that everyone on your team knows about any specific topic I yes, then you should give Brand Management Strategy To Increase Awareness Brand Awareness Measuring KPI Dashboard Mockup PDF a try. Our experts have put a lot of knowledge and effort into creating this impeccable Brand Management Strategy To Increase Awareness Brand Awareness Measuring KPI Dashboard Mockup PDF. You can use this template for your upcoming presentations, as the slides are perfect to represent even the tiniest detail. You can download these templates from the Slidegeeks website and these are easy to edit. So grab these today
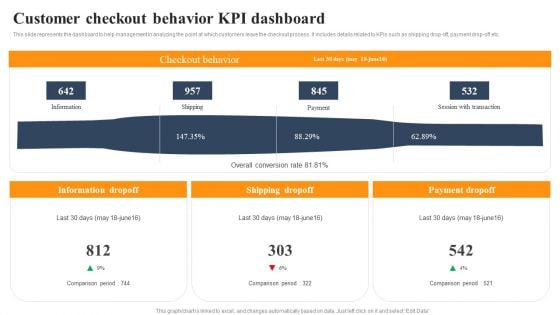
Implementing An Effective Ecommerce Management Framework Customer Checkout Behavior KPI Dashboard Designs PDF
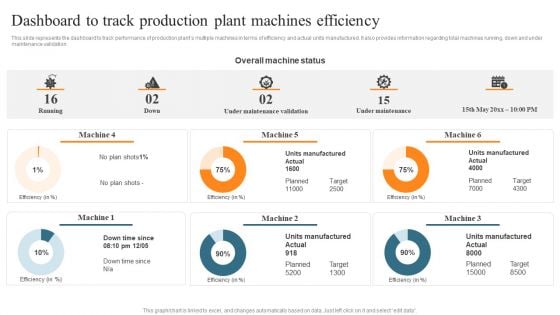
Leveraging Predictive Maintenance To Enhance Production Process Dashboard To Track Production Plant Machines Efficiency Template PDF
Do you have to make sure that everyone on your team knows about any specific topic I yes, then you should give Leveraging Predictive Maintenance To Enhance Production This slide presents a dashboard to showcase the existing operational efficiency of production plant by covering multiple KPIs such as throughput, inventory turns, scarp rate and production target attainment Process Dashboard To Track Production Plant Machines Efficiency Template PDF a try. Our experts have put a lot of knowledge and effort into creating this impeccable Leveraging Predictive Maintenance To Enhance Production Process Dashboard To Track Production Plant Machines Efficiency Template PDF. You can use this template for your upcoming presentations, as the slides are perfect to represent even the tiniest detail. You can download these templates from the Slidegeeks website and these are easy to edit. So grab these today.
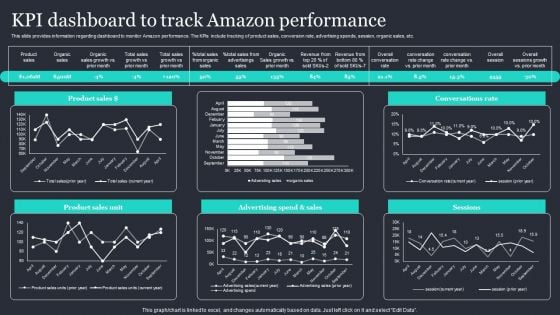
Amazon Strategic Growth Initiative On Global Scale KPI Dashboard To Track Amazon Performance Themes PDF
This slide provides information regarding dashboard to monitor Amazon performance. The KPIs include tracking of product sales, conversion rate, advertising spends, session, organic sales, etc. Do you have to make sure that everyone on your team knows about any specific topic I yes, then you should give Amazon Strategic Growth Initiative On Global Scale KPI Dashboard To Track Amazon Performance Themes PDF a try. Our experts have put a lot of knowledge and effort into creating this impeccable Amazon Strategic Growth Initiative On Global Scale KPI Dashboard To Track Amazon Performance Themes PDF. You can use this template for your upcoming presentations, as the slides are perfect to represent even the tiniest detail. You can download these templates from the Slidegeeks website and these are easy to edit. So grab these today.
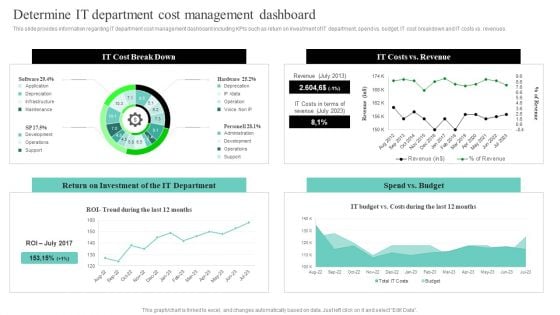
IT Cost Reduction Strategies Determine IT Department Cost Management Dashboard Guidelines PDF
This slide provides information regarding IT department cost management dashboard including KPIs such as return on investment of IT department, spend vs. budget, IT cost breakdown and IT costs vs. revenues. Get a simple yet stunning designed IT Cost Reduction Strategies Determine IT Department Cost Management Dashboard Guidelines PDF. It is the best one to establish the tone in your meetings. It is an excellent way to make your presentations highly effective. So, download this PPT today from Slidegeeks and see the positive impacts. Our easy-to-edit IT Cost Reduction Strategies Determine IT Department Cost Management Dashboard Guidelines PDF can be your go-to option for all upcoming conferences and meetings. So, what are you waiting for Grab this template today.
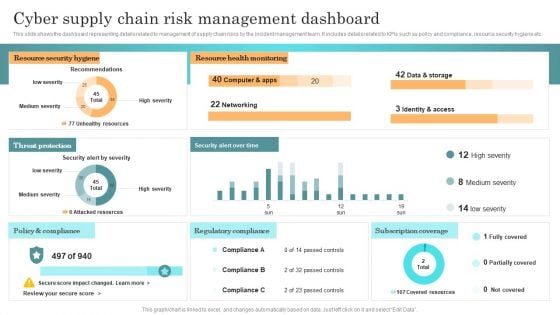
Incident Response Techniques Deployement Cyber Supply Chain Risk Management Dashboard Topics PDF
This slide shows the dashboard representing details related to management of supply chain risks by the incident management team. It includes details related to KPIs such as policy and compliance, resource security hygiene etc. Whether you have daily or monthly meetings, a brilliant presentation is necessary. Incident Response Techniques Deployement Cyber Supply Chain Risk Management Dashboard Topics PDF can be your best option for delivering a presentation. Represent everything in detail using Incident Response Techniques Deployement Cyber Supply Chain Risk Management Dashboard Topics PDF and make yourself stand out in meetings. The template is versatile and follows a structure that will cater to your requirements. All the templates prepared by Slidegeeks are easy to download and edit. Our research experts have taken care of the corporate themes as well. So, give it a try and see the results.
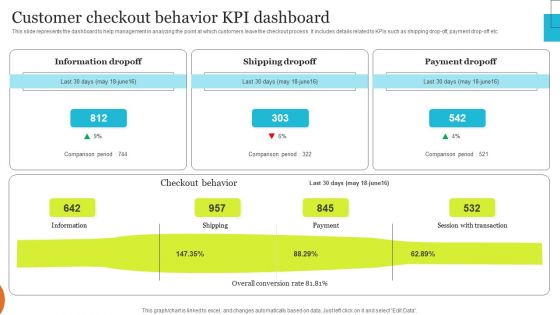
Implementing Effective Ecommerce Managemnet Platform Customer Checkout Behavior KPI Dashboard Sample PDF
This slide represents the dashboard to help management in analyzing the point at which customers leave the checkout process. It includes details related to KPIs such as shipping drop off, payment drop-off etc. Crafting an eye catching presentation has never been more straightforward. Let your presentation shine with this tasteful yet straightforward Implementing Effective Ecommerce Managemnet Platform Customer Checkout Behavior KPI Dashboard Sample PDF template. It offers a minimalistic and classy look that is great for making a statement. The colors have been employed intelligently to add a bit of playfulness while still remaining professional. Construct the ideal Implementing Effective Ecommerce Managemnet Platform Customer Checkout Behavior KPI Dashboard Sample PDF that effortlessly grabs the attention of your audience. Begin now and be certain to wow your customers.
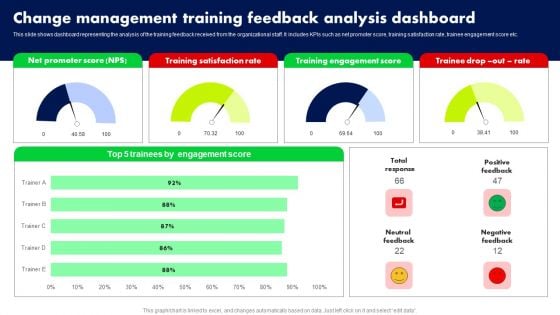
Change Management Training Feedback Analysis Dashboard Ppt PowerPoint Presentation File Diagrams PDF
This slide shows dashboard representing the analysis of the training feedback received from the organizational staff. It includes KPIs such as net promoter score, training satisfaction rate, trainee engagement score etc. Get a simple yet stunning designed Change Management Training Feedback Analysis Dashboard Ppt PowerPoint Presentation File Diagrams PDF. It is the best one to establish the tone in your meetings. It is an excellent way to make your presentations highly effective. So, download this PPT today from Slidegeeks and see the positive impacts. Our easy to edit Change Management Training Feedback Analysis Dashboard Ppt PowerPoint Presentation File Diagrams PDF can be your go to option for all upcoming conferences and meetings. So, what are you waiting for Grab this template today.
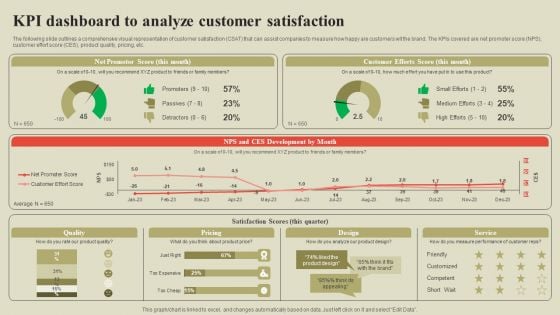
Steps To Effectively Conduct Market Research KPI Dashboard To Analyze Customer Satisfaction Introduction PDF
The following slide outlines a comprehensive visual representation of customer satisfaction CSAT that can assist companies to measure how happy are customers wit the brand. The KPIs covered are net promoter score NPS, customer effort score CES, product quality, pricing, etc. Presenting this PowerPoint presentation, titled Steps To Effectively Conduct Market Research KPI Dashboard To Analyze Customer Satisfaction Introduction PDF, with topics curated by our researchers after extensive research. This editable presentation is available for immediate download and provides attractive features when used. Download now and captivate your audience. Presenting this Steps To Effectively Conduct Market Research KPI Dashboard To Analyze Customer Satisfaction Introduction PDF. Our researchers have carefully researched and created these slides with all aspects taken into consideration. This is a completely customizable Steps To Effectively Conduct Market Research KPI Dashboard To Analyze Customer Satisfaction Introduction PDF that is available for immediate downloading. Download now and make an impact on your audience. Highlight the attractive features available with our PPTs.
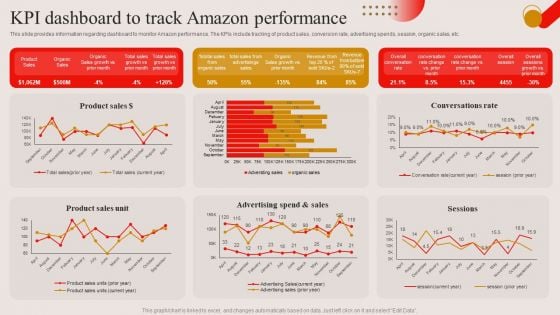
KPI Dashboard To Track Amazon Performance Ppt PowerPoint Presentation Diagram Lists PDF
This slide provides information regarding dashboard to monitor Amazon performance. The KPIs include tracking of product sales, conversion rate, advertising spends, session, organic sales, etc. Explore a selection of the finest KPI Dashboard To Track Amazon Performance Ppt PowerPoint Presentation Diagram Lists PDF here. With a plethora of professionally designed and pre made slide templates, you can quickly and easily find the right one for your upcoming presentation. You can use our KPI Dashboard To Track Amazon Performance Ppt PowerPoint Presentation Diagram Lists PDF to effectively convey your message to a wider audience. Slidegeeks has done a lot of research before preparing these presentation templates. The content can be personalized and the slides are highly editable. Grab templates today from Slidegeeks.
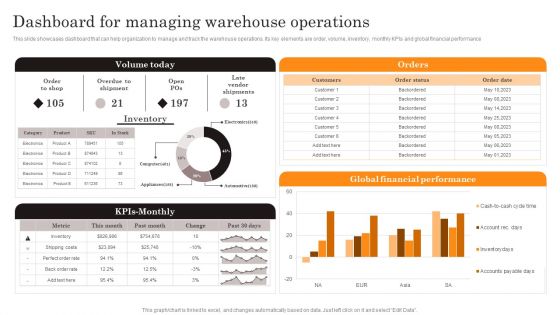
Procurement Strategies For Reducing Stock Wastage Dashboard For Managing Warehouse Infographics PDF
This slide showcases dashboard that can help organization to manage and track the warehouse operations. Its key elements are order, volume, inventory, monthly KPIs and global financial performance. Here you can discover an assortment of the finest PowerPoint and Google Slides templates. With these templates, you can create presentations for a variety of purposes while simultaneously providing your audience with an eye catching visual experience. Download Procurement Strategies For Reducing Stock Wastage Dashboard For Managing Warehouse Infographics PDF to deliver an impeccable presentation. These templates will make your job of preparing presentations much quicker, yet still, maintain a high level of quality. Slidegeeks has experienced researchers who prepare these templates and write high quality content for you. Later on, you can personalize the content by editing the Procurement Strategies For Reducing Stock Wastage Dashboard For Managing Warehouse Infographics PDF.
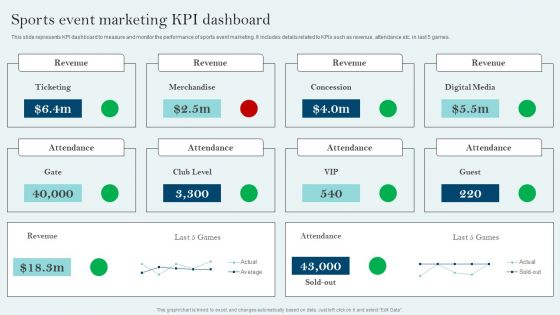
Comprehensive Sports Event Marketing Plan Sports Event Marketing KPI Dashboard Introduction PDF
This slide represents KPI dashboard to measure and monitor the performance of sports event marketing. It includes details related to KPIs such as revenue, attendance etc. in last 5 games. Do you have to make sure that everyone on your team knows about any specific topic I yes, then you should give Comprehensive Sports Event Marketing Plan Sports Event Marketing KPI Dashboard Introduction PDF a try. Our experts have put a lot of knowledge and effort into creating this impeccable Comprehensive Sports Event Marketing Plan Sports Event Marketing KPI Dashboard Introduction PDF. You can use this template for your upcoming presentations, as the slides are perfect to represent even the tiniest detail. You can download these templates from the Slidegeeks website and these are easy to edit. So grab these today
Improving Buyer Journey Through Strategic Customer Engagement Social Media Engagement Tracking Dashboard Structure PDF
This slide showcases a dashboard highlighting the customer engagement through social sites. it includes KPIs such as total website traffics, site revenue, fans count and followers Find highly impressive Improving Buyer Journey Through Strategic Customer Engagement Social Media Engagement Tracking Dashboard Structure PDF on Slidegeeks to deliver a meaningful presentation. You can save an ample amount of time using these presentation templates. No need to worry to prepare everything from scratch because Slidegeeks experts have already done a huge research and work for you. You need to download Improving Buyer Journey Through Strategic Customer Engagement Social Media Engagement Tracking Dashboard Structure PDF for your upcoming presentation. All the presentation templates are 100 percent editable and you can change the color and personalize the content accordingly. Download now
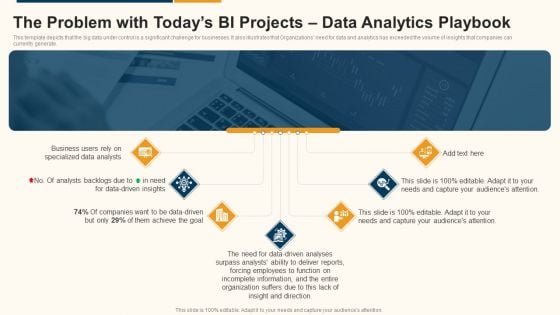
Data Interpretation And Analysis Playbook The Problem With Todays Bi Projects Data Analytics Playbook Introduction PDF
This template depicts that the big data under control is a significant challenge for businesses. It also illustrates that Organizations need for data and analytics has exceeded the volume of insights that companies can currently generate. This is a data interpretation and analysis playbook the problem with todays bi projects data analytics playbook introduction pdf template with various stages. Focus and dispense information on seven stages using this creative set, that comes with editable features. It contains large content boxes to add your information on topics like organization, analysts, business, data driven. You can also showcase facts, figures, and other relevant content using this PPT layout. Grab it now.
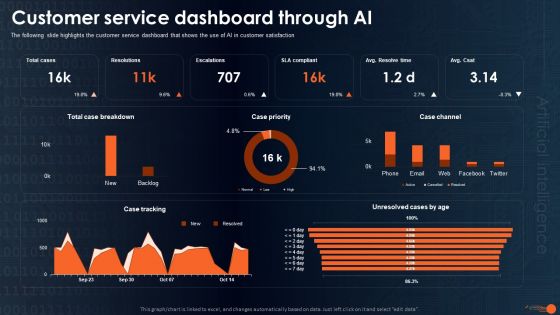
Integrating Aiops To Enhance Process Effectiveness Customer Service Dashboard Through AI Slides PDF
The following slide highlights the customer service dashboard that shows the use of AI in customer satisfaction Slidegeeks is here to make your presentations a breeze with Integrating Aiops To Enhance Process Effectiveness Customer Service Dashboard Through AI Slides PDF With our easy-to-use and customizable templates, you can focus on delivering your ideas rather than worrying about formatting. With a variety of designs to choose from, youre sure to find one that suits your needs. And with animations and unique photos, illustrations, and fonts, you can make your presentation pop. So whether youre giving a sales pitch or presenting to the board, make sure to check out Slidegeeks first.
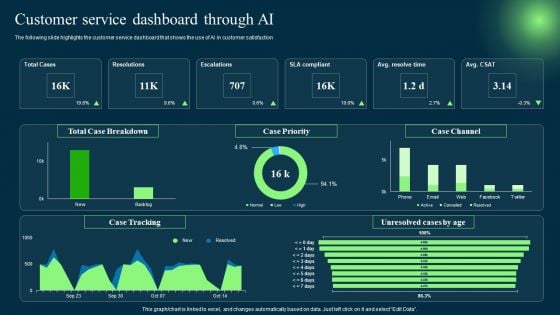
Introduction To Artificial Intelligence In Operation Management Industry Customer Service Dashboard Through AI Topics PDF
The following slide highlights the customer service dashboard that shows the use of AI in customer satisfaction. Slidegeeks is here to make your presentations a breeze with Introduction To Artificial Intelligence In Operation Management Industry Customer Service Dashboard Through AI Topics PDF With our easy-to-use and customizable templates, you can focus on delivering your ideas rather than worrying about formatting. With a variety of designs to choose from, you are sure to find one that suits your needs. And with animations and unique photos, illustrations, and fonts, you can make your presentation pop. So whether you are giving a sales pitch or presenting to the board, make sure to check out Slidegeeks first.
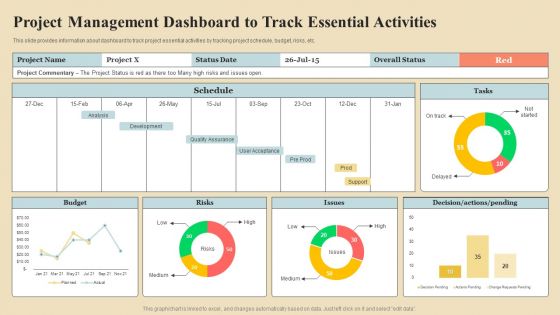
Project Coordination Plan Project Management Dashboard To Track Essential Activities Rules PDF
This slide provides information about dashboard to track project essential activities by tracking project schedule, budget, risks, etc. Slidegeeks is here to make your presentations a breeze with Project Coordination Plan Project Management Dashboard To Track Essential Activities Rules PDF With our easy to use and customizable templates, you can focus on delivering your ideas rather than worrying about formatting. With a variety of designs to choose from, you are sure to find one that suits your needs. And with animations and unique photos, illustrations, and fonts, you can make your presentation pop. So whether you are giving a sales pitch or presenting to the board, make sure to check out Slidegeeks first.
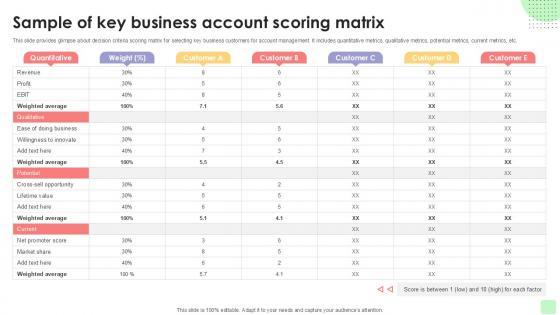
Sample Of Key Business Account Detailed Business Account PPT Presentation Strategy SS V
This slide provides glimpse about decision criteria scoring matrix for selecting key business customers for account management. It includes quantitative metrics, qualitative metrics, potential metrics, current metrics, etc. Step up your game with our enchanting Sample Of Key Business Account Detailed Business Account PPT Presentation Strategy SS V deck, guaranteed to leave a lasting impression on your audience. Crafted with a perfect balance of simplicity, and innovation, our deck empowers you to alter it to your specific needs. You can also change the color theme of the slide to mold it to your companys specific needs. Save time with our ready-made design, compatible with Microsoft versions and Google Slides. Additionally, its available for download in various formats including JPG, JPEG, and PNG. Outshine your competitors with our fully editable and customized deck. This slide provides glimpse about decision criteria scoring matrix for selecting key business customers for account management. It includes quantitative metrics, qualitative metrics, potential metrics, current metrics, etc.

Next Step For Land And Building Photography Service Proposal Ppt Outline Example PDF
The following slide displays the next step that the organization has to take once the land and building photography service proposal has been signed. It covers discussion for project and project, acceptance of proposal etc. The Next Step For Land And Building Photography Service Proposal Ppt Outline Example PDF is a compilation of the most recent design trends as a series of slides. It is suitable for any subject or industry presentation, containing attractive visuals and photo spots for businesses to clearly express their messages. This template contains a variety of slides for the user to input data, such as structures to contrast two elements, bullet points, and slides for written information. Slidegeeks is prepared to create an impression.
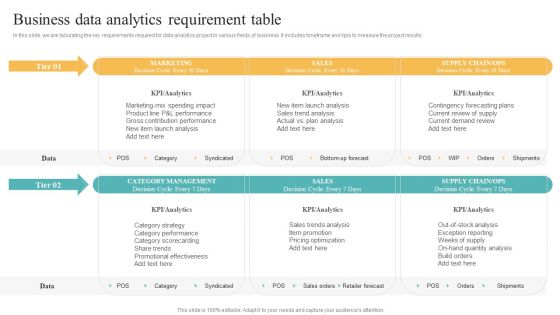
Transformation Toolkit Competitive Intelligence Information Analysis Business Data Analytics Requirement Table Elements PDF
In this slide, we are tabulating the key requirements required for data analytics project in various fields of business. It includes timeframe and kpis to measure the project results. Slidegeeks is here to make your presentations a breeze with Transformation Toolkit Competitive Intelligence Information Analysis Business Data Analytics Requirement Table Elements PDF With our easy to use and customizable templates, you can focus on delivering your ideas rather than worrying about formatting. With a variety of designs to choose from, you are sure to find one that suits your needs. And with animations and unique photos, illustrations, and fonts, you can make your presentation pop. So whether you are giving a sales pitch or presenting to the board, make sure to check out Slidegeeks first.

Marketers Guide To Data Analysis Optimization Top Marketing Analytics Software Comparison Pictures PDF
This slide covers a comparative analysis of the market analytics system based on features such as real-time analytics and insights, brand measurement capabilities, contextualized customer and market insights, annual media plan recommendations, etc. Create an editable Marketers Guide To Data Analysis Optimization Top Marketing Analytics Software Comparison Pictures PDF that communicates your idea and engages your audience. Whether youre presenting a business or an educational presentation, pre designed presentation templates help save time. Marketers Guide To Data Analysis Optimization Top Marketing Analytics Software Comparison Pictures PDF is highly customizable and very easy to edit, covering many different styles from creative to business presentations. Slidegeeks has creative team members who have crafted amazing templates. So, go and get them without any delay.
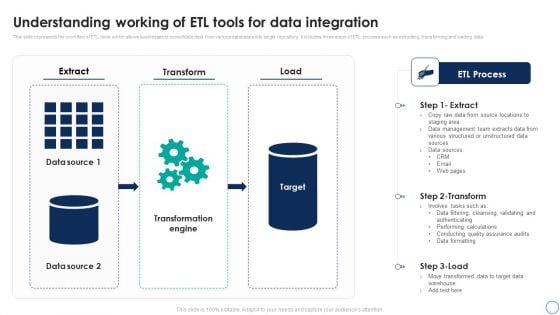
Business Analytics Application Understanding Working Of ETL Tools For Data Structure PDF
This slide represents the workflow of ETL tools which allows businesses to consolidate data from various databases into single repository. It includes three steps of ETL process such as extracting, transforming and loading data. This Business Analytics Application Understanding Working Of ETL Tools For Data Structure PDF from Slidegeeks makes it easy to present information on your topic with precision. It provides customization options, so you can make changes to the colors, design, graphics, or any other component to create a unique layout. It is also available for immediate download, so you can begin using it right away. Slidegeeks has done good research to ensure that you have everything you need to make your presentation stand out. Make a name out there for a brilliant performance.
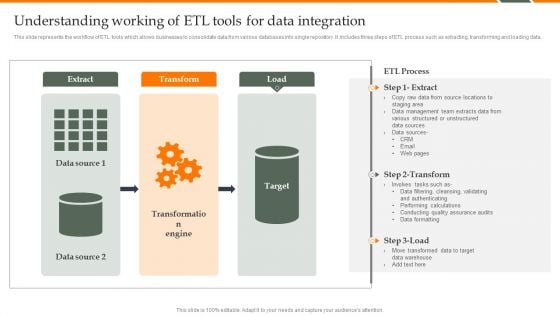
Human Resource Analytics Understanding Working Of ETL Tools For Data Integration Microsoft PDF
This slide represents the workflow of ETL tools which allows businesses to consolidate data from various databases into single repository. It includes three steps of ETL process such as extracting, transforming and loading data. Do you know about Slidesgeeks Human Resource Analytics Understanding Working Of ETL Tools For Data Integration Microsoft PDF These are perfect for delivering any kind od presentation. Using it, create PowerPoint presentations that communicate your ideas and engage audiences. Save time and effort by using our pre-designed presentation templates that are perfect for a wide range of topic. Our vast selection of designs covers a range of styles, from creative to business, and are all highly customizable and easy to edit. Download as a PowerPoint template or use them as Google Slides themes.
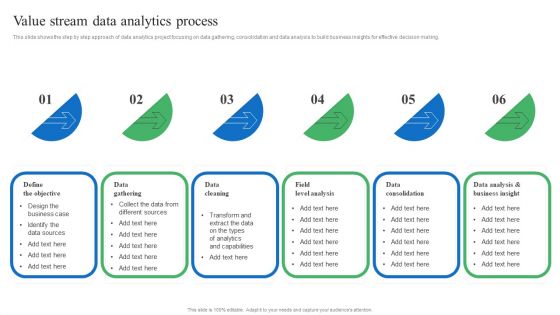
Toolkit For Data Science And Analytics Transition Value Stream Data Analytics Process Background PDF
This slide shows the step by step approach of data analytics project focusing on data gathering, consolidation and data analysis to build business insights for effective decision making. Find highly impressive Toolkit For Data Science And Analytics Transition Value Stream Data Analytics Process Background PDF on Slidegeeks to deliver a meaningful presentation. You can save an ample amount of time using these presentation templates. No need to worry to prepare everything from scratch because Slidegeeks experts have already done a huge research and work for you. You need to download Toolkit For Data Science And Analytics Transition Value Stream Data Analytics Process Background PDF for your upcoming presentation. All the presentation templates are 100 percent editable and you can change the color and personalize the content accordingly. Download now.
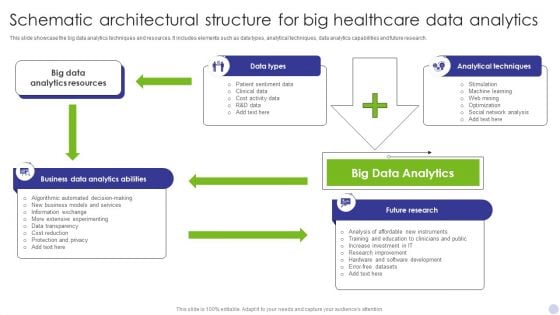
Schematic Architectural Structure For Big Healthcare Data Analytics Portrait PDF
This slide showcase the big data analytics techniques and resources. It includes elements such as data types, analytical techniques, data analytics capabilities and future research. Showcasing this set of slides titled Schematic Architectural Structure For Big Healthcare Data Analytics Portrait PDF. The topics addressed in these templates are Big Data Analytics, Analytical Techniques, Future Research. All the content presented in this PPT design is completely editable. Download it and make adjustments in color, background, font etc. as per your unique business setting.
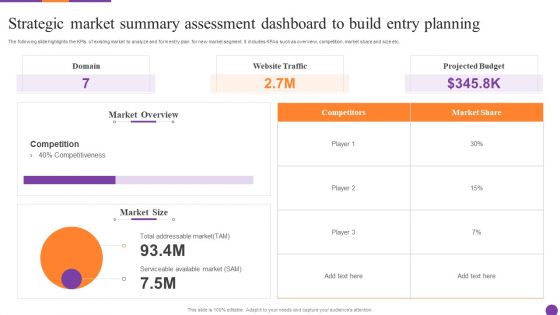
Strategic Market Summary Assessment Dashboard To Build Entry Planning Ppt Layouts Background Image PDF
The following slide highlights the KPIs of existing market to analyze and form entry plan for new market segment. It includes KPAs such as overview, competition, market share and size etc. Persuade your audience using this Strategic Market Summary Assessment Dashboard To Build Entry Planning Ppt Layouts Background Image PDF. This PPT design covers one stages, thus making it a great tool to use. It also caters to a variety of topics including Market Overview, Website Traffic, Projected Budget. Download this PPT design now to present a convincing pitch that not only emphasizes the topic but also showcases your presentation skills.
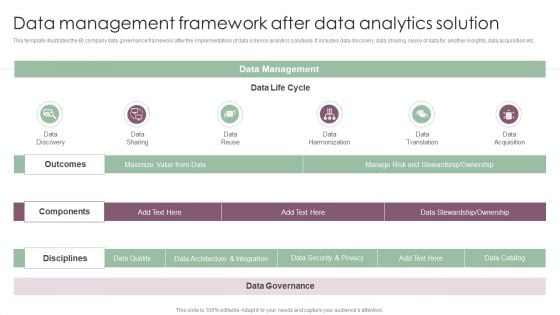
Information Analysis And BI Playbook Data Management Framework After Data Analytics Solution Template PDF
This template illustrates the BI company data governance framework after the implementation of data science analytics solutions. It includes data discovery, data sharing, reuse of data for another insights, data acquisition etc. Are you in need of a template that can accommodate all of your creative concepts This one is crafted professionally and can be altered to fit any style. Use it with Google Slides or PowerPoint. Include striking photographs, symbols, depictions, and other visuals. Fill, move around, or remove text boxes as desired. Test out color palettes and font mixtures. Edit and save your work, or work with colleagues. Download Information Analysis And BI Playbook Data Management Framework After Data Analytics Solution Template PDF and observe how to make your presentation outstanding. Give an impeccable presentation to your group and make your presentation unforgettable.
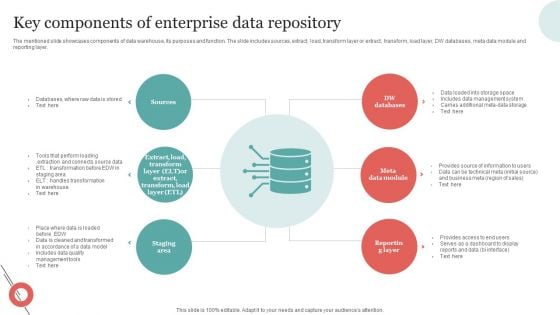
Key Components Of Enterprise Data Repository Mockup PDF
The mentioned slide showcases components of data warehouse, its purposes and function. The slide includes sources, extract, load, transform layer or extract, transform, load layer, DW databases, meta data module and reporting layer. Pitch your topic with ease and precision using this Key Components Of Enterprise Data Repository Mockup PDF. This layout presents information on Sources, Databases, Data Module. It is also available for immediate download and adjustment. So, changes can be made in the color, design, graphics or any other component to create a unique layout.
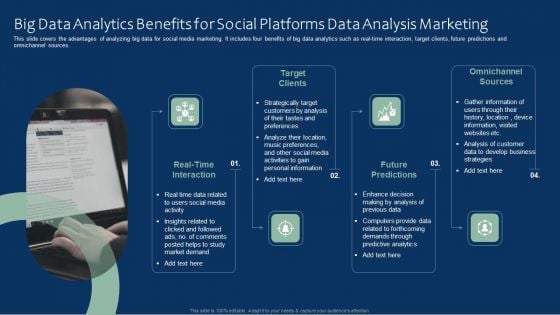
Big Data Analytics Benefits For Social Platforms Data Analysis Marketing Mockup PDF
This slide covers the advantages of analyzing big data for social media marketing. It includes four benefits of big data analytics such as real-time interaction, target clients, future predictions and omnichannel sources. Presenting Big Data Analytics Benefits For Social Platforms Data Analysis Marketing Mockup PDF to dispense important information. This template comprises four stages. It also presents valuable insights into the topics including Target Clients, Future Predictions, Omnichannel Sources. This is a completely customizable PowerPoint theme that can be put to use immediately. So, download it and address the topic impactfully.
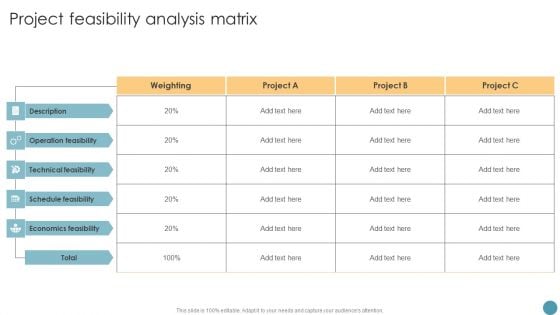
Project Feasibility Analysis Matrix Feasibility Analysis Report For Construction Project Designs PDF
The Project Feasibility Analysis Matrix Feasibility Analysis Report For Construction Project Designs PDF is a compilation of the most recent design trends as a series of slides. It is suitable for any subject or industry presentation, containing attractive visuals and photo spots for businesses to clearly express their messages. This template contains a variety of slides for the user to input data, such as structures to contrast two elements, bullet points, and slides for written information. Slidegeeks is prepared to create an impression.
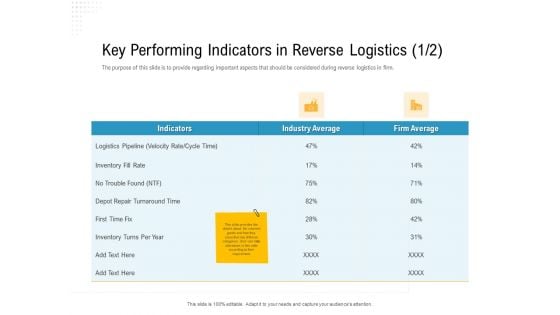
Reverse Logistic In Supply Chain Strategy Key Performing Indicators In Reverse Logistics Indicators Background PDF
The purpose of this slide is to provide regarding important aspects that should be considered during reverse logistics in firm.Deliver an awe inspiring pitch with this creative reverse logistic in supply chain strategy key performing indicators in reverse logistics indicators background pdf bundle. Topics like inventory fill rate, indicators, industry average can be discussed with this completely editable template. It is available for immediate download depending on the needs and requirements of the user.

Key Performance Indicator Tree Indicating Fixed And Variable Costs Diagrams PDF
Persuade your audience using this key performance indicator tree indicating fixed and variable costs diagrams pdf. This PPT design covers four stages, thus making it a great tool to use. It also caters to a variety of topics including costs, revenue, profit. Download this PPT design now to present a convincing pitch that not only emphasizes the topic but also showcases your presentation skills.
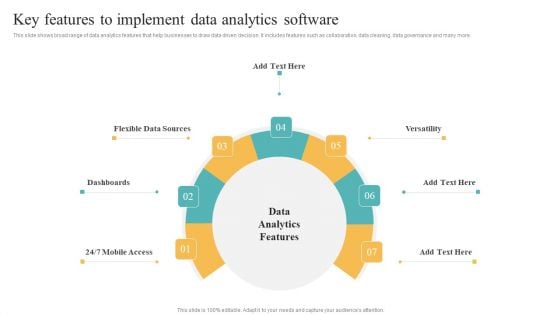
Transformation Toolkit Competitive Intelligence Information Analysis Key Features To Implement Data Analytics Software Pictures PDF
This slide shows broad range of data analytics features that help businesses to draw data driven decision. It includes features such as collaboration, data cleaning, data governance and many more. Welcome to our selection of the Transformation Toolkit Competitive Intelligence Information Analysis Key Features To Implement Data Analytics Software Pictures PDF. These are designed to help you showcase your creativity and bring your sphere to life. Planning and Innovation are essential for any business that is just starting out. This collection contains the designs that you need for your everyday presentations. All of our PowerPoints are 100 percent editable, so you can customize them to suit your needs. This multi purpose template can be used in various situations. Grab these presentation templates today.

Deployment Of Business Process Dashboard To Measure Business Financial Performance Microsoft PDF
This slide shows the dashboard to measure business financial performance which focuses on revenues, debt to equity, net profit margin, gross profit margin and return on equity. Do you have to make sure that everyone on your team knows about any specific topic I yes, then you should give Deployment Of Business Process Dashboard To Measure Business Financial Performance Microsoft PDF a try. Our experts have put a lot of knowledge and effort into creating this impeccable Deployment Of Business Process Dashboard To Measure Business Financial Performance Microsoft PDF. You can use this template for your upcoming presentations, as the slides are perfect to represent even the tiniest detail. You can download these templates from the Slidegeeks website and these are easy to edit. So grab these today.
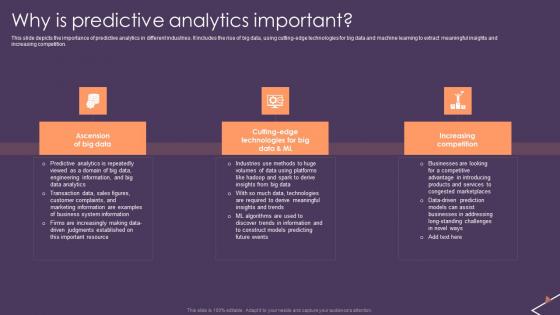
Predictive Analytics For Empowering Why Is Predictive Analytics Important Pictures Pdf
This slide depicts the importance of predictive analytics in different industries. It includes the rise of big data, using cutting-edge technologies for big data and machine learning to extract meaningful insights and increasing competition. Slidegeeks is here to make your presentations a breeze with Predictive Analytics For Empowering Why Is Predictive Analytics Important Pictures Pdf With our easy-to-use and customizable templates, you can focus on delivering your ideas rather than worrying about formatting. With a variety of designs to choose from, you are sure to find one that suits your needs. And with animations and unique photos, illustrations, and fonts, you can make your presentation pop. So whether you are giving a sales pitch or presenting to the board, make sure to check out Slidegeeks first. This slide depicts the importance of predictive analytics in different industries. It includes the rise of big data, using cutting-edge technologies for big data and machine learning to extract meaningful insights and increasing competition.


 Continue with Email

 Home
Home


