Snapshot
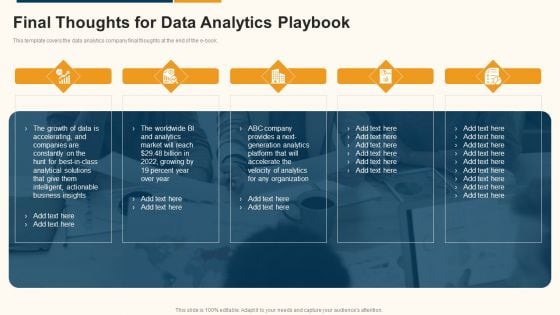
Data Interpretation And Analysis Playbook Final Thoughts For Data Analytics Playbook Graphics PDF
This template covers the data analytics company final thoughts at the end of the e-book. This is a data interpretation and analysis playbook final thoughts for data analytics playbook graphics pdf template with various stages. Focus and dispense information on five stages using this creative set, that comes with editable features. It contains large content boxes to add your information on topics like business, analytics, growth, organization. You can also showcase facts, figures, and other relevant content using this PPT layout. Grab it now.
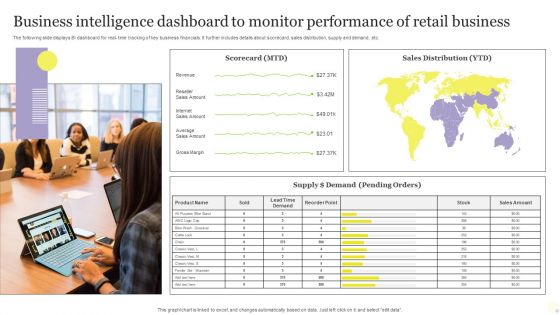
Business Intelligence Dashboard To Monitor Performance Of Retail Business Infographics PDF
The following slide displays BI dashboard for real time tracking of key business financials. It further includes details about scorecard, sales distribution, supply and demand, etc. Pitch your topic with ease and precision using this Business Intelligence Dashboard To Monitor Performance Of Retail Business Infographics PDF. This layout presents information on Business Intelligence Dashboard, Monitor Performance, Retail Business. It is also available for immediate download and adjustment. So, changes can be made in the color, design, graphics or any other component to create a unique layout.
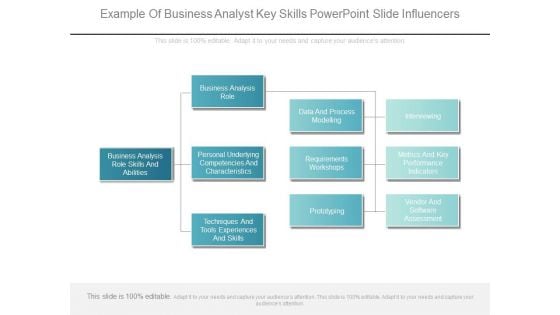
Example Of Business Analyst Key Skills Powerpoint Slide Influencers
This is a example of business analyst key skills powerpoint slide influencers. This is a three stage process. The stages in this process are business analysis role skills and abilities, business analysis role, personal underlying competencies and characteristics, techniques and tools experiences and skills, data and process modelling, requirements workshops, prototyping, interviewing, metrics and key performance indicators, vendor and software assessment.
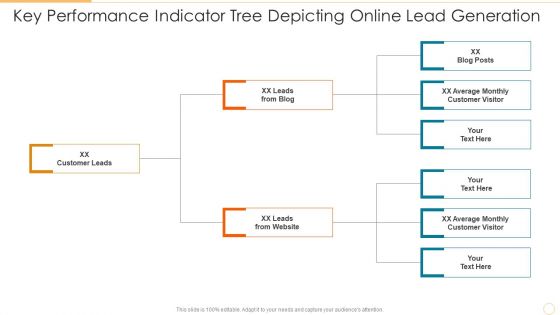
Key Performance Indicator Tree Depicting Online Lead Generation Information PDF
Persuade your audience using this key performance indicator tree depicting online lead generation information pdf. This PPT design covers three stages, thus making it a great tool to use. It also caters to a variety of topics including customer leads, leads from blog, leads from website. Download this PPT design now to present a convincing pitch that not only emphasizes the topic but also showcases your presentation skills.
Project Key Performance Indicator Tree Illustrating Customer Satisfaction Icons PDF
Persuade your audience using this project key performance indicator tree illustrating customer satisfaction icons pdf. This PPT design covers four stages, thus making it a great tool to use. It also caters to a variety of topics including total customer complaints, total customer notifications, customer satisfaction project. Download this PPT design now to present a convincing pitch that not only emphasizes the topic but also showcases your presentation skills.
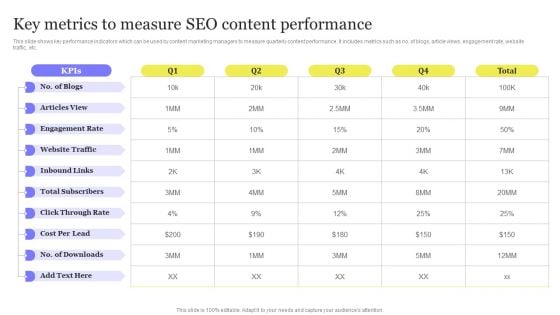
Enhancing Digital Visibility Using SEO Content Strategy Key Metrics To Measure SEO Content Performance Guidelines PDF
This slide shows key performance indicators which can be used by content marketing managers to measure quarterly content performance. It includes metrics such as no. of blogs, article views, engagement rate, website traffic, etc. Make sure to capture your audiences attention in your business displays with our gratis customizable Enhancing Digital Visibility Using SEO Content Strategy Key Metrics To Measure SEO Content Performance Guidelines PDF. These are great for business strategies, office conferences, capital raising or task suggestions. If you desire to acquire more customers for your tech business and ensure they stay satisfied, create your own sales presentation with these plain slides.
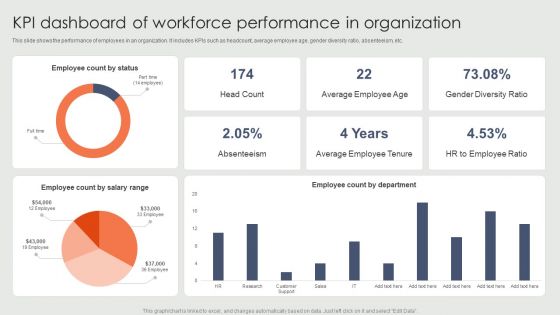
KPI Dashboard Of Workforce Performance In Organization Ppt Gallery Portfolio PDF
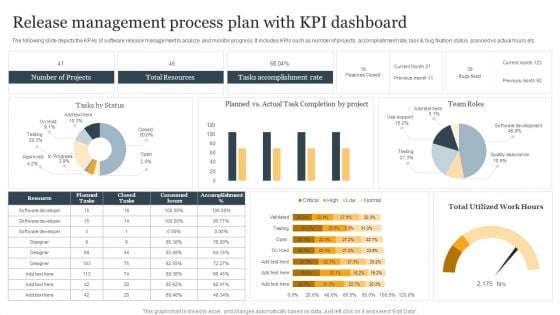
Release Management Process Plan With KPI Dashboard Ppt Infographic Template Structure PDF
The following slide depicts the KPAs of software release management to analyze and monitor progress. It includes KPIs such as number of projects, accomplishment rate, task and bug fixation status, planned vs actual hours etc. Showcasing this set of slides titled Release Management Process Plan With KPI Dashboard Ppt Infographic Template Structure PDF. The topics addressed in these templates are Number Of Projects, Total Resources, Tasks Accomplishment Rate. All the content presented in this PPT design is completely editable. Download it and make adjustments in color, background, font etc. as per your unique business setting.
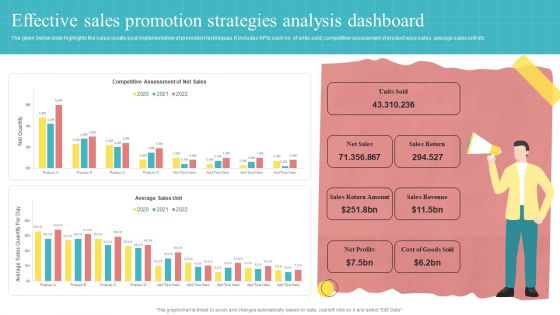
Effective Sales Promotion Strategies Analysis Dashboard Ppt PowerPoint Presentation Slides Background Designs PDF
The given below slide highlights the sales results post implementation of promotion techniques. It includes KPIs such no. of units sold, competitive assessment of product wise sales, average sales unit etc.Showcasing this set of slides titled Effective Sales Promotion Strategies Analysis Dashboard Ppt PowerPoint Presentation Slides Background Designs PDF. The topics addressed in these templates are Return Amount, Sales Return, Sales Revenue. All the content presented in this PPT design is completely editable. Download it and make adjustments in color, background, font etc. as per your unique business setting.
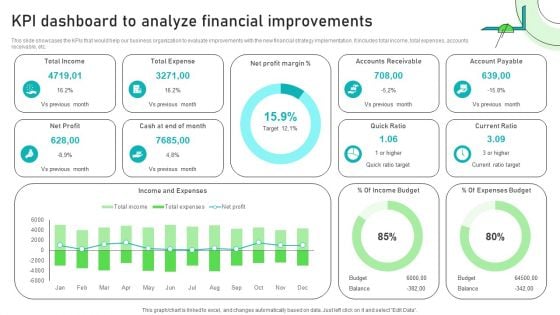
Adjusting Financial Strategies And Planning KPI Dashboard To Analyze Financial Improvements Inspiration PDF
This slide showcases the KPIs that would help our business organization to evaluate improvements with the new financial strategy implementation. It includes total income, total expenses, accounts receivable, etc. The best PPT templates are a great way to save time, energy, and resources. Slidegeeks have 100 percent editable powerpoint slides making them incredibly versatile. With these quality presentation templates, you can create a captivating and memorable presentation by combining visually appealing slides and effectively communicating your message. Download Adjusting Financial Strategies And Planning KPI Dashboard To Analyze Financial Improvements Inspiration PDF from Slidegeeks and deliver a wonderful presentation.
Big Data Analysis Icon Data Analytic Business Ppt PowerPoint Presentation Complete Deck
Presenting this set of slides with name big data analysis icon data analytic business ppt powerpoint presentation complete deck. The topics discussed in these slides are data analytic, business, growth, gear, magnifying glass. This is a completely editable PowerPoint presentation and is available for immediate download. Download now and impress your audience.
Business To Business Sales Playbook Sales Management Activities Tracking Dashboard Icons PDF
This slide provides information regarding sales management activities tracking dashboard to measure closed business, sales pipeline, sales activity by sales rep, month over month growth, forecast by month, etc. Deliver and pitch your topic in the best possible manner with this business to business sales playbook sales management activities tracking dashboard icons pdf. Use them to share invaluable insights on sales management activities tracking dashboard and impress your audience. This template can be altered and modified as per your expectations. So, grab it now.
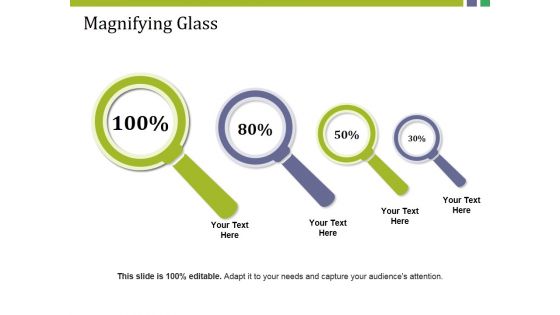
Magnifying Glass Ppt PowerPoint Presentation Pictures Example File
This is a magnifying glass ppt powerpoint presentation pictures example file. This is a four stage process. The stages in this process are magnifier glass, research, business, marketing, focus.
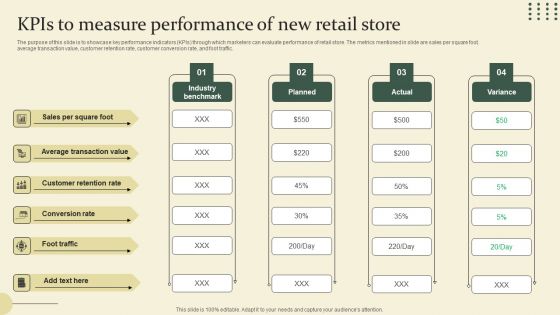
Location Identification For New Retail Outlet Kpis To Measure Performance Of New Retail Store Pictures PDF
The purpose of this slide is to showcase key performance indicators KPIs through which marketers can evaluate performance of retail store. The metrics mentioned in slide are sales per square foot, average transaction value, customer retention rate, customer conversion rate, and foot traffic. Take your projects to the next level with our ultimate collection of Location Identification For New Retail Outlet Kpis To Measure Performance Of New Retail Store Pictures PDF. Slidegeeks has designed a range of layouts that are perfect for representing task or activity duration, keeping track of all your deadlines at a glance. Tailor these designs to your exact needs and give them a truly corporate look with your own brand colors they will make your projects stand out from the rest
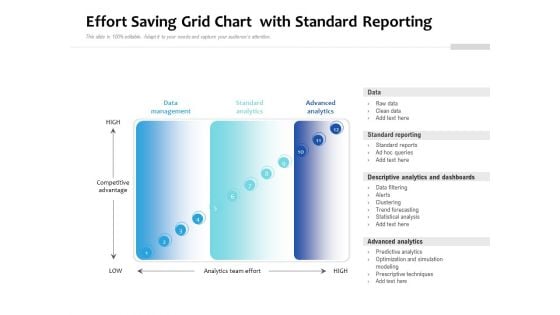
Effort Saving Grid Chart With Standard Reporting Ppt PowerPoint Presentation Layouts Graphics PDF
Presenting effort saving grid chart with standard reporting ppt powerpoint presentation layouts graphics pdf to dispense important information. This template comprises twelve stages. It also presents valuable insights into the topics including data management, standard analytics, advanced analytics. This is a completely customizable PowerPoint theme that can be put to use immediately. So, download it and address the topic impactfully.
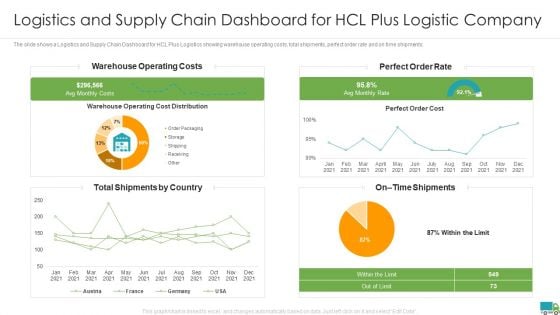
Generating Logistics Value Business Logistics And Supply Chain Dashboard For Hcl Plus Logistic Company Microsoft PDF
The slide shows a Logistics and Supply Chain Dashboard for HCL Plus Logistics showing warehouse operating costs, total shipments, perfect order rate and on time shipments. Deliver an awe inspiring pitch with this creative generating logistics value business latest logistic technologies that can form unique valuable proposition pictures pdf bundle. Topics like warehouse operating costs, perfect order rate, total shipments by country can be discussed with this completely editable template. It is available for immediate download depending on the needs and requirements of the user.
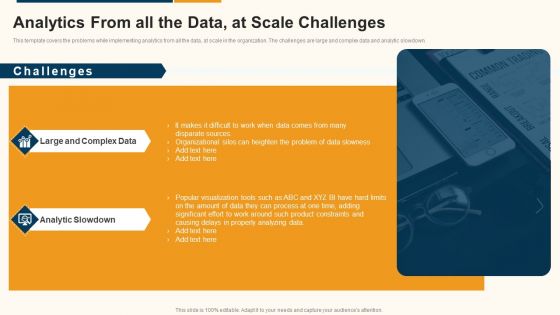
Data Interpretation And Analysis Playbook Analytics From All The Data At Scale Challenges Structure PDF
This template covers the problems while implementing analytics from all the data, at scale in the organization. The challenges are large and complex data and analytic slowdown. This is a data interpretation and analysis playbook analytics from all the data at scale challenges structure pdf template with various stages. Focus and dispense information on two stages using this creative set, that comes with editable features. It contains large content boxes to add your information on topics like large and complex data, analytic slowdown. You can also showcase facts, figures, and other relevant content using this PPT layout. Grab it now.
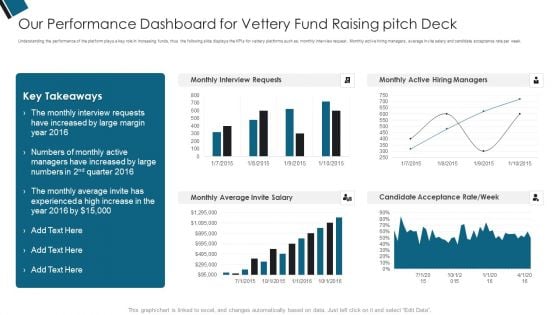
Our Performance Dashboard For Vettery Fund Raising Pitch Deck Ppt PowerPoint Presentation Professional Background PDF
Understanding the performance of the platform plays a key role in increasing funds, thus the following slide displays the KPIs for vettery platforms such as monthly interview request , Monthly active hiring managers, average invite salary and candidate acceptance rate per week. Deliver an awe inspiring pitch with this creative Our Performance Dashboard For Vettery Fund Raising Pitch Deck Ppt PowerPoint Presentation Professional Background PDF bundle. Topics like Monthly Interview, Managers Increased, Experienced A High can be discussed with this completely editable template. It is available for immediate download depending on the needs and requirements of the user.
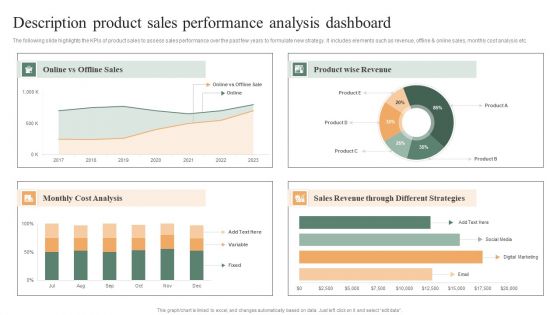
Description Product Sales Performance Analysis Dashboard Ppt PowerPoint Presentation File Samples PDF
The following slide highlights the KPIs of product sales to assess sales performance over the past few years to formulate new strategy. It includes elements such as revenue, offline and online sales, monthly cost analysis etc. Pitch your topic with ease and precision using this Description Product Sales Performance Analysis Dashboard Ppt PowerPoint Presentation File Samples PDF. This layout presents information on Product Wise Revenue, Monthly Cost Analysis, Sales Revenue, Different Strategies. It is also available for immediate download and adjustment. So, changes can be made in the color, design, graphics or any other component to create a unique layout.
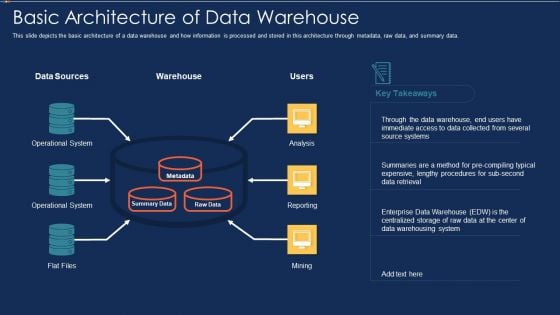
Data Warehousing IT Basic Architecture Of Data Warehouse Ppt Show Example PDF
This slide depicts the basic architecture of a data warehouse and how information is processed and stored in this architecture through metadata, raw data, and summary data. This is a data warehousing it basic architecture of data warehouse ppt show example pdf template with various stages. Focus and dispense information on six stages using this creative set, that comes with editable features. It contains large content boxes to add your information on topics like operational system, analysis, reporting, mining, flat files. You can also showcase facts, figures, and other relevant content using this PPT layout. Grab it now.
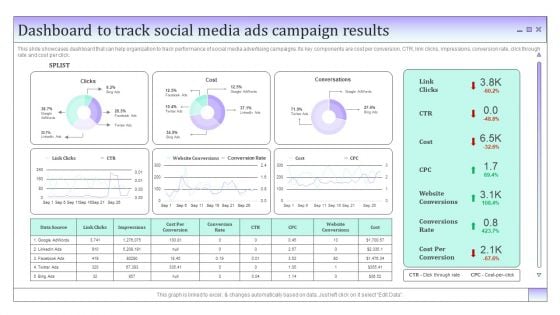
Business To Business Social Dashboard To Track Social Media Ads Campaign Results Demonstration PDF
This slide showcases dashboard that can help organization to track performance of social media advertising campaigns. Its key components are cost per conversion, CTR, link clicks, impressions, conversion rate, click through rate and cost per click. Presenting this PowerPoint presentation, titled Business To Business Social Dashboard To Track Social Media Ads Campaign Results Demonstration PDF, with topics curated by our researchers after extensive research. This editable presentation is available for immediate download and provides attractive features when used. Download now and captivate your audience. Presenting this Business To Business Social Dashboard To Track Social Media Ads Campaign Results Demonstration PDF. Our researchers have carefully researched and created these slides with all aspects taken into consideration. This is a completely customizable Business To Business Social Dashboard To Track Social Media Ads Campaign Results Demonstration PDF that is available for immediate downloading. Download now and make an impact on your audience. Highlight the attractive features available with our PPTs.
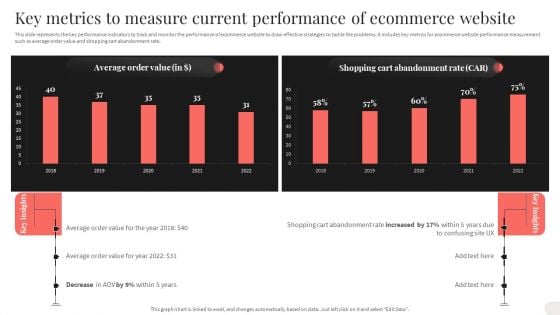
Key Metrics To Measure Current Performance Of Ecommerce Website Structure PDF
This slide represents the key performance indicators to track and monitor the performance of ecommerce website to draw effective strategies to tackle the problems. It includes key metrics for ecommerce website performance measurement such as average order value and shopping cart abandonment rate. There are so many reasons you need a Key Metrics To Measure Current Performance Of Ecommerce Website Structure PDF. The first reason is you can not spend time making everything from scratch, Thus, Slidegeeks has made presentation templates for you too. You can easily download these templates from our website easily.
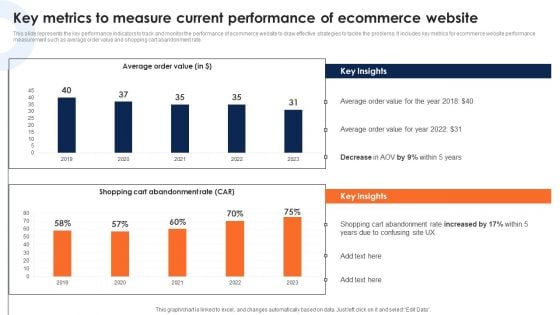
Key Metrics To Measure Current Performance Of Ecommerce Website Clipart PDF
This slide represents the key performance indicators to track and monitor the performance of ecommerce website to draw effective strategies to tackle the problems. It includes key metrics for ecommerce website performance measurement such as average order value and shopping cart abandonment rate.The best PPT templates are a great way to save time, energy, and resources. Slidegeeks have 100precent editable powerpoint slides making them incredibly versatile. With these quality presentation templates, you can create a captivating and memorable presentation by combining visually appealing slides and effectively communicating your message. Download Key Metrics To Measure Current Performance Of Ecommerce Website Clipart PDF from Slidegeeks and deliver a wonderful presentation.

Employee Relations In Human Resource Key Metrics To Track Employee Relations Performance
This slide shows various metrics which can be used by organizations to evaluate employee relations performance of current year. It also contains information regarding previous year key performance indicators. Coming up with a presentation necessitates that the majority of the effort goes into the content and the message you intend to convey. The visuals of a PowerPoint presentation can only be effective if it supplements and supports the story that is being told. Keeping this in mind our experts created Employee Relations In Human Resource Key Metrics To Track Employee Relations Performance to reduce the time that goes into designing the presentation. This way, you can concentrate on the message while our designers take care of providing you with the right template for the situation. This slide shows various metrics which can be used by organizations to evaluate employee relations performance of current year. It also contains information regarding previous year key performance indicators.

Big Data Interpretation Evaluation In Risk Management Lifecycle Designs PDF
This slide demonstrates the four phases of big data analytics assessment in risk management lifecycle. It includes four phases such as risk assessment and measurement, front office and risk operations, risk control, monitoring, reporting and governance. Persuade your audience using this Big Data Interpretation Evaluation In Risk Management Lifecycle Designs PDF. This PPT design covers four stages, thus making it a great tool to use. It also caters to a variety of topics including Risk Assessment And Measurement, Risk Control And Monitoring , Risk Reporting And Governance. Download this PPT design now to present a convincing pitch that not only emphasizes the topic but also showcases your presentation skills.
Business Model Opening Restaurant Coffee Shop Business Dashboard Plan Icons PDF
This slide shows the coffee shop business dashboard which includes sales month, gross margin by category, sales and profit details, etc. Deliver an awe inspiring pitch with this creative business model opening restaurant coffee shop business dashboard plan icons pdf bundle. Topics like gross margin, plan sales, sales and profit can be discussed with this completely editable template. It is available for immediate download depending on the needs and requirements of the user.
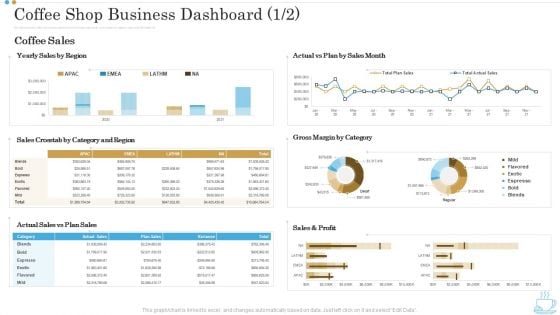
Coffee Shop Business Dashboard Category Business Plan For Opening A Coffeehouse Ppt Slides Graphics Example PDF
This slide shows the coffee shop business dashboard which includes sales month, gross margin by category, sales and profit details, etc. Deliver and pitch your topic in the best possible manner with this coffee shop business dashboard category business plan for opening a coffeehouse ppt slides graphics example pdf. Use them to share invaluable insights on sales, plan, gross margin and impress your audience. This template can be altered and modified as per your expectations. So, grab it now.
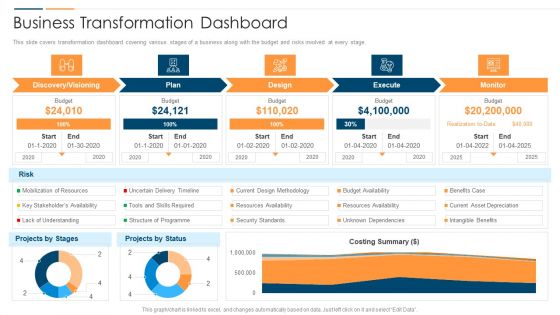
Revolution In Online Business Business Transformation Dashboard Ppt PowerPoint Presentation Gallery Structure PDF
This slide covers transformation dashboard covering various stages of a business along with the budget and risks involved at every stage. Deliver an awe inspiring pitch with this creative Revolution In Online Business Business Transformation Dashboard Ppt PowerPoint Presentation Gallery Structure PDF bundle. Topics like Discovery Visioning Plan, Design Execute Monitor can be discussed with this completely editable template. It is available for immediate download depending on the needs and requirements of the user.
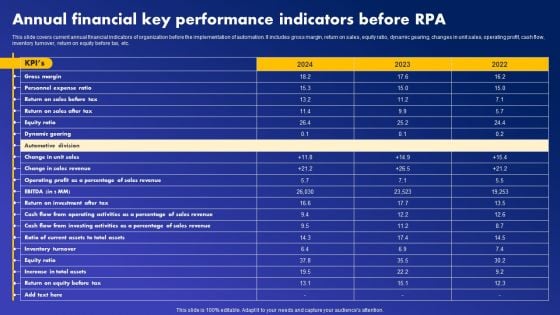
Annual Financial Key Performance Indicators Before RPA Download PDF
This slide covers current annual financial indicators of organization before the implementation of automation. It includes gross margin, return on sales, equity ratio, dynamic gearing, changes in unit sales, operating profit, cash flow, inventory turnover, return on equity before tax, etc. Slidegeeks is one of the best resources for PowerPoint templates. You can download easily and regulate Annual Financial Key Performance Indicators Before RPA Download PDF for your personal presentations from our wonderful collection. A few clicks is all it takes to discover and get the most relevant and appropriate templates. Use our Templates to add a unique zing and appeal to your presentation and meetings. All the slides are easy to edit and you can use them even for advertisement purposes.
Business Performance Monitoring And Business Goals Update Dashboard Icon Template PDF
Persuade your audience using this business performance monitoring and business goals update dashboard icon template pdf. This PPT design covers three stages, thus making it a great tool to use. It also caters to a variety of topics including business performance monitoring and business goals update dashboard icon. Download this PPT design now to present a convincing pitch that not only emphasizes the topic but also showcases your presentation skills.
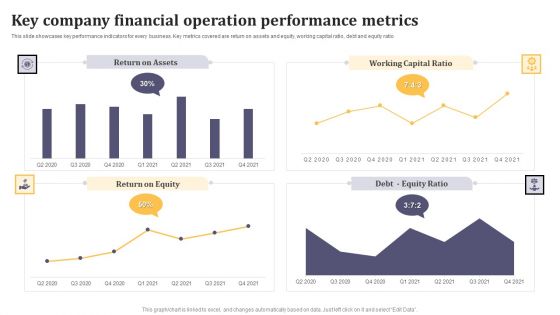
Key Company Financial Operation Performance Metrics Ppt Infographic Template Example Introduction PDF
This slide showcases key performance indicators for every business. Key metrics covered are return on assets and equity, working capital ratio, debt and equity ratio. Showcasing this set of slides titled Key Company Financial Operation Performance Metrics Ppt Infographic Template Example Introduction PDF. The topics addressed in these templates are Return on Assets, Working Capital Ratio, Return on Equity. All the content presented in this PPT design is completely editable. Download it and make adjustments in color, background, font etc. as per your unique business setting.
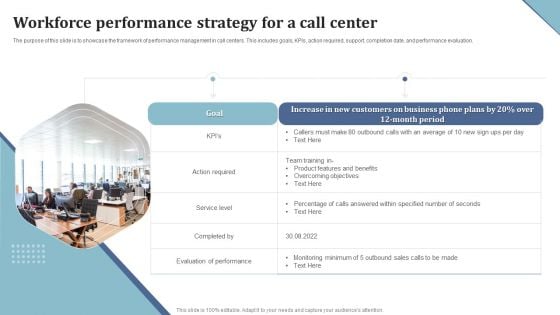
Workforce Performance Strategy For A Call Center Ppt Model Format PDF
The purpose of this slide is to showcase the framework of performance management in call centers. This includes goals, KPIs, action required, support, completion date, and performance evaluation. Persuade your audience using this Workforce Performance Strategy For A Call Center Ppt Model Format PDF. This PPT design covers one stages, thus making it a great tool to use. It also caters to a variety of topics including Team Training, Goal, Action Required. Download this PPT design now to present a convincing pitch that not only emphasizes the topic but also showcases your presentation skills.
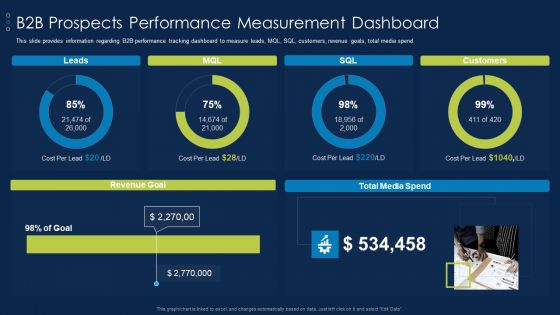
Business To Business Account B2B Prospects Performance Measurement Dashboard Slides PDF
This slide provides information regarding B2B performance tracking dashboard to measure leads, MQL, SQL, customers, revenue goals, total media spend. Deliver an awe inspiring pitch with this creative Business To Business Account B2B Prospects Performance Measurement Dashboard Slides PDF bundle. Topics like Leads, MQL, SQL, Customers, Total Media Spend, Revenue Goal can be discussed with this completely editable template. It is available for immediate download depending on the needs and requirements of the user.
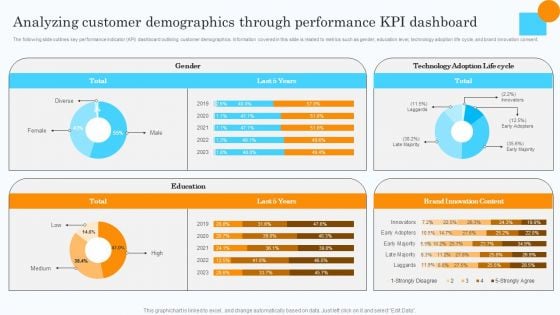
Market Research Assessment Of Target Market Requirements Analyzing Customer Demographics Clipart PDF
The following slide outlines key performance indicator KPI dashboard outlining customer demographics. Information covered in this slide is related to metrics such as gender, education level, technology adoption life cycle, and brand innovation consent. There are so many reasons you need a Market Research Assessment Of Target Market Requirements Analyzing Customer Demographics Clipart PDF. The first reason is you cannot spend time making everything from scratch, Thus, Slidegeeks has made presentation templates for you too. You can easily download these templates from our website easily.
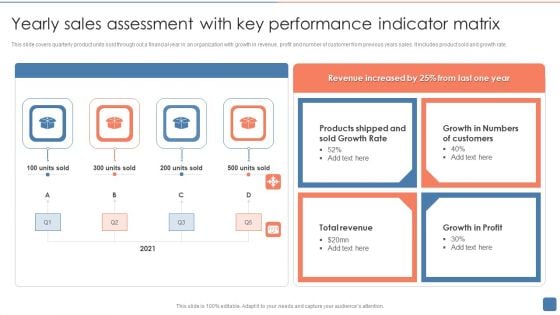
Yearly Sales Assessment With Key Performance Indicator Matrix Introduction PDF
This slide covers quarterly product units sold through out a financial year in an organization with growth in revenue, profit and number of customer from previous years sales. It includes product sold and growth rate. Presenting Yearly Sales Assessment With Key Performance Indicator Matrix Introduction PDF to dispense important information. This template comprises four stages. It also presents valuable insights into the topics including Sold Growth Rate, Customers, Growth In Profit. This is a completely customizable PowerPoint theme that can be put to use immediately. So, download it and address the topic impactfully.
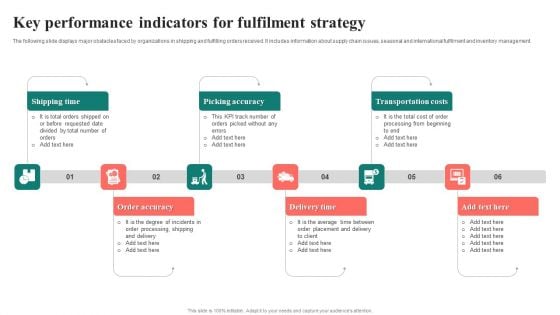
Key Performance Indicators For Fulfilment Strategy Slides PDF
The following slide displays major obstacles faced by organizations in shipping and fulfilling orders received. It includes information about supply chain issues, seasonal and international fulfilment and inventory management. Persuade your audience using this Key Performance Indicators For Fulfilment Strategy Slides PDF. This PPT design covers six stages, thus making it a great tool to use. It also caters to a variety of topics including Transportation Costs, Picking Accuracy, Order Accuracy. Download this PPT design now to present a convincing pitch that not only emphasizes the topic but also showcases your presentation skills.
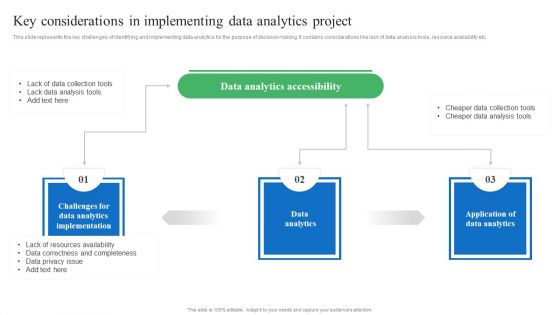
Toolkit For Data Science And Analytics Transition Key Considerations In Implementing Data Analytics Project Download PDF
This slide represents the key challenges of identifying and implementing data analytics for the purpose of decision making. It contains considerations like lack of data analysis tools, resource availability etc. From laying roadmaps to briefing everything in detail, our templates are perfect for you. You can set the stage with your presentation slides. All you have to do is download these easy to edit and customizable templates. Toolkit For Data Science And Analytics Transition Key Considerations In Implementing Data Analytics Project Download PDF will help you deliver an outstanding performance that everyone would remember and praise you for. Do download this presentation today.

Data Interpretation And Analysis Playbook The Escalating Value Of Data And Analytics Template PDF
This template covers the facts about bigdata, business intelligence and data analytics. It also depicts that enterprise data and analytics solutions will drive growth and revenue, when optimized for different businesses. Presenting data interpretation and analysis playbook the escalating value of data and analytics template pdf to provide visual cues and insights. Share and navigate important information on seven stages that need your due attention. This template can be used to pitch topics like telecommunications, manufacturing, business, analytics, service. In addtion, this PPT design contains high resolution images, graphics, etc, that are easily editable and available for immediate download.
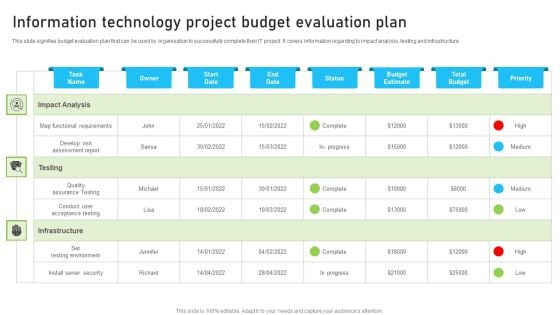
Information Technology Project Budget Evaluation Plan Pictures PDF
This slide signifies the project key performance indicator dashboard to evaluate financial budget evaluation. It covers information regarding to allocated and used budget. Pitch your topic with ease and precision using this Information Technology Project Budget Evaluation Plan Pictures PDF. This layout presents information on Develop Risk Assessment Report, Environment, Security. It is also available for immediate download and adjustment. So, changes can be made in the color, design, graphics or any other component to create a unique layout.
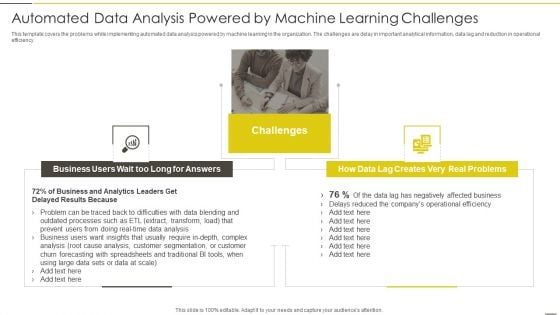
Administered Data And Analytic Quality Playbook Automated Data Analysis Powered Structure PDF
This template covers the problems while implementing automated data analysis powered by machine learning in the organization. The challenges are delay in important analytical information, data lag and reduction in operational efficiency.This is a Administered Data And Analytic Quality Playbook Automated Data Analysis Powered Structure PDF template with various stages. Focus and dispense information on two stages using this creative set, that comes with editable features. It contains large content boxes to add your information on topics like Business Analytics, Challenges Negatively, Affected Business You can also showcase facts, figures, and other relevant content using this PPT layout. Grab it now.
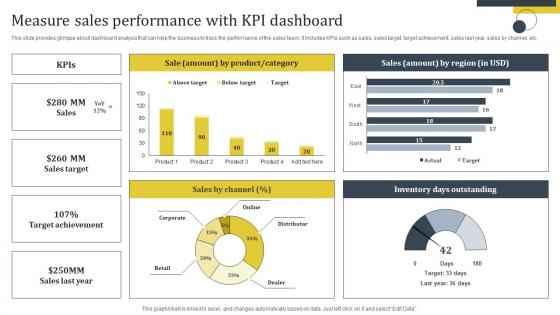
Enhance Customer Retention Measure Sales Performance With Kpi Dashboard Template Pdf
This slide provides glimpse about dashboard analysis that can help the business to track the performance of the sales team. It includes KPIs such as sales, sales target, target achievement, sales last year, sales by channel, etc. Explore a selection of the finest Enhance Customer Retention Measure Sales Performance With Kpi Dashboard Template Pdf here. With a plethora of professionally designed and pre-made slide templates, you can quickly and easily find the right one for your upcoming presentation. You can use our Enhance Customer Retention Measure Sales Performance With Kpi Dashboard Template Pdf to effectively convey your message to a wider audience. Slidegeeks has done a lot of research before preparing these presentation templates. The content can be personalized and the slides are highly editable. Grab templates today from Slidegeeks. This slide provides glimpse about dashboard analysis that can help the business to track the performance of the sales team. It includes KPIs such as sales, sales target, target achievement, sales last year, sales by channel, etc.
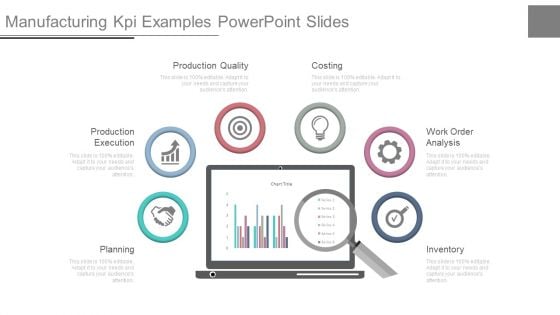
Manufacturing Kpi Examples Powerpoint Slides
This is a manufacturing kpi examples powerpoint slides. This is a six stage process. The stages in this process are planning, production execution, production quality, costing, work order analysis, inventory.
Magnifier Glass Ppt PowerPoint Presentation Visual Aids
This is a magnifier glass ppt powerpoint presentation visual aids. This is a four stage process. The stages in this process are business, strategy, marketing, analysis, success, magnifier glass.
Magnifier With Business Infographic Ppt PowerPoint Presentation Outline
This is a magnifier with business infographic ppt powerpoint presentation outline. This is a three stage process. The stages in this process are business, strategy, marketing, analysis, magnifier, technology.
Magnifying Glass Ppt PowerPoint Presentation Gallery Example Introduction
This is a magnifying glass ppt powerpoint presentation gallery example introduction. This is a one stage process. The stages in this process are business, strategy, marketing, analysis, magnifying glass.
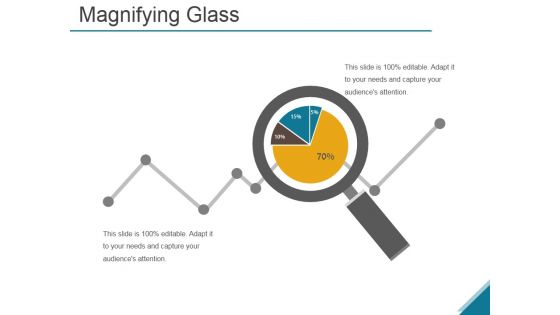
Magnifying Ppt PowerPoint Presentation Outline Maker
This is a magnifying ppt powerpoint presentation outline maker. This is a four stage process. The stages in this process are business, strategy, analysis, success, chart and graph, finance.

Magnifying Glass Ppt PowerPoint Presentation Infographic Template Introduction
This is a magnifying glass ppt powerpoint presentation infographic template introduction. This is a one stage process. The stages in this process are business, strategy, analysis, marketing, magnifying glass.
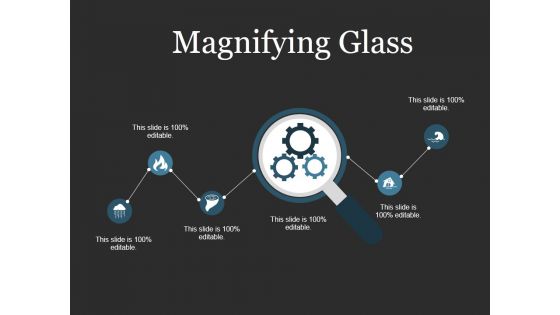
Magnifying Glass Ppt PowerPoint Presentation File Introduction
This is a magnifying glass ppt powerpoint presentation file introduction. This is a five stage process. The stages in this process are magnifier glass, search, marketing, analysis, process, business.
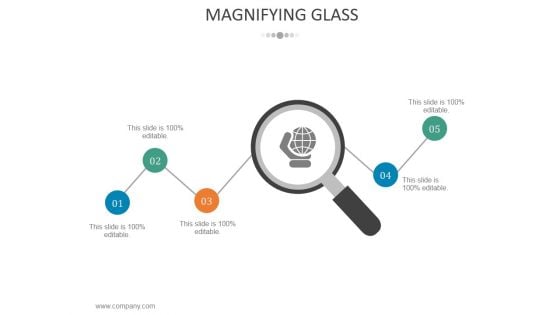
Magnifying Glass Ppt PowerPoint Presentation Infographic Template Portfolio
This is a magnifying glass ppt powerpoint presentation infographic template portfolio. This is a five stage process. The stages in this process are business, strategy, marketing, analysis, magnifying glass.

Mutually Beneficial Supplier Relations Ppt PowerPoint Presentation File Templates
This is a mutually beneficial supplier relations ppt powerpoint presentation file templates. This is a one stage process. The stages in this process are magnifier, search, marketing, strategy, analysis, business.
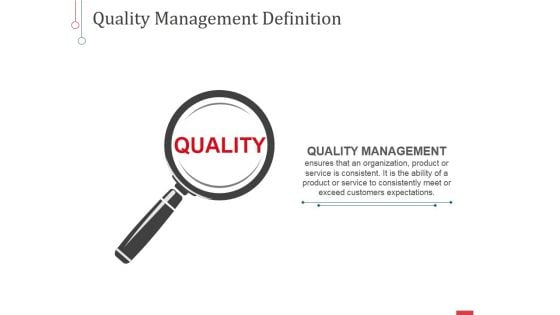
Quality Ppt PowerPoint Presentation Infographic Template Sample
This is a quality ppt powerpoint presentation infographic template sample. This is a one stage process. The stages in this process are quality management, magnifier, search, marketing, strategy, analysis, business.
Magnifying Glass Ppt PowerPoint Presentation Infographic Template Graphics Tutorials
This is a magnifying glass ppt powerpoint presentation infographic template graphics tutorials. This is a one stage process. The stages in this process are business, strategy, marketing, analysis, magnifying glass.
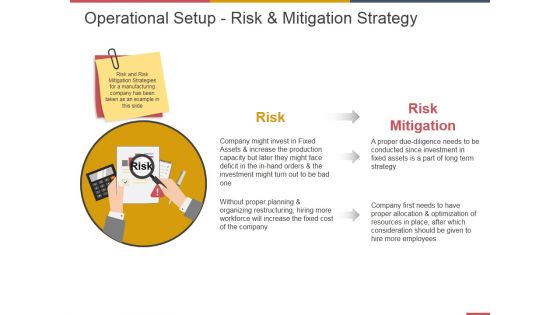
Operational Setup Risk And Mitigation Strategy Ppt PowerPoint Presentation Gallery Topics
This is a operational setup risk and mitigation strategy ppt powerpoint presentation gallery topics. This is a one stage process. The stages in this process are business, strategy, marketing, analysis, risk, risk mitigation.
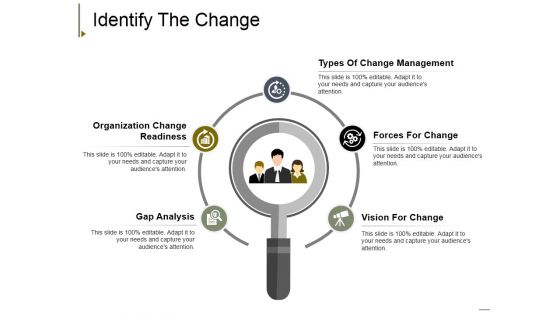
Identify The Change Ppt PowerPoint Presentation Slides Elements
This is a identify the change ppt powerpoint presentation slides elements. This is a five stage process. The stages in this process are types of change management, organization change readiness, gap analysis, forces for change, vision for change.
Key Financial Ratios Template 2 Ppt PowerPoint Presentation Icon Professional
This is a key financial ratios template 2 ppt powerpoint presentation icon professional. This is a four stage process. The stages in this process are business, marketing, analysis, finance, search.
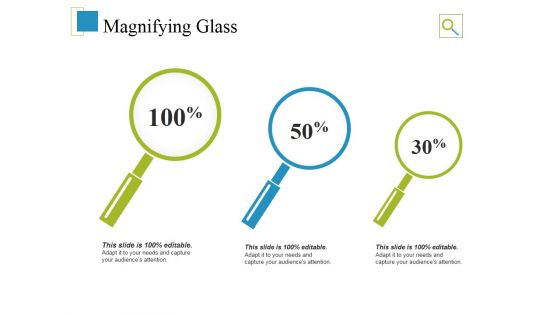
Magnifying Glass Ppt PowerPoint Presentation Infographics Designs Download
This is a magnifying glass ppt powerpoint presentation infographics designs download. This is a three stage process. The stages in this process are magnifying glass, search, marketing, strategy, analysis, business.
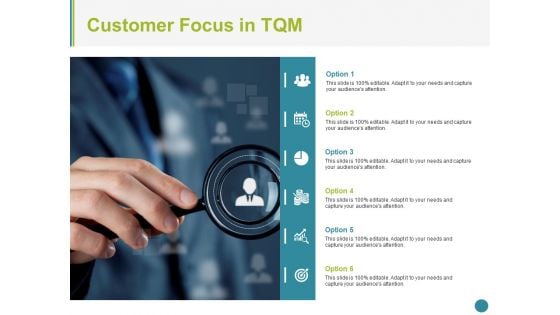
Customer Focus In Tqm Ppt PowerPoint Presentation Portfolio Graphic Images
This is a Customer Focus In Tqm Ppt PowerPoint Presentation Portfolio Graphic Images. This is a six stage process. The stages in this process are business, icons, marketing, strategy, analysis.
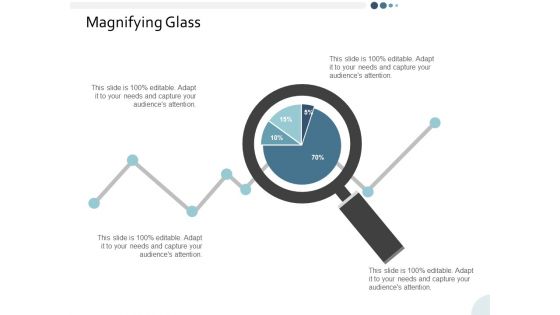
Magnifying Glass Yearly Operating Plan Ppt PowerPoint Presentation Summary Guidelines
This is a magnifying glass yearly operating plan ppt powerpoint presentation summary guidelines. This is a four stage process. The stages in this process are business, management, strategy, analysis, marketing.
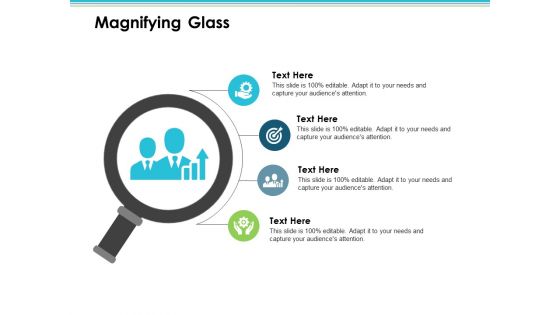
Magnifying Glass Employee Value Proposition Ppt PowerPoint Presentation Layouts Graphics Template
This is a magnifying glass employee value proposition ppt powerpoint presentation layouts graphics template. This is a four stage process. The stages in this process are business, management, strategy, analysis, icons.
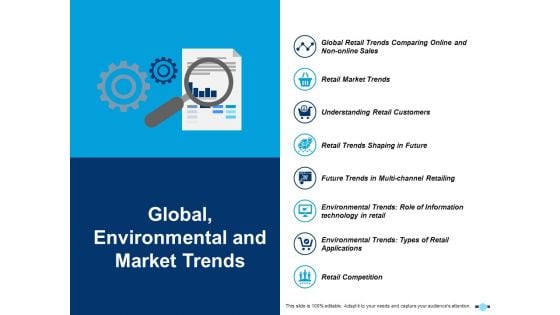
Global Environmental And Market Trends Retail Market Trends Ppt PowerPoint Presentation Styles Information
This is a global environmental and market trends retail market trends ppt powerpoint presentation styles information. This is a eight stage process. The stages in this process are icons, management, strategy, analysis, marketing.


 Continue with Email

 Home
Home


