Snapshot
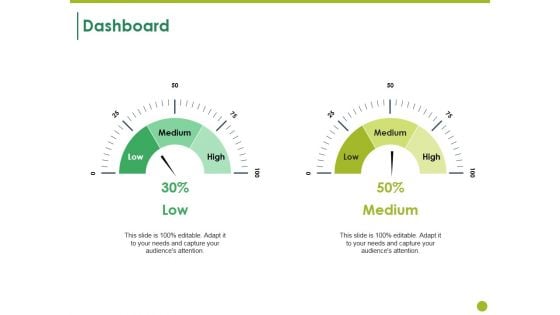
Dashboard Ppt PowerPoint Presentation Diagram Lists
This is a dashboard ppt powerpoint presentation diagram lists. This is a two stage process. The stages in this process are low, medium, high, dashboard, measurement.
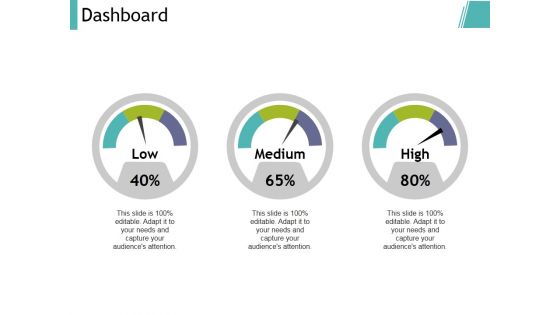
Dashboard Ppt PowerPoint Presentation Model Visual Aids
This is a dashboard ppt powerpoint presentation model visual aids. This is a three stage process. The stages in this process are dashboard, low, high, medium.
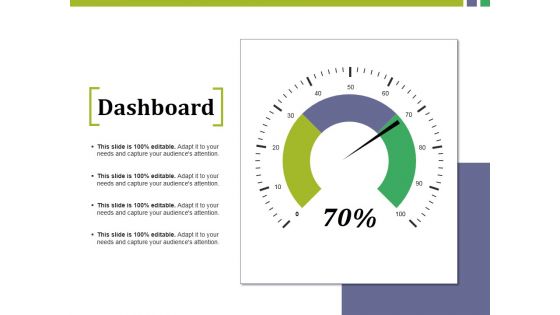
Dashboard Ppt PowerPoint Presentation Model Guidelines
This is a dashboard ppt powerpoint presentation model guidelines. This is a three stage process. The stages in this process are low, medium, high, dashboard, measurement.
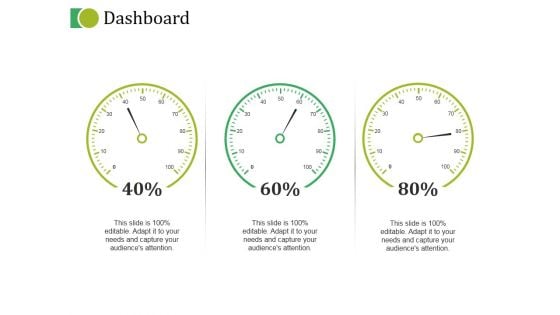
Dashboard Ppt PowerPoint Presentation Show Demonstration
This is a dashboard ppt powerpoint presentation show demonstration. This is a three stage process. The stages in this process are dashboard, marketing, strategy, planning, finance.

Dashboard Ppt PowerPoint Presentation Model Examples
This is a dashboard ppt powerpoint presentation model examples. This is a three stage process. The stages in this process are low, medium, high, dashboard, measurement.
Dashboard Ppt PowerPoint Presentation Gallery Background Designs
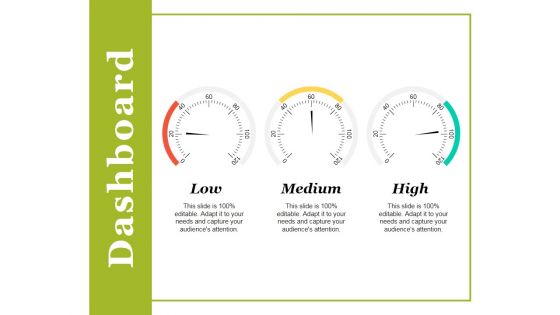
This is a dashboard ppt powerpoint presentation gallery background designs. This is a three stage process. The stages in this process are low, medium, high, dashboard, measurement.
Dashboard Ppt PowerPoint Presentation Model Layout Ideas
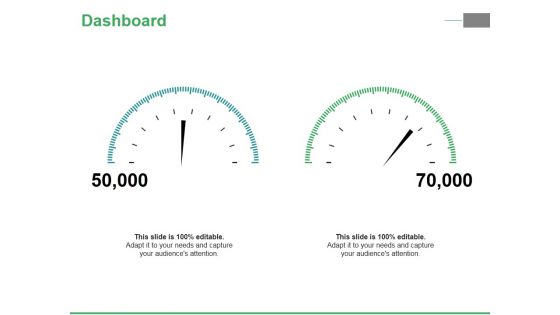
This is a dashboard ppt powerpoint presentation model layout ideas. This is a two stage process. The stages in this process are low, medium, high, dashboard, measurement.
Dashboard Ppt PowerPoint Presentation Portfolio Designs
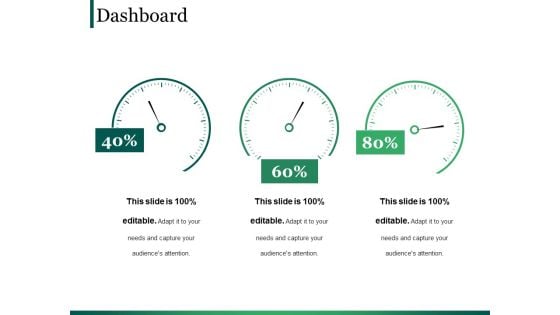
This is a dashboard ppt powerpoint presentation portfolio designs. This is a three stage process. The stages in this process are dashboard, marketing, planning, strategy, finance.
Dashboard Ppt PowerPoint Presentation Portfolio Layout
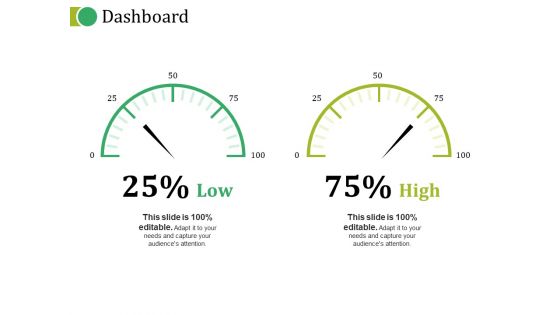
This is a dashboard ppt powerpoint presentation portfolio layout. This is a two stage process. The stages in this process are low, medium, high, dashboard, measurement.
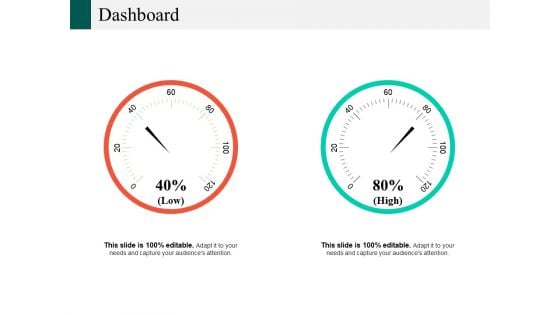
Dashboard Ppt PowerPoint Presentation Slides Visual Aids
This is a dashboard ppt powerpoint presentation slides visual aids. This is a two stage process. The stages in this process are low, medium, high, dashboard, measurement.
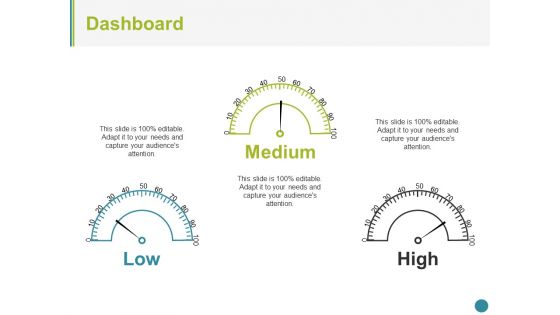
Dashboard Ppt PowerPoint Presentation Inspiration Clipart Images
This is a Dashboard Ppt PowerPoint Presentation Inspiration Clipart Images. This is a three stage process. The stages in this process are dashboard, medium, low, high.
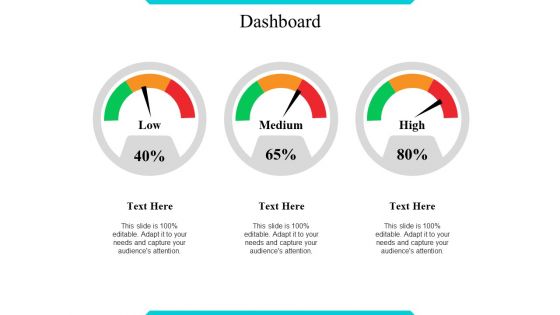
Dashboard Ppt PowerPoint Presentation Gallery Designs Download
This is a dashboard ppt powerpoint presentation gallery designs download. This is a three stage process. The stages in this process are low, medium, high, dashboard, measurement.
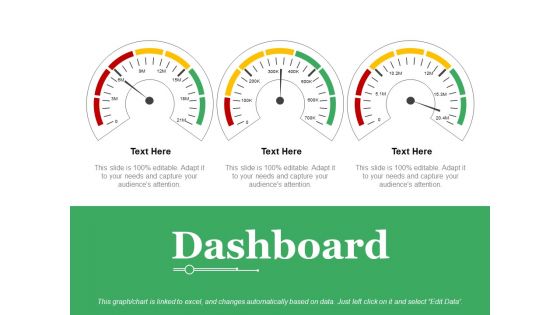
Dashboard Ppt PowerPoint Presentation Infographics Layouts
This is a dashboard ppt powerpoint presentation infographics layouts. This is a three stage process. The stages in this process are low, medium, high, dashboard, measurement.
Corporate Branding Performance Tracking Dashboard Strategies For Achieving Summary Pdf
This slide provides information regarding corporate branding performance tracking dashboard in terms of leads, conversion metrics, web traffic, etc. Slidegeeks is one of the best resources for PowerPoint templates. You can download easily and regulate Corporate Branding Performance Tracking Dashboard Strategies For Achieving Summary Pdf for your personal presentations from our wonderful collection. A few clicks is all it takes to discover and get the most relevant and appropriate templates. Use our Templates to add a unique zing and appeal to your presentation and meetings. All the slides are easy to edit and you can use them even for advertisement purposes. This slide provides information regarding corporate branding performance tracking dashboard in terms of leads, conversion metrics, web traffic, etc.
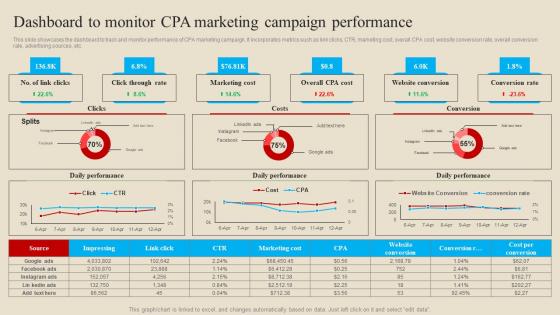
Dashboard To Monitor CPA Introduction And Implementation Procedure Themes Pdf
This slide showcases the dashboard to track and monitor performance of CPA marketing campaign. It incorporates metrics such as link clicks, CTR, marketing cost, overall CPA cost, website conversion rate, overall conversion rate, advertising sources, etc. From laying roadmaps to briefing everything in detail, our templates are perfect for you. You can set the stage with your presentation slides. All you have to do is download these easy to edit and customizable templates. Dashboard To Monitor CPA Introduction And Implementation Procedure Themes Pdf will help you deliver an outstanding performance that everyone would remember and praise you for. Do download this presentation today. This slide showcases the dashboard to track and monitor performance of CPA marketing campaign. It incorporates metrics such as link clicks, CTR, marketing cost, overall CPA cost, website conversion rate, overall conversion rate, advertising sources, etc.
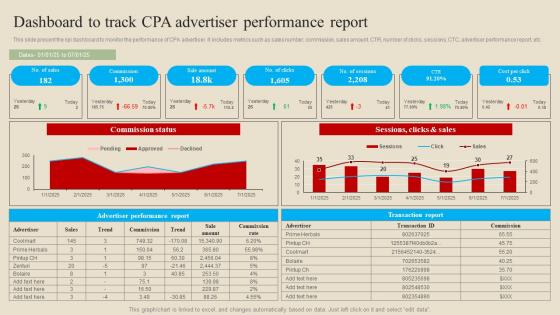
Dashboard To Track CPA Introduction And Implementation Procedure Background Pdf
This slide present the kpi dashboard to monitor the performance of CPA advertiser. It includes metrics such as sales number, commission, sales amount, CTR, number of clicks, sessions, CTC, advertiser performance report, etc. Present like a pro with Dashboard To Track CPA Introduction And Implementation Procedure Background Pdf Create beautiful presentations together with your team, using our easy to use presentation slides. Share your ideas in real time and make changes on the fly by downloading our templates. So whether you are in the office, on the go, or in a remote location, you can stay in sync with your team and present your ideas with confidence. With Slidegeeks presentation got a whole lot easier. Grab these presentations today. This slide present the kpi dashboard to monitor the performance of CPA advertiser. It includes metrics such as sales number, commission, sales amount, CTR, number of clicks, sessions, CTC, advertiser performance report, etc.
Strategic Brand Management KPI Dashboard To Monitor Icons Pdf
Mentioned slide shows the KPI dashboard that can be used to track win and lost sales opportunities. It includes metrics namely won opportunities, lost opportunities, pipeline by territory, total opportunities. This Strategic Brand Management KPI Dashboard To Monitor Icons Pdf from Slidegeeks makes it easy to present information on your topic with precision. It provides customization options, so you can make changes to the colors, design, graphics, or any other component to create a unique layout. It is also available for immediate download, so you can begin using it right away. Slidegeeks has done good research to ensure that you have everything you need to make your presentation stand out. Make a name out there for a brilliant performance. Mentioned slide shows the KPI dashboard that can be used to track win and lost sales opportunities. It includes metrics namely won opportunities, lost opportunities, pipeline by territory, total opportunities.
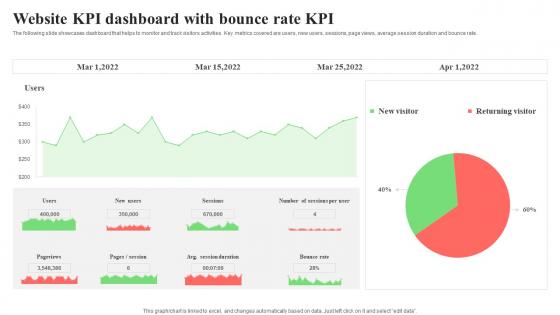
Website KPI Dashboard With Bounce Rate KPI Formats Pdf
The following slide showcases dashboard that helps to monitor and track visitors activities. Key metrics covered are users, new users, sessions, page views, average session duration and bounce rate. Pitch your topic with ease and precision using this Website KPI Dashboard With Bounce Rate KPI Formats Pdf. This layout presents information on Page Views, Average Session Duration, Bounce Rate. It is also available for immediate download and adjustment. So, changes can be made in the color, design, graphics or any other component to create a unique layout. The following slide showcases dashboard that helps to monitor and track visitors activities. Key metrics covered are users, new users, sessions, page views, average session duration and bounce rate.
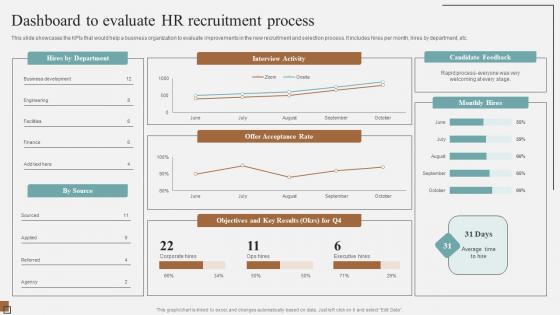
Dashboard To Evaluate HR Recruitment Process Complete Guidelines For Streamlined Sample Pdf
This slide showcases the KPIs that would help a business organization to evaluate improvements in the new recruitment and selection process. It includes hires per month, hires by department, etc.From laying roadmaps to briefing everything in detail, our templates are perfect for you. You can set the stage with your presentation slides. All you have to do is download these easy-to-edit and customizable templates. Dashboard To Evaluate HR Recruitment Process Complete Guidelines For Streamlined Sample Pdf will help you deliver an outstanding performance that everyone would remember and praise you for. Do download this presentation today. This slide showcases the KPIs that would help a business organization to evaluate improvements in the new recruitment and selection process. It includes hires per month, hires by department, etc.
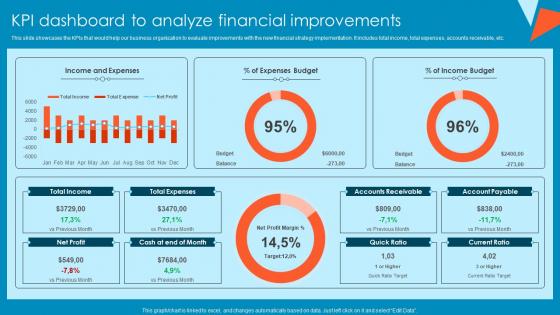
KPI Dashboard To Analyze Financial Improvements Tactical Financial Governance Brochure Pdf
This slide showcases the KPIs that would help our business organization to evaluate improvements with the new financial strategy implementation. It includes total income, total expenses, accounts receivable, etc.Boost your pitch with our creative KPI Dashboard To Analyze Financial Improvements Tactical Financial Governance Brochure Pdf. Deliver an awe-inspiring pitch that will mesmerize everyone. Using these presentation templates you will surely catch everyones attention. You can browse the ppts collection on our website. We have researchers who are experts at creating the right content for the templates. So you do not have to invest time in any additional work. Just grab the template now and use them. This slide showcases the KPIs that would help our business organization to evaluate improvements with the new financial strategy implementation. It includes total income, total expenses, accounts receivable, etc.
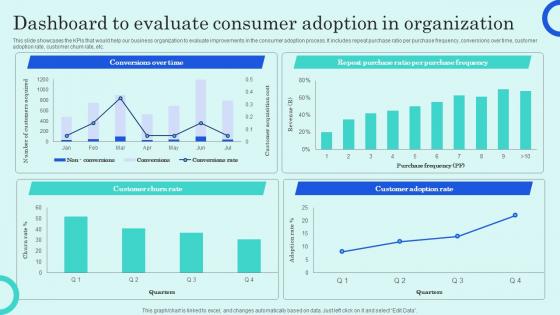
Dashboard To Evaluate Consumer Adoption In Overview Of Customer Adoption Process Microsoft Pdf
This slide showcases the KPIs that would help our business organization to evaluate improvements in the consumer adoption process. It includes repeat purchase ratio per purchase frequency, conversions over time, customer adoption rate, customer churn rate, etc. Present like a pro with Dashboard To Evaluate Consumer Adoption In Overview Of Customer Adoption Process Microsoft Pdf Create beautiful presentations together with your team, using our easy to use presentation slides. Share your ideas in real time and make changes on the fly by downloading our templates. So whether youre in the office, on the go, or in a remote location, you can stay in sync with your team and present your ideas with confidence. With Slidegeeks presentation got a whole lot easier. Grab these presentations today. This slide showcases the KPIs that would help our business organization to evaluate improvements in the consumer adoption process. It includes repeat purchase ratio per purchase frequency, conversions over time, customer adoption rate, customer churn rate, etc.
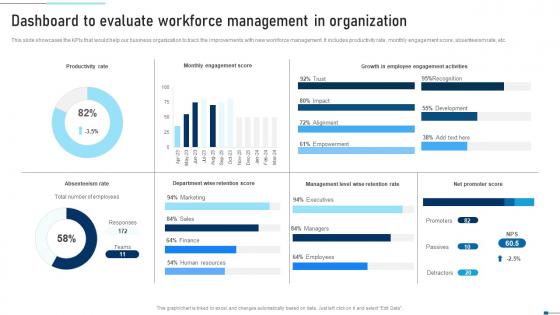
Dashboard To Evaluate Workforce Management In Strategic Talent Recruitment Diagrams Pdf
This slide showcases the KPIs that would help our business organization to track the improvements with new workforce management. It includes productivity rate, monthly engagement score, absenteeism rate, etc. Find highly impressive Dashboard To Evaluate Workforce Management In Strategic Talent Recruitment Diagrams Pdf on Slidegeeks to deliver a meaningful presentation. You can save an ample amount of time using these presentation templates. No need to worry to prepare everything from scratch because Slidegeeks experts have already done a huge research and work for you. You need to download for your upcoming presentation. All the presentation templates are 100 percent editable and you can change the color and personalize the content accordingly. Download now This slide showcases the KPIs that would help our business organization to track the improvements with new workforce management. It includes productivity rate, monthly engagement score, absenteeism rate, etc.
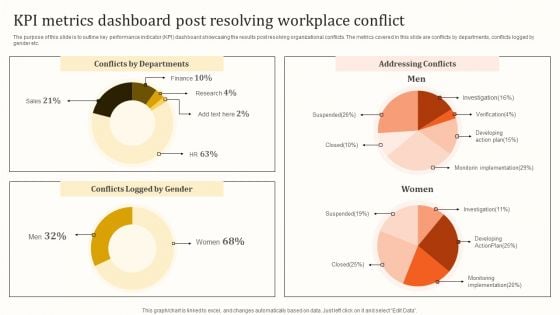
KPI Metrics Dashboard Post Resolving Workplace Conflict Template PDF
The purpose of this slide is to outline key performance indicator KPI dashboard showcasing the results post resolving organizational conflicts. The metrics covered in this slide are conflicts by departments, conflicts logged by gender etc. Presenting this PowerPoint presentation, titled KPI Metrics Dashboard Post Resolving Workplace Conflict Template PDF, with topics curated by our researchers after extensive research. This editable presentation is available for immediate download and provides attractive features when used. Download now and captivate your audience. Presenting this KPI Metrics Dashboard Post Resolving Workplace Conflict Template PDF. Our researchers have carefully researched and created these slides with all aspects taken into consideration. This is a completely customizable KPI Metrics Dashboard Post Resolving Workplace Conflict Template PDF that is available for immediate downloading. Download now and make an impact on your audience. Highlight the attractive features available with our PPTs.
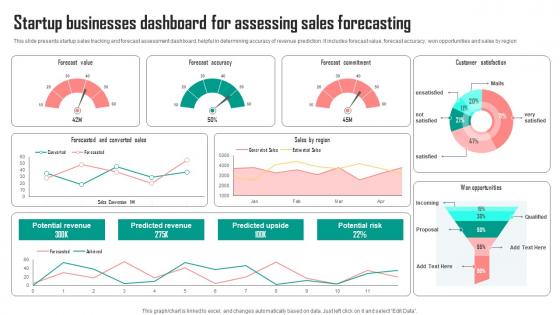
Startup Businesses Dashboard For Assessing Sales Forecasting Background Pdf
This slide presents startup sales tracking and forecast assessment dashboard, helpful in determining accuracy of revenue prediction. It includes forecast value, forecast accuracy, won opportunities and sales by region Pitch your topic with ease and precision using this Startup Businesses Dashboard For Assessing Sales Forecasting Background Pdf. This layout presents information on Forecast Value, Accuracy, Commitment. It is also available for immediate download and adjustment. So, changes can be made in the color, design, graphics or any other component to create a unique layout. This slide presents startup sales tracking and forecast assessment dashboard, helpful in determining accuracy of revenue prediction. It includes forecast value, forecast accuracy, won opportunities and sales by region
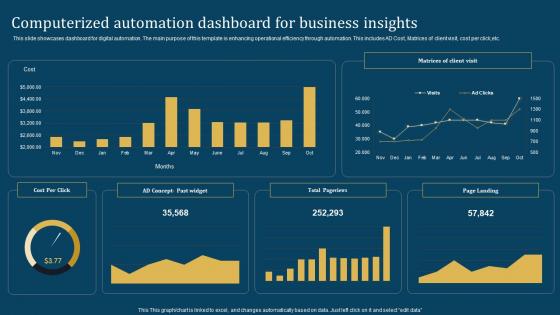
Computerized Automation Dashboard For Business Insights Graphics Pdf
This slide showcases dashboard for digital automation. The main purpose of this template is enhancing operational efficiency through automation. This includes AD Cost, Matrices of client visit, cost per click,etc.Pitch your topic with ease and precision using this Computerized Automation Dashboard For Business Insights Graphics Pdf This layout presents information on Computerized Automation, Dashboard Business Insights It is also available for immediate download and adjustment. So, changes can be made in the color, design, graphics or any other component to create a unique layout. This slide showcases dashboard for digital automation. The main purpose of this template is enhancing operational efficiency through automation. This includes AD Cost, Matrices of client visit, cost per click,etc.
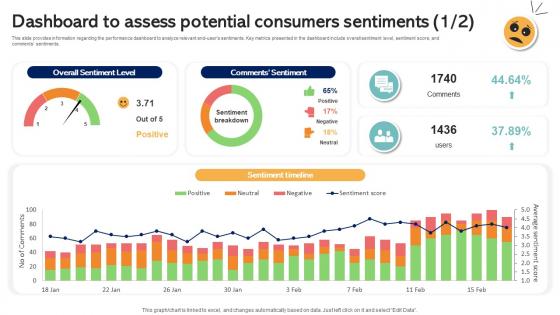
Dashboard To Assess Potential Consumers Sentiments Emotionally Intelligent Insights Leveraging AI SS V
This slide provides information regarding the performance dashboard to analyze relevant end-users sentiments. Key metrics presented in the dashboard include overall sentiment level, sentiment score, and comments sentiments. Do you have an important presentation coming up Are you looking for something that will make your presentation stand out from the rest Look no further than Dashboard To Assess Potential Consumers Sentiments Emotionally Intelligent Insights Leveraging AI SS V. With our professional designs, you can trust that your presentation will pop and make delivering it a smooth process. And with Slidegeeks, you can trust that your presentation will be unique and memorable. So why wait Grab Dashboard To Assess Potential Consumers Sentiments Emotionally Intelligent Insights Leveraging AI SS V today and make your presentation stand out from the rest This slide provides information regarding the performance dashboard to analyze relevant end-users sentiments. Key metrics presented in the dashboard include overall sentiment level, sentiment score, and comments sentiments.
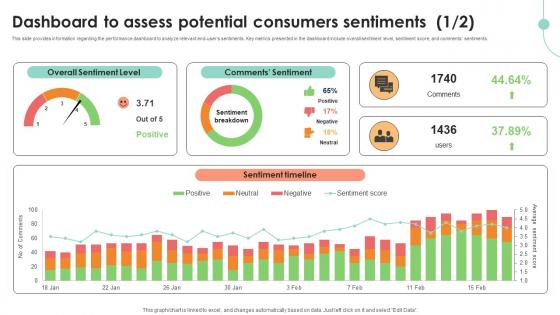
Dashboard To Assess Potential Consumers Decoding User Emotions In Depth Exploration AI SS V
This slide provides information regarding the performance dashboard to analyze relevant end-users sentiments. Key metrics presented in the dashboard include overall sentiment level, sentiment score, and comments sentiments. Do you have an important presentation coming up Are you looking for something that will make your presentation stand out from the rest Look no further than Dashboard To Assess Potential Consumers Decoding User Emotions In Depth Exploration AI SS V. With our professional designs, you can trust that your presentation will pop and make delivering it a smooth process. And with Slidegeeks, you can trust that your presentation will be unique and memorable. So why wait Grab Dashboard To Assess Potential Consumers Decoding User Emotions In Depth Exploration AI SS V today and make your presentation stand out from the rest This slide provides information regarding the performance dashboard to analyze relevant end-users sentiments. Key metrics presented in the dashboard include overall sentiment level, sentiment score, and comments sentiments.
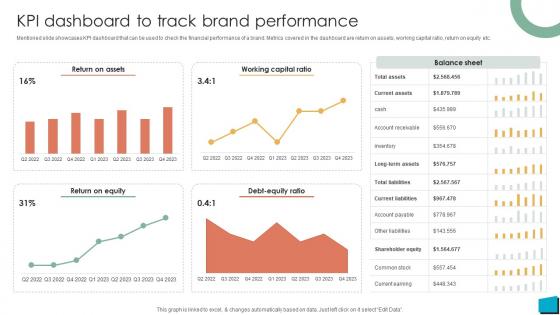
Brand Authority KPI Dashboard To Track Brand Performance Strategy SS V
Mentioned slide showcases KPI dashboard that can be used to check the financial performance of a brand. Metrics covered in the dashboard are return on assets, working capital ratio, return on equity etc. This Brand Authority KPI Dashboard To Track Brand Performance Strategy SS V is perfect for any presentation, be it in front of clients or colleagues. It is a versatile and stylish solution for organizing your meetings. The Brand Authority KPI Dashboard To Track Brand Performance Strategy SS V features a modern design for your presentation meetings. The adjustable and customizable slides provide unlimited possibilities for acing up your presentation. Slidegeeks has done all the homework before launching the product for you. So, do not wait, grab the presentation templates today Mentioned slide showcases KPI dashboard that can be used to check the financial performance of a brand. Metrics covered in the dashboard are return on assets, working capital ratio, return on equity etc.
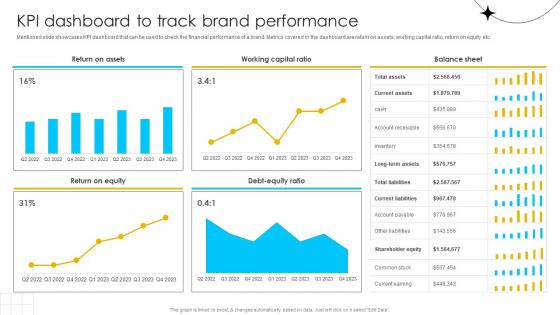
Brand Influence KPI Dashboard To Track Brand Performance Strategy SS V
Mentioned slide showcases KPI dashboard that can be used to check the financial performance of a brand. Metrics covered in the dashboard are return on assets, working capital ratio, return on equity etc. This Brand Influence KPI Dashboard To Track Brand Performance Strategy SS V is perfect for any presentation, be it in front of clients or colleagues. It is a versatile and stylish solution for organizing your meetings. The Brand Influence KPI Dashboard To Track Brand Performance Strategy SS V features a modern design for your presentation meetings. The adjustable and customizable slides provide unlimited possibilities for acing up your presentation. Slidegeeks has done all the homework before launching the product for you. So, do not wait, grab the presentation templates today Mentioned slide showcases KPI dashboard that can be used to check the financial performance of a brand. Metrics covered in the dashboard are return on assets, working capital ratio, return on equity etc.
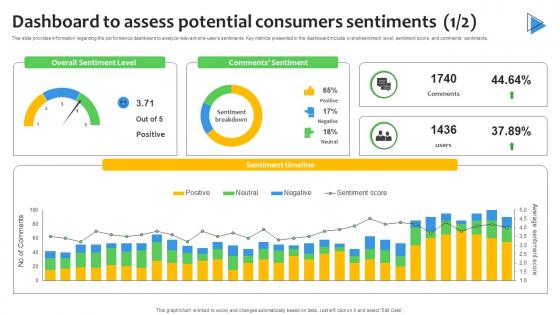
Dashboard To Assess Potential Consumers Sentiment Analysis Demystified Understanding AI SS V
This slide provides information regarding the performance dashboard to analyze relevant end-users sentiments. Key metrics presented in the dashboard include overall sentiment level, sentiment score, and comments sentiments. Do you have an important presentation coming up Are you looking for something that will make your presentation stand out from the rest Look no further than Dashboard To Assess Potential Consumers Sentiment Analysis Demystified Understanding AI SS V. With our professional designs, you can trust that your presentation will pop and make delivering it a smooth process. And with Slidegeeks, you can trust that your presentation will be unique and memorable. So why wait Grab Dashboard To Assess Potential Consumers Sentiment Analysis Demystified Understanding AI SS V today and make your presentation stand out from the rest This slide provides information regarding the performance dashboard to analyze relevant end-users sentiments. Key metrics presented in the dashboard include overall sentiment level, sentiment score, and comments sentiments.
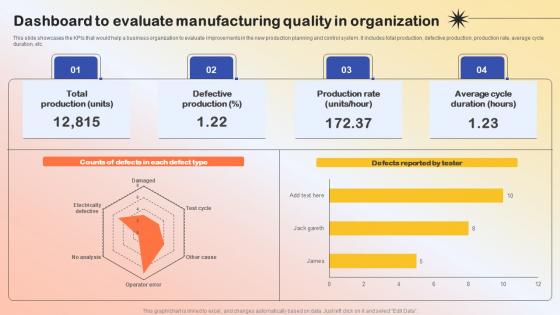
Dashboard To Evaluate Manufacturing Quality Production Quality Administration Portrait Pdf
This slide showcases the KPIs that would help a business organization to evaluate improvements in the new production planning and control system. It includes total production, defective production, production rate, average cycle duration, etc.Do you have to make sure that everyone on your team knows about any specific topic I yes, then you should give Dashboard To Evaluate Manufacturing Quality Production Quality Administration Portrait Pdf a try. Our experts have put a lot of knowledge and effort into creating this impeccable Dashboard To Evaluate Manufacturing Quality Production Quality Administration Portrait Pdf. You can use this template for your upcoming presentations, as the slides are perfect to represent even the tiniest detail. You can download these templates from the Slidegeeks website and these are easy to edit. So grab these today. This slide showcases the KPIs that would help a business organization to evaluate improvements in the new production planning and control system. It includes total production, defective production, production rate, average cycle duration, etc.
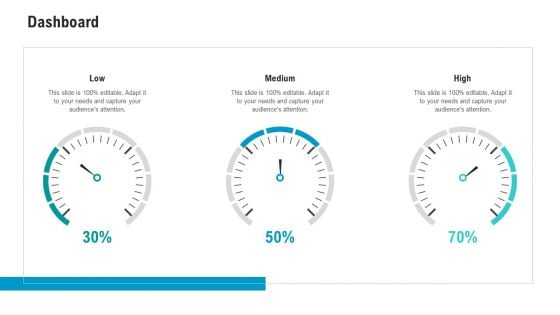
API Ecosystem Dashboard Clipart PDF
This is a api ecosystem dashboard clipart pdf template with various stages. Focus and dispense information on three stages using this creative set, that comes with editable features. It contains large content boxes to add your information on topics like dashboard. You can also showcase facts, figures, and other relevant content using this PPT layout. Grab it now.
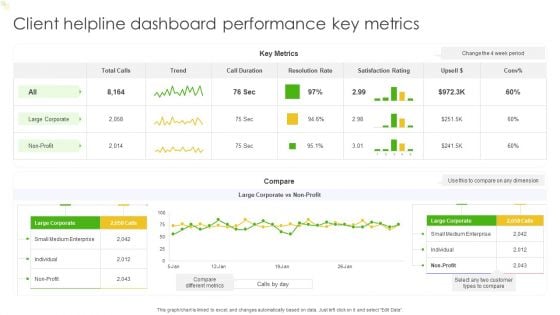
Client Helpline Dashboard Performance Key Metrics Ppt Outline Deck PDF
This graph or chart is linked to excel, and changes automatically based on data. Just left click on it and select Edit Data. Pitch your topic with ease and precision using this Client Helpline Dashboard Performance Key Metrics Ppt Outline Deck PDF. This layout presents information on Key Metrics, Trend, Compare. It is also available for immediate download and adjustment. So, changes can be made in the color, design, graphics or any other component to create a unique layout.
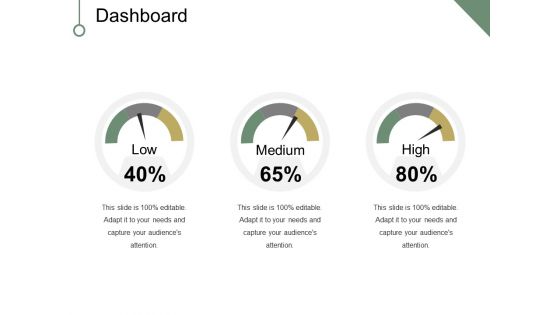
Dashboard Ppt PowerPoint Presentation Infographic Template Background Image
This is a dashboard ppt powerpoint presentation infographic template background image. This is a three stage process. The stages in this process are dashboard, business, marketing, percentage, low.
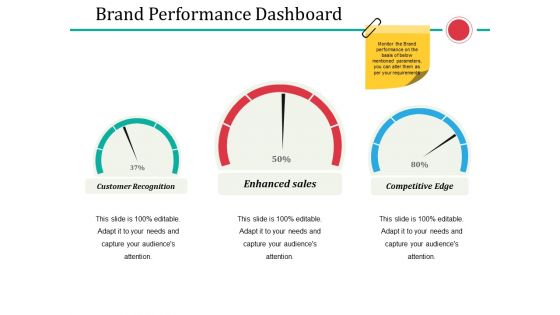
Brand Performance Dashboard Ppt PowerPoint Presentation Professional Elements
This is a brand performance dashboard ppt powerpoint presentation professional elements. This is a three stage process. The stages in this process are dashboard, percentage, business, marketing, strategy.
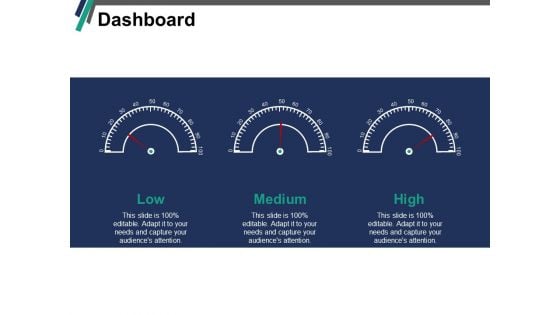
Dashboard Low Medium Ppt PowerPoint Presentation Gallery Rules
This is a dashboard low medium ppt powerpoint presentation gallery rules. This is a three stage process. The stages in this process are dashboard, low, medium, high, business.
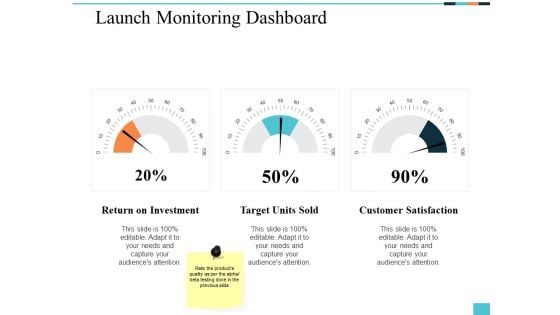
Launch Monitoring Dashboard Ppt PowerPoint Presentation Infographics Styles
This is a launch monitoring dashboard ppt powerpoint presentation infographics styles. This is a three stage process. The stages in this process are business, management, marketing, dashboard.

Dashboard Management Ppt PowerPoint Presentation Infographic Template Graphics
This is a dashboard management ppt powerpoint presentation infographic template graphics. This is a three stage process. The stages in this process are business, management, marketing, dashboard.
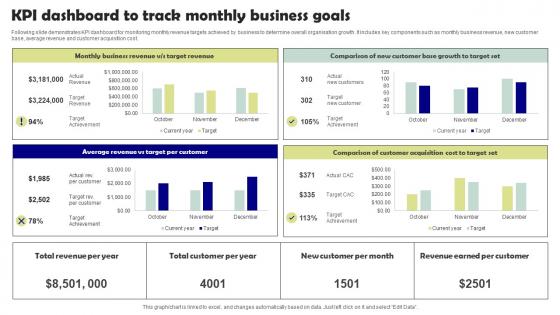
KPI Dashboard To Track Monthly Business Goals Microsoft Pdf
Following slide demonstrates KPI dashboard for monitoring monthly revenue targets achieved by business to determine overall organisation growth. It includes key components such as monthly business revenue, new customer base, average revenue and customer acquisition cost. Pitch your topic with ease and precision using this KPI Dashboard To Track Monthly Business Goals Microsoft Pdf. This layout presents information on Target Per Customer, Target Set. It is also available for immediate download and adjustment. So, changes can be made in the color, design, graphics or any other component to create a unique layout. Following slide demonstrates KPI dashboard for monitoring monthly revenue targets achieved by business to determine overall organisation growth. It includes key components such as monthly business revenue, new customer base, average revenue and customer acquisition cost.
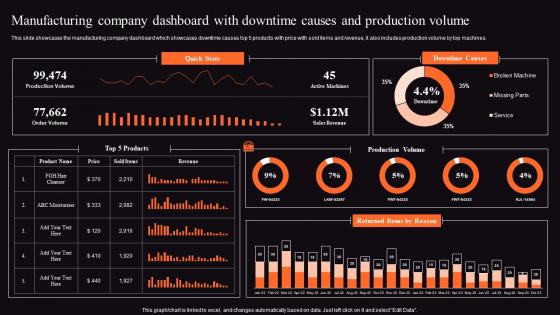
Food Processing Business Profile Manufacturing Company Dashboard Brochure Pdf
This slide showcases the manufacturing company dashboard which showcases downtime causes top 5 products with price with sold items and revenue, it also includes production volume by top machines. Do you know about Slidesgeeks Food Processing Business Profile Manufacturing Company Dashboard Brochure Pdf These are perfect for delivering any kind od presentation. Using it, create PowerPoint presentations that communicate your ideas and engage audiences. Save time and effort by using our pre designed presentation templates that are perfect for a wide range of topic. Our vast selection of designs covers a range of styles, from creative to business, and are all highly customizable and easy to edit. Download as a PowerPoint template or use them as Google Slides themes. This slide showcases the manufacturing company dashboard which showcases downtime causes top 5 products with price with sold items and revenue, it also includes production volume by top machines.
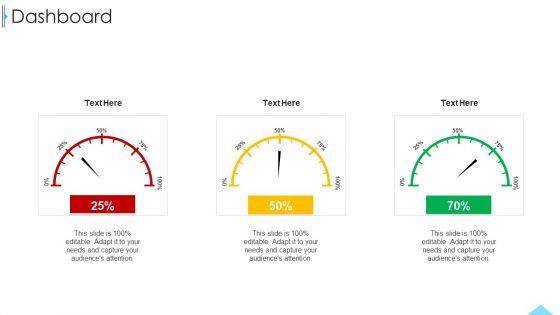
Business Profile For Sales Negotiations Dashboard Ppt Layouts Clipart Images PDF
Presenting business profile for sales negotiations dashboard ppt layouts clipart images pdf to provide visual cues and insights. Share and navigate important information on three stages that need your due attention. This template can be used to pitch topics like dashboard. In addtion, this PPT design contains high resolution images, graphics, etc, that are easily editable and available for immediate download.

Power Management Dashboard With Energy Consumption AIOT Applications For Various Industries IoT SS V
The purpose of this slide is to showcase power management dashboard which covers various metrics. The metrics mentioned in slide are average power by device, energy consumption, voltage and frequency by various devices, etc. Do you have to make sure that everyone on your team knows about any specific topic I yes, then you should give Power Management Dashboard With Energy Consumption AIOT Applications For Various Industries IoT SS V a try. Our experts have put a lot of knowledge and effort into creating this impeccable Power Management Dashboard With Energy Consumption AIOT Applications For Various Industries IoT SS V. You can use this template for your upcoming presentations, as the slides are perfect to represent even the tiniest detail. You can download these templates from the Slidegeeks website and these are easy to edit. So grab these today The purpose of this slide is to showcase power management dashboard which covers various metrics. The metrics mentioned in slide are average power by device, energy consumption, voltage and frequency by various devices, etc.
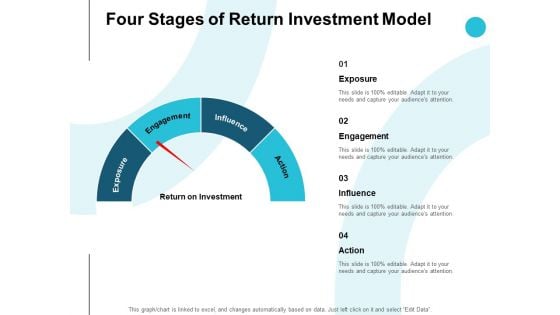
Four Stages Of Return Investment Model Ppt PowerPoint Presentation Pictures Background Image
Presenting this set of slides with name four stages of return investment model ppt powerpoint presentation pictures background image. This is a four stage process. The stages in this process are dashboard, marketing, process, management, planning. This is a completely editable PowerPoint presentation and is available for immediate download. Download now and impress your audience.
Performance Tracking Dashboard For Food Product And Beverage Business
The slide showcases dashboard representing food and beverage business performance tracking tool , which assist to evaluate monthly performance of employees, customer retention etc. Slidegeeks has constructed Performance Tracking Dashboard For Food Product And Beverage Business after conducting extensive research and examination. These presentation templates are constantly being generated and modified based on user preferences and critiques from editors. Here, you will find the most attractive templates for a range of purposes while taking into account ratings and remarks from users regarding the content. This is an excellent jumping-off point to explore our content and will give new users an insight into our top-notch PowerPoint Templates. The slide showcases dashboard representing food and beverage business performance tracking tool , which assist to evaluate monthly performance of employees, customer retention etc.
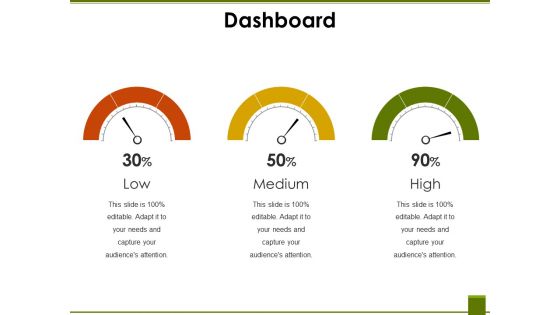
Dashboard Ppt PowerPoint Presentation Layouts Layouts
This is a dashboard ppt powerpoint presentation layouts layouts. This is a three stage process. The stages in this process are low, medium, high, percentage, business.
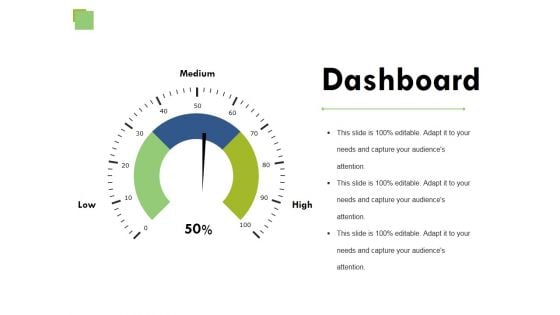
Dashboard Ppt PowerPoint Presentation Outline Aids
This is a dashboard ppt powerpoint presentation outline aids. This is a three stage process. The stages in this process are business, marketing, strategy, finance, planning.
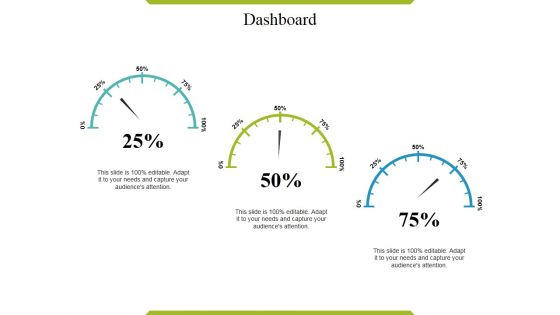
Dashboard Ppt PowerPoint Presentation Inspiration Graphics
This is a dashboard ppt powerpoint presentation inspiration graphics. This is a three stage process. The stages in this process are business, marketing, strategy, finance, planning.
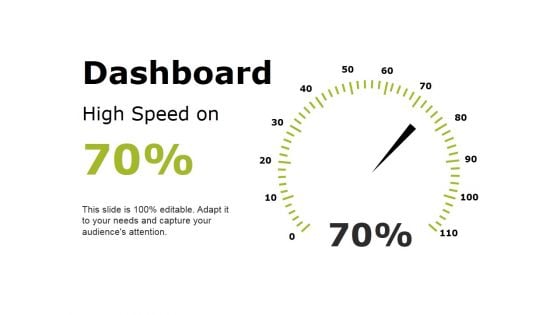
Dashboard Ppt PowerPoint Presentation Styles Visual Aids
This is a dashboard ppt powerpoint presentation styles visual aids. This is a one stage process. The stages in this process are business, marketing, finance, planning, strategy.
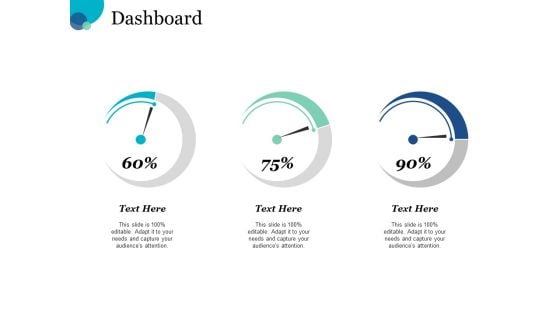
Dashboard Financial Ppt PowerPoint Presentation File Gridlines
This is a dashboard financial ppt powerpoint presentation file gridlines. This is a three stage process. The stages in this process are business, management, planning, strategy, marketing.
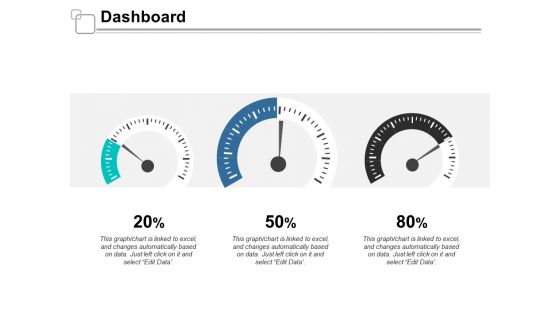
Dashboard Marketing Ppt Powerpoint Presentation Gallery Outfit
This is a dashboard marketing ppt powerpoint presentation gallery outfit. This is a three stage process. The stages in this process are management, marketing, strategy, business, finance.
Dashboard Ppt PowerPoint Presentation Icon
This is a dashboard ppt powerpoint presentation icon. This is a three stage process. The stages in this process are revenue, units sold, purchase value revenue, units sold, purchase value.
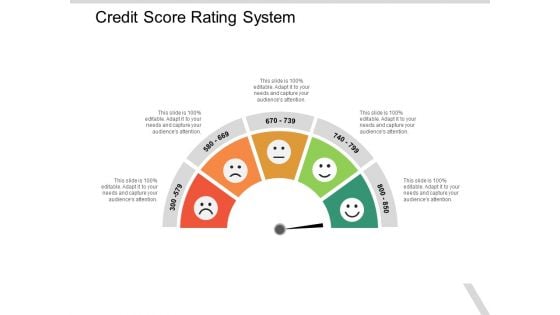
Credit Score Rating System Ppt PowerPoint Presentation Pictures Graphics
Presenting this set of slides with name credit score rating system ppt powerpoint presentation pictures graphics. This is a five stage process. The stages in this process are product quality, product improvement, rating scale. This is a completely editable PowerPoint presentation and is available for immediate download. Download now and impress your audience.
Online Marketing Content Team Tasks Calendar Icon Pictures PDF
Presenting Online Marketing Content Team Tasks Calendar Icon Pictures PDF to dispense important information. This template comprises three stages. It also presents valuable insights into the topics including Online Marketing Content Team, Tasks Calendar Icon. This is a completely customizable PowerPoint theme that can be put to use immediately. So, download it and address the topic impactfully.
Strategies To Build Meaningful Dashboard And Kpi For Evaluating Overall Employee Icons Pdf
The slide showcases dashboard and KPI evaluating employees overall performance and how employee working is going on in an organization . It contains KPIs such as employee absenteeism , employee overtime hours, employee training costs, overall employee effectiveness . Create an editable Strategies To Build Meaningful Dashboard And Kpi For Evaluating Overall Employee Icons Pdf that communicates your idea and engages your audience. Whether you are presenting a business or an educational presentation, pre-designed presentation templates help save time. Strategies To Build Meaningful Dashboard And Kpi For Evaluating Overall Employee Icons Pdf is highly customizable and very easy to edit, covering many different styles from creative to business presentations. Slidegeeks has creative team members who have crafted amazing templates. So, go and get them without any delay. The slide showcases dashboard and KPI evaluating employees overall performance and how employee working is going on in an organization . It contains KPIs such as employee absenteeism , employee overtime hours, employee training costs, overall employee effectiveness .
Erp Management Dashboard For Tracking Gross Erp And Digital Transformation For Maximizing DT SS V
This slide presents a ERP integrated finance monitoring dashboard that helps in tracking gross and net profit margin of business. It monitors KPIs such as balance, quick ratio, current ratio, total income, total expenses, accounts payable.Here you can discover an assortment of the finest PowerPoint and Google Slides templates. With these templates, you can create presentations for a variety of purposes while simultaneously providing your audience with an eye-catching visual experience. Download Erp Management Dashboard For Tracking Gross Erp And Digital Transformation For Maximizing DT SS V to deliver an impeccable presentation. These templates will make your job of preparing presentations much quicker, yet still, maintain a high level of quality. Slidegeeks has experienced researchers who prepare these templates and write high-quality content for you. Later on, you can personalize the content by editing the Erp Management Dashboard For Tracking Gross Erp And Digital Transformation For Maximizing DT SS V. This slide presents a ERP integrated finance monitoring dashboard that helps in tracking gross and net profit margin of business. It monitors KPIs such as balance, quick ratio, current ratio, total income, total expenses, accounts payable.
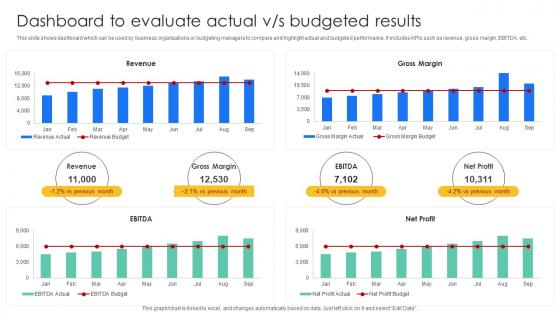
Dashboard To Evaluate Actual Vs Budgeted Results Effective And Efficient Tools To Develop Fin SS V
This slide shows dashboard which can be used by business organizations or budgeting managers to compare and highlight actual and budgeted performance. It includes KPIs such as revenue, gross margin, EBITDA, etc. Find highly impressive Dashboard To Evaluate Actual Vs Budgeted Results Effective And Efficient Tools To Develop Fin SS V on Slidegeeks to deliver a meaningful presentation. You can save an ample amount of time using these presentation templates. No need to worry to prepare everything from scratch because Slidegeeks experts have already done a huge research and work for you. You need to download Dashboard To Evaluate Actual Vs Budgeted Results Effective And Efficient Tools To Develop Fin SS V for your upcoming presentation. All the presentation templates are 100 percent editable and you can change the color and personalize the content accordingly. Download now This slide shows dashboard which can be used by business organizations or budgeting managers to compare and highlight actual and budgeted performance. It includes KPIs such as revenue, gross margin, EBITDA, etc.
Network Service Assessment Icon To Measure Web Speed Pictures PDF
Persuade your audience using this Network Service Assessment Icon To Measure Web Speed Pictures PDF. This PPT design covers four stages, thus making it a great tool to use. It also caters to a variety of topics including Network Service Assessment Icon To Measure Web Speed. Download this PPT design now to present a convincing pitch that not only emphasizes the topic but also showcases your presentation skills.
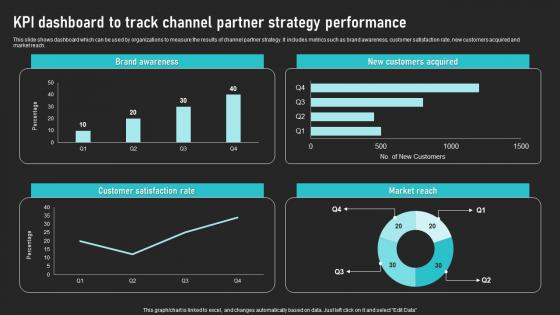
KPI Dashboard To Track Channel Partner Strategy Performance Cooperative Sales Tactics Structure Pdf
This slide shows dashboard which can be used by organizations to measure the results of channel partner strategy. It includes metrics such as brand awareness, customer satisfaction rate, new customers acquired and market reach. Get a simple yet stunning designed KPI Dashboard To Track Channel Partner Strategy Performance Cooperative Sales Tactics Structure Pdf It is the best one to establish the tone in your meetings. It is an excellent way to make your presentations highly effective. So, download this PPT today from Slidegeeks and see the positive impacts. Our easy-to-edit KPI Dashboard To Track Channel Partner Strategy Performance Cooperative Sales Tactics Structure Pdf can be your go-to option for all upcoming conferences and meetings. So, what are you waiting for Grab this template today. This slide shows dashboard which can be used by organizations to measure the results of channel partner strategy. It includes metrics such as brand awareness, customer satisfaction rate, new customers acquired and market reach.
Dashboard For Tracking Aftersales Increasing Client Retention Through Efficient Rules Pdf
This slide covers the KPI dashboard for ticket tracking. It includes metrics such as tickets by month, service level, and details of customer service department agents. Whether you have daily or monthly meetings, a brilliant presentation is necessary. Dashboard For Tracking Aftersales Increasing Client Retention Through Efficient Rules Pdf can be your best option for delivering a presentation. Represent everything in detail using Dashboard For Tracking Aftersales Increasing Client Retention Through Efficient Rules Pdf and make yourself stand out in meetings. The template is versatile and follows a structure that will cater to your requirements. All the templates prepared by Slidegeeks are easy to download and edit. Our research experts have taken care of the corporate themes as well. So, give it a try and see the results. This slide covers the KPI dashboard for ticket tracking. It includes metrics such as tickets by month, service level, and details of customer service department agents.
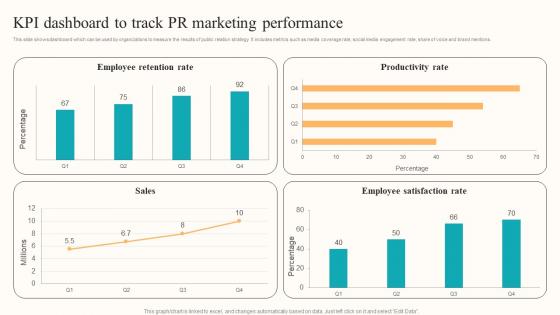
KPI Dashboard Track PR Developing Employee Centric Marketing Program Designs Pdf
This slide shows dashboard which can be used by organizations to measure the results of public relation strategy. It includes metrics such as media coverage rate, social media engagement rate, share of voice and brand mentions. This KPI Dashboard Track PR Developing Employee Centric Marketing Program Designs Pdf is perfect for any presentation, be it in front of clients or colleagues. It is a versatile and stylish solution for organizing your meetings. The KPI Dashboard Track PR Developing Employee Centric Marketing Program Designs Pdf features a modern design for your presentation meetings. The adjustable and customizable slides provide unlimited possibilities for acing up your presentation. Slidegeeks has done all the homework before launching the product for you. So, do not wait, grab the presentation templates today This slide shows dashboard which can be used by organizations to measure the results of public relation strategy. It includes metrics such as media coverage rate, social media engagement rate, share of voice and brand mentions.


 Continue with Email

 Home
Home


