Snapshot

Low High Performance Measurement Indicator Dashboard Ppt PowerPoint Presentation Summary Images
This is a low high performance measurement indicator dashboard ppt powerpoint presentation summary images. This is a five stage process. The stages in this process are performance dashboard, performance meter, performance kpi.
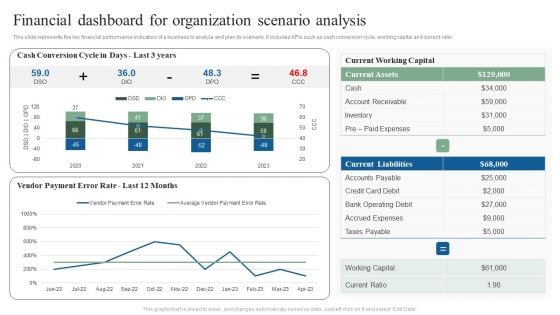
Financial Dashboard For Organization Scenario Analysis Ppt Show Ideas PDF
This slide represents the key financial performance indicators of a business to analyze and plan its scenario. It includes KPIs such as cash conversion cycle, working capital and current ratio. Showcasing this set of slides titled Financial Dashboard For Organization Scenario Analysis Ppt Show Ideas PDF. The topics addressed in these templates are Current Working Capital, Current Liabilities, Current Assets. All the content presented in this PPT design is completely editable. Download it and make adjustments in color, background, font etc. as per your unique business setting.

Product Quality Check Ppt PowerPoint Presentation Styles Layouts
This is a product quality check ppt powerpoint presentation styles layouts. This is a five stage process. The stages in this process are business, marketing, management, dashboard.
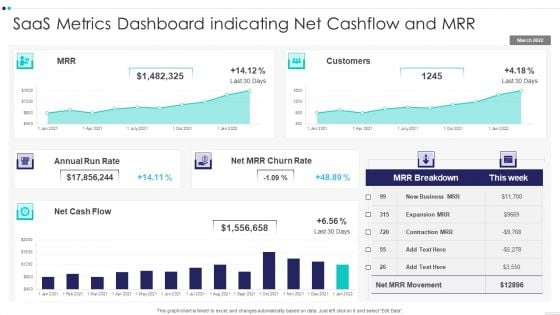
Saas Metrics Dashboard Indicating Net Cashflow And MRR Demonstration PDF
Pitch your topic with ease and precision using this Saas Metrics Dashboard Indicating Net Cashflow And MRR Demonstration PDF This layout presents information on Saas Metrics Dashboard Indicating Net Cashflow And MRR It is also available for immediate download and adjustment. So, changes can be made in the color, design, graphics or any other component to create a unique layout.
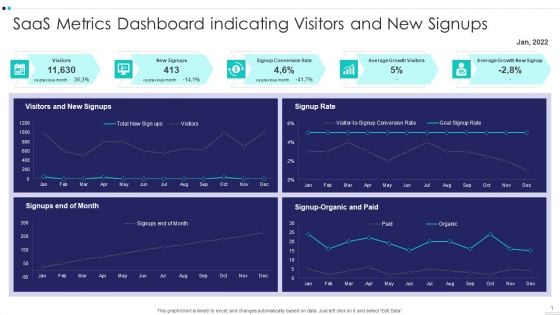
Saas Metrics Dashboard Indicating Visitors And New Signups Elements PDF
Pitch your topic with ease and precision using this Saas Metrics Dashboard Indicating Visitors And New Signups Elements PDF This layout presents information on Saas Metrics Dashboard Indicating Visitors And New Signups It is also available for immediate download and adjustment. So, changes can be made in the color, design, graphics or any other component to create a unique layout.
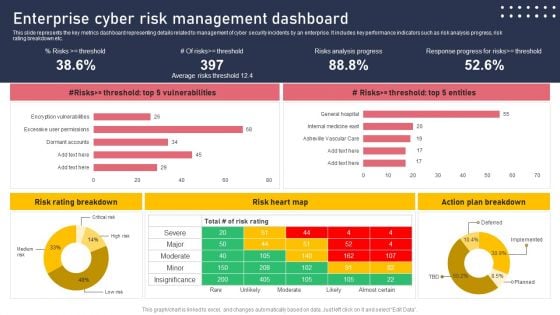
Enterprise Cyber Risk Management Dashboard Sample PDF
This slide represents the key metrics dashboard representing details related to management of cyber security incidents by an enterprise. It includes key performance indicators such as risk analysis progress, risk rating breakdown etc. There are so many reasons you need a Enterprise Cyber Risk Management Dashboard Sample PDF. The first reason is you cannot spend time making everything from scratch, Thus, Slidegeeks has made presentation templates for you too. You can easily download these templates from our website easily.

Table Of Contents Global Data Security Industry Report IR SS V
Slidegeeks has constructed Table Of Contents Global Data Security Industry Report IR SS V after conducting extensive research and examination. These presentation templates are constantly being generated and modified based on user preferences and critiques from editors. Here, you will find the most attractive templates for a range of purposes while taking into account ratings and remarks from users regarding the content. This is an excellent jumping-off point to explore our content and will give new users an insight into our top-notch PowerPoint Templates. Our Table Of Contents Global Data Security Industry Report IR SS V are topically designed to provide an attractive backdrop to any subject. Use them to look like a presentation pro.
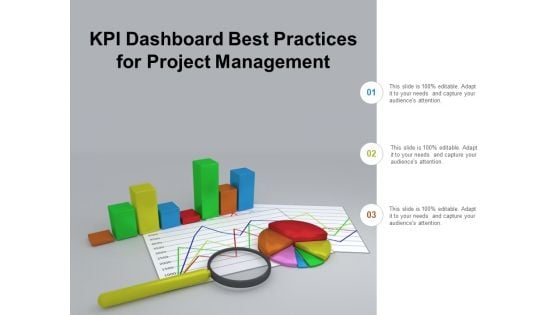
Kpi Dashboard Best Practices For Project Management Ppt Powerpoint Presentation Outline Samples
This is a kpi dashboard best practices for project management ppt powerpoint presentation outline samples. This is a three stage process. The stages in this process are business metrics, business kpi, business dashboard.

Global Data Security Industry Report Risk Evaluation Within Cybersecurity Industry IR SS V
The slide depicts risk assessment for the cybersecurity industry. It aims to educate the audience on the need of successfully recognizing and managing risks to maintain the stability. It covers potential hazards associated with data beaches, phishing attacks, malware, regulatory compliance, and IoT security issues. The best PPT templates are a great way to save time, energy, and resources. Slidegeeks have 100 percent editable powerpoint slides making them incredibly versatile. With these quality presentation templates, you can create a captivating and memorable presentation by combining visually appealing slides and effectively communicating your message. Download Global Data Security Industry Report Risk Evaluation Within Cybersecurity Industry IR SS V from Slidegeeks and deliver a wonderful presentation. The slide depicts risk assessment for the cybersecurity industry. It aims to educate the audience on the need of successfully recognizing and managing risks to maintain the stability. It covers potential hazards associated with data beaches, phishing attacks, malware, regulatory compliance, and IoT security issues.
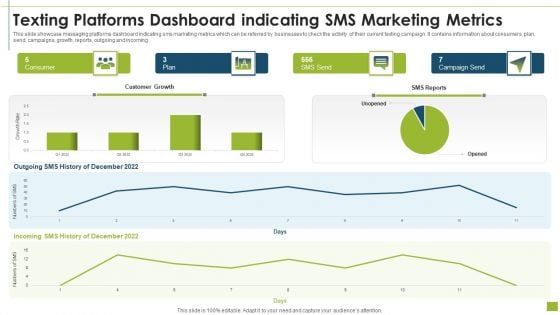
Texting Platforms Dashboard Indicating SMS Marketing Metrics Designs PDF
This slide showcase messaging platforms dashboard indicating sms marketing metrics which can be referred by businesses to check the activity of their current texting campaign. It contains information about consumers, plan, send, campaigns, growth, reports, outgoing and incoming.Pitch your topic with ease and precision using this texting platforms dashboard indicating sms marketing metrics designs pdf This layout presents information on texting platforms dashboard indicating sms marketing metrics It is also available for immediate download and adjustment. So, changes can be made in the color, design, graphics or any other component to create a unique layout.
Key Business Metrics Dashboard Ppt PowerPoint Presentation Outline Model Cpb
This is a key business metrics dashboard ppt powerpoint presentation outline model cpb. This is a six stage process. The stages in this process are key business metrics dashboard.
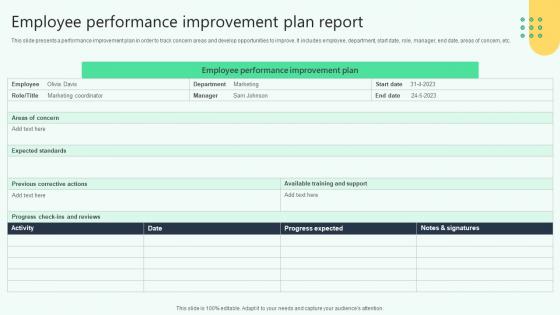
Employee Performance Improvement Plan Report Analysing Hr Data For Effective Decision Making
This slide presents a performance improvement plan in order to track concern areas and develop opportunities to improve. It includes employee, department, start date, role, manager, end date, areas of concern, etc. Formulating a presentation can take up a lot of effort and time, so the content and message should always be the primary focus. The visuals of the PowerPoint can enhance the presenters message, so our Employee Performance Improvement Plan Report Analysing Hr Data For Effective Decision Making was created to help save time. Instead of worrying about the design, the presenter can concentrate on the message while our designers work on creating the ideal templates for whatever situation is needed. Slidegeeks has experts for everything from amazing designs to valuable content, we have put everything into Employee Performance Improvement Plan Report Analysing Hr Data For Effective Decision Making. This slide presents a performance improvement plan in order to track concern areas and develop opportunities to improve. It includes employee, department, start date, role, manager, end date, areas of concern, etc.

Global Data Security Industry Report Regional Market Insights For Cybersecurity Industry IR SS V
The slide portrays a detailed overview of the cybersecurity industry. The purpose of the slide is to provide regional dynamics and assist stakeholders in developing regionally-tailored products and strategies to maximize market share. It covers regions such as North America, Asia Pacific, Europe, Latin America, and the Middle East and Africa. Explore a selection of the finest Global Data Security Industry Report Regional Market Insights For Cybersecurity Industry IR SS V here. With a plethora of professionally designed and pre-made slide templates, you can quickly and easily find the right one for your upcoming presentation. You can use our Global Data Security Industry Report Regional Market Insights For Cybersecurity Industry IR SS V to effectively convey your message to a wider audience. Slidegeeks has done a lot of research before preparing these presentation templates. The content can be personalized and the slides are highly editable. Grab templates today from Slidegeeks. The slide portrays a detailed overview of the cybersecurity industry. The purpose of the slide is to provide regional dynamics and assist stakeholders in developing regionally-tailored products and strategies to maximize market share. It covers regions such as North America, Asia Pacific, Europe, Latin America, and the Middle East and Africa.
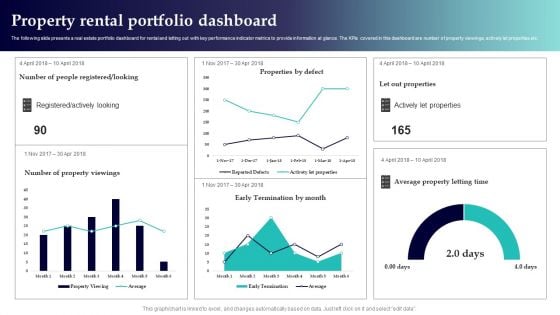
Property Rental Portfolio Dashboard Topics PDF
The following slide presents a real estate portfolio dashboard for rental and letting out with key performance indicator metrics to provide information at glance. The KPIs covered in this dashboard are number of property viewings, actively let properties etc. Showcasing this set of slides titled Property Rental Portfolio Dashboard Topics PDF. The topics addressed in these templates are People Registered Looking, Actively Let Properties, Average Property Letting Time. All the content presented in this PPT design is completely editable. Download it and make adjustments in color, background, font etc. as per your unique business setting.

Global Data Security Industry Report Major Market Trends Impacting Cybersecurity Industry IR SS V
The slide highlights the market trends in the global cybersecurity industry. These trends are having a significant impact on the way the industry operates, and they are likely to continue in the coming years. It cover trends such as artificial intelligence, real-time data monitoring, managed services, users as an attack surface, and quantum cryptography. Coming up with a presentation necessitates that the majority of the effort goes into the content and the message you intend to convey. The visuals of a PowerPoint presentation can only be effective if it supplements and supports the story that is being told. Keeping this in mind our experts created Global Data Security Industry Report Major Market Trends Impacting Cybersecurity Industry IR SS V to reduce the time that goes into designing the presentation. This way, you can concentrate on the message while our designers take care of providing you with the right template for the situation. The slide highlights the market trends in the global cybersecurity industry. These trends are having a significant impact on the way the industry operates, and they are likely to continue in the coming years. It cover trends such as artificial intelligence, real-time data monitoring, managed services, users as an attack surface, and quantum cryptography.
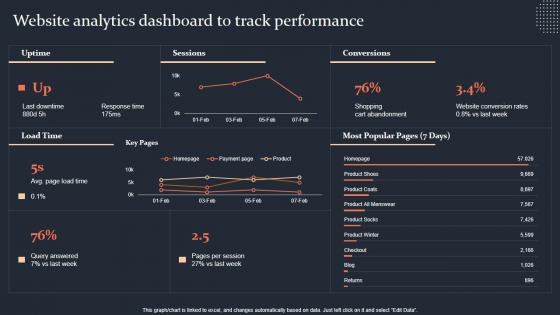
Website Analytics Dashboard To Track Performance Step By Step Guide Inspiration PDF
This graph chart is linked to excel, and changes automatically based on data. Just left click on it and select Edit Data. Slidegeeks is here to make your presentations a breeze with Website Analytics Dashboard To Track Performance Step By Step Guide Inspiration PDF With our easy-to-use and customizable templates, you can focus on delivering your ideas rather than worrying about formatting. With a variety of designs to choose from, you are sure to find one that suits your needs. And with animations and unique photos, illustrations, and fonts, you can make your presentation pop. So whether you are giving a sales pitch or presenting to the board, make sure to check out Slidegeeks first This graph chart is linked to excel, and changes automatically based on data. Just left click on it and select Edit Data.
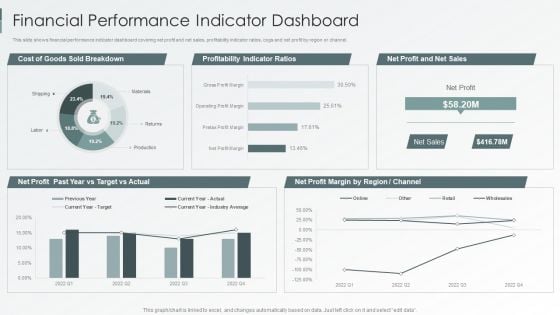
Enterprise Sustainability Performance Metrics Financial Performance Indicator Dashboard Themes PDF
This slide shows financial performance indicator dashboard covering net profit and net sales, profitability indicator ratios, cogs and net profit by region or channel.Deliver an awe inspiring pitch with this creative Enterprise Sustainability Performance Metrics Financial Performance Indicator Dashboard Themes PDF bundle. Topics like Profitability Indicator, Sold Breakdown, Target Actual can be discussed with this completely editable template. It is available for immediate download depending on the needs and requirements of the user.
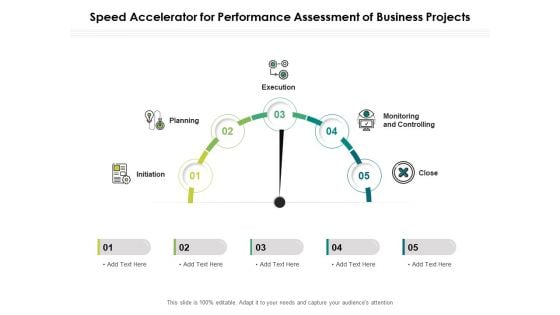
Speed Accelerator For Performance Assessment Of Business Projects Ppt PowerPoint Presentation Show Example Introduction PDF
Presenting this set of slides with name speed accelerator for performance assessment of business projects ppt powerpoint presentation show example introduction pdf. This is a five stage process. The stages in this process are initiation, planning, execution, monitoring and controlling, close. This is a completely editable PowerPoint presentation and is available for immediate download. Download now and impress your audience.
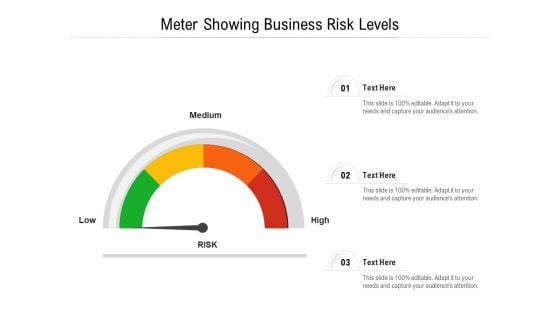
Meter Showing Business Risk Levels Ppt PowerPoint Presentation Show Slide PDF
Persuade your audience using this meter showing business risk levels ppt powerpoint presentation show slide pdf. This PPT design covers three stages, thus making it a great tool to use. It also caters to a variety of topics including low, medium, high. Download this PPT design now to present a convincing pitch that not only emphasizes the topic but also showcases your presentation skills.
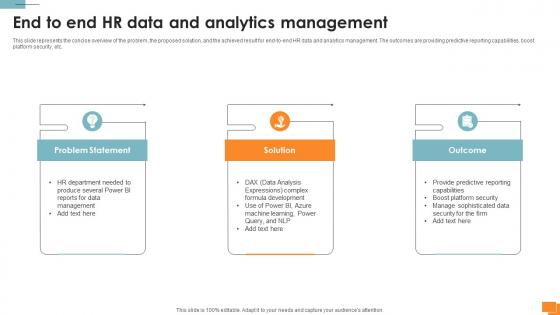
Statistical Tools For Evidence End To End HR Data And Analytics Management
This slide represents the concise overview of the problem, the proposed solution, and the achieved result for end-to-end HR data and analytics management. The outcomes are providing predictive reporting capabilities, boost platform security, etc. Coming up with a presentation necessitates that the majority of the effort goes into the content and the message you intend to convey. The visuals of a PowerPoint presentation can only be effective if it supplements and supports the story that is being told. Keeping this in mind our experts created Statistical Tools For Evidence End To End HR Data And Analytics Management to reduce the time that goes into designing the presentation. This way, you can concentrate on the message while our designers take care of providing you with the right template for the situation. This slide represents the concise overview of the problem, the proposed solution, and the achieved result for end-to-end HR data and analytics management. The outcomes are providing predictive reporting capabilities, boost platform security, etc.
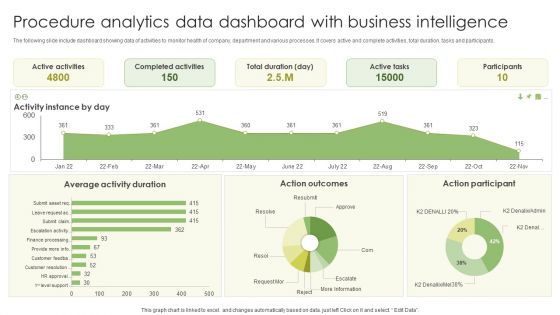
Procedure Analytics Data Dashboard With Business Intelligence Slides PDF
The following slide include dashboard showing data of activities to monitor health of company, department and various processes. It covers active and complete activities, total duration, tasks and participants. Pitch your topic with ease and precision using this Procedure Analytics Data Dashboard With Business Intelligence Slides PDF. This layout presents information on Active Activities, Completed Activities, Active Tasks . It is also available for immediate download and adjustment. So, changes can be made in the color, design, graphics or any other component to create a unique layout.
Customer Satisfaction Template 1 Ppt PowerPoint Presentation Icon Outline
This is a customer satisfaction template 1 ppt powerpoint presentation icon outline. This is a three stage process. The stages in this process are overall satisfaction with service, satisfaction with value for money, overall satisfaction with relationship, dashboard business.
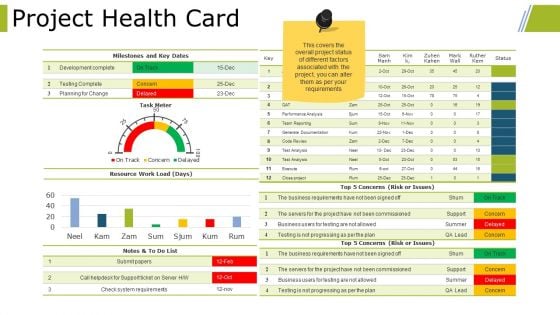
Project Health Card Ppt PowerPoint Presentation File Gallery
This is a project health card ppt powerpoint presentation file gallery. This is a five stage process. The stages in this process are project dashboard, measurement, marketing, strategy, business.
Sales L2RM System Tracking Key Metrics Dashboard Ppt Professional Format Ideas PDF
This slide represents the dashboard for tracking the key performance indicators of sales lead to revenue management. It includes key metrics such as leads by campaign, ratings, lead generation rate, top accounts by revenue and top owners by number of accounts. Showcasing this set of slides titled Sales L2RM System Tracking Key Metrics Dashboard Ppt Professional Format Ideas PDF. The topics addressed in these templates are Leads By Campaign, Leads By Rating, Leads Generation Rate. All the content presented in this PPT design is completely editable. Download it and make adjustments in color, background, font etc. as per your unique business setting.
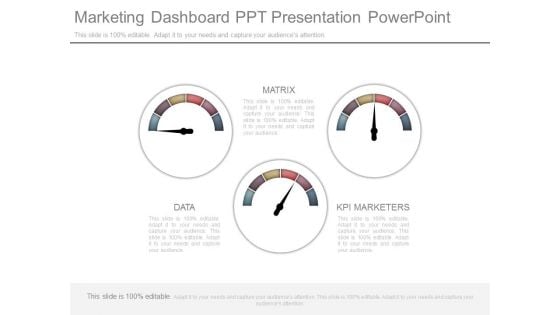
Marketing Dashboard Ppt Presentation Powerpoint
This is a marketing dashboard ppt presentation powerpoint. This is a three stage process. The stages in this process are data, matrix, kpi marketers.
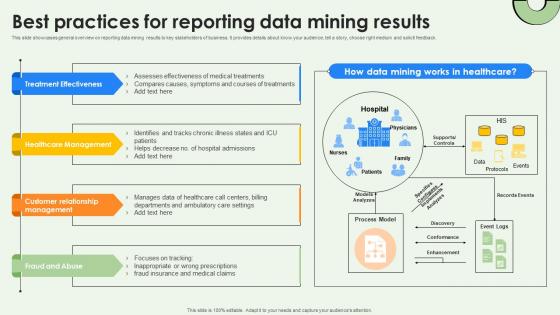
Data Warehousing And Best Practices For Reporting Data Mining Results AI SS V
This slide showcases general overview on reporting data mining results to key stakeholders of business. It provides details about know your audience, tell a story, choose right medium and solicit feedback. Are you searching for a Data Warehousing And Best Practices For Reporting Data Mining Results AI SS V that is uncluttered, straightforward, and original Its easy to edit, and you can change the colors to suit your personal or business branding. For a presentation that expresses how much effort you have put in, this template is ideal With all of its features, including tables, diagrams, statistics, and lists, its perfect for a business plan presentation. Make your ideas more appealing with these professional slides. Download Data Warehousing And Best Practices For Reporting Data Mining Results AI SS V from Slidegeeks today. This slide showcases general overview on reporting data mining results to key stakeholders of business. It provides details about know your audience, tell a story, choose right medium and solicit feedback.
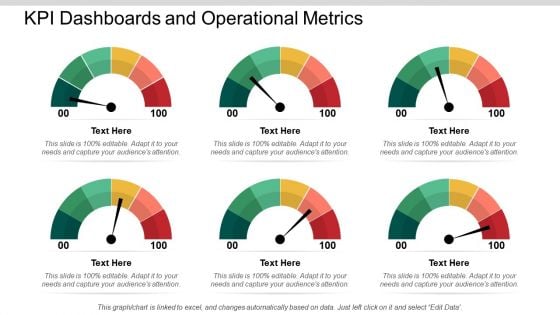
KPI Dashboards And Operational Metrics Ppt PowerPoint Presentation Portfolio Infographics
Icon For Risk Metrics Performance Indicators Dashboard Designs PDF
Persuade your audience using this Icon For Risk Metrics Performance Indicators Dashboard Designs PDF. This PPT design covers four stages, thus making it a great tool to use. It also caters to a variety of topics including Icon For Risk Metrics Performance Indicators Dashboard. Download this PPT design now to present a convincing pitch that not only emphasizes the topic but also showcases your presentation skills.
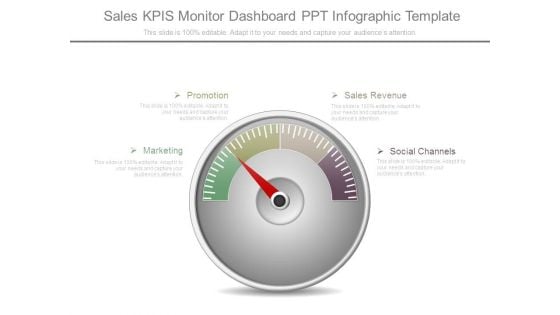
Sales Kpis Monitor Dashboard Ppt Infographic Template
This is a sales kpis monitor dashboard ppt infographic template. This is a one stage process. The stages in this process are promotion, marketing, sales revenue, social channels.
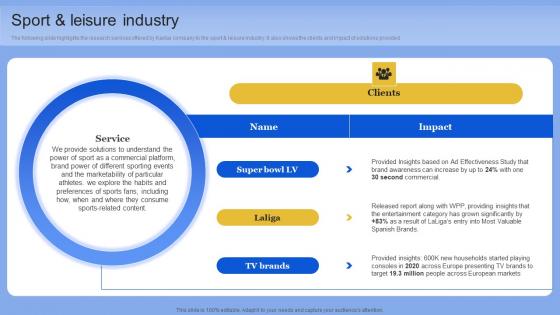
Sport And Leisure Industry Data Analytics Company Outline Pictures PDF
The following slide highlights the research services offered by Kantar company to the sport and leisure industry. It also shows the clients and impact of solutions provided. This Sport And Leisure Industry Data Analytics Company Outline Pictures PDF from Slidegeeks makes it easy to present information on your topic with precision. It provides customization options, so you can make changes to the colors, design, graphics, or any other component to create a unique layout. It is also available for immediate download, so you can begin using it right away. Slidegeeks has done good research to ensure that you have everything you need to make your presentation stand out. Make a name out there for a brilliant performance. The following slide highlights the research services offered by Kantar company to the sport and leisure industry. It also shows the clients and impact of solutions provided
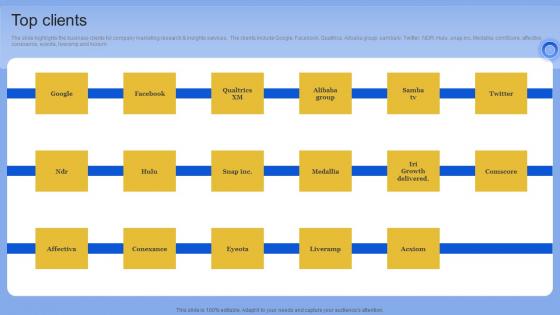
Top Clients Data Analytics Company Outline Pictures PDF
The slide highlights the business clients for company marketing research and insights services. The clients include Google, Facebook, Qualtrics, Alibaba group, samba tv, Twitter, NDR, Hulu, snap.inc, Medallia, comScore, affective, conexance, eyeota, liveramp and Acxiom Find a pre-designed and impeccable Top Clients Data Analytics Company Outline Pictures PDF The templates can ace your presentation without additional effort. You can download these easy-to-edit presentation templates to make your presentation stand out from others. So, what are you waiting for Download the template from Slidegeeks today and give a unique touch to your presentation. The slide highlights the business clients for company marketing research and insights services. The clients include Google, Facebook, Qualtrics, Alibaba group, samba tv, Twitter, NDR, Hulu, snap.inc, Medallia, comScore, affective, conexance, eyeota, liveramp and Acxiom
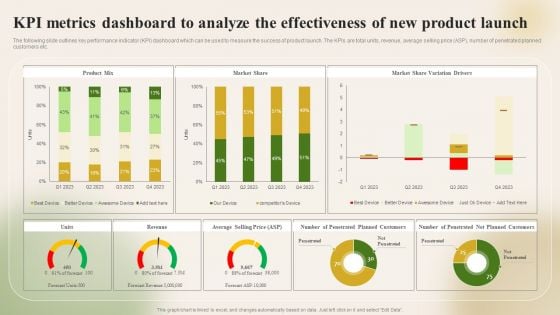
KPI Metrics Dashboard To Analyze The Effectiveness Of New Introducing New Food Pictures PDF
The following slide outlines key performance indicator KPI dashboard which can be used to measure the success of product launch. The KPIs are total units, revenue, average selling price ASP, number of penetrated planned customers etc. Make sure to capture your audiences attention in your business displays with our gratis customizable KPI Metrics Dashboard To Analyze The Effectiveness Of New Introducing New Food Pictures PDF. These are great for business strategies, office conferences, capital raising or task suggestions. If you desire to acquire more customers for your tech business and ensure they stay satisfied, create your own sales presentation with these plain slides.
Important Kpis For Tracking Cloud Data Intelligence Sample Pdf
This slide covers the top key performance indicators KPIs for tracking data analytics. The purpose of this template is to provide an overview of the KPIs that can help assess the effectiveness, adoption, accuracy, and efficiency of data analytics initiatives. It includes stat driven targets and actionable steps. Pitch your topic with ease and precision using this Important Kpis For Tracking Cloud Data Intelligence Sample Pdf. This layout presents information on Analytics Regularly, Generate Insights, Optimize Workflows. It is also available for immediate download and adjustment. So, changes can be made in the color, design, graphics or any other component to create a unique layout. This slide covers the top key performance indicators KPIs for tracking data analytics. The purpose of this template is to provide an overview of the KPIs that can help assess the effectiveness, adoption, accuracy, and efficiency of data analytics initiatives. It includes stat driven targets and actionable steps.
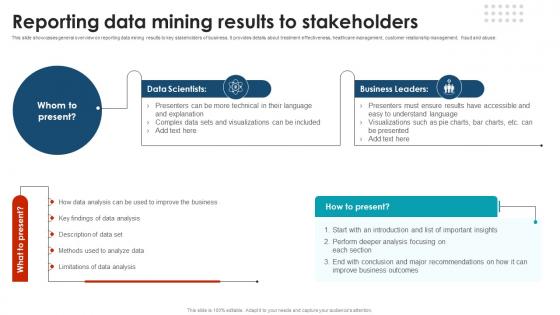
Reporting Data Mining Results To Stakeholders Using Data Mining Tools To Optimize Processes AI SS V
This slide showcases general overview on reporting data mining results to key stakeholders of business. It provides details about treatment effectiveness, healthcare management, customer relationship management, fraud and abuse. Here you can discover an assortment of the finest PowerPoint and Google Slides templates. With these templates, you can create presentations for a variety of purposes while simultaneously providing your audience with an eye-catching visual experience. Download Reporting Data Mining Results To Stakeholders Using Data Mining Tools To Optimize Processes AI SS V to deliver an impeccable presentation. These templates will make your job of preparing presentations much quicker, yet still, maintain a high level of quality. Slidegeeks has experienced researchers who prepare these templates and write high-quality content for you. Later on, you can personalize the content by editing the Reporting Data Mining Results To Stakeholders Using Data Mining Tools To Optimize Processes AI SS V. This slide showcases general overview on reporting data mining results to key stakeholders of business. It provides details about treatment effectiveness, healthcare management, customer relationship management, fraud and abuse.
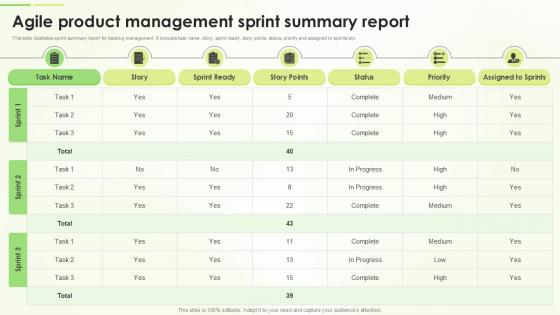
Agile Product Management Sprint Summary Report
Slidegeeks is one of the best resources for PowerPoint templates. You can download easily and regulate Agile Product Management Sprint Summary Report for your personal presentations from our wonderful collection. A few clicks is all it takes to discover and get the most relevant and appropriate templates. Use our Templates to add a unique zing and appeal to your presentation and meetings. All the slides are easy to edit and you can use them even for advertisement purposes. Use our professionally crafted templated on Sprint Summary Report designed for effective backlog management covering key elements including task names, user stories, sprint readiness, story points, current status, priority levels, and sprint assignments, etc. providing overview of priorities and progress.
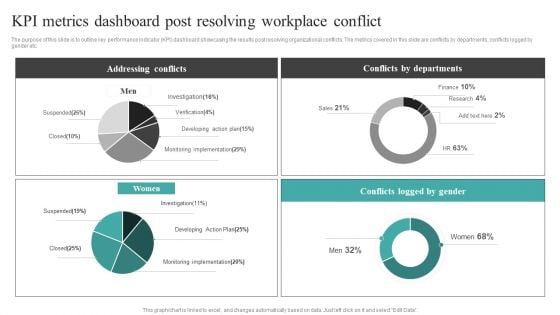
Common Conflict Situations Kpi Metrics Dashboard Post Resolving Workplace Information PDF
The purpose of this slide is to outline key performance indicator KPI dashboard showcasing the results post resolving organizational conflicts. The metrics covered in this slide are conflicts by departments, conflicts logged by gender etc. The Common Conflict Situations Kpi Metrics Dashboard Post Resolving Workplace Information PDF is a compilation of the most recent design trends as a series of slides. It is suitable for any subject or industry presentation, containing attractive visuals and photo spots for businesses to clearly express their messages. This template contains a variety of slides for the user to input data, such as structures to contrast two elements, bullet points, and slides for written information. Slidegeeks is prepared to create an impression.
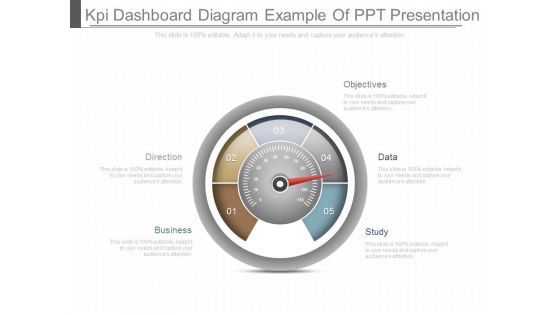
Kpi Dashboard Diagram Example Of Ppt Presentation
This is a kpi dashboard diagram example of ppt presentation. This is a five stage process. The stages in this process are business, direction, objectives, data, study.
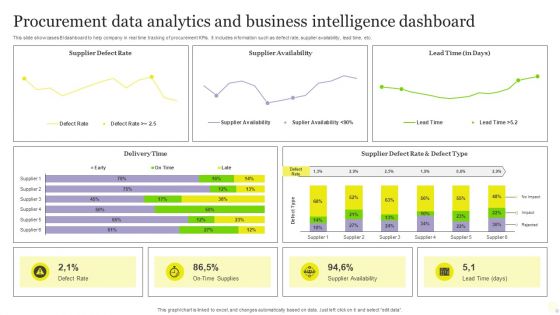
Procurement Data Analytics And Business Intelligence Dashboard Pictures PDF
This slide showcases BI dashboard to help company in real time tracking of procurement KPIs. It includes information such as defect rate, supplier availability, lead time, etc. Pitch your topic with ease and precision using this Procurement Data Analytics And Business Intelligence Dashboard Pictures PDF. This layout presents information on Procurement Data Analytics, Business Intelligence Dashboard. It is also available for immediate download and adjustment. So, changes can be made in the color, design, graphics or any other component to create a unique layout.
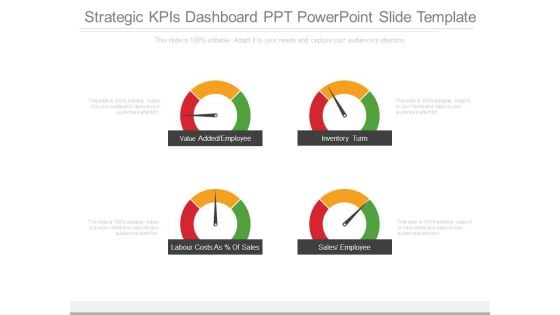
Strategic Kpis Dashboard Ppt Powerpoint Slide Template
This is a strategic kpis dashboard ppt powerpoint slide template. This is a four stage process. The stages in this process are value added employee, inventory turn, labour costs as of sales, sales employee.
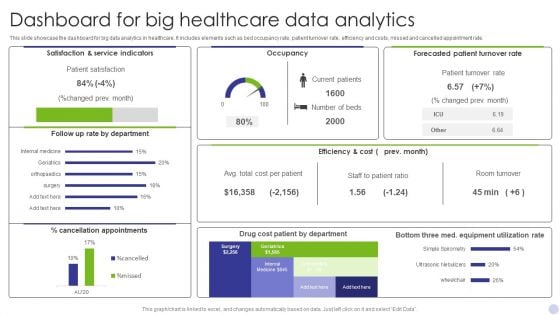
Dashboard For Big Healthcare Data Analytics Graphics PDF
This slide showcase the dashboard for big data analytics in healthcare. It includes elements such as bed occupancy rate, patient turnover rate, efficiency and costs, missed and cancelled appointment rate. Showcasing this set of slides titled Dashboard For Big Healthcare Data Analytics Graphics PDF. The topics addressed in these templates are Satisfaction Service Indicators, Occupancy, Forecasted Patient Turnover. All the content presented in this PPT design is completely editable. Download it and make adjustments in color, background, font etc. as per your unique business setting.

Current IT Infrastructure Assessment Report Data Migration From On Premises
This slide showcases assessment of existing IT infrastructure which includes hardware, software, network and storage hubs, web servers, routers, database servers etc. If your project calls for a presentation, then Slidegeeks is your go-to partner because we have professionally designed, easy-to-edit templates that are perfect for any presentation. After downloading, you can easily edit Current IT Infrastructure Assessment Report Data Migration From On Premises and make the changes accordingly. You can rearrange slides or fill them with different images. Check out all the handy templates This slide showcases assessment of existing IT infrastructure which includes hardware, software, network and storage hubs, web servers, routers, database servers etc.

Metrics For Project Success Evaluation Ppt PowerPoint Presentation Model Example File
This is a metrics for project success evaluation ppt powerpoint presentation model example file. This is a two stage process. The stages in this process are project dashboard, project kpis, project metrics.
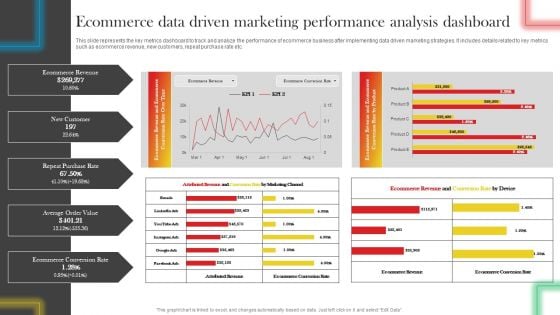
Ecommerce Data Driven Marketing Performance Analysis Dashboard Professional PDF
This slide represents the key metrics dashboard to track and analyze the performance of ecommerce business after implementing data driven marketing strategies. It includes details related to key metrics such as ecommerce revenue, new customers, repeat purchase rate etc. Get a simple yet stunning designed Ecommerce Data Driven Marketing Performance Analysis Dashboard Professional PDF. It is the best one to establish the tone in your meetings. It is an excellent way to make your presentations highly effective. So, download this PPT today from Slidegeeks and see the positive impacts. Our easy-to-edit Ecommerce Data Driven Marketing Performance Analysis Dashboard Professional PDF can be your go-to option for all upcoming conferences and meetings. So, what are you waiting for Grab this template today.
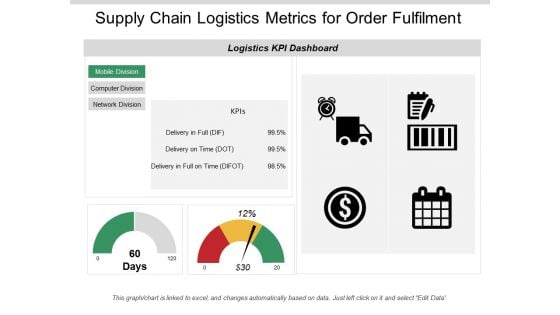
Supply Chain Logistics Metrics For Order Fulfilment Ppt PowerPoint Presentation Infographic Template Information
This is a supply chain logistics metrics for order fulfilment ppt powerpoint presentation infographic template information. This is a two stage process. The stages in this process are logistics performance, logistics dashboard, logistics kpis.

Supply Chain Metrics Fleet Efficiency Loading Time And Weight Ppt PowerPoint Presentation Portfolio Guidelines
This is a supply chain metrics fleet efficiency loading time and weight ppt powerpoint presentation portfolio guidelines. This is a four stage process. The stages in this process are logistics performance, logistics dashboard, logistics kpis.
Icons Slide For Global Data Security Industry Report IR SS V
Introducing our well designed Icons Slide For Global Data Security Industry Report IR SS V set of slides. The slide displays editable icons to enhance your visual presentation. The icons can be edited easily. So customize according to your business to achieve a creative edge. Download and share it with your audience. Our Icons Slide For Global Data Security Industry Report IR SS V are topically designed to provide an attractive backdrop to any subject. Use them to look like a presentation pro.
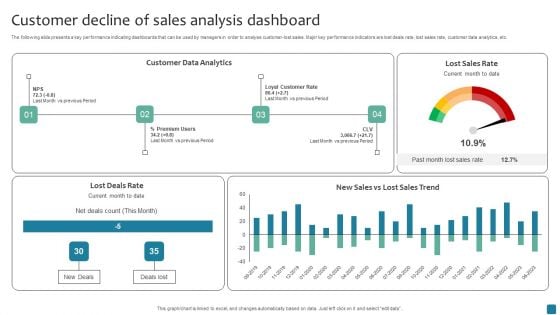
Customer Decline Of Sales Analysis Dashboard Rules PDF
The following slide presents a key performance indicating dashboards that can be used by managers in order to analyse customer-lost sales. Major key performance indicators are lost deals rate, lost sales rate, customer data analytics, etc. Pitch your topic with ease and precision using this Customer Decline Of Sales Analysis Dashboard Rules PDF. This layout presents information on Customer Data Analytics. It is also available for immediate download and adjustment. So, changes can be made in the color, design, graphics or any other component to create a unique layout.
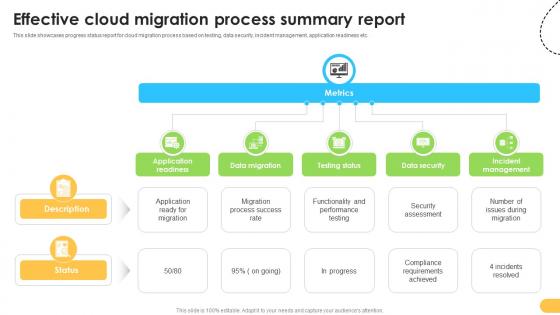
Effective Cloud Migration Process Summary Report Data Migration From On Premises
This slide showcases progress status report for cloud migration process based on testing, data security, incident management, application readiness etc. Are you in need of a template that can accommodate all of your creative concepts This one is crafted professionally and can be altered to fit any style. Use it with Google Slides or PowerPoint. Include striking photographs, symbols, depictions, and other visuals. Fill, move around, or remove text boxes as desired. Test out color palettes and font mixtures. Edit and save your work, or work with colleagues. Download Effective Cloud Migration Process Summary Report Data Migration From On Premises and observe how to make your presentation outstanding. Give an impeccable presentation to your group and make your presentation unforgettable. This slide showcases progress status report for cloud migration process based on testing, data security, incident management, application readiness etc.
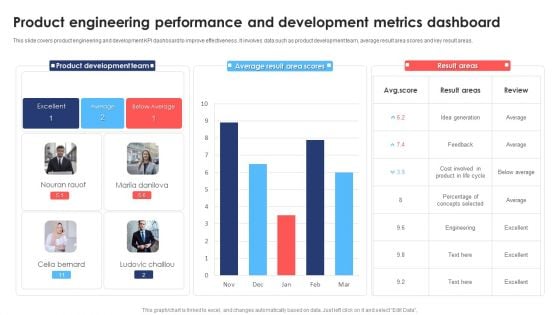
Product Engineering Performance And Development Metrics Dashboard Topics PDF
This slide covers product engineering and development KPI dashboard to improve effectiveness. It involves data such as product development team, average result area scores and key result areas. Showcasing this set of slides titled Product Engineering Performance And Development Metrics Dashboard Topics PDF. The topics addressed in these templates are Product Development Team, Average, Cost. All the content presented in this PPT design is completely editable. Download it and make adjustments in color, background, font etc. as per your unique business setting.
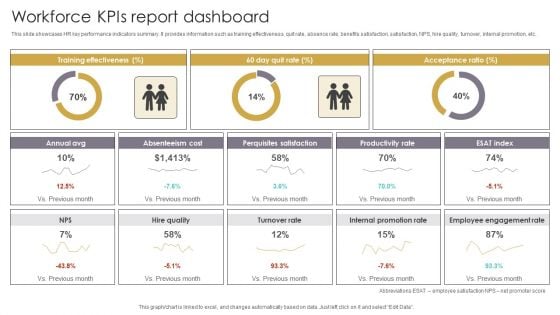
Workforce Kpis Report Dashboard Slides PDF
This slide showcases HR key performance indicators summary. It provides information such as training effectiveness, quit rate, absence rate, benefits satisfaction, satisfaction, NPS, hire quality, turnover, internal promotion, etc. Pitch your topic with ease and precision using this Workforce Kpis Report Dashboard Slides PDF. This layout presents information on Acceptance Ratio, Absenteeism Cost, Perquisites Satisfaction. It is also available for immediate download and adjustment. So, changes can be made in the color, design, graphics or any other component to create a unique layout.
Key Business Metrics Dashboard Ppt Powerpoint Presentation Icon Graphics Design
This is a key business metrics dashboard ppt powerpoint presentation icon graphics design. This is a five stage process. The stages in this process are finance, marketing, management, investment, analysis.
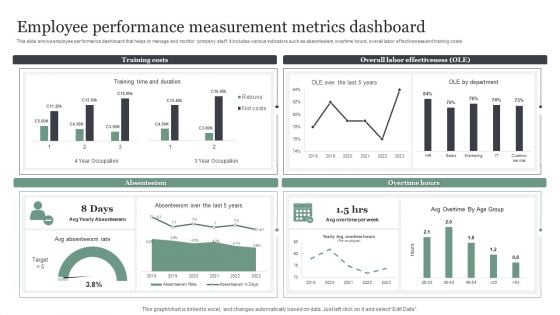
Employee Performance Measurement Metrics Dashboard Brochure PDF
This slide shows employee performance dashboard that helps to manage and monitor company staff. It includes various indicators such as absenteeism, overtime hours, overall labor effectiveness and training costs. Showcasing this set of slides titled Employee Performance Measurement Metrics Dashboard Brochure PDF. The topics addressed in these templates are Training Costs, Overall Labor Effectiveness. All the content presented in this PPT design is completely editable. Download it and make adjustments in color, background, font etc. as per your unique business setting.
Data Reports Visualization Vector Ppt PowerPoint Presentation Visual Aids Deck
Presenting this set of slides with name data reports visualization vector ppt powerpoint presentation visual aids deck. The topics discussed in these slides are data visualization icon, research analysis, business focus. This is a completely editable PowerPoint presentation and is available for immediate download. Download now and impress your audience.
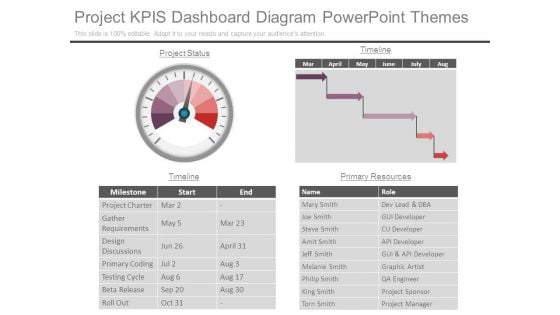
Project Kpis Dashboard Diagram Powerpoint Themes
This is a project kpis dashboard diagram powerpoint themes. This is a one stage process. The stages in this process are project status, timeline, name, role, milestone, start, end, primary resources, project charter, gather requirements, design discussions, primary coding, testing cycle, beta release, roll out, mary smith, joe smith, steve smith, amit smith, jeff smith, melanie smith, philip smith, king smith, torn smith, dev lead and dba, gui developer, cu developer, api developer, gui and api developer, graphic artist, qa engineer, project sponsor, project manager.
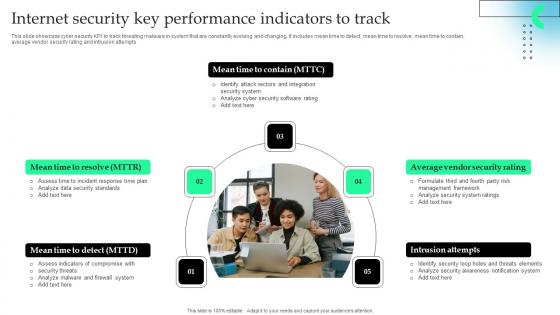
Internet Security Key Performance Indicators To Track Microsoft Pdf
This slide showcase cyber security KPI to track threating malware in system that are constantly evolving and changing. It includes mean time to detect, mean time to resolve, mean time to contain, average vendor security rating and intrusion attempts.Showcasing this set of slides titled Internet Security Key Performance Indicators To Track Microsoft Pdf The topics addressed in these templates are Firewall System, Security Standards, Identify Attack All the content presented in this PPT design is completely editable. Download it and make adjustments in color, background, font etc. as per your unique business setting. This slide showcase cyber security KPI to track threating malware in system that are constantly evolving and changing. It includes mean time to detect, mean time to resolve, mean time to contain, average vendor security rating and intrusion attempts.
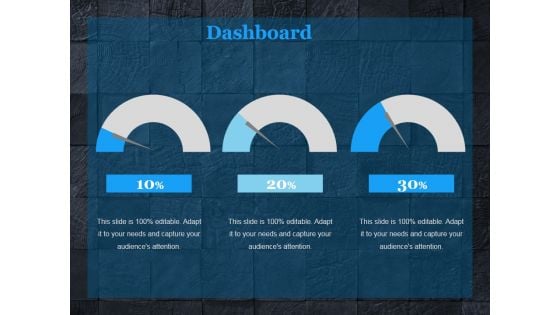
Dashboard Ppt PowerPoint Presentation Pictures
This is a dashboard ppt powerpoint presentation pictures. This is a three stage process. The stages in this process are dashboard, measure, marketing, strategy, business.
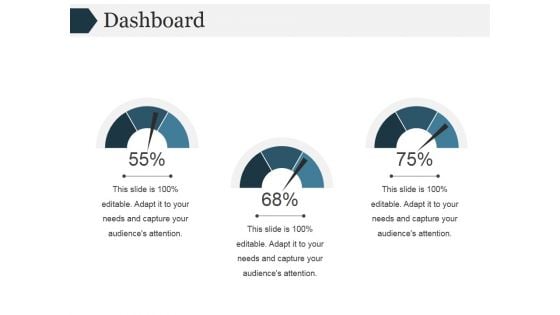
Dashboard Ppt PowerPoint Presentation Picture
This is a dashboard ppt powerpoint presentation picture. This is a three stage process. The stages in this process are business, dashboard, marketing, strategy, analysis.
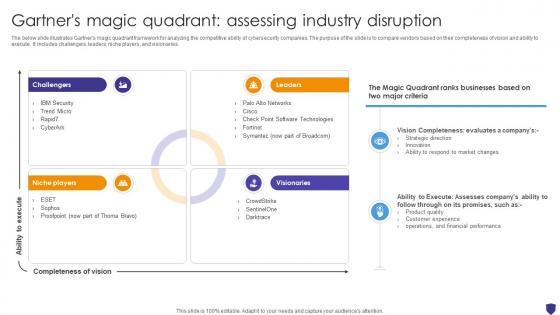
Global Data Security Industry Report Gartners Magic Quadrant Assessing Industry Disruption IR SS V
The below slide illustrates Gartners magic quadrant framework for analyzing the competitive ability of cybersecurity companies. The purpose of the slide is to compare vendors based on their completeness of vision and ability to execute. It includes challengers, leaders, niche players, and visionaries. Find highly impressive Global Data Security Industry Report Gartners Magic Quadrant Assessing Industry Disruption IR SS V on Slidegeeks to deliver a meaningful presentation. You can save an ample amount of time using these presentation templates. No need to worry to prepare everything from scratch because Slidegeeks experts have already done a huge research and work for you. You need to download Global Data Security Industry Report Gartners Magic Quadrant Assessing Industry Disruption IR SS V for your upcoming presentation. All the presentation templates are 100 percent editable and you can change the color and personalize the content accordingly. Download now The below slide illustrates Gartners magic quadrant framework for analyzing the competitive ability of cybersecurity companies. The purpose of the slide is to compare vendors based on their completeness of vision and ability to execute. It includes challengers, leaders, niche players, and visionaries.
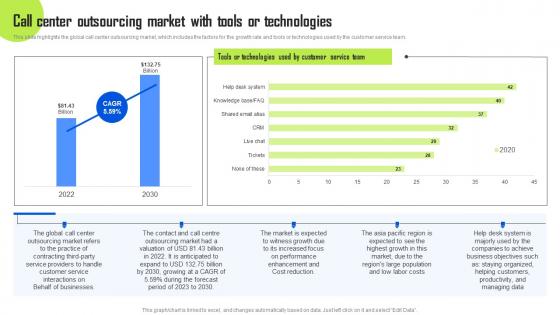
Call Center Outsourcing Market With Tools Or Technologies BPO Center Business Plan Mockup Pdf
This slide highlights the global call center outsourcing market, which includes the factors for the growth rate and tools or technologies used by the customer service team. Slidegeeks is here to make your presentations a breeze with Call Center Outsourcing Market With Tools Or Technologies BPO Center Business Plan Mockup Pdf With our easy-to-use and customizable templates, you can focus on delivering your ideas rather than worrying about formatting. With a variety of designs to choose from, you are sure to find one that suits your needs. And with animations and unique photos, illustrations, and fonts, you can make your presentation pop. So whether you are giving a sales pitch or presenting to the board, make sure to check out Slidegeeks first. This slide highlights the global call center outsourcing market, which includes the factors for the growth rate and tools or technologies used by the customer service team.

Global Data Security Industry Report Csr Initiatives Taken By Companies In Cybersecurity Industry IR SS V
The slide outlines CSR initiatives undertaken by the cybersecurity industry. The purpose of the slide is to encourage ethical practices, social responsibility, and sustainable development. The key components include cybersecurity education and training, community engagement. From laying roadmaps to briefing everything in detail, our templates are perfect for you. You can set the stage with your presentation slides. All you have to do is download these easy-to-edit and customizable templates. Global Data Security Industry Report Csr Initiatives Taken By Companies In Cybersecurity Industry IR SS V will help you deliver an outstanding performance that everyone would remember and praise you for. Do download this presentation today. The slide outlines CSR initiatives undertaken by the cybersecurity industry. The purpose of the slide is to encourage ethical practices, social responsibility, and sustainable development. The key components include cybersecurity education and training, community engagement.


 Continue with Email

 Home
Home


