Snapshot
Dashboard For Tracking Sales Team Sales Techniques For Achieving Guidelines Pdf
This slide covers the KPI dashboard for tracking sales rep performance. It includes metrics such as sales, target, percent of target, sales, and target for each salesperson. Find highly impressive Dashboard For Tracking Sales Team Sales Techniques For Achieving Guidelines Pdfon Slidegeeks to deliver a meaningful presentation. You can save an ample amount of time using these presentation templates. No need to worry to prepare everything from scratch because Slidegeeks experts have already done a huge research and work for you. You need to download Dashboard For Tracking Sales Team Sales Techniques For Achieving Guidelines Pdf for your upcoming presentation. All the presentation templates are 100 percent editable and you can change the color and personalize the content accordingly. Download now This slide covers the KPI dashboard for tracking sales rep performance. It includes metrics such as sales, target, percent of target, sales, and target for each salesperson.
Marketing Project Performance Benchmarking Dashboard To Track Influencer Marketing CRP SS V
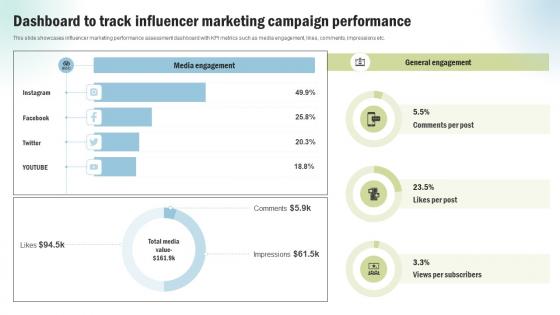
This slide showcases influencer marketing performance assessment dashboard with KPI metrics such as media engagement, likes, comments, impressions etc. Whether you have daily or monthly meetings, a brilliant presentation is necessary. Marketing Project Performance Benchmarking Dashboard To Track Influencer Marketing CRP SS V can be your best option for delivering a presentation. Represent everything in detail using Marketing Project Performance Benchmarking Dashboard To Track Influencer Marketing CRP SS V and make yourself stand out in meetings. The template is versatile and follows a structure that will cater to your requirements. All the templates prepared by Slidegeeks are easy to download and edit. Our research experts have taken care of the corporate themes as well. So, give it a try and see the results. This slide showcases influencer marketing performance assessment dashboard with KPI metrics such as media engagement, likes, comments, impressions etc.
Dashboard To Evaluate Investment Bank Performance Mastering Investment Banking Fin SS V
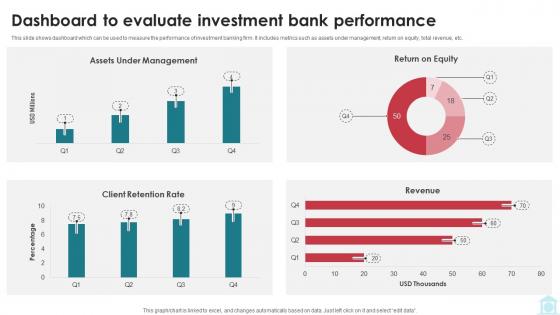
This slide shows dashboard which can be used to measure the performance of investment banking firm. It includes metrics such as assets under management, return on equity, total revenue, etc. Find highly impressive Dashboard To Evaluate Investment Bank Performance Mastering Investment Banking Fin SS V on Slidegeeks to deliver a meaningful presentation. You can save an ample amount of time using these presentation templates. No need to worry to prepare everything from scratch because Slidegeeks experts have already done a huge research and work for you. You need to download Dashboard To Evaluate Investment Bank Performance Mastering Investment Banking Fin SS V for your upcoming presentation. All the presentation templates are 100 percent editable and you can change the color and personalize the content accordingly. Download now This slide shows dashboard which can be used to measure the performance of investment banking firm. It includes metrics such as assets under management, return on equity, total revenue, etc.
Dashboard To Evaluate Investment Bank Investment Banking Simplified Functions Fin SS V
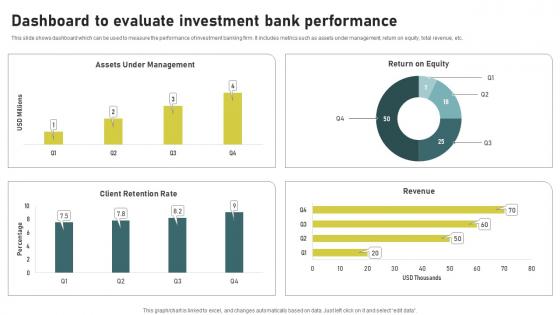
This slide shows dashboard which can be used to measure the performance of investment banking firm. It includes metrics such as assets under management, return on equity, total revenue, etc. Find highly impressive Dashboard To Evaluate Investment Bank Investment Banking Simplified Functions Fin SS V on Slidegeeks to deliver a meaningful presentation. You can save an ample amount of time using these presentation templates. No need to worry to prepare everything from scratch because Slidegeeks experts have already done a huge research and work for you. You need to download Dashboard To Evaluate Investment Bank Investment Banking Simplified Functions Fin SS V for your upcoming presentation. All the presentation templates are 100 percent editable and you can change the color and personalize the content accordingly. Download now This slide shows dashboard which can be used to measure the performance of investment banking firm. It includes metrics such as assets under management, return on equity, total revenue, etc.
Employee Relations In Human Resource Kpi Dashboard To Evaluate Human Resources Performance
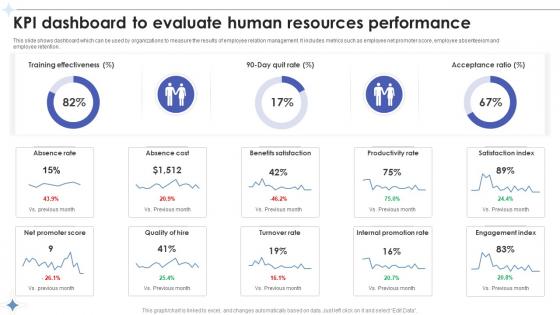
This slide shows dashboard which can be used by organizations to measure the results of employee relation management. It includes metrics such as employee net promoter score, employee absenteeism and employee retention. This Employee Relations In Human Resource Kpi Dashboard To Evaluate Human Resources Performance is perfect for any presentation, be it in front of clients or colleagues. It is a versatile and stylish solution for organizing your meetings. The Employee Relations In Human Resource Kpi Dashboard To Evaluate Human Resources Performance features a modern design for your presentation meetings. The adjustable and customizable slides provide unlimited possibilities for acing up your presentation. Slidegeeks has done all the homework before launching the product for you. So, do not wait, grab the presentation templates today This slide shows dashboard which can be used by organizations to measure the results of employee relation management. It includes metrics such as employee net promoter score, employee absenteeism and employee retention.
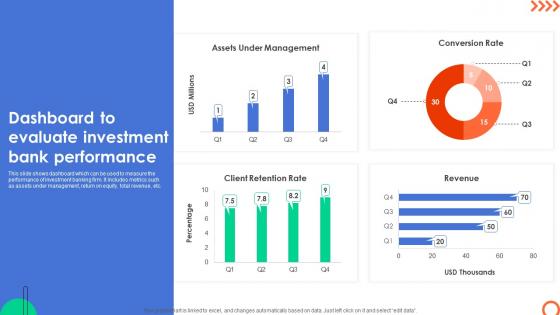
Dashboard To Evaluate Investment Bank Understanding Investment Banking Framework Fin SS V
This slide shows dashboard which can be used to measure the performance of investment banking firm. It includes metrics such as assets under management, return on equity, total revenue, etc. Find highly impressive Dashboard To Evaluate Investment Bank Understanding Investment Banking Framework Fin SS V on Slidegeeks to deliver a meaningful presentation. You can save an ample amount of time using these presentation templates. No need to worry to prepare everything from scratch because Slidegeeks experts have already done a huge research and work for you. You need to download Dashboard To Evaluate Investment Bank Understanding Investment Banking Framework Fin SS V for your upcoming presentation. All the presentation templates are 100 percent editable and you can change the color and personalize the content accordingly. Download now This slide shows dashboard which can be used to measure the performance of investment banking firm. It includes metrics such as assets under management, return on equity, total revenue, etc.

Devsecops Performance Monitoring Dashboard Role Of Devsecops Ppt Presentation
This slide represents the dashboard to track the DevSecOps performance. The purpose of this slide is to showcase a dashboard for metrics that track the latest vulnerabilities, open issues, latest tickets, and time to fix the problem, etc. If you are looking for a format to display your unique thoughts, then the professionally designed Devsecops Performance Monitoring Dashboard Role Of Devsecops Ppt Presentation is the one for you. You can use it as a Google Slides template or a PowerPoint template. Incorporate impressive visuals, symbols, images, and other charts. Modify or reorganize the text boxes as you desire. Experiment with shade schemes and font pairings. Alter, share or cooperate with other people on your work. Download Devsecops Performance Monitoring Dashboard Role Of Devsecops Ppt Presentation and find out how to give a successful presentation. Present a perfect display to your team and make your presentation unforgettable. This slide represents the dashboard to track the DevSecOps performance. The purpose of this slide is to showcase a dashboard for metrics that track the latest vulnerabilities, open issues, latest tickets, and time to fix the problem, etc.
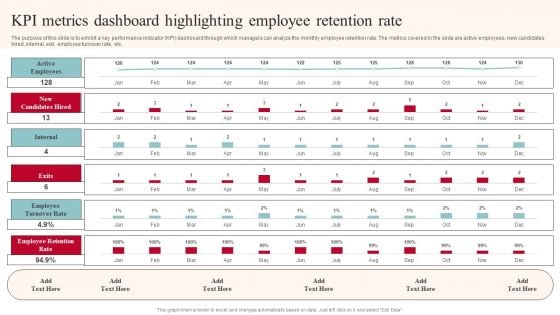
KPI Metrics Dashboard Highlighting Employee Retention Rate Structure PDF
The purpose of this slide is to exhibit a key performance indicator KPI dashboard through which managers can analyze the monthly employee retention rate. The metrics covered in the slide are active employees, new candidates hired, internal, exit, employee turnover rate, etc. Do you have to make sure that everyone on your team knows about any specific topic I yes, then you should give KPI Metrics Dashboard Highlighting Employee Retention Rate Structure PDF a try. Our experts have put a lot of knowledge and effort into creating this impeccable KPI Metrics Dashboard Highlighting Employee Retention Rate Structure PDF. You can use this template for your upcoming presentations, as the slides are perfect to represent even the tiniest detail. You can download these templates from the Slidegeeks website and these are easy to edit. So grab these today.
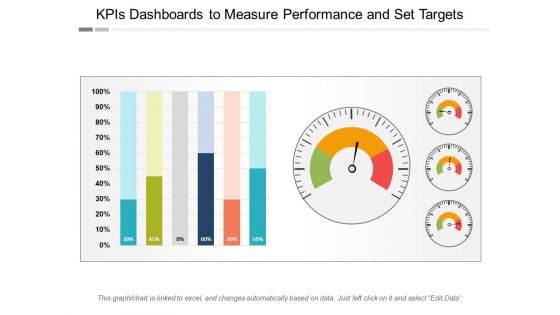
Kpis Dashboards To Measure Performance And Set Targets Ppt PowerPoint Presentation Gallery Visual Aids
This is a kpis dashboards to measure performance and set targets ppt powerpoint presentation gallery visual aids. This is a four stage process. The stages in this process are project dashboard, project kpis, project metrics.
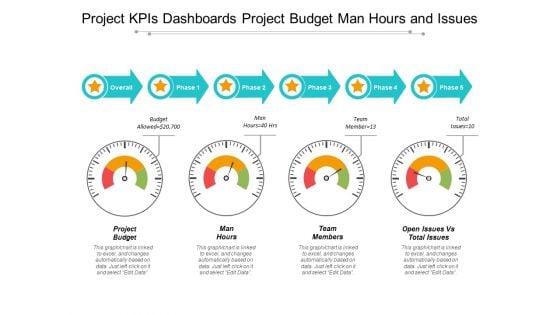
Project Kpis Dashboards Project Budget Man Hours And Issues Ppt PowerPoint Presentation Professional Design Inspiration
This is a project kpis dashboards project budget man hours and issues ppt powerpoint presentation professional design inspiration. This is a four stage process. The stages in this process are project dashboard, project kpis, project metrics.
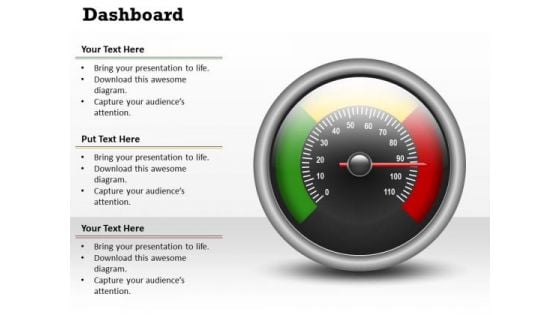
Consulting Diagram Dashboard Busines Design Marketing Diagram
Put In A Dollop Of Our Consulting Diagram Dashboard Busines Design Marketing Diagram Powerpoint Templates. Give Your Thoughts A Distinctive Flavor.
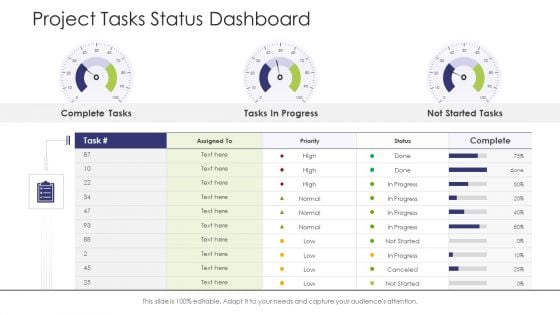
Business Venture Tactical Planning Complete PPT Deck Project Tasks Status Dashboard Infographics PDF
This is a business venture tactical planning complete ppt deck project tasks status dashboard infographics pdf template with various stages. Focus and dispense information on three stages using this creative set, that comes with editable features. It contains large content boxes to add your information on topics like project tasks status dashboard. You can also showcase facts, figures, and other relevant content using this PPT layout. Grab it now.
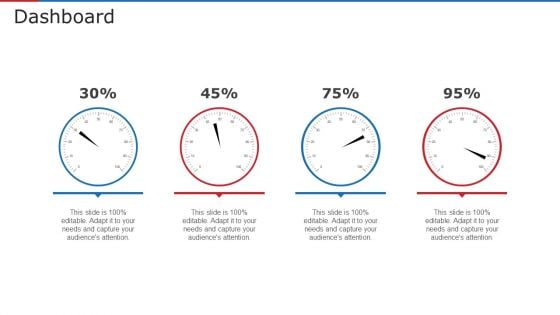
Subscription Based Business Model For New Ventures Dashboard Ppt Ideas Show PDF
This is a subscription based business model for new ventures dashboard ppt ideas show pdf template with various stages. Focus and dispense information on four stages using this creative set, that comes with editable features. It contains large content boxes to add your information on topics like dashboard. You can also showcase facts, figures, and other relevant content using this PPT layout. Grab it now.
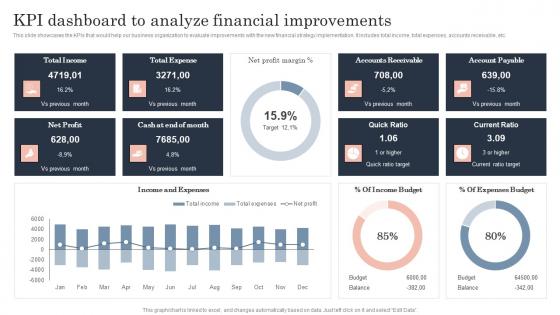
Kpi Dashboard To Analyze Financial Guide To Corporate Financial Growth Plan Designs Pdf
This slide showcases the KPIs that would help our business organization to evaluate improvements with the new financial strategy implementation. It includes total income, total expenses, accounts receivable, etc.Presenting this PowerPoint presentation, titled Kpi Dashboard To Analyze Financial Guide To Corporate Financial Growth Plan Designs Pdf, with topics curated by our researchers after extensive research. This editable presentation is available for immediate download and provides attractive features when used. Download now and captivate your audience. Presenting this Kpi Dashboard To Analyze Financial Guide To Corporate Financial Growth Plan Designs Pdf. Our researchers have carefully researched and created these slides with all aspects taken into consideration. This is a completely customizable Kpi Dashboard To Analyze Financial Guide To Corporate Financial Growth Plan Designs Pdf that is available for immediate downloading. Download now and make an impact on your audience. Highlight the attractive features available with our PPTs. This slide showcases the KPIs that would help our business organization to evaluate improvements with the new financial strategy implementation. It includes total income, total expenses, accounts receivable, etc.
Business Intelligence Dashboard Icon To Analyze Industry Trends Topics PDF
Persuade your audience using this Business Intelligence Dashboard Icon To Analyze Industry Trends Topics PDF. This PPT design covers three stages, thus making it a great tool to use. It also caters to a variety of topics including Business Intelligence Dashboard Icon, Analyze Industry Trends. Download this PPT design now to present a convincing pitch that not only emphasizes the topic but also showcases your presentation skills.
KPI Dashboard For Tracking Monthly Personal Comprehensive Smartphone Banking Introduction Pdf
This slide shows dashboard which can be used by individuals to track monthly expenses in order to get better understanding of hisorher finances. It includes metrics such as users spending, savings, debt, etc.Take your projects to the next level with our ultimate collection of KPI Dashboard For Tracking Monthly Personal Comprehensive Smartphone Banking Introduction Pdf. Slidegeeks has designed a range of layouts that are perfect for representing task or activity duration, keeping track of all your deadlines at a glance. Tailor these designs to your exact needs and give them a truly corporate look with your own brand colors they all make your projects stand out from the rest. This slide shows dashboard which can be used by individuals to track monthly expenses in order to get better understanding of hisorher finances. It includes metrics such as users spending, savings, debt, etc.
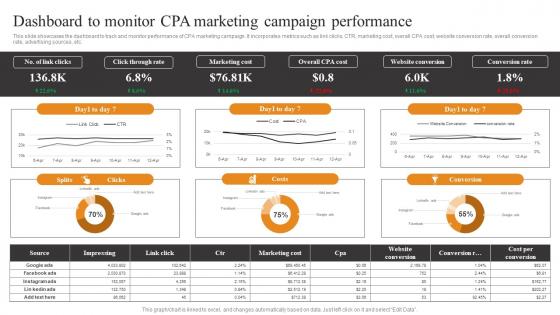
Dashboard To Monitor CPA Tactics To Optimize Corporate Performance Slides Pdf
This slide showcases the dashboard to track and monitor performance of CPA marketing campaign. It incorporates metrics such as link clicks, CTR, marketing cost, overall CPA cost, website conversion rate, overall conversion rate, advertising sources, etc. Present like a pro with Dashboard To Monitor CPA Tactics To Optimize Corporate Performance Slides Pdf Create beautiful presentations together with your team, using our easy to use presentation slides. Share your ideas in real time and make changes on the fly by downloading our templates. So whether you are in the office, on the go, or in a remote location, you can stay in sync with your team and present your ideas with confidence. With Slidegeeks presentation got a whole lot easier. Grab these presentations today. This slide showcases the dashboard to track and monitor performance of CPA marketing campaign. It incorporates metrics such as link clicks, CTR, marketing cost, overall CPA cost, website conversion rate, overall conversion rate, advertising sources, etc.
KPI Dashboard For Tracking Increasing Client Retention Through Efficient Formats Pdf
This slide covers the dashboard for analyzing customer loyalty with metrics such as NPS, loyal customer rate, premium users, CLV, customer churn, revenue churn, net retention, MRR growth, etc. The best PPT templates are a great way to save time, energy, and resources. Slidegeeks have 100 percent editable powerpoint slides making them incredibly versatile. With these quality presentation templates, you can create a captivating and memorable presentation by combining visually appealing slides and effectively communicating your message. Download KPI Dashboard For Tracking Increasing Client Retention Through Efficient Formats Pdf from Slidegeeks and deliver a wonderful presentation. This slide covers the dashboard for analyzing customer loyalty with metrics such as NPS, loyal customer rate, premium users, CLV, customer churn, revenue churn, net retention, MRR growth, etc.
KPI Dashboard For Tracking Major Promotional Analytics Future Trends Clipart Pdf
This slide covers the dashboard for analysing email marketing metrics such as overall open rate, click through rate, click to open ratio, unsubscribe rate, hard bounce rate, soft rate, monthly open rate, total monthly subscribers, etc. The best PPT templates are a great way to save time, energy, and resources. Slidegeeks have 100 percent editable powerpoint slides making them incredibly versatile. With these quality presentation templates, you can create a captivating and memorable presentation by combining visually appealing slides and effectively communicating your message. Download KPI Dashboard For Tracking Major Promotional Analytics Future Trends Clipart Pdf from Slidegeeks and deliver a wonderful presentation. This slide covers the dashboard for analysing email marketing metrics such as overall open rate, click through rate, click to open ratio, unsubscribe rate, hard bounce rate, soft rate, monthly open rate, total monthly subscribers, etc.
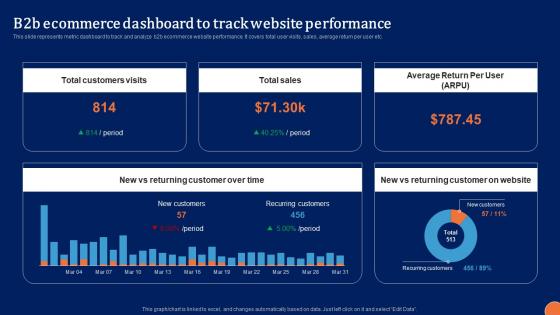
B2B Ecommerce Dashboard Digital Platform Administration For B2B Ecommerce Designs Pdf
This slide represents metric dashboard to track and analyze b2b ecommerce website performance. It covers total user visits, sales, average return per user etc. Want to ace your presentation in front of a live audience Our B2B Ecommerce Dashboard Digital Platform Administration For B2B Ecommerce Designs Pdf can help you do that by engaging all the users towards you. Slidegeeks experts have put their efforts and expertise into creating these impeccable powerpoint presentations so that you can communicate your ideas clearly. Moreover, all the templates are customizable, and easy to edit and downloadable. Use these for both personal and commercial use. This slide represents metric dashboard to track and analyze b2b ecommerce website performance. It covers total user visits, sales, average return per user etc.
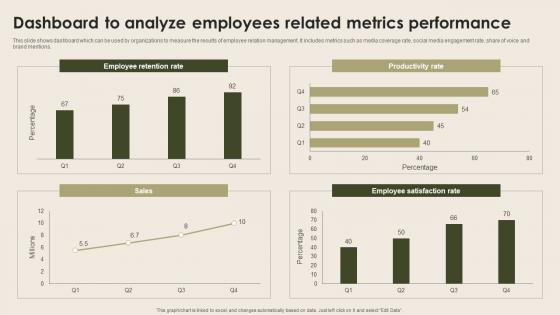
Dashboard To Analyze Employees Related Nurturing Positive Work Culture Sample Pdf
This slide shows dashboard which can be used by organizations to measure the results of employee relation management. It includes metrics such as media coverage rate, social media engagement rate, share of voice and brand mentions. Present like a pro with Dashboard To Analyze Employees Related Nurturing Positive Work Culture Sample Pdf Create beautiful presentations together with your team, using our easy-to-use presentation slides. Share your ideas in real-time and make changes on the fly by downloading our templates. So whether you are in the office, on the go, or in a remote location, you can stay in sync with your team and present your ideas with confidence. With Slidegeeks presentation got a whole lot easier. Grab these presentations today. This slide shows dashboard which can be used by organizations to measure the results of employee relation management. It includes metrics such as media coverage rate, social media engagement rate, share of voice and brand mentions.
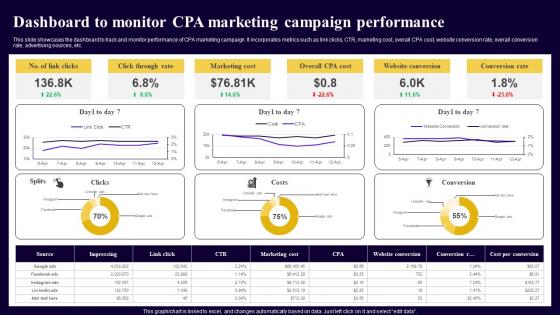
Dashboard To Monitor CPA Marketing Campaign Executing Cost Per Action Marketing Structure Pdf
This slide showcases the dashboard to track and monitor performance of CPA marketing campaign. It incorporates metrics such as link clicks, CTR, marketing cost, overall CPA cost, website conversion rate, overall conversion rate, advertising sources, etc. Present like a pro with Dashboard To Monitor CPA Marketing Campaign Executing Cost Per Action Marketing Structure Pdf Create beautiful presentations together with your team, using our easy-to-use presentation slides. Share your ideas in real-time and make changes on the fly by downloading our templates. So whether you are in the office, on the go, or in a remote location, you can stay in sync with your team and present your ideas with confidence. With Slidegeeks presentation got a whole lot easier. Grab these presentations today. This slide showcases the dashboard to track and monitor performance of CPA marketing campaign. It incorporates metrics such as link clicks, CTR, marketing cost, overall CPA cost, website conversion rate, overall conversion rate, advertising sources, etc.
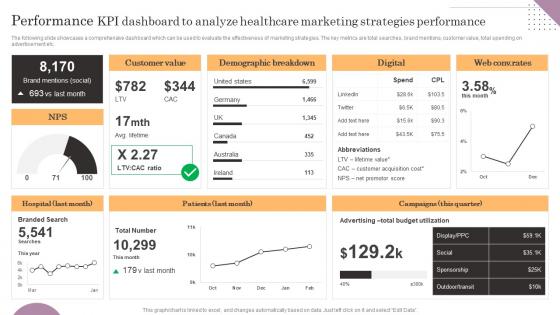
Performance KPI Dashboard To Analyze Healthcare Marketing General Management Brochure Pdf
The following slide showcases a comprehensive dashboard which can be used to evaluate the effectiveness of marketing strategies. The key metrics are total searches, brand mentions, customer value, total spending on advertisement etc. Find a pre-designed and impeccable Performance KPI Dashboard To Analyze Healthcare Marketing General Management Brochure Pdf. The templates can ace your presentation without additional effort. You can download these easy-to-edit presentation templates to make your presentation stand out from others. So, what are you waiting for Download the template from Slidegeeks today and give a unique touch to your presentation. The following slide showcases a comprehensive dashboard which can be used to evaluate the effectiveness of marketing strategies. The key metrics are total searches, brand mentions, customer value, total spending on advertisement etc.
Wireless Banking To Improve KPI Dashboard For Tracking Monthly Personal Fin SS V
This slide shows dashboard which can be used by individuals to track monthly expenses in order to get better understanding of his or her finances. It includes metrics such as users spending, savings, debt, etc. Slidegeeks is one of the best resources for PowerPoint templates. You can download easily and regulate Wireless Banking To Improve KPI Dashboard For Tracking Monthly Personal Fin SS V for your personal presentations from our wonderful collection. A few clicks is all it takes to discover and get the most relevant and appropriate templates. Use our Templates to add a unique zing and appeal to your presentation and meetings. All the slides are easy to edit and you can use them even for advertisement purposes. This slide shows dashboard which can be used by individuals to track monthly expenses in order to get better understanding of his or her finances. It includes metrics such as users spending, savings, debt, etc.
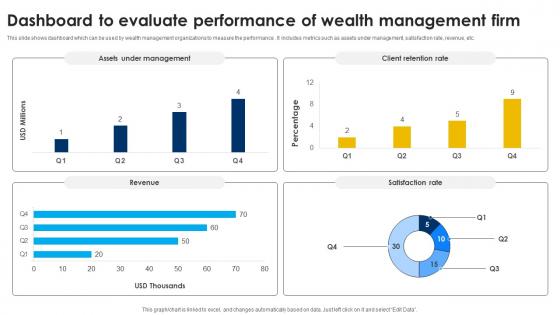
Dashboard To Evaluate Performance Strategic Wealth Management And Financial Fin SS V
This slide shows dashboard which can be used by wealth management organizations to measure the performance . It includes metrics such as assets under management, satisfaction rate, revenue, etc. Present like a pro with Dashboard To Evaluate Performance Strategic Wealth Management And Financial Fin SS V. Create beautiful presentations together with your team, using our easy-to-use presentation slides. Share your ideas in real-time and make changes on the fly by downloading our templates. So whether youre in the office, on the go, or in a remote location, you can stay in sync with your team and present your ideas with confidence. With Slidegeeks presentation got a whole lot easier. Grab these presentations today. This slide shows dashboard which can be used by wealth management organizations to measure the performance . It includes metrics such as assets under management, satisfaction rate, revenue, etc.
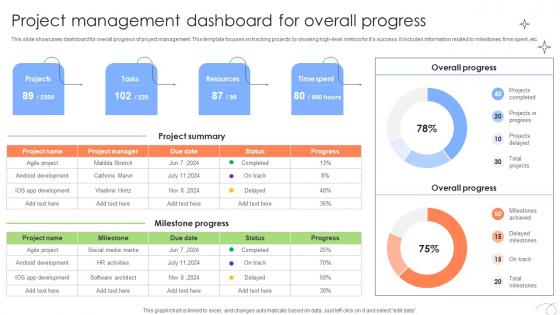
Executing And Monitoring Project Management Dashboard For Overall PM SS V
This slide showcases dashboard for overall progress of project management. This template focuses on tracking projects by showing high-level metrics for it is success. It includes information related to milestones, time spent, etc. Coming up with a presentation necessitates that the majority of the effort goes into the content and the message you intend to convey. The visuals of a PowerPoint presentation can only be effective if it supplements and supports the story that is being told. Keeping this in mind our experts created Executing And Monitoring Project Management Dashboard For Overall PM SS V to reduce the time that goes into designing the presentation. This way, you can concentrate on the message while our designers take care of providing you with the right template for the situation. This slide showcases dashboard for overall progress of project management. This template focuses on tracking projects by showing high-level metrics for it is success. It includes information related to milestones, time spent, etc.
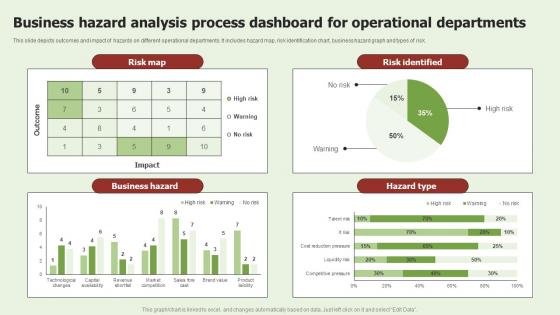
Business Hazard Analysis Process Dashboard For Operational Departments Microsoft Pdf
This slide depicts outcomes and impact of hazards on different operational departments. It includes hazard map, risk identification chart, business hazard graph and types of risk. Pitch your topic with ease and precision using this Business Hazard Analysis Process Dashboard For Operational Departments Microsoft Pdf. This layout presents information on Risk Map, Business Hazard, Hazard Type. It is also available for immediate download and adjustment. So, changes can be made in the color, design, graphics or any other component to create a unique layout. This slide depicts outcomes and impact of hazards on different operational departments. It includes hazard map, risk identification chart, business hazard graph and types of risk.
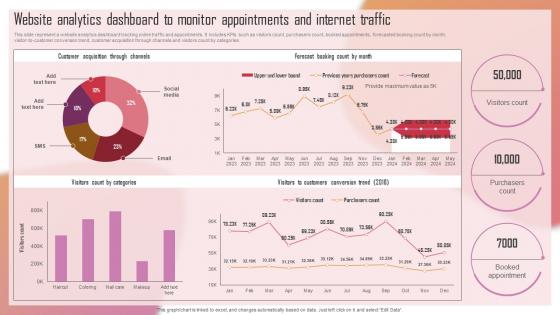
Customizing The Salon Experience Website Analytics Dashboard To Monitor Appointments Strategy SS V
This slide represent a website analytics dashboard tracking online traffic and appointments. It includes KPIs such as visitors count, purchasers count, booked appointments, forecasted booking count by month, visitor-to-customer conversion trend, customer acquisition through channels and visitors count by categories. Retrieve professionally designed Customizing The Salon Experience Website Analytics Dashboard To Monitor Appointments Strategy SS V to effectively convey your message and captivate your listeners. Save time by selecting pre-made slideshows that are appropriate for various topics, from business to educational purposes. These themes come in many different styles, from creative to corporate, and all of them are easily adjustable and can be edited quickly. Access them as PowerPoint templates or as Google Slides themes. You do not have to go on a hunt for the perfect presentation because Slidegeeks got you covered from everywhere. This slide represent a website analytics dashboard tracking online traffic and appointments. It includes KPIs such as visitors count, purchasers count, booked appointments, forecasted booking count by month, visitor-to-customer conversion trend, customer acquisition through channels and visitors count by categories.
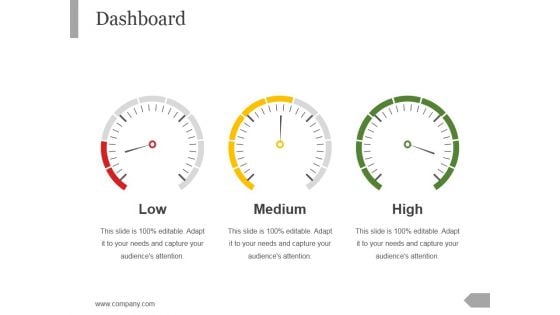
Dashboard Ppt PowerPoint Presentation Layouts Good
This is a dashboard ppt powerpoint presentation layouts good. This is a three stage process. The stages in this process are low, medium, high.
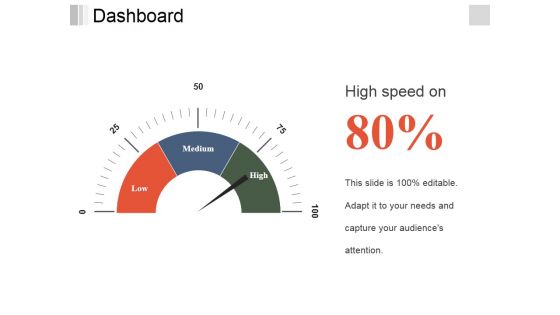
Dashboard Ppt PowerPoint Presentation Layouts Vector
This is a dashboard ppt powerpoint presentation layouts vector. This is a three stage process. The stages in this process are low, medium, high.
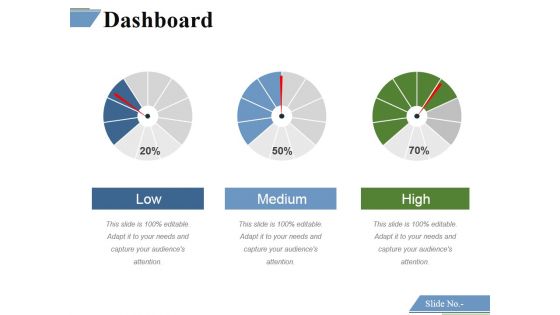
Dashboard Ppt PowerPoint Presentation Portfolio Themes
This is a dashboard ppt powerpoint presentation portfolio themes. This is a three stage process. The stages in this process are low, medium, high.

Dashboard Ppt PowerPoint Presentation Ideas Example Topics
This is a dashboard ppt powerpoint presentation ideas example topics. This is a three stage process. The stages in this process are low, medium, high.
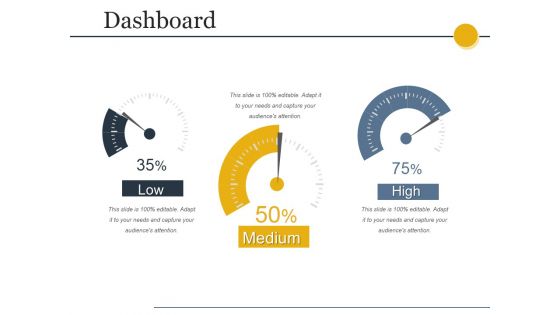
Dashboard Ppt PowerPoint Presentation Professional Smartart
This is a dashboard ppt powerpoint presentation professional smartart. This is a three stage process. The stages in this process are low, medium, high.
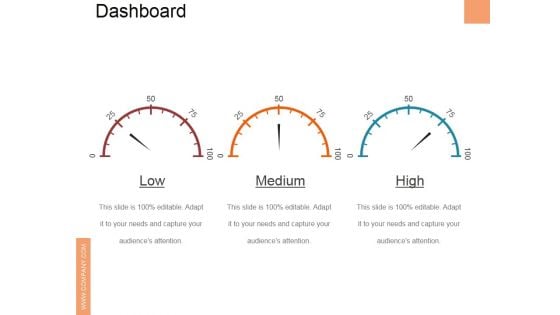
Dashboard Ppt PowerPoint Presentation Gallery Graphics
This is a dashboard ppt powerpoint presentation gallery graphics. This is a three stage process. The stages in this process are low, medium, high.
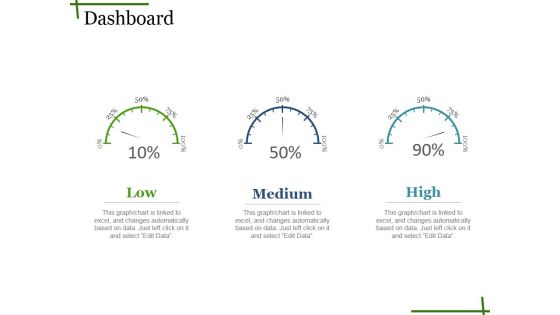
Dashboard Ppt PowerPoint Presentation Layouts Introduction
This is a dashboard ppt powerpoint presentation layouts introduction. This is a three stage process. The stages in this process are low, medium, high.
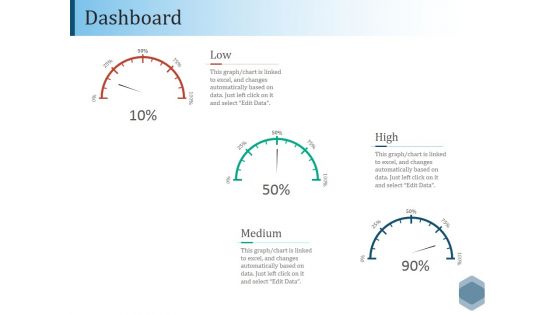
Dashboard Ppt PowerPoint Presentation Ideas Vector
This is a dashboard ppt powerpoint presentation ideas vector. This is a three stage process. The stages in this process are medium, high, low.
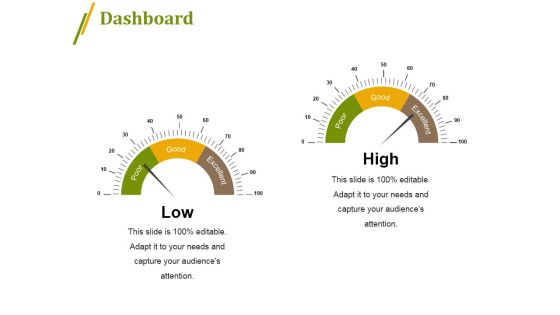
Dashboard Ppt PowerPoint Presentation Styles Vector
This is a dashboard ppt powerpoint presentation styles vector. This is a two stage process. The stages in this process are low, high, poor, good, excellent.
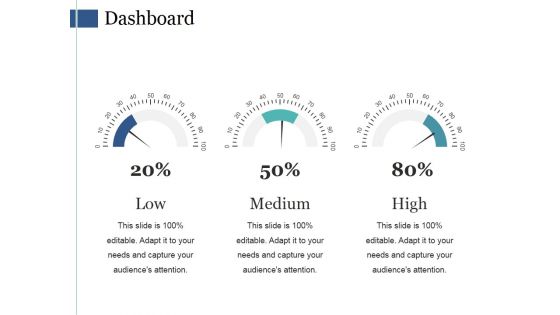
Dashboard Ppt PowerPoint Presentation Outline Graphics Tutorials
This is a dashboard ppt powerpoint presentation outline graphics tutorials. This is a three stage process. The stages in this process are low, medium, high.
Dashboard Ppt PowerPoint Presentation Portfolio Icon
This is a dashboard ppt powerpoint presentation portfolio icon. This is a three stage process. The stages in this process are low, medium, high.
Dashboard Ppt PowerPoint Presentation Ideas Icon
This is a dashboard ppt powerpoint presentation ideas icon. This is a one stage process. The stages in this process are low, medium, high.
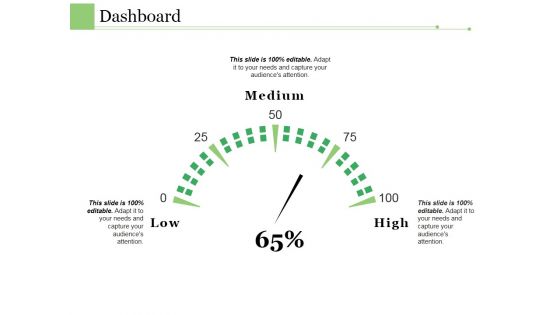
Dashboard Ppt PowerPoint Presentation Ideas Influencers
This is a dashboard ppt powerpoint presentation ideas influencers. This is a three stage process. The stages in this process are low, medium, high.
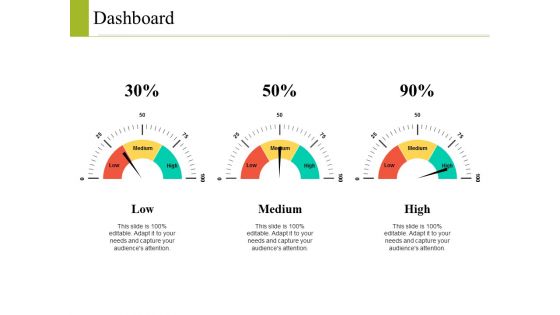
Dashboard Ppt PowerPoint Presentation Gallery Slide
This is a dashboard ppt powerpoint presentation gallery slide. This is a three stage process. The stages in this process are low, medium, high.
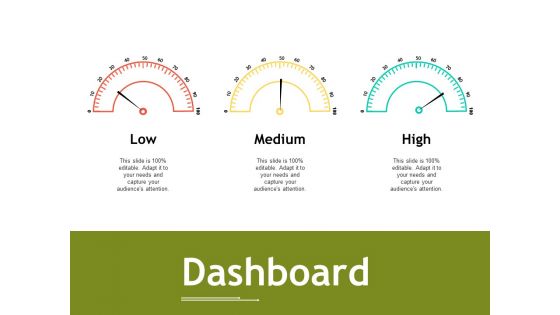
Dashboard Ppt PowerPoint Presentation Inspiration Guidelines
This is a dashboard ppt powerpoint presentation inspiration guidelines. This is a three stage process. The stages in this process are low, medium, high.
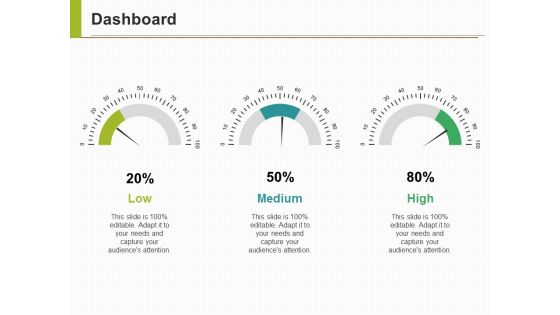
Dashboard Ppt PowerPoint Presentation File Example
This is a dashboard ppt powerpoint presentation file example. This is a three stage process. The stages in this process are low, medium, high.
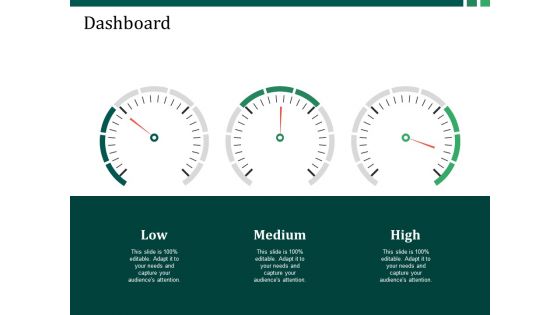
Dashboard Ppt PowerPoint Presentation Styles Sample
This is a dashboard ppt powerpoint presentation styles sample. This is a three stage process. The stages in this process are low, medium, high.
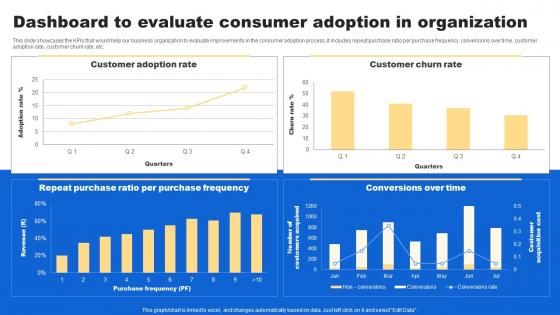
Dashboard To Evaluate Consumer Analyzing Customer Buying Behavior Enhance Conversion Inspiration Pdf
This slide showcases the KPIs that would help our business organization to evaluate improvements in the consumer adoption process. It includes repeat purchase ratio per purchase frequency, conversions over time, customer adoption rate, customer churn rate, etc. Whether you have daily or monthly meetings, a brilliant presentation is necessary. Dashboard To Evaluate Consumer Analyzing Customer Buying Behavior Enhance Conversion Inspiration Pdf can be your best option for delivering a presentation. Represent everything in detail using Dashboard To Evaluate Consumer Analyzing Customer Buying Behavior Enhance Conversion Inspiration Pdf and make yourself stand out in meetings. The template is versatile and follows a structure that will cater to your requirements. All the templates prepared by Slidegeeks are easy to download and edit. Our research experts have taken care of the corporate themes as well. So, give it a try and see the results. This slide showcases the KPIs that would help our business organization to evaluate improvements in the consumer adoption process. It includes repeat purchase ratio per purchase frequency, conversions over time, customer adoption rate, customer churn rate, etc.
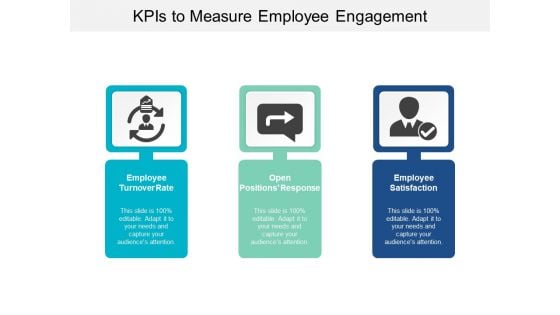
Kpis To Measure Employee Engagement Ppt Powerpoint Presentation Pictures Gridlines
This is a kpis to measure employee engagement ppt powerpoint presentation pictures gridlines. This is a three stage process. The stages in this process are dashboard, kpi, metrics.
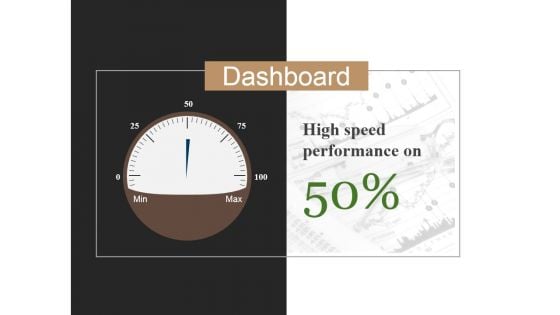
Dashboard Ppt PowerPoint Presentation File Slide
This is a dashboard ppt powerpoint presentation file slide. This is a one stage process. The stages in this process are high speed performance on, business, marketing, meter, measure.
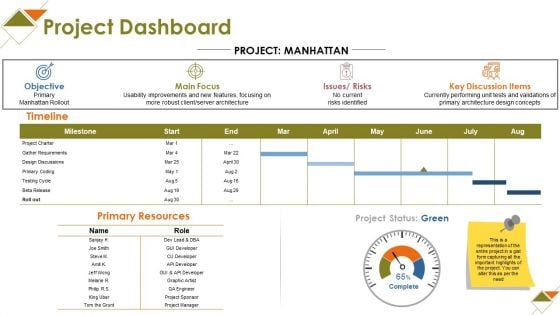
Project Dashboard Ppt PowerPoint Presentation Ideas Layout
This is a project dashboard ppt powerpoint presentation ideas layout. This is a three stage process. The stages in this process are main focus, business, objective, issues risks, key discussion items.
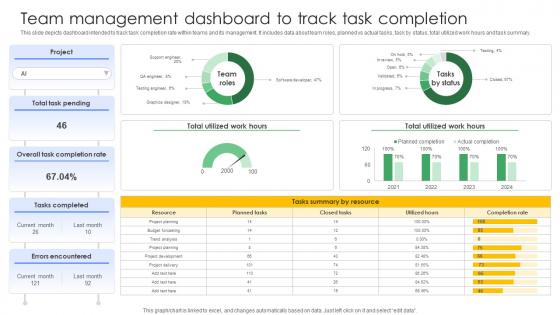
Driving Results Designing A Team Management Dashboard To Track Task Completion
This slide depicts dashboard intended to track task completion rate within teams and its management. It includes data about team roles, planned vs actual tasks, task by status, total utilized work hours and task summary. This modern and well-arranged Driving Results Designing A Team Management Dashboard To Track Task Completion provides lots of creative possibilities. It is very simple to customize and edit with the Powerpoint Software. Just drag and drop your pictures into the shapes. All facets of this template can be edited with Powerpoint, no extra software is necessary. Add your own material, put your images in the places assigned for them, adjust the colors, and then you can show your slides to the world, with an animated slide included. This slide depicts dashboard intended to track task completion rate within teams and its management. It includes data about team roles, planned vs actual tasks, task by status, total utilized work hours and task summary.

Application Of Artificial Intelligence In Data Analysis Data Analytics SS V
This slide outlines applications of AI in data analysis aimed at helping businesses save time and effort. It covers application areas such as generate code or debug errors, explain analysis, create reports and automated data entry .Slidegeeks is one of the best resources for PowerPoint templates. You can download easily and regulate Application Of Artificial Intelligence In Data Analysis Data Analytics SS V for your personal presentations from our wonderful collection. A few clicks is all it takes to discover and get the most relevant and appropriate templates. Use our Templates to add a unique zing and appeal to your presentation and meetings. All the slides are easy to edit and you can use them even for advertisement purposes. This slide outlines applications of AI in data analysis aimed at helping businesses save time and effort. It covers application areas such as generate code or debug errors, explain analysis, create reports and automated data entry .
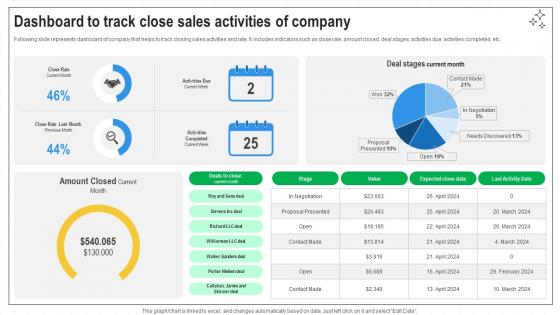
Closing Techniques To Seal Dashboard To Track Close Sales Activities Of Company SA SS V
Following slide represents dashboard of company that helps to track closing sales activities and rate. It includes indicators such as close rate, amount closed, deal stages, activities due, activities completed, etc. If you are looking for a format to display your unique thoughts, then the professionally designed Closing Techniques To Seal Dashboard To Track Close Sales Activities Of Company SA SS V is the one for you. You can use it as a Google Slides template or a PowerPoint template. Incorporate impressive visuals, symbols, images, and other charts. Modify or reorganize the text boxes as you desire. Experiment with shade schemes and font pairings. Alter, share or cooperate with other people on your work. Download Closing Techniques To Seal Dashboard To Track Close Sales Activities Of Company SA SS V and find out how to give a successful presentation. Present a perfect display to your team and make your presentation unforgettable. Following slide represents dashboard of company that helps to track closing sales activities and rate. It includes indicators such as close rate, amount closed, deal stages, activities due, activities completed, etc.
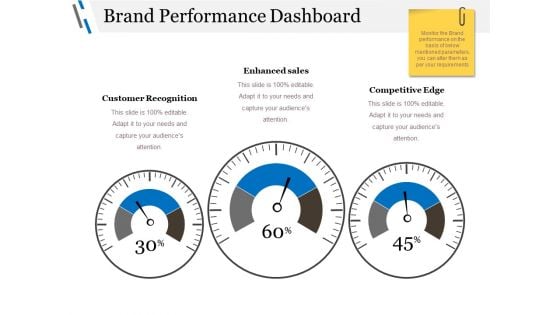
Brand Performance Dashboard Ppt PowerPoint Presentation Professional Grid
This is a brand performance dashboard ppt powerpoint presentation professional grid. This is a three stage process. The stages in this process are customer recognition, enhanced sales, competitive edge, dashboard, business.
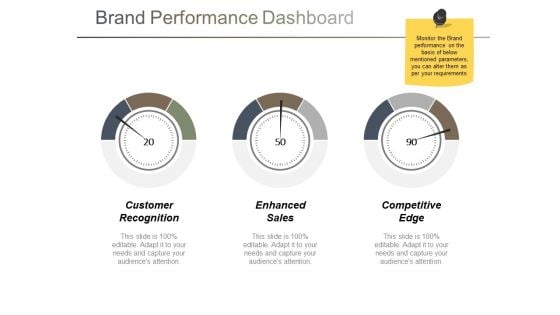
Brand Performance Dashboard Ppt PowerPoint Presentation Layouts Summary
This is a brand performance dashboard ppt powerpoint presentation layouts summary. This is a three stage process. The stages in this process are customer recognition, enhanced sales, competitive edge, dashboard, business.
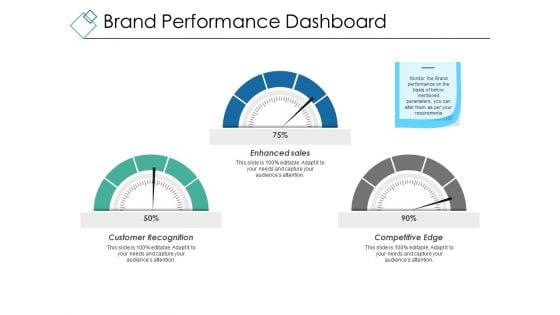
Brand Performance Dashboard Ppt PowerPoint Presentation Show Graphic Tips
This is a brand performance dashboard ppt powerpoint presentation show graphic tips. This is a three stage process. The stages in this process are customer recognition, enhanced sales, competitive edge, dashboard, business, percentage.
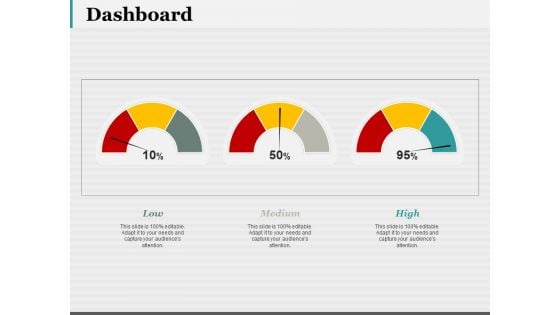
Dashboard 7 QC Tools Ppt PowerPoint Presentation Summary Professional
This is a dashboard 7 qc tools ppt powerpoint presentation summary professional. This is a three stage process. The stages in this process are dashboard, measuring, analysis, business, strategy.
Business Dashboard With Profit Levels Icon Ppt PowerPoint Presentation Visual Aids Professional PDF
Presenting business dashboard with profit levels icon ppt powerpoint presentation visual aids professional pdf to dispense important information. This template comprises three stages. It also presents valuable insights into the topics including low, medium, high. This is a completely customizable PowerPoint theme that can be put to use immediately. So, download it and address the topic impactfully.
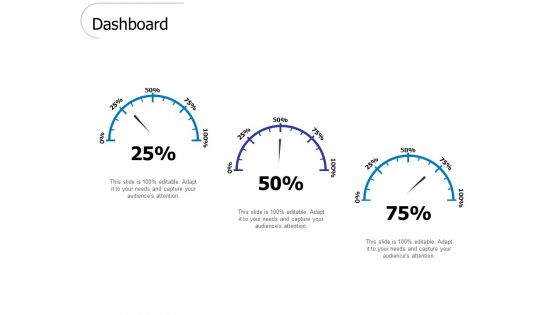
Dashboard Ppt PowerPoint Presentation Professional Clipart Images
Presenting this set of slides with name dashboard ppt powerpoint presentation professional clipart images. This is a three stage process. The stages in this process are dashboard. This is a completely editable PowerPoint presentation and is available for immediate download. Download now and impress your audience.
Incident Management Process Safety Dashboard Icons PDF
This is a incident management process safety dashboard icons pdf template with various stages. Focus and dispense information on three stages using this creative set, that comes with editable features. It contains large content boxes to add your information on topic like dashboard. You can also showcase facts, figures, and other relevant content using this PPT layout. Grab it now.
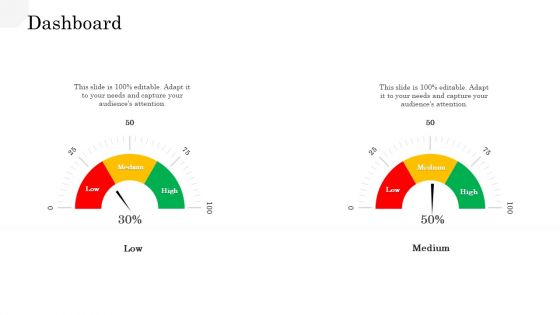
API Management Market Dashboard Ideas PDF
Presenting api management market dashboard ideas pdf to provide visual cues and insights. Share and navigate important information on two stages that need your due attention. This template can be used to pitch topics like dashboard. In addtion, this PPT design contains high resolution images, graphics, etc, that are easily editable and available for immediate download.


 Continue with Email

 Home
Home


