Snapshot
Dashboard For Tracking Green Financing Activities Themes PDF
This slide presents a finance dashboard to track the progress of sustainability activities based on finance allocations. The key performing indicators are overall progress, energy usage by month, budget allocation and application etc. Showcasing this set of slides titled Dashboard For Tracking Green Financing Activities Themes PDF. The topics addressed in these templates are Activities, Application, Dashboard. All the content presented in this PPT design is completely editable. Download it and make adjustments in color, background, font etc. as per your unique business setting.
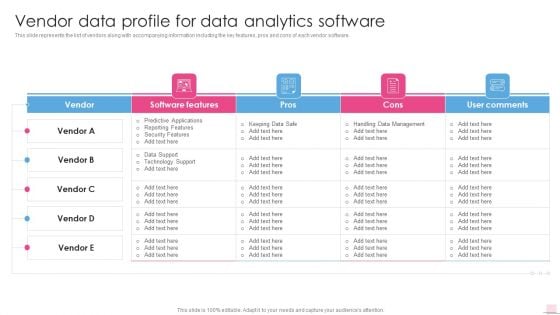
Vendor Data Profile For Data Analytics Software Business Analysis Modification Toolkit Topics PDF
This is a Vendor Data Profile For Data Analytics Software Business Analysis Modification Toolkit Topics PDF template with various stages. Focus and dispense information on four stages using this creative set, that comes with editable features. It contains large content boxes to add your information on topics like Predictive Applications, Reporting Features, Security Features. You can also showcase facts, figures, and other relevant content using this PPT layout. Grab it now.
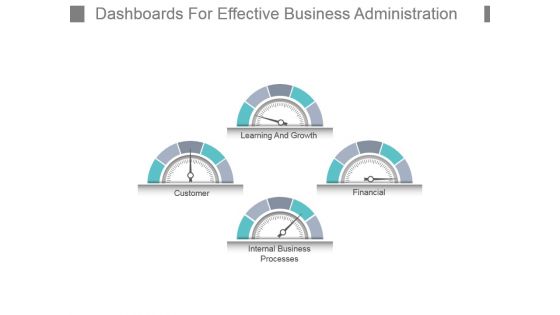
Dashboards For Effective Business Administration Powerpoint Slide Influencers
This is a dashboards for effective business administration powerpoint slide influencers. This is a four stage process. The stages in this process are customer, internal business processes, financial, learning and growth.
Project Tracking And Evaluation Dashboard Portrait PDF
This slide illustrates graphical representation and facts and figures relating to project management data. It includes budget by employee, overdue tasks, workload charts etc. Pitch your topic with ease and precision using this Project Tracking And Evaluation Dashboard Portrait PDF. This layout presents information on Employee Budget, Target, Design, Development. It is also available for immediate download and adjustment. So, changes can be made in the color, design, graphics or any other component to create a unique layout.
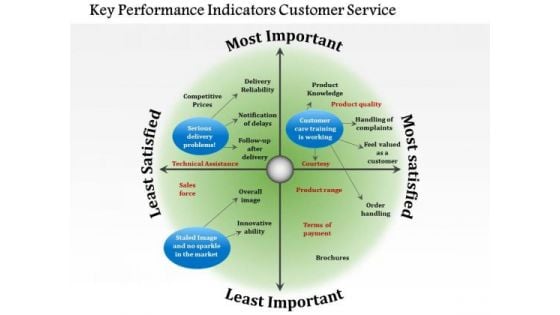
Business Diagram Key Performance Indicators Customer Service PowerPoint Ppt Presentation
Our above diagram provides framework of key performance indicators for customer service. It contains circular diagram in four segments depicting concepts of delivery problems, customer care training. Download this diagram to make professional presentations on customer service.
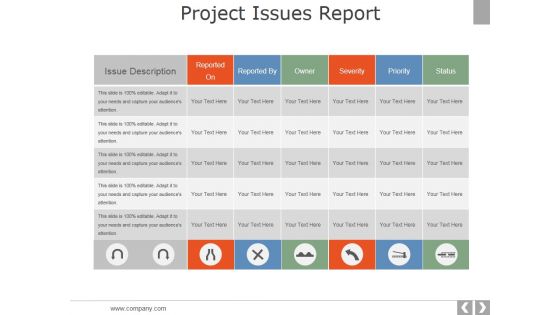
Project Issues Report Ppt PowerPoint Presentation Slide
This is a project issues report ppt powerpoint presentation slide. This is a six stage process. The stages in this process are issue description, reported on, reported by, owner, severity.
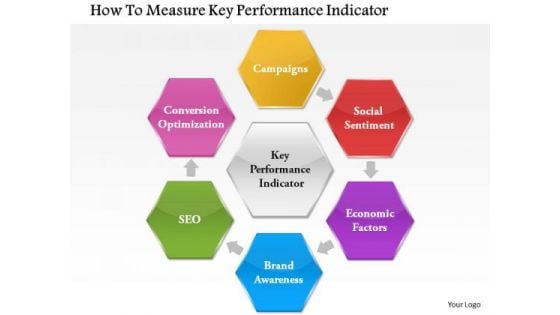
Business Framework How To Measure Key Performance Indicator PowerPoint Presentation
This Power Point diagram slide has been crafted with graphic of flower petal diagram. This PPT slide contains the concept of measuring the key performance and indicate it. Use this PPT slide for your management related presentation.
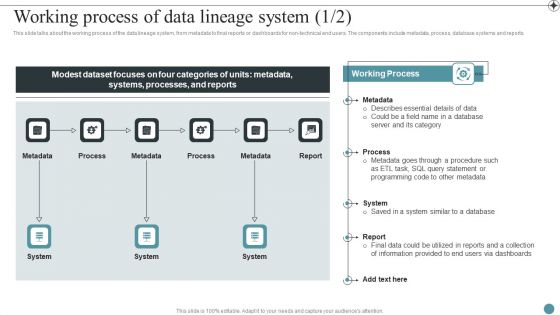
Working Process Of Data Lineage System Deploying Data Lineage IT Summary PDF
This slide talks about the working process of the data lineage system, from metadata to final reports or dashboards for non-technical end users. The components include metadata, process, database systems and reports.Coming up with a presentation necessitates that the majority of the effort goes into the content and the message you intend to convey. The visuals of a PowerPoint presentation can only be effective if it supplements and supports the story that is being told. Keeping this in mind our experts created Working Process Of Data Lineage System Deploying Data Lineage IT Summary PDF to reduce the time that goes into designing the presentation. This way, you can concentrate on the message while our designers take care of providing you with the right template for the situation.
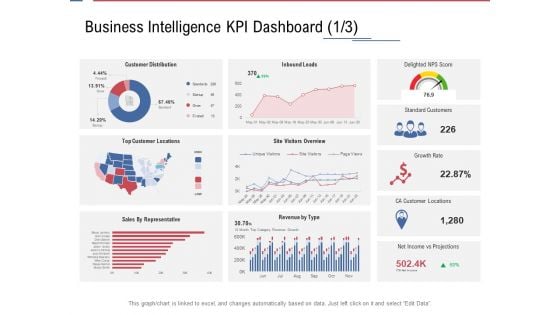
Data Assimilation Business Intelligence KPI Dashboard Score Ppt Graphics PDF
Deliver and pitch your topic in the best possible manner with this data assimilation business intelligence kpi dashboard score ppt graphics pdf. Use them to share invaluable insights on revenue, projections, locations, growth, sales and impress your audience. This template can be altered and modified as per your expectations. So, grab it now.
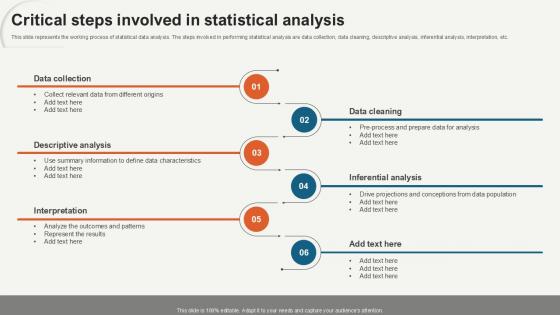
Critical Steps Involved In Statistical Data Analytics For Informed Decision Ppt Presentation
This slide represents the working process of statistical data analysis. The steps involved in performing statistical analysis are data collection, data cleaning, descriptive analysis, inferential analysis, interpretation, etc. Slidegeeks is here to make your presentations a breeze with Critical Steps Involved In Statistical Data Analytics For Informed Decision Ppt Presentation With our easy-to-use and customizable templates, you can focus on delivering your ideas rather than worrying about formatting. With a variety of designs to choose from, you are sure to find one that suits your needs. And with animations and unique photos, illustrations, and fonts, you can make your presentation pop. So whether you are giving a sales pitch or presenting to the board, make sure to check out Slidegeeks first This slide represents the working process of statistical data analysis. The steps involved in performing statistical analysis are data collection, data cleaning, descriptive analysis, inferential analysis, interpretation, etc.
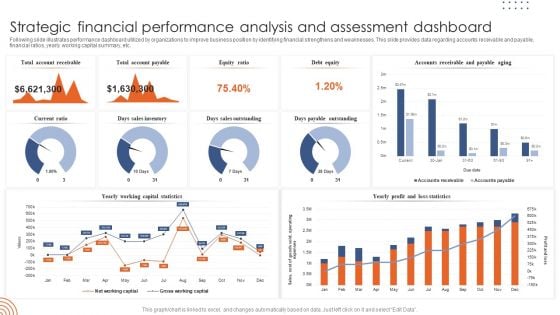
Strategic Financial Performance Analysis And Assessment Dashboard Template PDF
Following slide illustrates performance dashboard utilized by organizations to improve business position by identifying financial strengthens and weaknesses. This slide provides data regarding accounts receivable and payable, financial ratios, yearly working capital summary, etc. Showcasing this set of slides titled Strategic Financial Performance Analysis And Assessment Dashboard Template PDF. The topics addressed in these templates are Strategic Financial Performance, Analysis Assessment Dashboard. All the content presented in this PPT design is completely editable. Download it and make adjustments in color, background, font etc. as per your unique business setting.
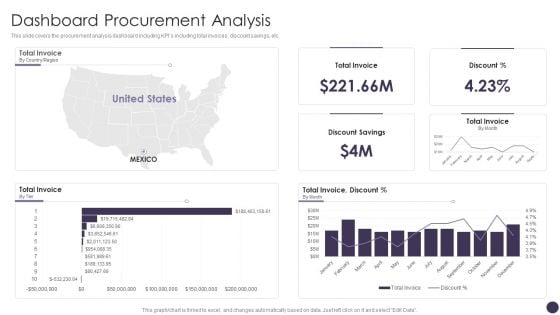
Dashboard Procurement Analysis Formats PDF
This slide covers the procurement analysis dashboard including KPIs including total invoices, discount savings, etc. Deliver an awe inspiring pitch with this creative Dashboard Procurement Analysis Formats PDF bundle. Topics like Total Invoice, Discount Savings, Invoice Discount can be discussed with this completely editable template. It is available for immediate download depending on the needs and requirements of the user.
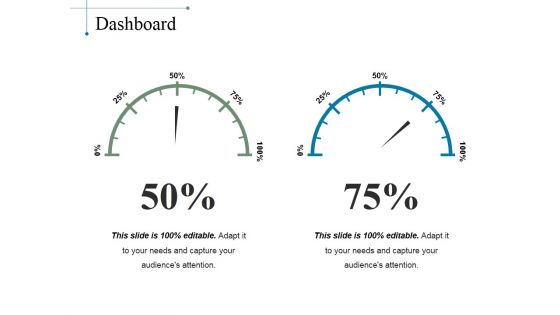
Dashboard Ppt PowerPoint Presentation Infographics Images
This is a dashboard ppt powerpoint presentation infographics images. This is a two stage process. The stages in this process are low, medium, high, dashboard, measurement.
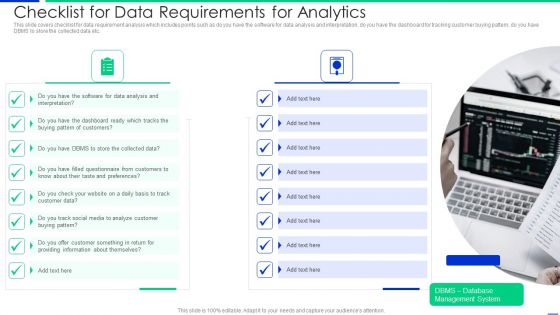
Checklist For Data Requirements For Analytics Information PDF
This slide covers checklist for data requirement analysis which includes points such as do you have the software for data analysis and interpretation, do you have the dashboard for tracking customer buying pattern, do you have DBMS to store the collected data etc. Presenting checklist for data requirements for analytics information pdf to dispense important information. This template comprises two stages. It also presents valuable insights into the topics including analysis, customers, dashboard. This is a completely customizable PowerPoint theme that can be put to use immediately. So, download it and address the topic impactfully.
HR Recruitment Dashboard Kpis With Active Pipeline Ppt Icon Slide Portrait PDF
This slide showcases the recruitment dashboard metrics to know monthly hiring rate. It include KPIs like sources, decline reasons, active pipeline, recruitment funnel. Showcasing this set of slides titled HR Recruitment Dashboard Kpis With Active Pipeline Ppt Icon Slide Portrait PDF. The topics addressed in these templates are Recruitment Funnel, Monthly Metrics, Application Sources. All the content presented in this PPT design is completely editable. Download it and make adjustments in color, background, font etc. as per your unique business setting.
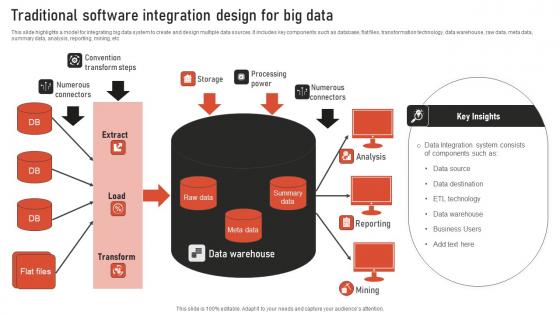
Traditional Software Integration Design For Big Data Microsoft Pdf
This slide highlights a model for integrating big data system to create and design multiple data sources. It includes key components such as database, flat files, transformation technology, data warehouse, raw data, meta data, summary data, analysis, reporting, mining, etc Showcasing this set of slides titled Traditional Software Integration Design For Big Data Microsoft Pdf. The topics addressed in these templates are Data Warehouse, Data Source, ETL Technology. All the content presented in this PPT design is completely editable. Download it and make adjustments in color, background, font etc. as per your unique business setting. This slide highlights a model for integrating big data system to create and design multiple data sources. It includes key components such as database, flat files, transformation technology, data warehouse, raw data, meta data, summary data, analysis, reporting, mining, etc
Database Expansion And Optimization Tracking Dashboard For Data Repository Ppt Gallery Example
This slide indicates the tracking dashboard for data repository. It includes information regarding sever health, query response time, average number of active connections, load and time spent in database. Deliver an awe inspiring pitch with this creative database expansion and optimization tracking dashboard for data repository ppt gallery example bundle. Topics like tracking dashboard for data repository can be discussed with this completely editable template. It is available for immediate download depending on the needs and requirements of the user.
Tactical Plan For Upgrading DBMS Tracking Dashboard For Data Repository Designs PDF
This slide indicates the tracking dashboard for data repository. It includes information regarding sever health, query response time, average number of active connections, load and time spent in database. Deliver an awe inspiring pitch with this creative tactical plan for upgrading dbms tracking dashboard for data repository designs pdf bundle. Topics like tracking dashboard for data repository can be discussed with this completely editable template. It is available for immediate download depending on the needs and requirements of the user.
Horizontal Scaling Technique For Information Tracking Dashboard For Data Repository Icons PDF
This slide indicates the tracking dashboard for data repository. It includes information regarding sever health, query response time, average number of active connections, load and time spent in database. Deliver an awe inspiring pitch with this creative Horizontal Scaling Technique For Information Tracking Dashboard For Data Repository Icons PDF bundle. Topics like Tracking Dashboard For Data Repository can be discussed with this completely editable template. It is available for immediate download depending on the needs and requirements of the user.
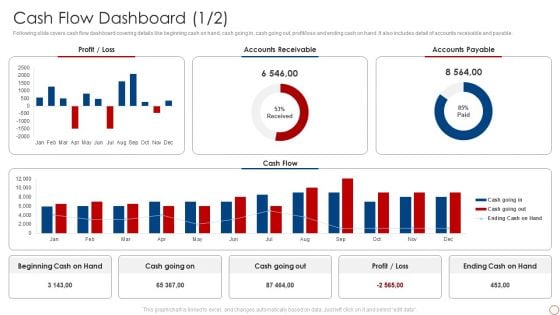
Kpis For Evaluating Business Sustainability Cash Flow Dashboard Background PDF
Following slide covers cash flow dashboard covering details like beginning cash on hand, cash going in, cash going out, profit or loss and ending cash on hand. It also includes detail of accounts receivable and payable. Deliver an awe inspiring pitch with this creative Kpis For Evaluating Business Sustainability Cash Flow Dashboard Background PDF bundle. Topics like Accounts Receivable, Accounts Payable, Cash Flow can be discussed with this completely editable template. It is available for immediate download depending on the needs and requirements of the user.
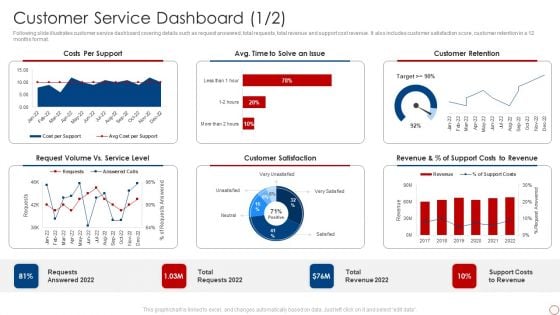
Kpis For Evaluating Business Sustainability Customer Service Dashboard Designs PDF
Following slide illustrates customer service dashboard covering details such as request answered, total requests, total revenue and support cost revenue. It also includes customer satisfaction score, customer retention in a 12 months format. Deliver and pitch your topic in the best possible manner with this Kpis For Evaluating Business Sustainability Customer Service Dashboard Designs PDF. Use them to share invaluable insights on Costs Per Support, Customer Retention, Customer Satisfaction and impress your audience. This template can be altered and modified as per your expectations. So, grab it now.
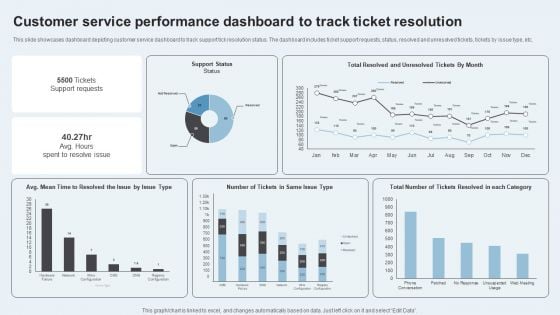
Action Plan To Enhance Client Service Customer Service Performance Dashboard Track Formats PDF
This slide showcases dashboard depicting customer service dashboard to track support tick resolution status. The dashboard includes ticket support requests, status, resolved and unresolved tickets, tickets by issue type, etc. Coming up with a presentation necessitates that the majority of the effort goes into the content and the message you intend to convey. The visuals of a PowerPoint presentation can only be effective if it supplements and supports the story that is being told. Keeping this in mind our experts created Action Plan To Enhance Client Service Customer Service Performance Dashboard Track Formats PDF to reduce the time that goes into designing the presentation. This way, you can concentrate on the message while our designers take care of providing you with the right template for the situation.
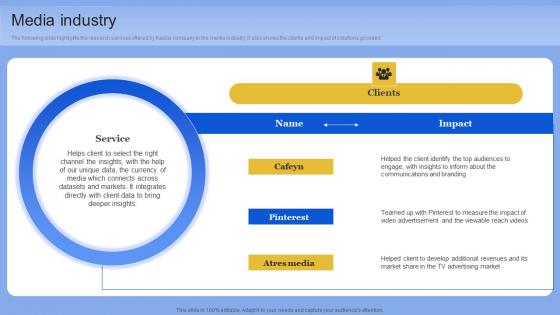
Media Industry Data Analytics Company Outline Structure PDF
The following slide highlights the research services offered by Kantar company to the media industry. It also shows the clients and impact of solutions provided. The Media Industry Data Analytics Company Outline Structure PDF is a compilation of the most recent design trends as a series of slides. It is suitable for any subject or industry presentation, containing attractive visuals and photo spots for businesses to clearly express their messages. This template contains a variety of slides for the user to input data, such as structures to contrast two elements, bullet points, and slides for written information. Slidegeeks is prepared to create an impression. The following slide highlights the research services offered by Kantar company to the media industry. It also shows the clients and impact of solutions provided
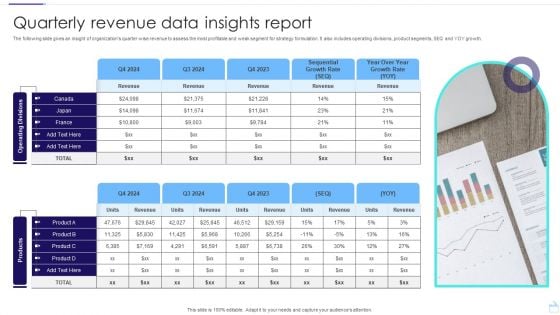
Quarterly Revenue Data Insights Report Template PDF
The following slide gives an insight of organizations quarter wise revenue to assess the most profitable and weak segment for strategy formulation. It also includes operating divisions, product segments, SEQ and YOY growth. Showcasing this set of slides titled Quarterly Revenue Data Insights Report Template PDF. The topics addressed in these templates are Operating, Divisions products, Insights Report. All the content presented in this PPT design is completely editable. Download it and make adjustments in color, background, font etc. as per your unique business setting.
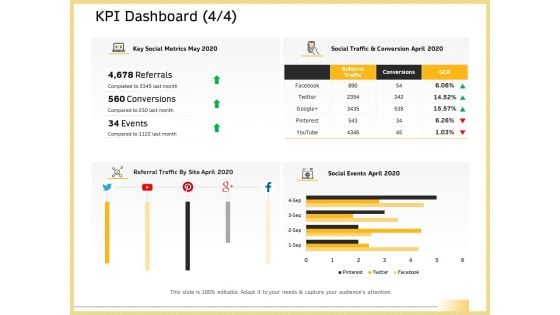
B2B Marketing KPI Dashboard Social Events Ppt Ideas Structure PDF
Deliver and pitch your topic in the best possible manner with this b2b marketing kpi dashboard social events ppt ideas structure pdf. Use them to share invaluable insights on key social metrics may 2020, social traffic and conversion april 2020, referrals, conversions, events and impress your audience. This template can be altered and modified as per your expectations. So, grab it now.
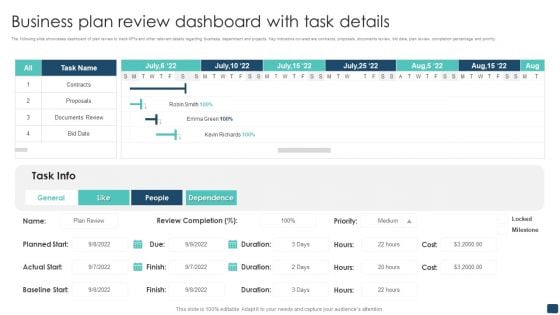
Business Plan Review Dashboard With Task Details Sample PDF
The following slide showcases dashboard of plan review to track KPIs and other relevant details regarding business, department and projects. Key indicators covered are contracts, proposals, documents review, bid date, plan review, completion percentage and priority. Pitch your topic with ease and precision using this Business Plan Review Dashboard With Task Details Sample PDF. This layout presents information on Business Plan Review, Dashboard With Task Details. It is also available for immediate download and adjustment. So, changes can be made in the color, design, graphics or any other component to create a unique layout.
Contact Center First Contact Resolution Metrics Guidelines Pdf
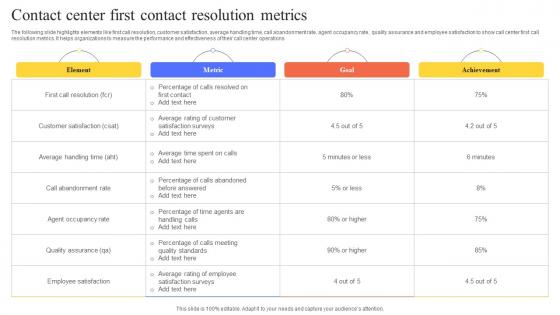
The following slide highlights elements like first call resolution, customer satisfaction, average handling time, call abandonment rate, agent occupancy rate, quality assurance and employee satisfaction to show call center first call resolution metrics. It helps organizations to measure the performance and effectiveness of their call center operations.Pitch your topic with ease and precision using this Contact Center First Contact Resolution Metrics Guidelines Pdf This layout presents information on Call Abandonment, Quality Assurance, Employee Satisfaction It is also available for immediate download and adjustment. So, changes can be made in the color, design, graphics or any other component to create a unique layout. The following slide highlights elements like first call resolution, customer satisfaction, average handling time, call abandonment rate, agent occupancy rate, quality assurance and employee satisfaction to show call center first call resolution metrics. It helps organizations to measure the performance and effectiveness of their call center operations
Business Intelligence Dashboards Presentation Slides
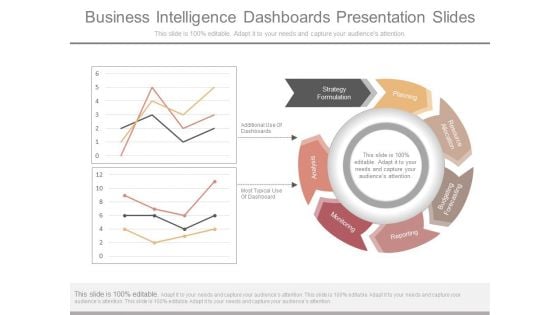
This is a business intelligence dashboards presentation slides. This is a seven stage process. The stages in this process are strategy formulation, planning, resource allocation, budgeting forecasting, reporting, monitoring, analysis, additional use of dashboards, most typical use of dashboard.
Dashboard Showing Data Charts For Statistics Analysis Ppt PowerPoint Presentation Infographic Template Grid PDF
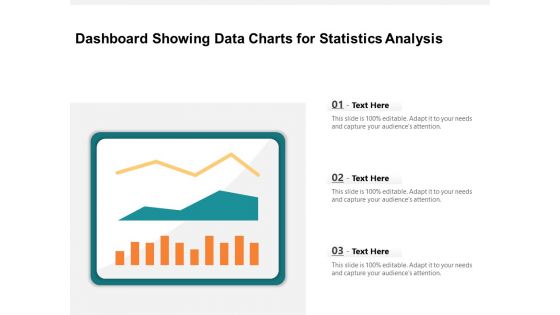
Pitch your topic with ease and precision using this dashboard showing data charts for statistics analysis ppt powerpoint presentation infographic template grid pdf. This layout presents information on dashboard showing data charts for statistics analysis. It is also available for immediate download and adjustment. So, changes can be made in the color, design, graphics or any other component to create a unique layout.

Kaizen Report Form Ppt PowerPoint Presentation Visuals
This is a kaizen report form ppt powerpoint presentation visuals. This is a four stage process. The stages in this process are kaizen report form, problem description, team members, solution description, implementation date.
Data And Analytics Ppt PowerPoint Presentation Icon Layouts Cpb
This is a data and analytics ppt powerpoint presentation icon layouts cpb. This is a five stage process. The stages in this process are data and analytics.
Dashboard For Consumer Partition In Marketing Research Microsoft PDF
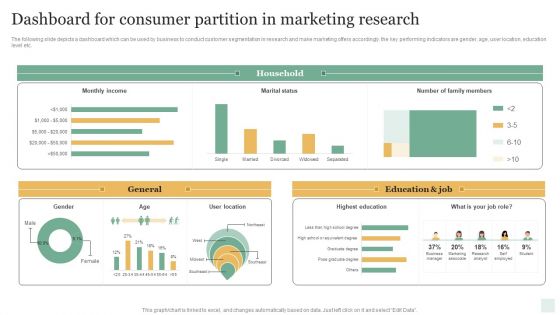
The following slide depicts a dashboard which can be used by business to conduct customer segmentation in research and make marketing offers accordingly. the key performing indicators are gender, age, user location, education level etc. Showcasing this set of slides titled Dashboard For Consumer Partition In Marketing Research Microsoft PDF. The topics addressed in these templates are General, Education And Job, Household. All the content presented in this PPT design is completely editable. Download it and make adjustments in color, background, font etc. as per your unique business setting.
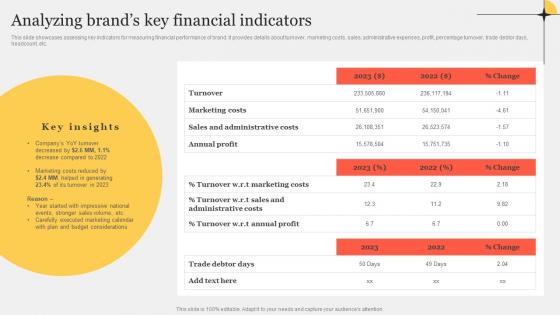
Analyzing Brands Key Financial Indicators Improving Customer Interaction Through Microsoft Pdf
This slide showcases assessing key indicators for measuring financial performance of brand. It provides details about turnover, marketing costs, sales, administrative expenses, profit, percentage turnover, trade debtor days, headcount, etc.Find highly impressive Analyzing Brands Key Financial Indicators Improving Customer Interaction Through Microsoft Pdf on Slidegeeks to deliver a meaningful presentation. You can save an ample amount of time using these presentation templates. No need to worry to prepare everything from scratch because Slidegeeks experts have already done a huge research and work for you. You need to download Analyzing Brands Key Financial Indicators Improving Customer Interaction Through Microsoft Pdf for your upcoming presentation. All the presentation templates are 100Precent editable and you can change the color and personalize the content accordingly. Download now. This slide showcases assessing key indicators for measuring financial performance of brand. It provides details about turnover, marketing costs, sales, administrative expenses, profit, percentage turnover, trade debtor days, headcount, etc.
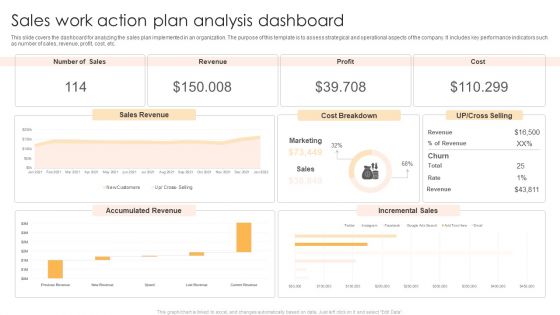
Sales Work Action Plan Analysis Dashboard Brochure PDF
This slide covers the dashboard for analyzing the sales plan implemented in an organization. The purpose of this template is to assess strategical and operational aspects of the company. It includes key performance indicators such as number of sales, revenue, profit, cost, etc. Showcasing this set of slides titled Sales Work Action Plan Analysis Dashboard Brochure PDF. The topics addressed in these templates are Sales Revenue, Cost Breakdown, Accumulated Revenue. All the content presented in this PPT design is completely editable. Download it and make adjustments in color, background, font etc. as per your unique business setting.
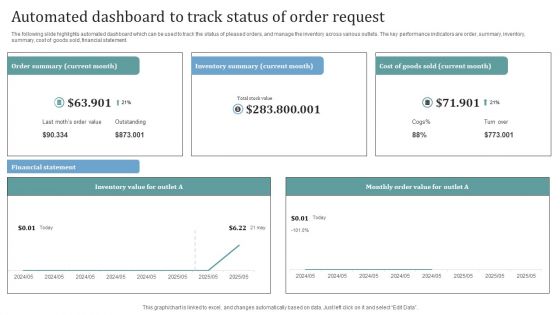
Automated Dashboard To Track Status Of Order Request Themes PDF
The following slide highlights automated dashboard which can be used to track the status of pleased orders, and manage the inventory across various outlets. The key performance indicators are order, summary, inventory, summary, cost of goods sold, financial statement. Showcasing this set of slides titled Automated Dashboard To Track Status Of Order Request Themes PDF. The topics addressed in these templates are Inventory Value, Inventory Summary, Cost. All the content presented in this PPT design is completely editable. Download it and make adjustments in color, background, font etc. as per your unique business setting.
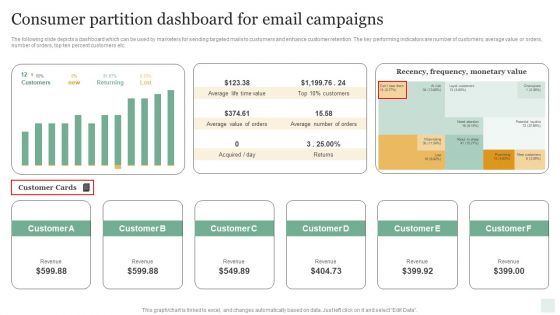
Consumer Partition Dashboard For Email Campaigns Infographics PDF
The following slide depicts a dashboard which can be used by marketers for sending targeted mails to customers and enhance customer retention. The key performing indicators are number of customers, average value or orders, number of orders, top ten percent customers etc. Showcasing this set of slides titled Consumer Partition Dashboard For Email Campaigns Infographics PDF. The topics addressed in these templates are Average Life Time Value, Average Value Of Orders, Returns, Average Number Of Orders. All the content presented in this PPT design is completely editable. Download it and make adjustments in color, background, font etc. as per your unique business setting.
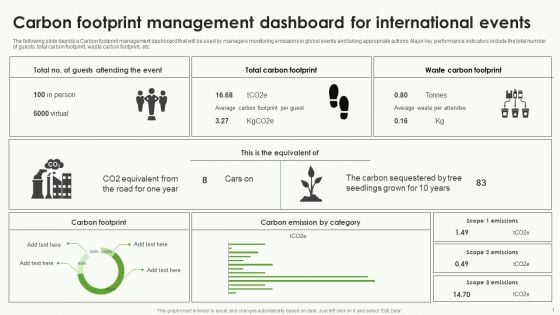
Carbon Footprint Management Dashboard For International Events Brochure PDF
The following slide depicts a Carbon footprint management dashboard that will be used by managers monitoring emissions in global events and taking appropriate actions. Major key performance indicators include the total number of guests, total carbon footprint, waste carbon footprint, etc. Showcasing this set of slides titled Carbon Footprint Management Dashboard For International Events Brochure PDF. The topics addressed in these templates are Carbon Footprint, Carbon Emission By Category, Waste Carbon Footprint. All the content presented in this PPT design is completely editable. Download it and make adjustments in color, background, font etc. as per your unique business setting.
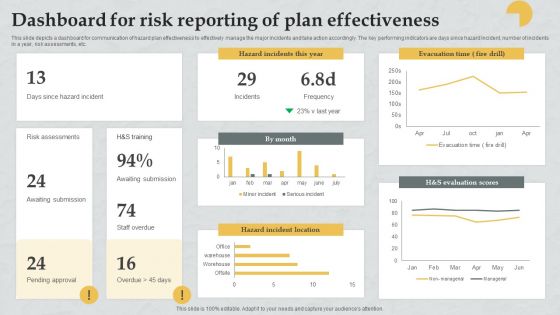
Dashboard For Risk Reporting Of Plan Effectiveness Download PDF
This slide depicts a dashboard for communication of hazard plan effectiveness to effectively manage the major incidents and take action accordingly. The key performing indicators are days since hazard incident, number of incidents in a year, risk assessments, etc. Showcasing this set of slides titled Dashboard For Risk Reporting Of Plan Effectiveness Download PDF. The topics addressed in these templates are Risk Assessments, Awaiting Submission, Awaiting Submission. All the content presented in this PPT design is completely editable. Download it and make adjustments in color, background, font etc. as per your unique business setting.
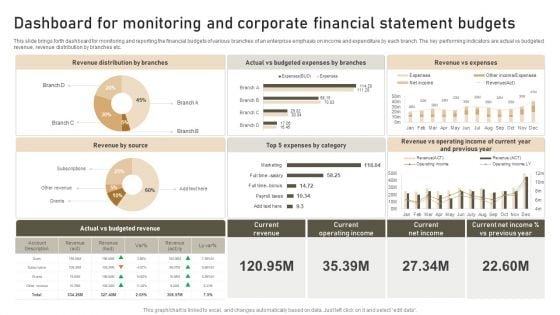
Dashboard For Monitoring And Corporate Financial Statement Budgets Template PDF
This slide brings forth dashboard for monitoring and reporting the financial budgets of various branches of an enterprise emphasis on income and expenditure by each branch. The key performing indicators are actual vs budgeted revenue, revenue distribution by branches etc. Showcasing this set of slides titled Dashboard For Monitoring And Corporate Financial Statement Budgets Template PDF. The topics addressed in these templates are Revenue Distribution, Revenue Source, Revenue Expenses. All the content presented in this PPT design is completely editable. Download it and make adjustments in color, background, font etc. as per your unique business setting.
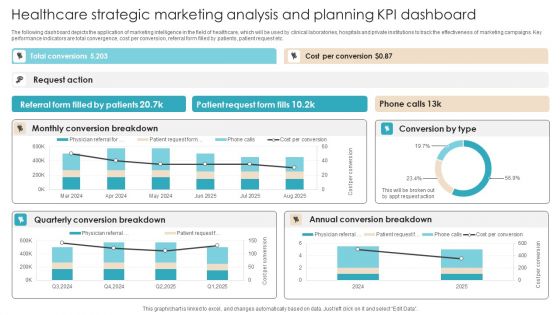
Healthcare Strategic Marketing Analysis And Planning Kpi Dashboard Elements PDF
The following dashboard depicts the application of marketing intelligence in the field of healthcare, which will be used by clinical laboratories, hospitals and private institutions to track the effectiveness of marketing campaigns. Key performance indicators are total convergence, cost per conversion, referral form filled by patients, patient request etc. Showcasing this set of slides titled Healthcare Strategic Marketing Analysis And Planning Kpi Dashboard Elements PDF. The topics addressed in these templates are Quarterly Conversion Breakdown, Annual Conversion Breakdown, Patient Request. All the content presented in this PPT design is completely editable. Download it and make adjustments in color, background, font etc. as per your unique business setting.
Business Diagram Metrics For Performance Measurement Presentation Template
This diagram slide has been designed with graphic of matrix. You may use this matrix for performance management. Download this diagram to make interactive presentations.
Circular Performance Measurement Metrics PowerPoint Templates
Communicate with your group through this slide of circles. It will facilitate understanding of your views. This diagram can be used to display performance measurement in business presentations.
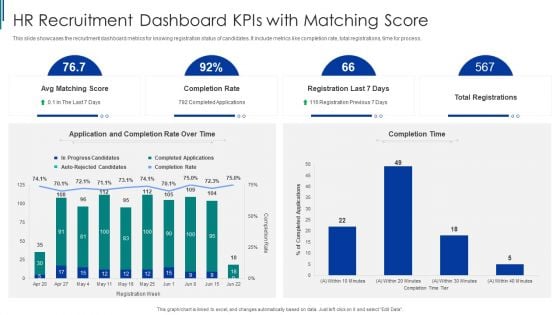
HR Recruitment Dashboard Kpis With Matching Score Ppt Layouts Example PDF
This slide showcases the recruitment dashboard metrics for knowing registration status of candidates. It include metrics like completion rate, total registrations, time for process. Showcasing this set of slides titled HR Recruitment Dashboard Kpis With Matching Score Ppt Layouts Example PDF. The topics addressed in these templates are Completion Rate, Application And Completion, HR Recruitment. All the content presented in this PPT design is completely editable. Download it and make adjustments in color, background, font etc. as per your unique business setting.
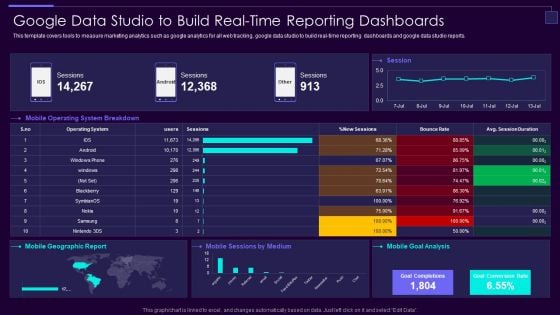
Social Media Brand Promotion Instructions Playbook Google Data Studio To Build Real Time Formats PDF
This template covers tools to measure marketing analytics such as google analytics for all web tracking, google data studio to build real-time reporting dashboards and google data studio reports.Deliver and pitch your topic in the best possible manner with this Social Media Brand Promotion Instructions Playbook Google Data Studio To Build Real Time Formats PDF Use them to share invaluable insights on Data Studio, Build Real Time, Reporting Dashboards and impress your audience. This template can be altered and modified as per your expectations. So, grab it now.
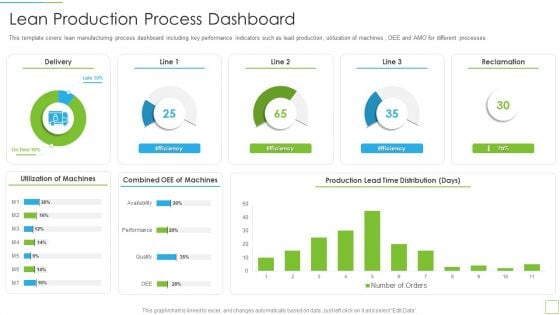
Hoshin Kanri Pitch Deck Lean Production Process Dashboard Guidelines PDF
This template covers lean manufacturing process dashboard including key performance indicators such as lead production, utilization of machines , OEE and AMO for different processes Deliver and pitch your topic in the best possible manner with this hoshin kanri pitch deck lean production process dashboard guidelines pdf Use them to share invaluable insights on utilization of machines, combined oee of machines, production lead time distribution and impress your audience. This template can be altered and modified as per your expectations. So, grab it now.
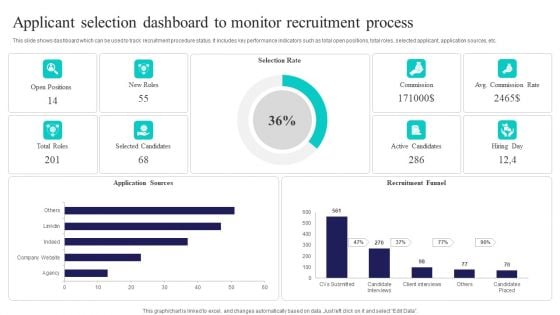
Applicant Selection Dashboard To Monitor Recruitment Process Sample PDF
This slide shows dashboard which can be used to track recruitment procedure status. It includes key performance indicators such as total open positions, total roles, selected applicant, application sources, etc. Pitch your topic with ease and precision using this Applicant Selection Dashboard To Monitor Recruitment Process Sample PDF. This layout presents information on Selection Rate, Recruitment Funnel, Application Sources. It is also available for immediate download and adjustment. So, changes can be made in the color, design, graphics or any other component to create a unique layout.
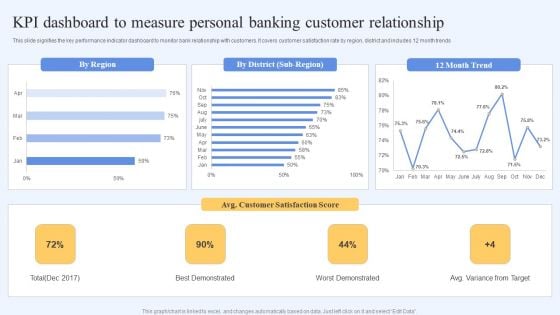
Kpi Dashboard To Measure Personal Banking Customer Relationship Themes PDF
This slide signifies the key performance indicator dashboard to monitor bank relationship with customers. It covers customer satisfaction rate by region, district and includes 12 month trends. Pitch your topic with ease and precision using this Kpi Dashboard To Measure Personal Banking Customer Relationship Themes PDF. This layout presents information on Customer Satisfaction, Best Demonstrated, Worst Demonstrated. It is also available for immediate download and adjustment. So, changes can be made in the color, design, graphics or any other component to create a unique layout.
Executive Dashboards For Tracking Financial Health Of Enterprise Diagrams PDF
This slide represents the CEO dashboard to track the financial health of an organization. It includes key performance indicators such as revenue, expenses, activity ratio, gross profit margin, EBIT etc. Pitch your topic with ease and precision using this Executive Dashboards For Tracking Financial Health Of Enterprise Diagrams PDF. This layout presents information on Revenue, Expense, Activity Ratio. It is also available for immediate download and adjustment. So, changes can be made in the color, design, graphics or any other component to create a unique layout.
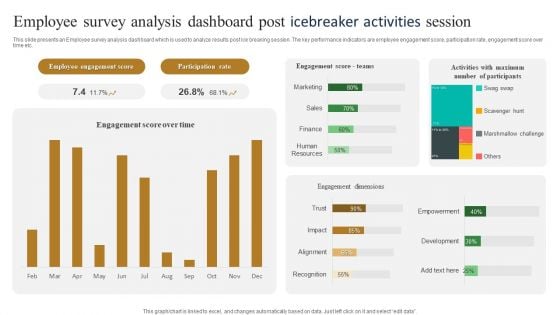
Employee Survey Analysis Dashboard Post Icebreaker Activities Session Slides PDF
This slide presents an Employee survey analysis dashboard which is used to analyze results post ice breaking session. The key performance indicators are employee engagement score, participation rate, engagement score over time etc. Pitch your topic with ease and precision using this Employee Survey Analysis Dashboard Post Icebreaker Activities Session Slides PDF. This layout presents information on Participation Rate, Employee Engagement Score. It is also available for immediate download and adjustment. So, changes can be made in the color, design, graphics or any other component to create a unique layout.
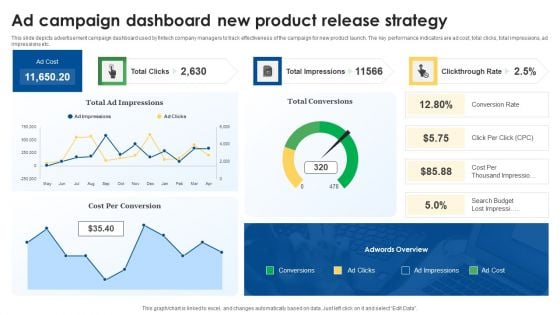
Ad Campaign Dashboard New Product Release Strategy Guidelines PDF
This slide depicts advertisement campaign dashboard used by fintech company managers to track effectiveness of the campaign for new product launch. The key performance indicators are ad cost, total clicks, total impressions, ad impressions etc. Pitch your topic with ease and precision using this Ad Campaign Dashboard New Product Release Strategy Guidelines PDF. This layout presents information on Impressions, Conversion, Strategy. It is also available for immediate download and adjustment. So, changes can be made in the color, design, graphics or any other component to create a unique layout.
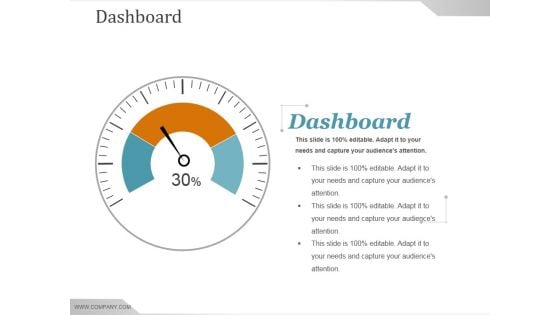
Dashboard Ppt PowerPoint Presentation Inspiration Examples
This is a dashboard ppt powerpoint presentation inspiration examples. This is a one stage process. The stages in this process are business, strategy, marketing, analysis, dashboard, measuring.
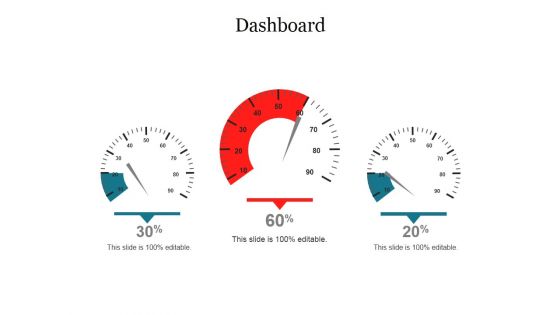
Dashboard Ppt PowerPoint Presentation Show Themes
This is a dashboard ppt powerpoint presentation show themes. This is a three stage process. The stages in this process are dashboard, management, planning, marketing, business, strategy.
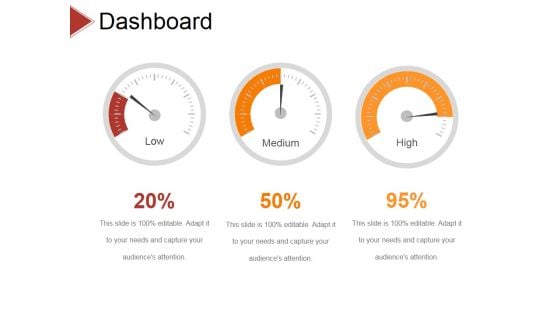
Dashboard Ppt PowerPoint Presentation Styles Graphics Design
This is a dashboard ppt powerpoint presentation styles graphics design. This is a three stage process. The stages in this process are business, strategy, analysis, pretention, finance, dashboard.
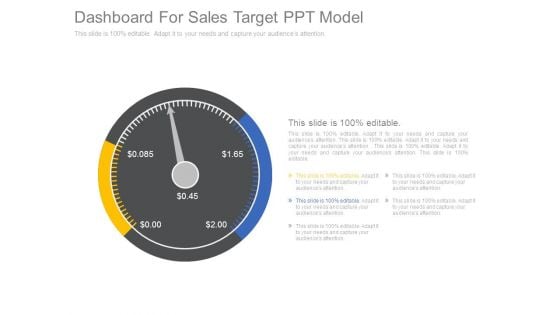
Dashboard For Sales Target Ppt Model
This is a dashboard for sales target ppt model. This is a one stage process. The stages in this process are dashboard, business, marketing, measure.
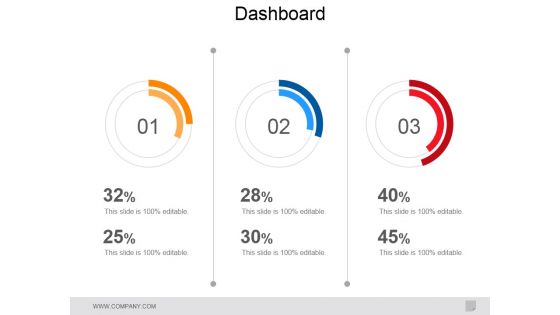
Dashboard Ppt PowerPoint Presentation Infographic Template Mockup
This is a dashboard ppt powerpoint presentation infographic template mockup. This is a three stage process. The stages in this process are dashboard, business, finance, marketing, management.
Dashboard Ppt PowerPoint Presentation Infographics Icon
This is a dashboard ppt powerpoint presentation infographics icon. This is a two stage process. The stages in this process are low, medium, dashboard, planning, business.
Data Quality Auditing And Threats Reporting Process Ppt Icon Picture PDF
This slide covers auditing process of data quality and reporting risk detected. It includes framework depicting checkpoints needed to audit data quality for data warehouse and business intelligence projects. Presenting Data Quality Auditing And Threats Reporting Process Ppt Icon Picture PDF to dispense important information. This template comprises one stages. It also presents valuable insights into the topics including External Data, Customer Data, Legacy Data. This is a completely customizable PowerPoint theme that can be put to use immediately. So, download it and address the topic impactfully.
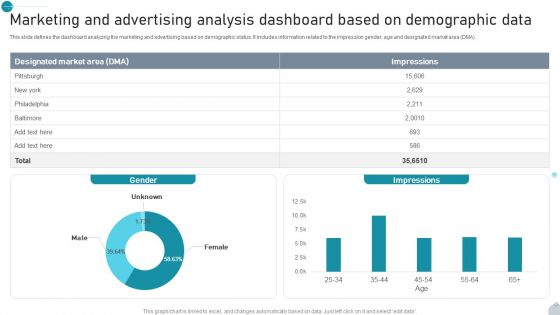
Marketing And Advertising Analysis Dashboard Based On Demographic Data Demonstration PDF
This slide defines the dashboard analyzing the marketing and advertising based on demographic status. It includes information related to the impression gender, age and designated market area DMA. Showcasing this set of slides titled Marketing And Advertising Analysis Dashboard Based On Demographic Data Demonstration PDF. The topics addressed in these templates are Gender, Impressions, Demographic Data All the content presented in this PPT design is completely editable. Download it and make adjustments in color, background, font etc. as per your unique business setting.
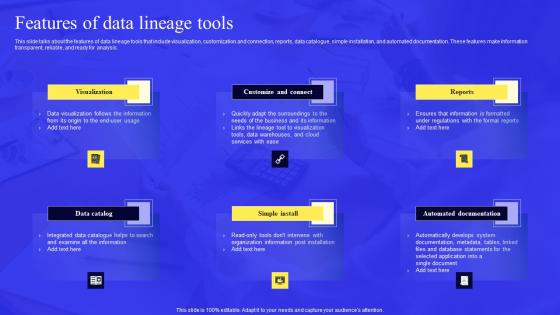
Business Process Data Lineage Features Of Data Lineage Tools Structure Pdf
This slide talks about the features of data lineage tools that include visualization, customization and connection, reports, data catalogue, simple installation, and automated documentation. These features make information transparent, reliable, and ready for analysis. The best PPT templates are a great way to save time, energy, and resources. Slidegeeks have 100 percent editable powerpoint slides making them incredibly versatile. With these quality presentation templates, you can create a captivating and memorable presentation by combining visually appealing slides and effectively communicating your message. Download Business Process Data Lineage Features Of Data Lineage Tools Structure Pdf from Slidegeeks and deliver a wonderful presentation. This slide talks about the features of data lineage tools that include visualization, customization and connection, reports, data catalogue, simple installation, and automated documentation. These features make information transparent, reliable, and ready for analysis.
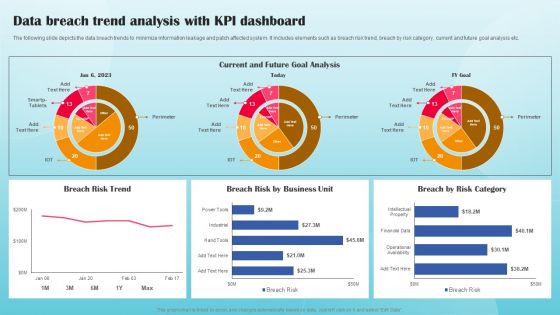
Data Breach Trend Analysis With KPI Dashboard Ppt PowerPoint Presentation File Portfolio PDF
The following slide depicts the data breach trends to minimize information leakage and patch affected system. It includes elements such as breach risk trend, breach by risk category, current and future goal analysis etc. This modern and well arranged Data Breach Trend Analysis With KPI Dashboard Ppt PowerPoint Presentation File Portfolio PDF provides lots of creative possibilities. It is very simple to customize and edit with the Powerpoint Software. Just drag and drop your pictures into the shapes. All facets of this template can be edited with Powerpoint no extra software is necessary. Add your own material, put your images in the places assigned for them, adjust the colors, and then you can show your slides to the world, with an animated slide included.


 Continue with Email

 Home
Home


