Snapshot
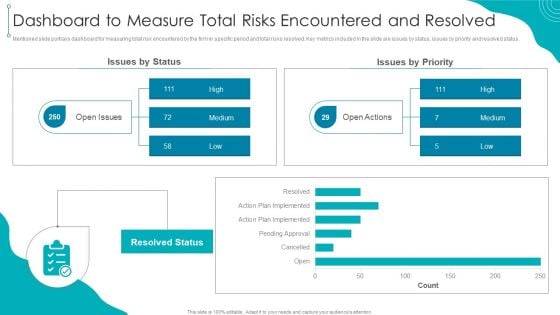
Dashboard To Measure Total Risks Encountered And Resolved Download PDF
Mentioned slide portrays dashboard for measuring total risk encountered by the firm in specific period and total risks resolved. Key metrics included in the slide are issues by status, issues by priority and resolved status.Deliver an awe inspiring pitch with this creative Dashboard To Measure Total Risks Encountered And Resolved Download PDF bundle. Topics like Pending Approval, Action Implemented, Resolved can be discussed with this completely editable template. It is available for immediate download depending on the needs and requirements of the user.
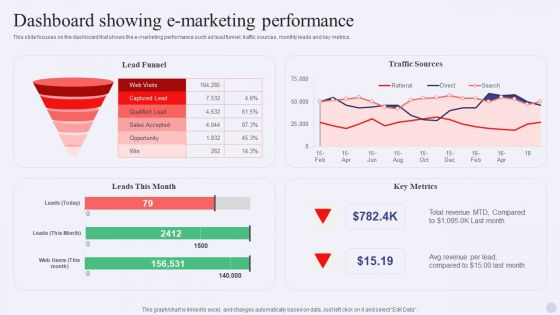
Electronic Commerce Systems Dashboard Showing E Marketing Performance Portrait PDF
This slide focuses on the dashboard that shows the e-marketing performance such ad lead funnel, traffic sources, monthly leads and key metrics. Deliver an awe inspiring pitch with this creative Electronic Commerce Systems Dashboard Showing E Marketing Performance Portrait PDF bundle. Topics like Lead Funnel, Traffic Sources, Leads This Month can be discussed with this completely editable template. It is available for immediate download depending on the needs and requirements of the user.
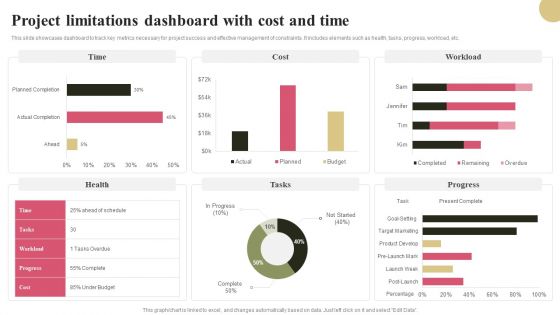
Project Limitations Dashboard With Cost And Time Graphics PDF
This slide showcases dashboard to track key metrics necessary for project success and effective management of constraints. It includes elements such as health, tasks, progress, workload, etc. Pitch your topic with ease and precision using this Project Limitations Dashboard With Cost And Time Graphics PDF. This layout presents information on Time, Workload, Tasks, Progress. It is also available for immediate download and adjustment. So, changes can be made in the color, design, graphics or any other component to create a unique layout.
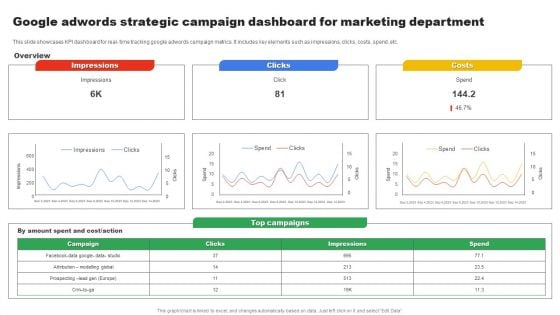
Google Adwords Strategic Campaign Dashboard For Marketing Department Download PDF
This slide showcases KPI dashboard for real time tracking google adwords campaign metrics. It includes key elements such as impressions, clicks, costs, spend, etc. Pitch your topic with ease and precision using this Google Adwords Strategic Campaign Dashboard For Marketing Department Download PDF. This layout presents information on Impressions, Clicks, Costs. It is also available for immediate download and adjustment. So, changes can be made in the color, design, graphics or any other component to create a unique layout.
Dashboard Capability Maturity Matrix Ppt PowerPoint Presentation Portfolio Icons
This is a dashboard capability maturity matrix ppt powerpoint presentation portfolio icons. This is a three stage process. The stages in this process are low, medium, high, dashboard, measurement.
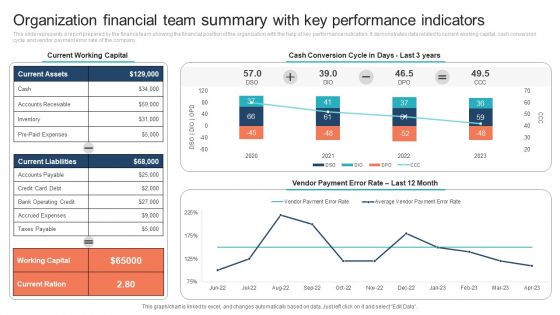
Organization Financial Team Summary With Key Performance Indicators Clipart PDF
This slide represents a report prepared by the finance team showing the financial position of the organization with the help of key performance indicators. It demonstrates data related to current working capital, cash conversion cycle and vendor payment error rate of the company. Pitch your topic with ease and precision using this Organization Financial Team Summary With Key Performance Indicators Clipart PDF. This layout presents information on Current Working Capital, Cash Conversion Cycle. It is also available for immediate download and adjustment. So, changes can be made in the color, design, graphics or any other component to create a unique layout.
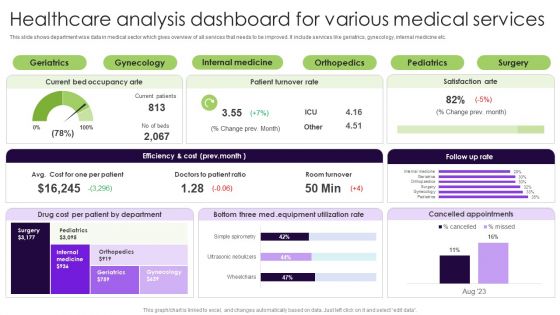
Healthcare Analysis Dashboard For Various Medical Services Ideas PDF
This slide shows department wise data in medical sector which gives overview of all services that needs to be improved. It include services like geriatrics, gynecology, internal medicine etc. Pitch your topic with ease and precision using this Healthcare Analysis Dashboard For Various Medical Services Ideas PDF. This layout presents information on Equipment Utilization Rate, Drug Cost Per Patient, Internal Medicine. It is also available for immediate download and adjustment. So, changes can be made in the color, design, graphics or any other component to create a unique layout.
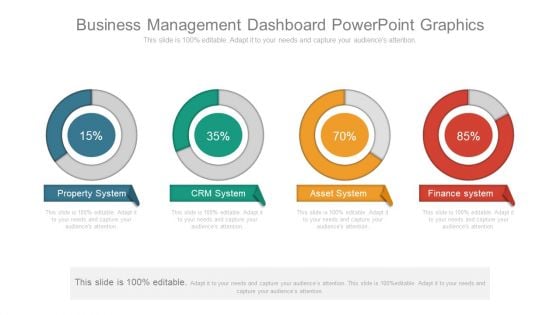
Business Management Dashboard Powerpoint Graphics
This is a business management dashboard powerpoint graphics. This is a four stage process. The stages in this process are property system, crm system, asset system, finance system.
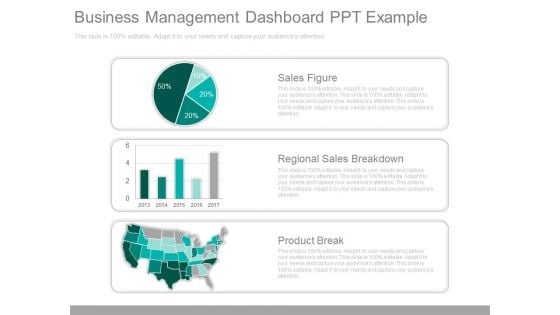
Business Management Dashboard Ppt Example
This is a business management dashboard ppt example. This is a three stage process. The stages in this process are sales figure, regional sales breakdown, product break.
Dashboard For Business Performance Analysis Ppt PowerPoint Presentation File Structure PDF
Presenting this set of slides with name dashboard for business performance analysis ppt powerpoint presentation file structure pdf. This is a three stage process. The stages in this process are dashboard for business performance analysis. This is a completely editable PowerPoint presentation and is available for immediate download. Download now and impress your audience.
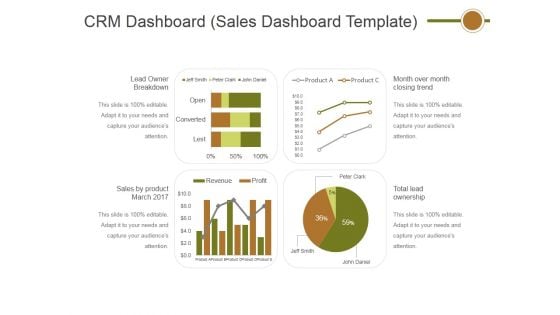
Crm Dashboard Sales Dashboard Template Ppt PowerPoint Presentation Professional Layout
This is a crm dashboard sales dashboard template ppt powerpoint presentation professional layout. This is a four stage process. The stages in this process are lead owner breakdown, sales by product march 2017, total lead ownership, month over month closing trend.

B2B Sales Analysis Ppt PowerPoint Presentation Infographic Template Show Cpb
This is a b2b sales analysis ppt powerpoint presentation infographic template show cpb. This is a five stage process. The stages in this process are b2b sales analysis.
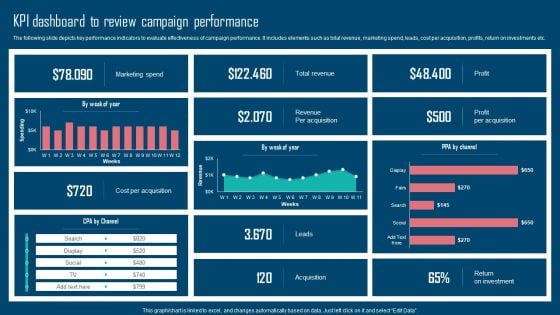
Adopting IMC Technique To Boost Brand Recognition Kpi Dashboard To Review Campaign Performance Pictures PDF
The following slide depicts key performance indicators to evaluate effectiveness of campaign performance. It includes elements such as total revenue, marketing spend, leads, cost per acquisition, profits, return on investments etc. This modern and well arranged Adopting IMC Technique To Boost Brand Recognition Kpi Dashboard To Review Campaign Performance Pictures PDF provides lots of creative possibilities. It is very simple to customize and edit with the Powerpoint Software. Just drag and drop your pictures into the shapes. All facets of this template can be edited with Powerpoint no extra software is necessary. Add your own material, put your images in the places assigned for them, adjust the colors, and then you can show your slides to the world, with an animated slide included.
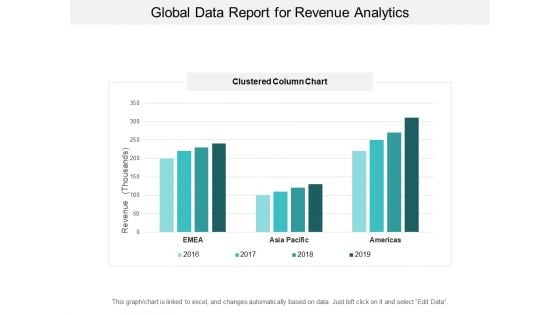
Global Data Report For Revenue Analytics Ppt PowerPoint Presentation Inspiration Visuals
This is a global data report for revenue analytics ppt powerpoint presentation inspiration visuals. This is a four stage process. The stages in this process are financial analysis, quantitative, statistical modelling.
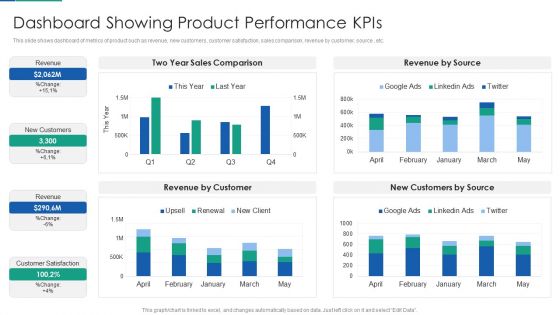
Agile Product Life Process Management Dashboard Showing Product Performance Kpis Inspiration PDF
This slide shows dashboard of metrics of product such as revenue, new customers, customer satisfaction, sales comparison, revenue by customer, source , etc. Deliver an awe inspiring pitch with this creative agile product life process management dashboard showing product performance kpis inspiration pdf bundle. Topics like dashboard showing product performance kpis can be discussed with this completely editable template. It is available for immediate download depending on the needs and requirements of the user.
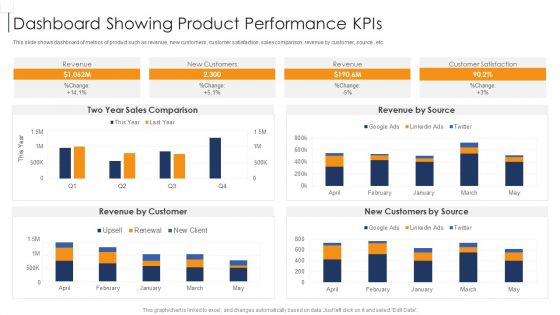
Product Lifecycle Management IT Dashboard Showing Product Performance Kpis Inspiration PDF
This slide shows dashboard of metrics of product such as revenue, new customers, customer satisfaction, sales comparison, revenue by customer, source , etc. Deliver an awe inspiring pitch with this creative product lifecycle management it dashboard showing product performance kpis inspiration pdf bundle. Topics like dashboard showing product performance kpis can be discussed with this completely editable template. It is available for immediate download depending on the needs and requirements of the user.
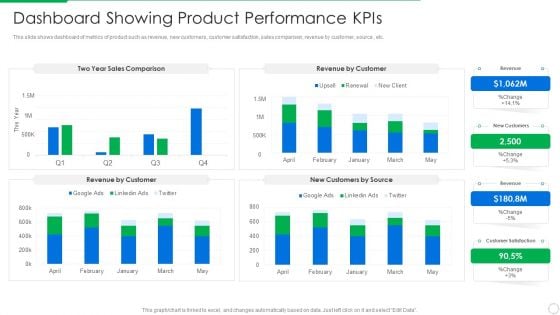
PLM Execution In Company Dashboard Showing Product Performance Kpis Diagrams PDF
This slide shows dashboard of metrics of product such as revenue, new customers, customer satisfaction, sales comparison, revenue by customer, source , etc. Deliver and pitch your topic in the best possible manner with this plm execution in company dashboard showing product performance kpis diagrams pdf . Use them to share invaluable insights on dashboard showing product performance kpis and impress your audience. This template can be altered and modified as per your expectations. So, grab it now.
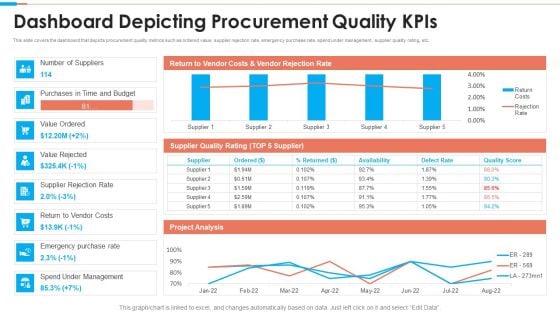
Tactical Approach To Vendor Relationship Dashboard Depicting Procurement Quality Kpis Graphics PDF
This slide covers the dashboard that depicts procurement quality metrics such as ordered value, supplier rejection rate, emergency purchase rate, spend under management, supplier quality rating, etc.Deliver an awe inspiring pitch with this creative Tactical Approach To Vendor Relationship Dashboard Depicting Procurement Quality Kpis Graphics PDF bundle. Topics like Dashboard Depicting Procurement Quality Kpis can be discussed with this completely editable template. It is available for immediate download depending on the needs and requirements of the user.
Online Product Planning Ecommerce Management KPIS And Dashboard Ppt Professional Example PDF
Presenting this set of slides with name online product planning ecommerce management kpis and dashboard ppt professional example pdf. This is a two stage process. The stages in this process are kpi metrics, kpi dashboards. This is a completely editable PowerPoint presentation and is available for immediate download. Download now and impress your audience.
Ecommerce Management Kpis And Dashboard Ppt PowerPoint Presentation Show Layouts PDF
Presenting this set of slides with name ecommerce management kpis and dashboard ppt powerpoint presentation show layouts pdf. This is a two stage process. The stages in this process are kpi metrics, kpi dashboards. This is a completely editable PowerPoint presentation and is available for immediate download. Download now and impress your audience.
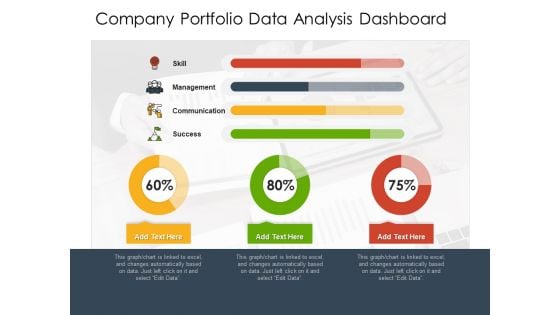
Company Portfolio Data Analysis Dashboard Ppt PowerPoint Presentation File Example Topics PDF
Presenting this set of slides with name company portfolio data analysis dashboard ppt powerpoint presentation file example topics pdf. The topics discussed in these slides are management, communication, success. This is a completely editable PowerPoint presentation and is available for immediate download. Download now and impress your audience.
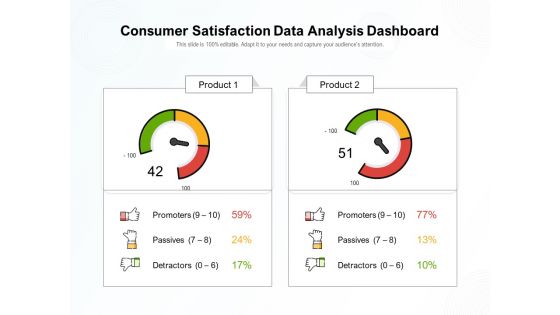
Consumer Satisfaction Data Analysis Dashboard Ppt PowerPoint Presentation Gallery Microsoft PDF
Pitch your topic with ease and precision using this consumer satisfaction data analysis dashboard ppt powerpoint presentation gallery microsoft pdf. This layout presents information on promoters, passives, detractors. It is also available for immediate download and adjustment. So, changes can be made in the color, design, graphics or any other component to create a unique layout.
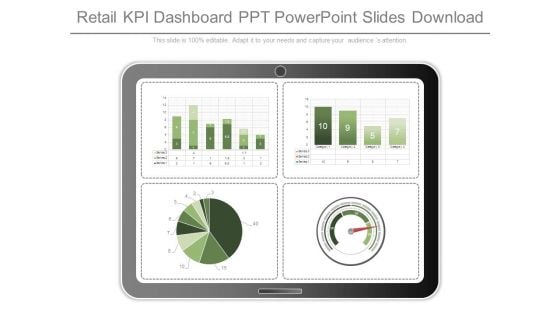
Retail Kpi Dashboard Ppt Powerpoint Slides Download
This is a retail kpi dashboard ppt powerpoint slides download. This is a four stage process. The stages in this process are business, marketing, measure, process, finance.
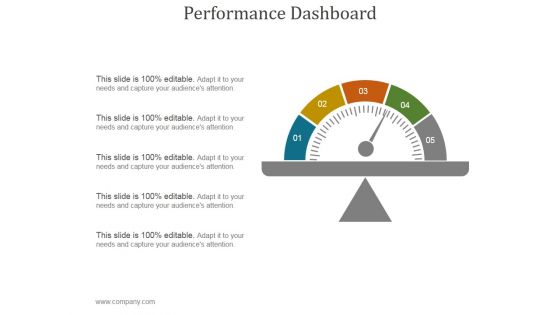
Performance Dashboard Ppt PowerPoint Presentation Background Designs
This is a performance dashboard ppt powerpoint presentation background designs. This is a one stage process. The stages in this process are performance, management, marketing, strategy, business.
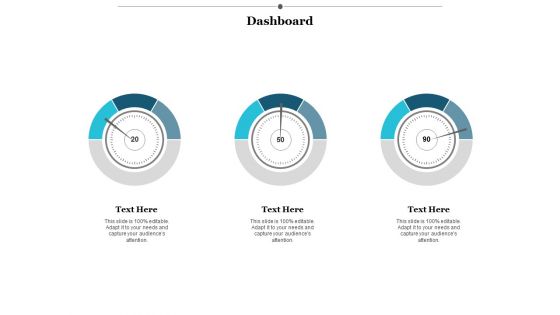
Dashboard Ppt PowerPoint Presentation File Designs Download
This is a dashboard ppt powerpoint presentation file designs download. This is a three stage process. The stages in this process are business, management, planning, strategy, marketing.

Data Democratization Challenges In Product Data Analytics Ideas Pdf
This slide represents the data democratization challenges for product data analytics with relevant mitigation strategies. These challenges include challenges like complication of data analytics architecture, lack of data centralization, etc. Showcasing this set of slides titled Data Democratization Challenges In Product Data Analytics Ideas Pdf. The topics addressed in these templates are Data Privacy And Security, Data Literacy , Data Reliability And Homogeneity. All the content presented in this PPT design is completely editable. Download it and make adjustments in color, background, font etc. as per your unique business setting. This slide represents the data democratization challenges for product data analytics with relevant mitigation strategies. These challenges include challenges like complication of data analytics architecture, lack of data centralization, etc.
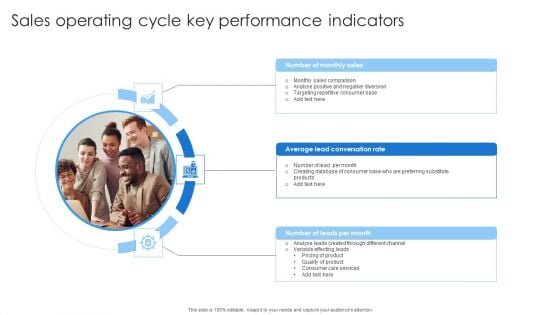
Sales Operating Cycle Key Performance Indicators Professional PDF
Presenting Sales Operating Cycle Key Performance Indicators Professional PDF to dispense important information. This template comprises three stages. It also presents valuable insights into the topics including Sales Comparison, Lead Conversation, Quality Product. This is a completely customizable PowerPoint theme that can be put to use immediately. So, download it and address the topic impactfully.
Implementing Digital Transformation Performance Tracking Kpi Dashboard For Digital Background PDF
Mentioned slide provides information about the key performance indicators that can be used by managers to measure the success of digital marketing strategy, KPIs covered are status, progress, priority and timeline. Boost your pitch with our creative Implementing Digital Transformation Performance Tracking Kpi Dashboard For Digital Background PDF. Deliver an awe-inspiring pitch that will mesmerize everyone. Using these presentation templates you will surely catch everyones attention. You can browse the ppts collection on our website. We have researchers who are experts at creating the right content for the templates. So you dont have to invest time in any additional work. Just grab the template now and use them.
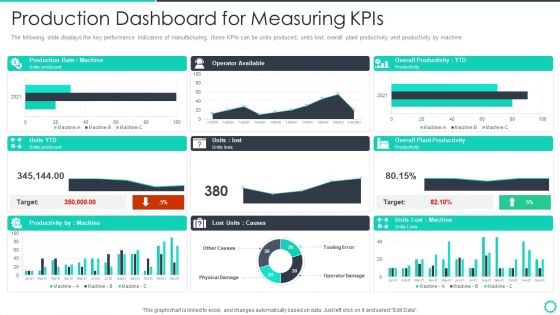
Manufacturing Operation Quality Improvement Practices Tools Templates Production Dashboard For Mockup PDF
The following slide displays the key performance Indicators of manufacturing, these KPIs can be units produced, units lost, overall plant productivity and productivity by machine. Deliver an awe inspiring pitch with this creative manufacturing operation quality improvement practices tools templates production dashboard for mockup pdf bundle. Topics like production dashboard for measuring kpis can be discussed with this completely editable template. It is available for immediate download depending on the needs and requirements of the user.
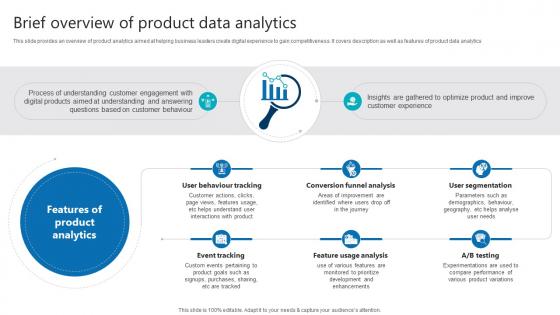
Brief Overview Of Product Data Analytics Product Analytics Implementation Data Analytics V
This slide provides an overview of product analytics aimed at helping business leaders create digital experience to gain competitiveness. It covers description as well as features of product data analytics Get a simple yet stunning designed Brief Overview Of Product Data Analytics Product Analytics Implementation Data Analytics V. It is the best one to establish the tone in your meetings. It is an excellent way to make your presentations highly effective. So, download this PPT today from Slidegeeks and see the positive impacts. Our easy-to-edit Brief Overview Of Product Data Analytics Product Analytics Implementation Data Analytics V can be your go-to option for all upcoming conferences and meetings. So, what are you waiting for Grab this template today. This slide provides an overview of product analytics aimed at helping business leaders create digital experience to gain competitiveness. It covers description as well as features of product data analytics

Key Metrics To Consider In Prompt Evaluation Crafting Interactions A Guide AI SS V
This slide showcases key metrics to consider while evaluating prompt engineering, referable by users and multiple businesses harnessing this technology. It provides information about relevance, coherence, accuracy, etc. The Key Metrics To Consider In Prompt Evaluation Crafting Interactions A Guide AI SS V is a compilation of the most recent design trends as a series of slides. It is suitable for any subject or industry presentation, containing attractive visuals and photo spots for businesses to clearly express their messages. This template contains a variety of slides for the user to input data, such as structures to contrast two elements, bullet points, and slides for written information. Slidegeeks is prepared to create an impression. This slide showcases key metrics to consider while evaluating prompt engineering, referable by users and multiple businesses harnessing this technology. It provides information about relevance, coherence, accuracy, etc.
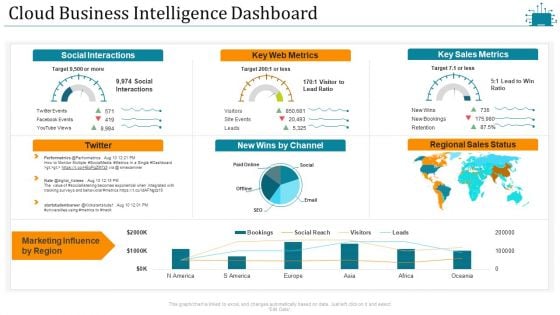
Cloud Intelligence Framework For Application Consumption Cloud Business Intelligence Dashboard Slides PDF
Deliver an awe inspiring pitch with this creative cloud intelligence framework for application consumption cloud business intelligence dashboard slides pdf bundle. Topics like social interactions, key web metrics, key sales metrics, marketing influence by region can be discussed with this completely editable template. It is available for immediate download depending on the needs and requirements of the user.
Employee Performance Tracking And Management Dashboard Pictures PDF
This slide showcases a dashboard presenting various metrics to measure and analyze employee overall performance. It outlines information about average absenteeism rate, yearly average overtime hours, training costs and overall labor effectiveness. Find highly impressive Employee Performance Tracking And Management Dashboard Pictures PDF on Slidegeeks to deliver a meaningful presentation. You can save an ample amount of time using these presentation templates. No need to worry to prepare everything from scratch because Slidegeeks experts have already done a huge research and work for you. You need to download Employee Performance Tracking And Management Dashboard Pictures PDF for your upcoming presentation. All the presentation templates are 100 percent editable and you can change the color and personalize the content accordingly. Download now.
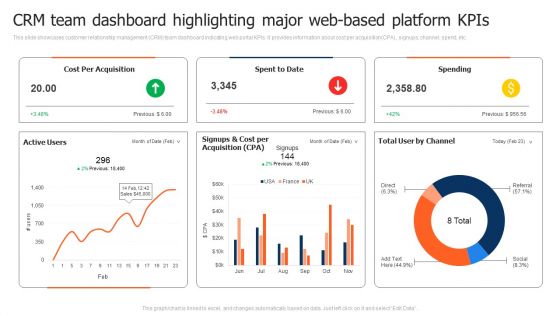
CRM Team Dashboard Highlighting Major Web Based Platform Kpis Template PDF
This slide showcases customer relationship management CRM team dashboard indicating web portal KPIs. It provides information about cost per acquisition CPA, signups, channel, spend, etc. Pitch your topic with ease and precision using this CRM Team Dashboard Highlighting Major Web Based Platform Kpis Template PDF. This layout presents information on CRM Team Dashboard Highlighting, Web Based Platform Kpis. It is also available for immediate download and adjustment. So, changes can be made in the color, design, graphics or any other component to create a unique layout.
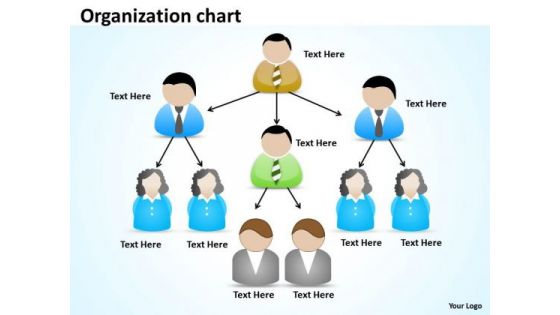
Business Diagram Organization Sketch Marketing Diagram
Deliver The Right Dose With Our business diagram Organization sketch marketing diagram Powerpoint Templates. Your Ideas Will Get The Correct Illumination. Your Abilities Have Been Lying Dormant. Awaken Them With Our business diagram Organization sketch marketing diagram Powerpoint Templates.
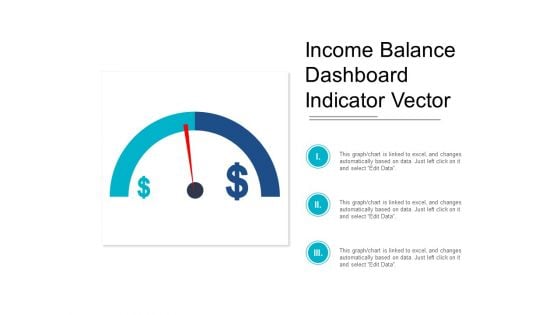
Income Balance Dashboard Indicator Vector Ppt PowerPoint Presentation Professional Diagrams
This is a income balance dashboard indicator vector ppt powerpoint presentation professional diagrams. This is a three stage process. The stages in this process are growth, increase sales, increase revenue.
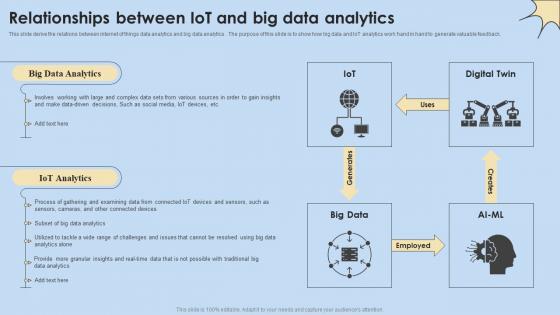
Relationships Between IoT And Big Data Analytics Internet Of Things Analysis Slides Pdf
This slide derive the relations between internet of things data analytics and big data analytics . The purpose of this slide is to show how big data and IoT analytics work hand in hand to generate valuable feedback. Here you can discover an assortment of the finest PowerPoint and Google Slides templates. With these templates, you can create presentations for a variety of purposes while simultaneously providing your audience with an eye-catching visual experience. Download Relationships Between IoT And Big Data Analytics Internet Of Things Analysis Slides Pdf to deliver an impeccable presentation. These templates will make your job of preparing presentations much quicker, yet still, maintain a high level of quality. Slidegeeks has experienced researchers who prepare these templates and write high-quality content for you. Later on, you can personalize the content by editing the Relationships Between IoT And Big Data Analytics Internet Of Things Analysis Slides Pdf. This slide derive the relations between internet of things data analytics and big data analytics . The purpose of this slide is to show how big data and IoT analytics work hand in hand to generate valuable feedback.
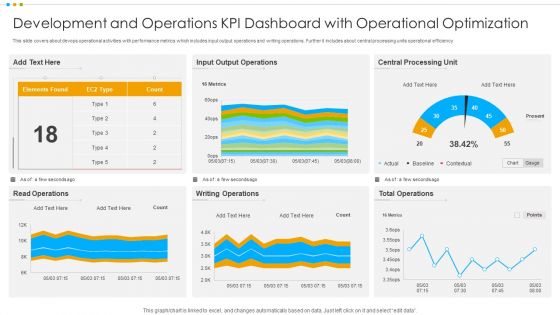
Development And Operations KPI Dashboard With Operational Optimization Pictures PDF
This slide covers about devops operational activities with performance metrics which includes input output operations and writing operations. Further it includes about central processing units operational efficiency.Pitch your topic with ease and precision using this Development And Operations KPI Dashboard With Operational Optimization Pictures PDF This layout presents information on Output Operations, Central Processing, Total Operations It is also available for immediate download and adjustment. So, changes can be made in the color, design, graphics or any other component to create a unique layout.
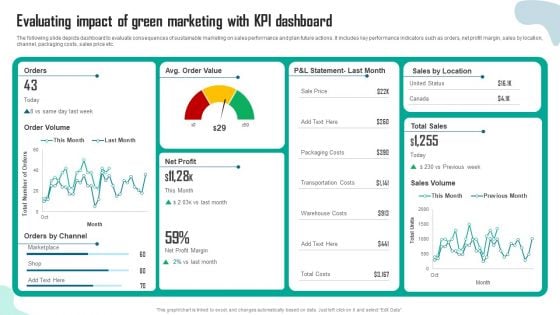
Evaluating Impact Of Green Marketing With Kpi Dashboard Inspiration PDF
The following slide depicts dashboard to evaluate consequences of sustainable marketing on sales performance and plan future actions. It includes key performance indicators such as orders, net profit margin, sales by location, channel, packaging costs, sales price etc. This Evaluating Impact Of Green Marketing With Kpi Dashboard Inspiration PDF from Slidegeeks makes it easy to present information on your topic with precision. It provides customization options, so you can make changes to the colors, design, graphics, or any other component to create a unique layout. It is also available for immediate download, so you can begin using it right away. Slidegeeks has done good research to ensure that you have everything you need to make your presentation stand out. Make a name out there for a brilliant performance.
Kpis And Dashboard Ppt Powerpoint Presentation Outline Styles
This is a kpis and dashboard ppt powerpoint presentation outline styles. This is a two stage process. The stages in this process are business, management, planning, strategy, marketing.
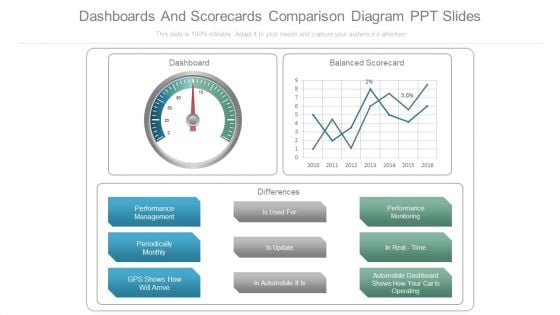
Dashboards And Scorecards Comparison Diagram Ppt Slides
This is a dashboards and scorecards comparison diagram ppt slides. This is a three stage process. The stages in this process are dashboard, balanced scorecard, differences, performance management, periodically monthly, gps shows how will arrive, is used for, is update, in automobile it is, performance monitoring, in real time, automobile dashboard shows how your car is operating.

Kpis For Effective Content Marketing Plan Mockup Pdf
This slide shows major key performance indicators used for successful promotion plan to test effectiveness and efficiency. It include brand indicators, content performance indicators and commercial indicators, etc Pitch your topic with ease and precision using this Kpis For Effective Content Marketing Plan Mockup Pdf This layout presents information on Brand Indicators, Content Performance Indicators It is also available for immediate download and adjustment. So, changes can be made in the color, design, graphics or any other component to create a unique layout. This slide shows major key performance indicators used for successful promotion plan to test effectiveness and efficiency. It include brand indicators, content performance indicators and commercial indicators, etc
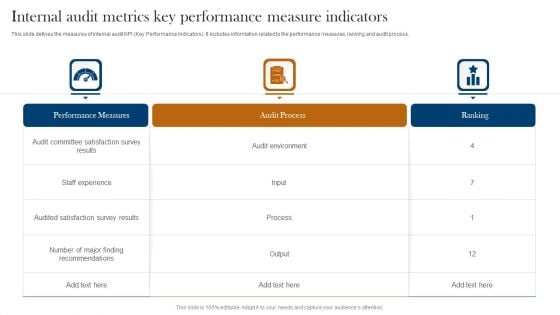
Internal Audit Metrics Key Performance Measure Indicators Background PDF
This slide defines the measures of internal audit KPI Key Performance Indicators. It includes information related to the performance measures, ranking and audit process. Showcasing this set of slides titled Internal Audit Metrics Key Performance Measure Indicators Background PDF. The topics addressed in these templates are Performance Measures, Audit Process, Ranking. All the content presented in this PPT design is completely editable. Download it and make adjustments in color, background, font etc. as per your unique business setting.
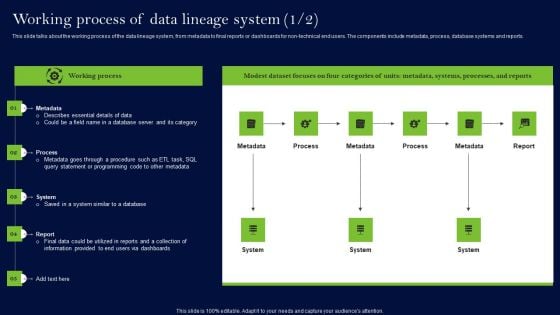
Data Lineage Methods Working Process Of Data Lineage System Structure PDF
This slide talks about the working process of the data lineage system, from metadata to final reports or dashboards for non-technical end users. The components include metadata, process, database systems and reports. Get a simple yet stunning designed Data Lineage Methods Working Process Of Data Lineage System Structure PDF. It is the best one to establish the tone in your meetings. It is an excellent way to make your presentations highly effective. So, download this PPT today from Slidegeeks and see the positive impacts. Our easy-to-edit Data Lineage Methods Working Process Of Data Lineage System Structure PDF can be your go-to option for all upcoming conferences and meetings. So, what are you waiting for Grab this template today.
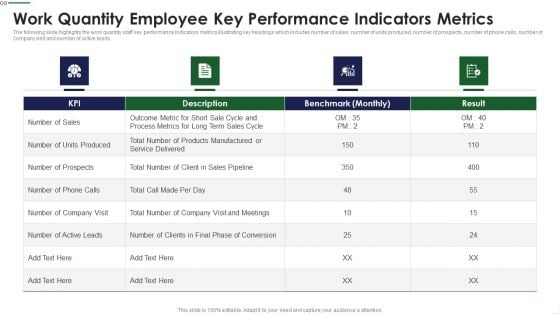
Work Quantity Employee Key Performance Indicators Metrics Summary PDF
The following slide highlights the work quantity staff key performance Indicators metrics illustrating key headings which includes number of sales, number of units produced, number of prospects, number of phone calls, number of company visit and number of active leads Deliver and pitch your topic in the best possible manner with this Work Quantity Employee Key Performance Indicators Metrics Summary PDF Use them to share invaluable insights on Outcome Metric, Process Metrics, Benchmark and impress your audience. This template can be altered and modified as per your expectations. So, grab it now.
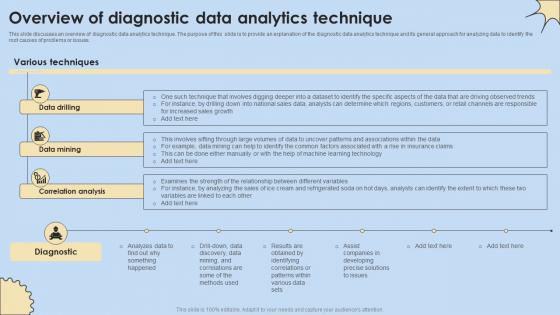
Overview Of Diagnostic Data Analytics Technique Internet Of Things Analysis Introduction Pdf
This slide discusses an overview of diagnostic data analytics technique. The purpose of this slide is to provide an explanation of the diagnostic data analytics technique and its general approach for analyzing data to identify the root causes of problems or issues. Are you searching for a Overview Of Diagnostic Data Analytics Technique Internet Of Things Analysis Introduction Pdf that is uncluttered, straightforward, and original It is easy to edit, and you can change the colors to suit your personal or business branding. For a presentation that expresses how much effort you have put in, this template is ideal With all of its features, including tables, diagrams, statistics, and lists, it is perfect for a business plan presentation. Make your ideas more appealing with these professional slides. Download Overview Of Diagnostic Data Analytics Technique Internet Of Things Analysis Introduction Pdf from Slidegeeks today. This slide discusses an overview of diagnostic data analytics technique. The purpose of this slide is to provide an explanation of the diagnostic data analytics technique and its general approach for analyzing data to identify the root causes of problems or issues.
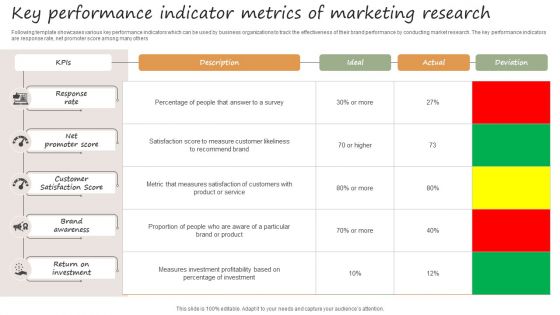
Key Performance Indicator Metrics Of Marketing Research Guidelines PDF
Following template showcases various key performance indicators which can be used by business organizations to track the effectiveness of their brand performance by conducting market research. The key performance indicators are response rate, net promoter score among many others. Showcasing this set of slides titled Key Performance Indicator Metrics Of Marketing Research Guidelines PDF. The topics addressed in these templates are Response Rate, Net Promoter Score, Customer Satisfaction Score . All the content presented in this PPT design is completely editable. Download it and make adjustments in color, background, font etc. as per your unique business setting.

Strategies For Dynamic Supply Chain Agility Supply Chain Kpi Dashboard For Effective Financial Analysis Demonstration PDF
Mentioned slide illustrates KPI dashboard that can be used by managers to assess financial health of supply chain business. KPIs covered are supply chain costs versus sales, cash to order cycle, warehouse operating cost distribution etc. The Strategies For Dynamic Supply Chain Agility Supply Chain Kpi Dashboard For Effective Financial Analysis Demonstration PDF is a compilation of the most recent design trends as a series of slides. It is suitable for any subject or industry presentation, containing attractive visuals and photo spots for businesses to clearly express their messages. This template contains a variety of slides for the user to input data, such as structures to contrast two elements, bullet points, and slides for written information. Slidegeeks is prepared to create an impression.
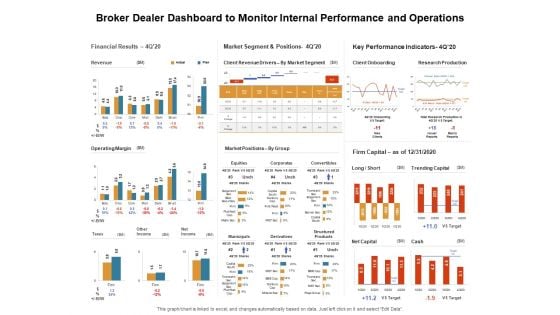
Venture Capitalist Control Board Broker Dealer Dashboard To Monitor Internal Performance And Operations Information PDF
Presenting this set of slides with name venture capitalist control board broker dealer dashboard to monitor internal performance and operations information pdf. The topics discussed in these slides are financial results, market segment and positions, key performance indicators. This is a completely editable PowerPoint presentation and is available for immediate download. Download now and impress your audience.
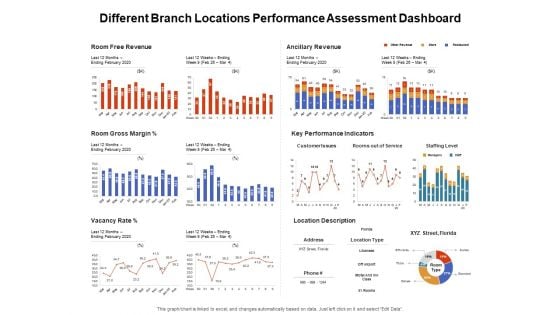
Venture Capitalist Control Board Different Branch Locations Performance Assessment Dashboard Graphics PDF
Presenting this set of slides with name venture capitalist control board different branch locations performance assessment dashboard graphics pdf. The topics discussed in these slides are room free revenue, ancillary revenue, key performance indicators, room gross margin, location description, vacancy rate. This is a completely editable PowerPoint presentation and is available for immediate download. Download now and impress your audience.
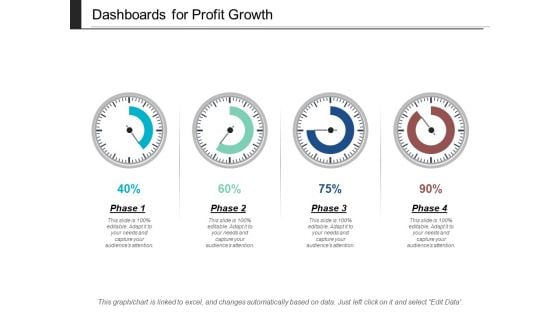
Dashboards For Profit Growth Ppt PowerPoint Presentation Summary Templates
This is a dashboards for profit growth ppt powerpoint presentation summary templates. This is a four stage process. The stages in this process are task completion, assignment completion, work completion.
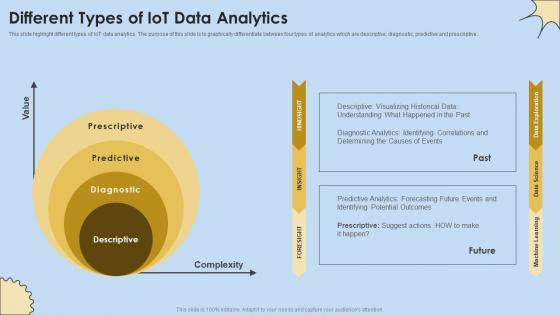
Different Types Of IoT Data Analytics Internet Of Things Analysis Mockup Pdf
This slide highlight different types of IoT data analytics. The purpose of this slide is to graphically differentiate between four types of analytics which are descriptive, diagnostic, predictive and prescriptive. Are you in need of a template that can accommodate all of your creative concepts This one is crafted professionally and can be altered to fit any style. Use it with Google Slides or PowerPoint. Include striking photographs, symbols, depictions, and other visuals. Fill, move around, or remove text boxes as desired. Test out color palettes and font mixtures. Edit and save your work, or work with colleagues. Download Different Types Of IoT Data Analytics Internet Of Things Analysis Mockup Pdf and observe how to make your presentation outstanding. Give an impeccable presentation to your group and make your presentation unforgettable. This slide highlight different types of IoT data analytics. The purpose of this slide is to graphically differentiate between four types of analytics which are descriptive, diagnostic, predictive and prescriptive.
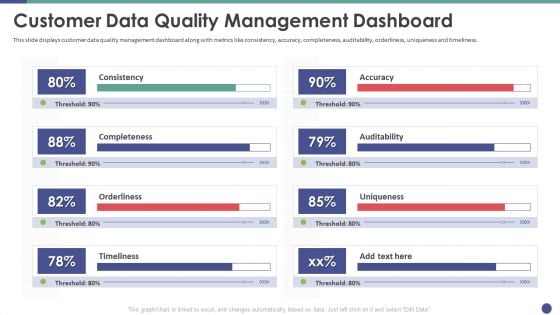
QC Engineering Customer Data Quality Management Dashboard Ppt Infographic Template Guide PDF
This slide displays customer data quality management dashboard along with metrics like consistency, accuracy, completeness, auditability, orderliness, uniqueness and timeliness. Deliver an awe inspiring pitch with this creative qc engineering customer data quality management dashboard ppt infographic template guide pdf bundle. Topics like auditability, timeliness, orderliness, completeness, consistency can be discussed with this completely editable template. It is available for immediate download depending on the needs and requirements of the user.
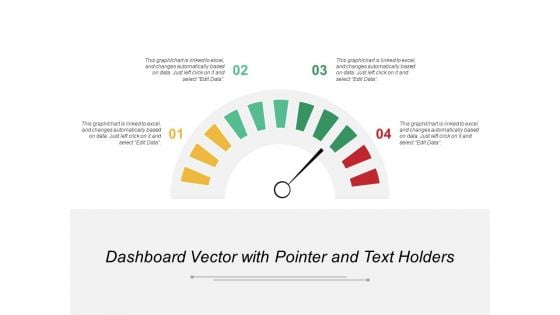
Dashboard Vector With Pointer And Text Holders Ppt PowerPoint Presentation Portfolio Format Ideas
This is a dashboard vector with pointer and text holders ppt powerpoint presentation portfolio format ideas. This is a four stage process. The stages in this process are performance dashboard, performance meter, performance kpi.
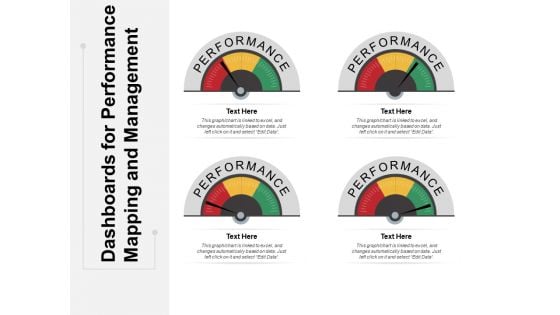
Dashboards For Performance Mapping And Management Ppt PowerPoint Presentation Ideas File Formats
This is a dashboards for performance mapping and management ppt powerpoint presentation ideas file formats. This is a four stage process. The stages in this process are performance dashboard, performance meter, performance kpi.
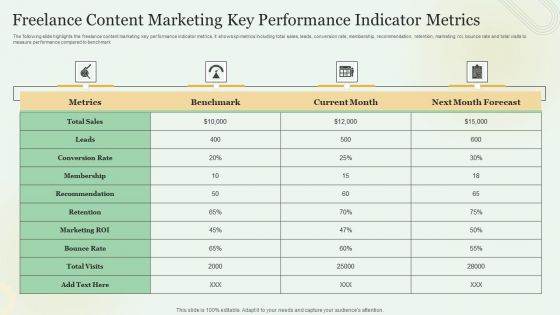
Freelance Content Marketing Key Performance Indicator Metrics Slides PDF
The following slide highlights the freelance content marketing key performance indicator metrics. It shows kpi metrics including total sales, leads, conversion rate, membership, recommendation, retention, marketing roi, bounce rate and total visits to measure performance compared to benchmark. Pitch your topic with ease and precision using this Freelance Content Marketing Key Performance Indicator Metrics Slides PDF. This layout presents information on Total Sales, Conversion Rate, Bounce Rate. It is also available for immediate download and adjustment. So, changes can be made in the color, design, graphics or any other component to create a unique layout.

Data Driven Approach To Optimise Best Practices To Optimize Recruitment Process CRP SS V
This slide showcases tips to improve hiring process such as selecting suitable metrics, developing dashboards and data analysis. Slidegeeks is here to make your presentations a breeze with Data Driven Approach To Optimise Best Practices To Optimize Recruitment Process CRP SS V With our easy-to-use and customizable templates, you can focus on delivering your ideas rather than worrying about formatting. With a variety of designs to choose from, you are sure to find one that suits your needs. And with animations and unique photos, illustrations, and fonts, you can make your presentation pop. So whether you are giving a sales pitch or presenting to the board, make sure to check out Slidegeeks first This slide showcases tips to improve hiring process such as selecting suitable metrics, developing dashboards and data analysis.
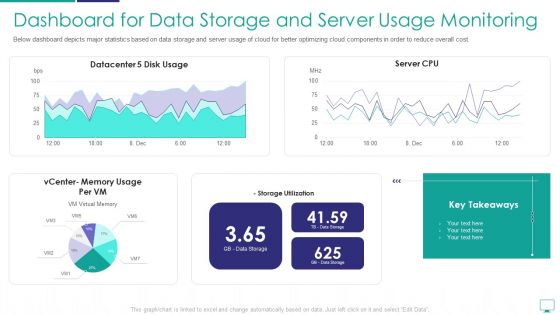
Dashboard For Data Storage And Server Usage Monitoring Mockup PDF
Below dashboard depicts major statistics based on data storage and server usage of cloud for better optimizing cloud components in order to reduce overall cost.Deliver an awe inspiring pitch with this creative dashboard for data storage and server usage monitoring mockup pdf bundle. Topics like dashboard for data storage and server usage monitoring can be discussed with this completely editable template. It is available for immediate download depending on the needs and requirements of the user.
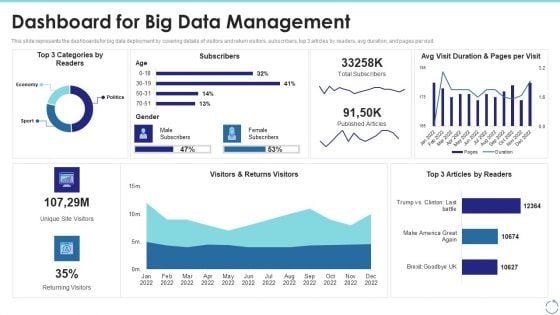
Dashboard For Big Data Management Ppt Outline Elements PDF
This slide represents the dashboards for big data deployment by covering details of visitors and return visitors, subscribers, top 3 articles by readers, avg duration, and pages per visit. Deliver an awe inspiring pitch with this creative dashboard for big data management ppt outline elements pdf bundle. Topics like dashboard for big data management can be discussed with this completely editable template. It is available for immediate download depending on the needs and requirements of the user.
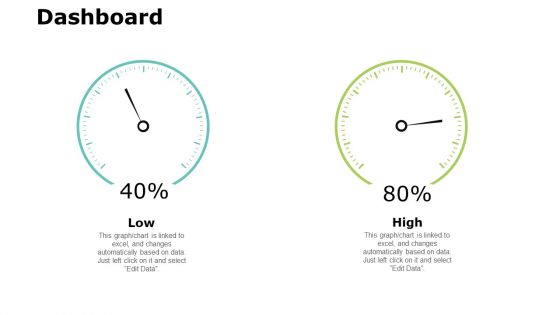
Dashboard Measurement Ppt PowerPoint Presentation Ideas Infographic Template
This is a dashboard measurement ppt powerpoint presentation ideas infographic template. This is a two stage process. The stages in this process are dashboard, marketing, management, investment, analysis.


 Continue with Email

 Home
Home


