Snapshot
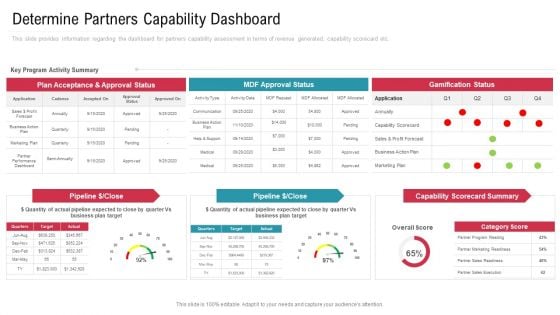
Co Variety Advertisement Determine Partners Capability Dashboard Pictures PDF
This slide provides information regarding the dashboard for partners capability assessment in terms of revenue generated, capability scorecard etc. Deliver and pitch your topic in the best possible manner with this co variety advertisement determine partners capability dashboard pictures pdf. Use them to share invaluable insights on capability scorecard, plan acceptance, business plan target and impress your audience. This template can be altered and modified as per your expectations. So, grab it now.
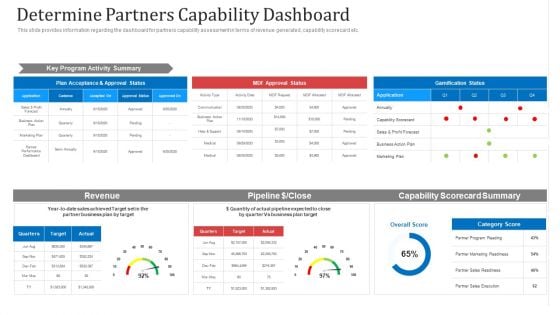
Determine Partners Capability Dashboard Ppt Pictures Format PDF
This slide provides information regarding the dashboard for partners capability assessment in terms of revenue generated, capability scorecard etc. Deliver and pitch your topic in the best possible manner with this determine partners capability dashboard ppt pictures format pdf. Use them to share invaluable insights on revenue, target, business plan, sales and impress your audience. This template can be altered and modified as per your expectations. So, grab it now.
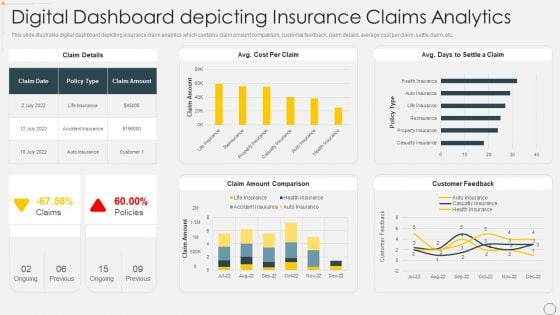
Digital Dashboard Depicting Insurance Claims Analytics Pictures PDF
This slide illustrates digital dashboard depicting insurance claim analytics which contains claim amount comparison, customer feedback, claim details, average cost per claim, settle claim, etc. Showcasing this set of slides titled Digital Dashboard Depicting Insurance Claims Analytics Pictures PDF. The topics addressed in these templates are Policy, Cost, Comparison. All the content presented in this PPT design is completely editable. Download it and make adjustments in color, background, font etc. as per your unique business setting.
Customer Loyalty Performance Dashboard Ppt PowerPoint Presentation Pictures Maker
Presenting this set of slides with name customer loyalty performance dashboard ppt powerpoint presentation pictures maker. This is a two stage process. The stages in this process are customer loyalty, program performance, dashboard, marketing, strategy. This is a completely editable PowerPoint presentation and is available for immediate download. Download now and impress your audience.
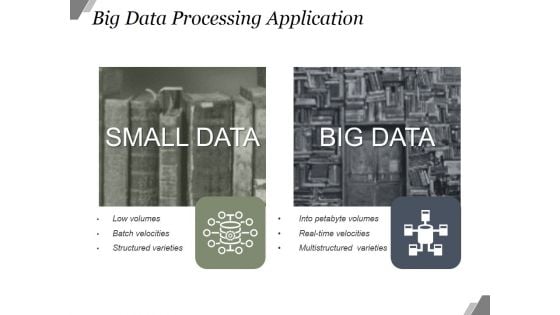
Big Data Processing Application Ppt PowerPoint Presentation Shapes
This is a big data processing application ppt powerpoint presentation shapes. This is a two stage process. The stages in this process are small data, big data, low volumes, batch velocities, structured varieties, into petabyte volumes.
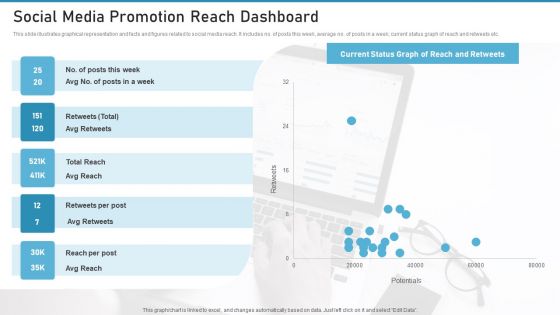
Social Media Promotion Reach Dashboard Mockup PDF
This slide illustrates graphical representation and facts and figures related to social media reach. It includes no. of posts this week, average no. of posts in a week, current status graph of reach and retweets etc. Persuade your audience using this Social Media Promotion Reach Dashboard Mockup PDF. This PPT design covers five stages, thus making it a great tool to use. It also caters to a variety of topics including Social Media Promotion Reach Dashboard. Download this PPT design now to present a convincing pitch that not only emphasizes the topic but also showcases your presentation skills.
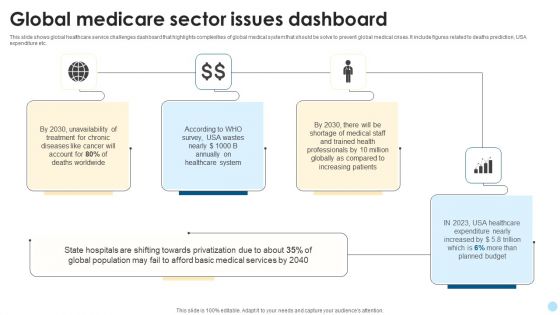
Global Medicare Sector Issues Dashboard Guidelines PDF
This slide shows global healthcare service challenges dashboard that highlights complexities of global medical system that should be solve to prevent global medical crises. It include figures related to deaths prediction, USA expenditure etc. Presenting Global Medicare Sector Issues Dashboard Guidelines PDF to dispense important information. This template comprises four stages. It also presents valuable insights into the topics including Healthcare System, Global Population, Medical Services. This is a completely customizable PowerPoint theme that can be put to use immediately. So, download it and address the topic impactfully.
Product Sales Performance Tracking Dashboard Introduction PDF
This slide provides information regarding dashboard utilized by firm to monitor sales performance of products offered. The performance is tracked through revenues generated, online vs offline purchases, cost of goods sold, etc. Are you in need of a template that can accommodate all of your creative concepts This one is crafted professionally and can be altered to fit any style. Use it with Google Slides or PowerPoint. Include striking photographs, symbols, depictions, and other visuals. Fill, move around, or remove text boxes as desired. Test out color palettes and font mixtures. Edit and save your work, or work with colleagues. Download Product Sales Performance Tracking Dashboard Introduction PDF and observe how to make your presentation outstanding. Give an impeccable presentation to your group and make your presentation unforgettable.
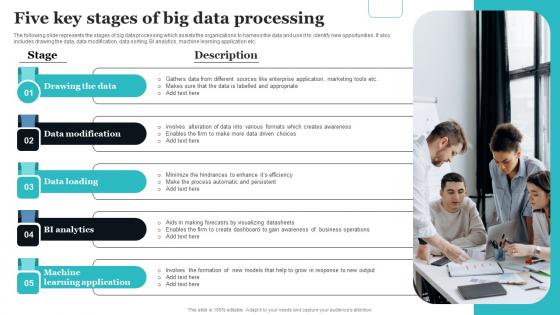
Five Key Stages Of Big Data Processing Graphics Pdf
The following slide represents the stages of big data processing which assists the organizations to harness the data and use it to identify new opportunities. It also includes drawing the data, data modification, data sorting, BI analytics, machine learning application etc. Showcasing this set of slides titled Five Key Stages Of Big Data Processing Graphics Pdf The topics addressed in these templates are Drawing The Data, Data Modification, Data Loading All the content presented in this PPT design is completely editable. Download it and make adjustments in color, background, font etc. as per your unique business setting. The following slide represents the stages of big data processing which assists the organizations to harness the data and use it to identify new opportunities. It also includes drawing the data, data modification, data sorting, BI analytics, machine learning application etc.
WAF Platform Kpis Dashboard For Threat Tracking In WAF Demonstration PDF
This slide depicts how threat risk will be monitored and threat detection will be done in the organization through web application firewall implementation. Deliver an awe inspiring pitch with this creative WAF Platform Kpis Dashboard For Threat Tracking In WAF Demonstration PDF bundle. Topics like Current Risk Status, Threat Dashboard, Risk By Threats can be discussed with this completely editable template. It is available for immediate download depending on the needs and requirements of the user.
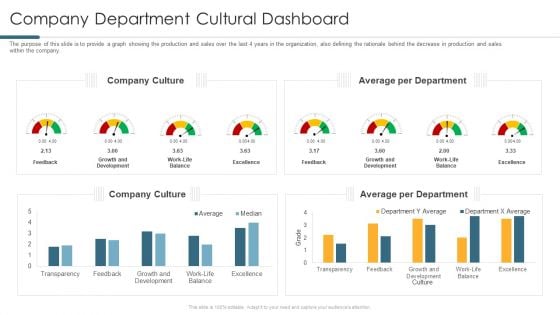
Company Department Cultural Dashboard Formats PDF
The purpose of this slide is to provide a graph showing the production and sales over the last 4 years in the organization, also defining the rationale behind the decrease in production and sales within the company. Deliver an awe inspiring pitch with this creative company department cultural dashboard formats pdf bundle. Topics like average per department, company culture can be discussed with this completely editable template. It is available for immediate download depending on the needs and requirements of the user.
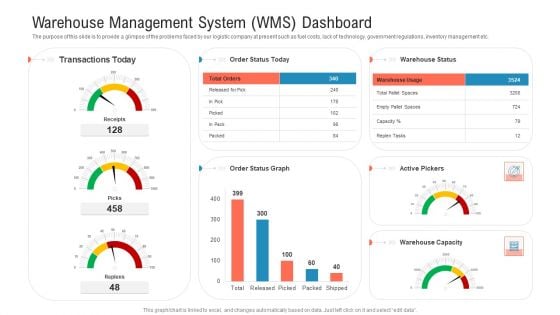
Warehouse Management System Wms Dashboard Sample PDF
The purpose of this slide is to provide a glimpse of the problems faced by our logistic company at present such as fuel costs, lack of technology, government regulations, inventory management etc. Deliver an awe-inspiring pitch with this creative warehouse management system wms dashboard sample pdf. bundle. Topics like order status graph, active pickers, warehouse capacity, warehouse status can be discussed with this completely editable template. It is available for immediate download depending on the needs and requirements of the user.
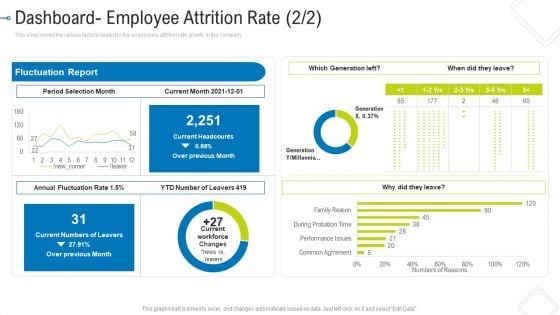
Dashboard Employee Attrition Rate Month Graphics PDF
This slide shows the various factors related to the employees attrition rate growth in the company.Deliver and pitch your topic in the best possible manner with this dashboard employee attrition rate month graphics pdf. Use them to share invaluable insights on fluctuation report, period selection month, annual fluctuation rate and impress your audience. This template can be altered and modified as per your expectations. So, grab it now.
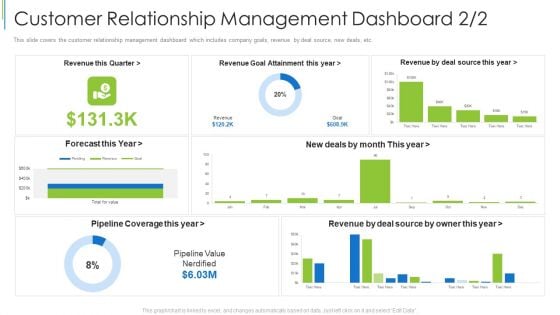
Customer Relationship Management Dashboard Revenue Background PDF
This slide covers the competitive analysis of different partner relationship management software which are compared based on features ratings and software prices. Deliver and pitch your topic in the best possible manner with this customer relationship management dashboard revenue background pdf. Use them to share invaluable insights on supply chain planning, fulfillment management, transportation management, inventory management and impress your audience. This template can be altered and modified as per your expectations. So, grab it now.
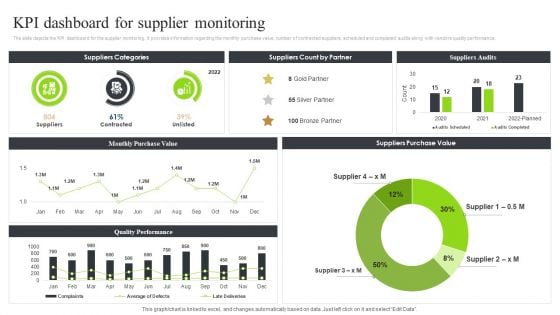
Strategic Sourcing And Supplier Quality Kpi Dashboard For Supplier Monitoring Graphics PDF
The slide depicts the KPI dashboard for the supplier monitoring. It provides information regarding the monthly purchase value, number of contracted suppliers, scheduled and completed audits along with vendors quality performance.Take your projects to the next level with our ultimate collection of Strategic Sourcing And Supplier Quality Kpi Dashboard For Supplier Monitoring Graphics PDF. Slidegeeks has designed a range of layouts that are perfect for representing task or activity duration, keeping track of all your deadlines at a glance. Tailor these designs to your exact needs and give them a truly corporate look with your own brand colors they all make your projects stand out from the rest.
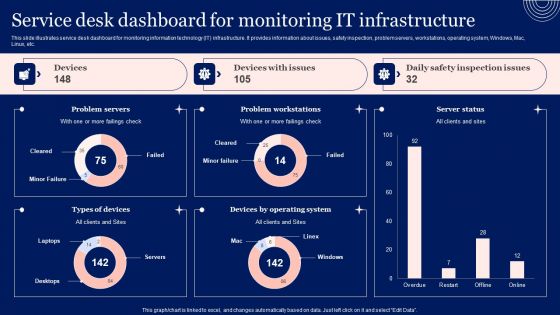
Implementing Advanced Service Help Desk Administration Program Service Desk Dashboard For Monitoring It Infrastructure Summary PDF
This slide illustrates service desk dashboard for monitoring information technology IT infrastructure. It provides information about issues, safety inspection, problem servers, workstations, operating system, Windows, Mac, Linux, etc. Take your projects to the next level with our ultimate collection of Implementing Advanced Service Help Desk Administration Program Service Desk Dashboard For Monitoring It Infrastructure Summary PDF. Slidegeeks has designed a range of layouts that are perfect for representing task or activity duration, keeping track of all your deadlines at a glance. Tailor these designs to your exact needs and give them a truly corporate look with your own brand colors they will make your projects stand out from the rest

Key Benefits Of Customer Journey Mapping Product Analytics Implementation Data Analytics V
This slide outlines benefits of journey mapping aimed at tracking customer activities to make data driven decisions. It covers major benefits such as team alignment, customer retention, improvement in messaging and customer centric culture with key drivers This Key Benefits Of Customer Journey Mapping Product Analytics Implementation Data Analytics V from Slidegeeks makes it easy to present information on your topic with precision. It provides customization options, so you can make changes to the colors, design, graphics, or any other component to create a unique layout. It is also available for immediate download, so you can begin using it right away. Slidegeeks has done good research to ensure that you have everything you need to make your presentation stand out. Make a name out there for a brilliant performance. This slide outlines benefits of journey mapping aimed at tracking customer activities to make data driven decisions. It covers major benefits such as team alignment, customer retention, improvement in messaging and customer centric culture with key drivers
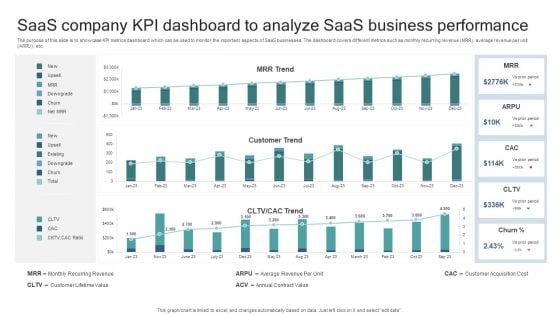
Saas Company KPI Dashboard To Analyze Saas Business Performance Elements PDF
The purpose of this slide is to showcase KPI metrics dashboard which can be used to monitor the important aspects of SaaS businesses. The dashboard covers different metrics such as monthly recurring revenue MRR, average revenue per unit ARPU, etc. Pitch your topic with ease and precision using this Saas Company KPI Dashboard To Analyze Saas Business Performance Elements PDF. This layout presents information on Monthly Recurring Revenue, Customer Lifetime Value, Average Revenue Per Unit, Annual Contract Value, Customer Acquisition Cost. It is also available for immediate download and adjustment. So, changes can be made in the color, design, graphics or any other component to create a unique layout.
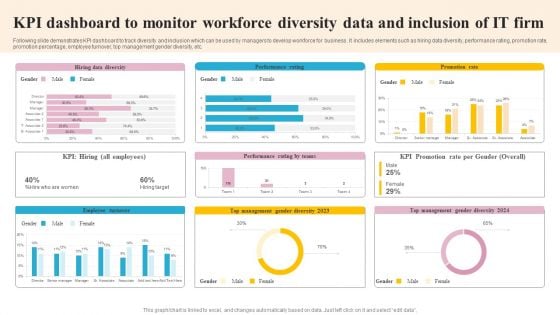
KPI Dashboard To Monitor Workforce Diversity Data And Inclusion Of IT Firm Slides PDF
Following slide demonstrates KPI dashboard to track diversity and inclusion which can be used by managers to develop workforce for business . It includes elements such as hiring data diversity, performance rating, promotion rate, promotion percentage, employee turnover, top management gender diversity, etc. Showcasing this set of slides titled KPI Dashboard To Monitor Workforce Diversity Data And Inclusion Of IT Firm Slides PDF. The topics addressed in these templates are Employee Turnover, Management, Promotion Rate. All the content presented in this PPT design is completely editable. Download it and make adjustments in color, background, font etc. as per your unique business setting.
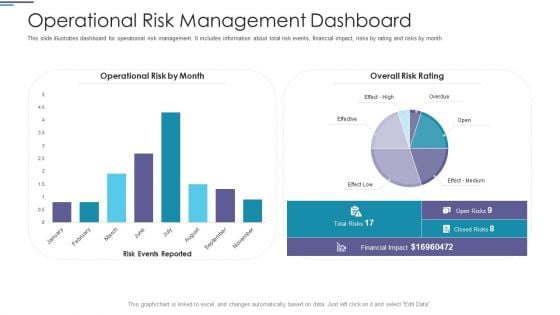
Operational Risk Management Dashboard Ppt PowerPoint Presentation Styles Pictures PDF
This slide illustrates dashboard for operational risk management. It includes information about total risk events, financial impact, risks by rating and risks by month.Deliver an awe-inspiring pitch with this creative operational risk management dashboard ppt powerpoint presentation styles pictures pdf. bundle. Topics like financial impact, operational risk by month, overall risk rating can be discussed with this completely editable template. It is available for immediate download depending on the needs and requirements of the user.
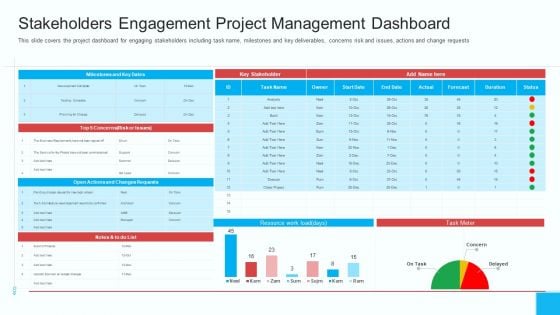
Stakeholders Engagement Project Management Dashboard Ppt Pictures Elements PDF
This slide covers the project dashboard for engaging stakeholders including task name, milestones and key deliverables, concerns risk and issues, actions and change requests Deliver an awe-inspiring pitch with this creative stakeholders engagement project management dashboard ppt pictures elements pdf bundle. Topics like actions and changes, resource, stakeholder can be discussed with this completely editable template. It is available for immediate download depending on the needs and requirements of the user.
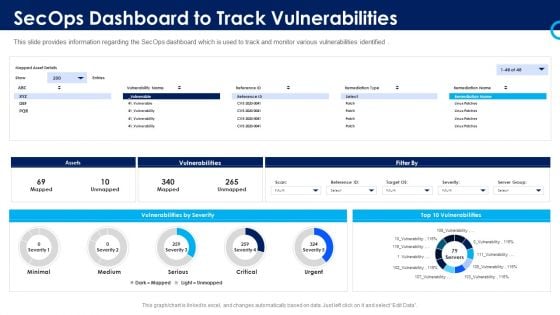
Organizational Security Solutions Secops Dashboard To Track Vulnerabilities Pictures PDF
This slide provides information regarding the SecOps dashboard which is used to track and monitor various vulnerabilities identified. Deliver and pitch your topic in the best possible manner with this organizational security solutions secops dashboard to track vulnerabilities pictures pdf. Use them to share invaluable insights on assets, vulnerabilities, severity and impress your audience. This template can be altered and modified as per your expectations. So, grab it now.
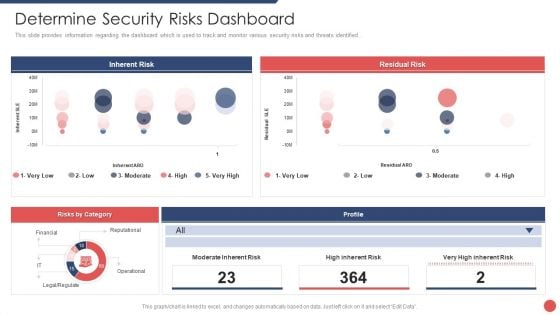
Security Functioning Centre Determine Security Risks Dashboard Pictures PDF
This slide provides information regarding the dashboard which is used to track and monitor various security risks and threats identified . Deliver an awe inspiring pitch with this creative security functioning centre determine security risks dashboard pictures pdf bundle. Topics like inherent risk, residual risk, profile can be discussed with this completely editable template. It is available for immediate download depending on the needs and requirements of the user.
Retail Trading Platform Ecommerce Website Performance Tracking Dashboard Pictures PDF
This slide provides information regarding ecommerce website performance tracking dashboard addressing page views, website conversions, etc. Deliver and pitch your topic in the best possible manner with this retail trading platform ecommerce website performance tracking dashboard pictures pdf. Use them to share invaluable insights on website performance month, website conversions last 7 days, website overview today and impress your audience. This template can be altered and modified as per your expectations. So, grab it now.
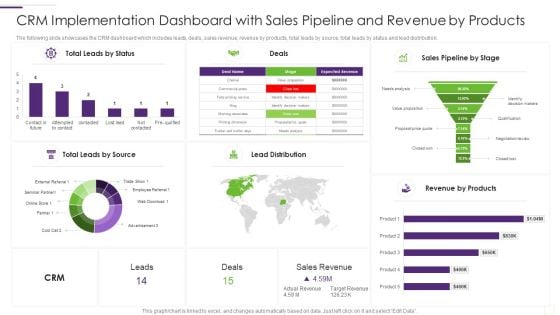
CRM Implementation Strategy CRM Implementation Dashboard With Sales Pictures PDF
The following slide showcases the CRM dashboard which includes leads, deals, sales revenue, revenue by products, total leads by source, total leads by status and lead distribution.Deliver and pitch your topic in the best possible manner with this CRM Implementation Strategy CRM Implementation Dashboard With Sales Pictures PDF Use them to share invaluable insights on Leads By Status, Leads By Source, Lead Distribution and impress your audience. This template can be altered and modified as per your expectations. So, grab it now.
KPI Dashboard For Tracking Project Team Performance Pictures PDF
Following slide illustrates performance monitoring dashboard that can be used by managers to track their developers team efficiency. It also includes details about billable and non billable hours along with task summary.Deliver an awe inspiring pitch with this creative KPI Dashboard For Tracking Project Team Performance Pictures PDF bundle. Topics like Task Summary, Employee Productivity, Project Manager can be discussed with this completely editable template. It is available for immediate download depending on the needs and requirements of the user.
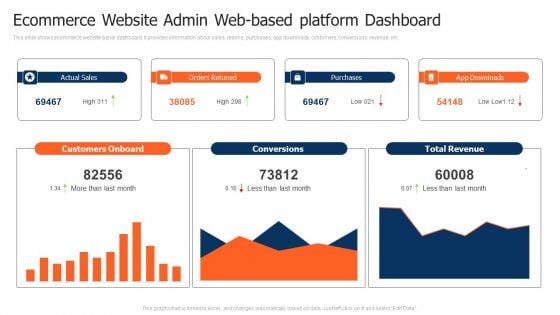
Ecommerce Website Admin Web Based Platform Dashboard Pictures PDF
This slide shows ecommerce website panel dashboard. It provides information about sales, returns, purchases, app downloads, customers, conversions, revenue, etc. Pitch your topic with ease and precision using this Ecommerce Website Admin Web Based Platform Dashboard Pictures PDF. This layout presents information on Customers Onboard, Purchases, Total Revenue. It is also available for immediate download and adjustment. So, changes can be made in the color, design, graphics or any other component to create a unique layout.
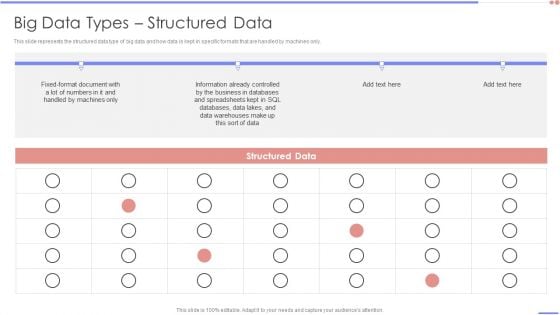
Data Analytics Management Big Data Types Structured Data Introduction PDF
This slide represents the structured data type of big data and how data is kept in specific formats that are handled by machines only.Deliver an awe inspiring pitch with this creative Data Analytics Management Big Data Types Structured Data Introduction PDF bundle. Topics like Handled By Machines, Information, Business Databases can be discussed with this completely editable template. It is available for immediate download depending on the needs and requirements of the user.
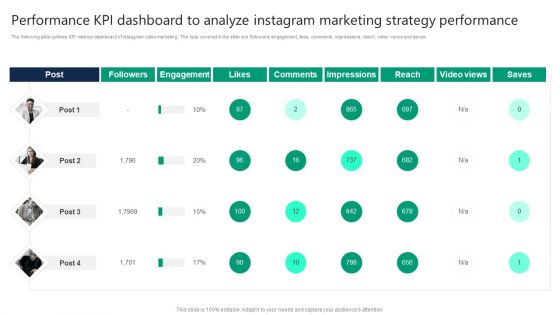
Performance Kpi Dashboard To Analyze Instagram Marketing Strategy Performance Introduction PDF
The following slide outlines KPI metrics dashboard of instagram video marketing. The kpis covered in the slide are followers, engagement, likes, comments, impressions, reach, video views and saves. The best PPT templates are a great way to save time, energy, and resources. Slidegeeks have 100 percent editable powerpoint slides making them incredibly versatile. With these quality presentation templates, you can create a captivating and memorable presentation by combining visually appealing slides and effectively communicating your message. Download Performance Kpi Dashboard To Analyze Instagram Marketing Strategy Performance Introduction PDF from Slidegeeks and deliver a wonderful presentation.

Creating And Introducing A Web Based Application Performance Dashboard Guidelines PDF
This slide covers application performance in market KPIs and metrics such as impressions, clicks, searches for app, conversion rate etc, Get a simple yet stunning designed Creating And Introducing A Web Based Application Performance Dashboard Guidelines PDF. It is the best one to establish the tone in your meetings. It is an excellent way to make your presentations highly effective. So, download this PPT today from Slidegeeks and see the positive impacts. Our easy-to-edit Creating And Introducing A Web Based Application Performance Dashboard Guidelines PDF can be your go-to option for all upcoming conferences and meetings. So, what are you waiting for Grab this template today.
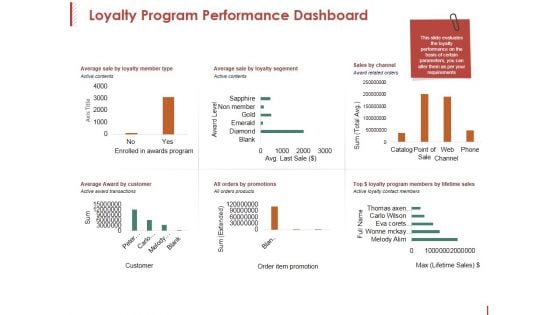
Loyalty Program Performance Dashboard Ppt PowerPoint Presentation Pictures Clipart
This is a loyalty program performance dashboard ppt powerpoint presentation pictures clipart. This is a six stage process. The stages in this process are axis title, award level, sum, active contents, channel.
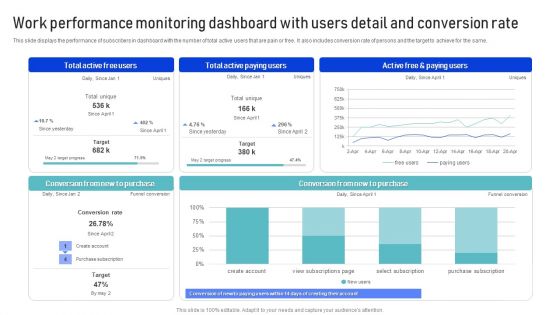
Work Performance Monitoring Dashboard With Users Detail And Conversion Rate Template PDF
This slide displays the performance of subscribers in dashboard with the number of total active users that are pain or free. It also includes conversion rate of persons and the target to achieve for the same. Showcasing this set of slides titled Work Performance Monitoring Dashboard With Users Detail And Conversion Rate Template PDF. The topics addressed in these templates are Purchase, Conversion Rate, Target. All the content presented in this PPT design is completely editable. Download it and make adjustments in color, background, font etc. as per your unique business setting.
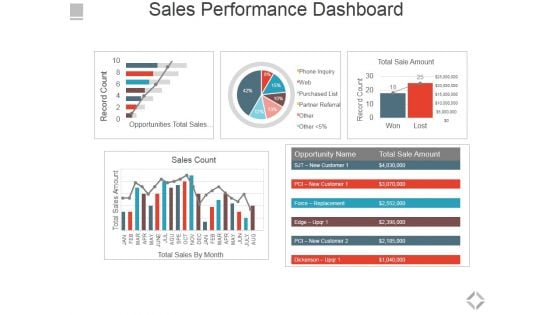
Sales Performance Dashboard Ppt PowerPoint Presentation File Graphics Pictures
This is a sales performance dashboard ppt powerpoint presentation file graphics pictures. This is a five stage process. The stages in this process are total sales by month, sales count, opportunities total sales by probability, total sale amount.
Data Project Lifecycle Management Dashboard To Ensure Better Decision Making Icons PDF
This slide covers data lifecycle management dashboard to ensure better decision making. It involves details such as capacity based on department, classification of files and email audit.Showcasing this set of slides titled Data Project Lifecycle Management Dashboard To Ensure Better Decision Making Icons PDF. The topics addressed in these templates are Redudant Content, Abandoned Files, Capacity Department. All the content presented in this PPT design is completely editable. Download it and make adjustments in color, background, font etc. as per your unique business setting.

Dashboard Depicting Website Data Insights Creating Branding Techniques To Increase Brand Awareness Structure PDF
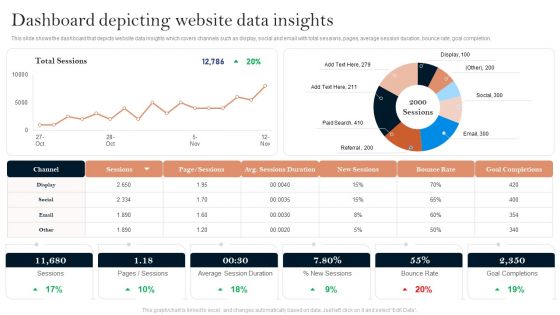
This slide shows the dashboard that depicts website data insights which covers channels such as display, social and email with total sessions, pages, average session duration, bounce rate, goal completion.Do you have to make sure that everyone on your team knows about any specific topic I yes, then you should give Dashboard Depicting Website Data Insights Creating Branding Techniques To Increase Brand Awareness Structure PDF a try. Our experts have put a lot of knowledge and effort into creating this impeccable Dashboard Depicting Website Data Insights Creating Branding Techniques To Increase Brand Awareness Structure PDF. You can use this template for your upcoming presentations, as the slides are perfect to represent even the tiniest detail. You can download these templates from the Slidegeeks website and these are easy to edit. So grab these today.
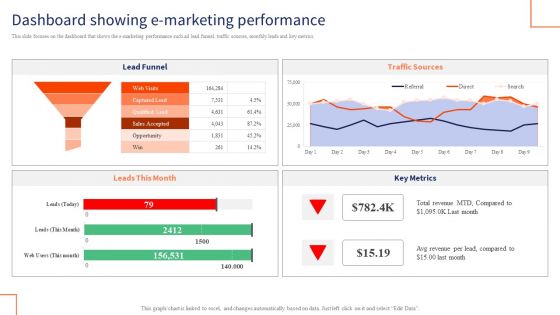
Optimizing Digital Channels To Enhance Marketing Strategy Dashboard Showing E Marketing Performance Brochure PDF
This slide focuses on the dashboard that shows the e marketing performance such ad lead funnel, traffic sources, monthly leads and key metrics. Do you know about Slidesgeeks Optimizing Digital Channels To Enhance Marketing Strategy Dashboard Showing E Marketing Performance Brochure PDF These are perfect for delivering any kind od presentation. Using it, create PowerPoint presentations that communicate your ideas and engage audiences. Save time and effort by using our pre designed presentation templates that are perfect for a wide range of topic. Our vast selection of designs covers a range of styles, from creative to business, and are all highly customizable and easy to edit. Download as a PowerPoint template or use them as Google Slides themes.
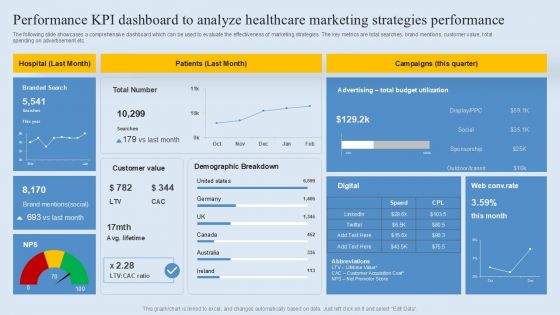
Performance KPI Dashboard To Analyze Healthcare Marketing Strategies Performance Guidelines PDF
Insurance And Financial Product Insurance Agency Activities Tracking Dashboard Download PDF
This slide provides glimpse about insurance agency activities tracking dashboard which help management in monitoring activities. Deliver an awe inspiring pitch with this creative Insurance And Financial Product Insurance Agency Activities Tracking Dashboard Download PDF bundle. Topics like Scheduled Reports, Pending Activities, Latest Customers can be discussed with this completely editable template. It is available for immediate download depending on the needs and requirements of the user.
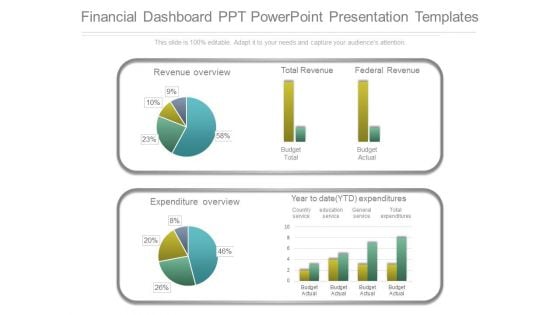
Financial Dashboard Ppt Powerpoint Presentation Templates
This is a financial dashboard ppt powerpoint presentation templates. This is a two stage process. The stages in this process are revenue overview, total revenue, federal revenue, budget total, budget actual, expenditure overview, year to date ytd expenditures, country service, education service, general service, total expenditures.
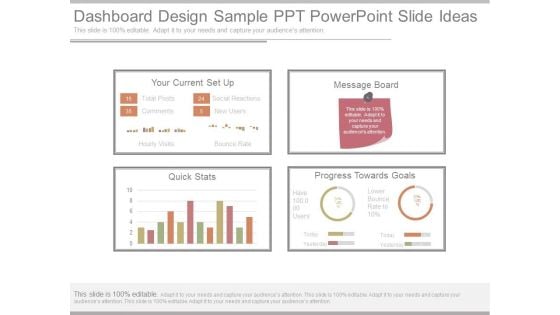
Dashboard Design Sample Ppt Powerpoint Slide Ideas
This is a dashboard design sample ppt powerpoint slide ideas. This is a four stage process. The stages in this process are your current setup, message board, quick stats, progress towards goals, total posts, comments, social reactions, new users, hourly visits, bounce rate.
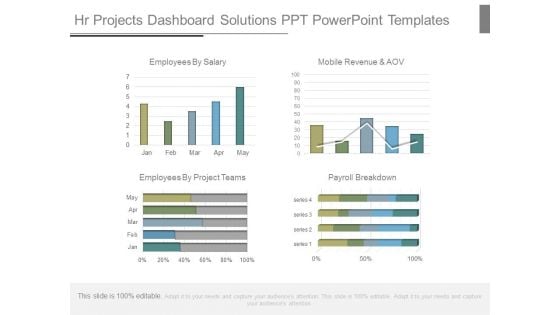
Hr Projects Dashboard Solutions Ppt Powerpoint Templates
This is a hr projects dashboard solutions ppt powerpoint templates. This is a four stage process. The stages in this process are employees by salary, mobile revenue and aov, employees by project teams, payroll breakdown, jan, feb, mar, apr, may, series.
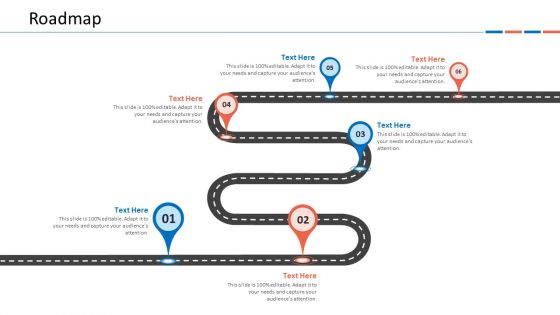
Customer Relationship Management Dashboard Roadmap Rules PDF
This is a customer relationship management dashboard roadmap rules pdf template with various stages. Focus and dispense information on six stages using this creative set, that comes with editable features. It contains large content boxes to add your information on topics like roadmap. You can also showcase facts, figures, and other relevant content using this PPT layout. Grab it now.
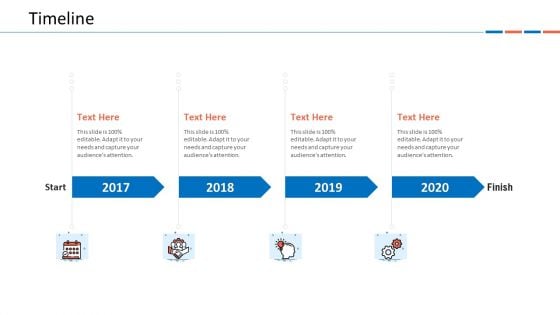
Customer Relationship Management Dashboard Timeline Introduction PDF
This is a customer relationship management dashboard timeline introduction pdf template with various stages. Focus and dispense information on four stages using this creative set, that comes with editable features. It contains large content boxes to add your information on topics like timeline 2017 to 2020. You can also showcase facts, figures, and other relevant content using this PPT layout. Grab it now.
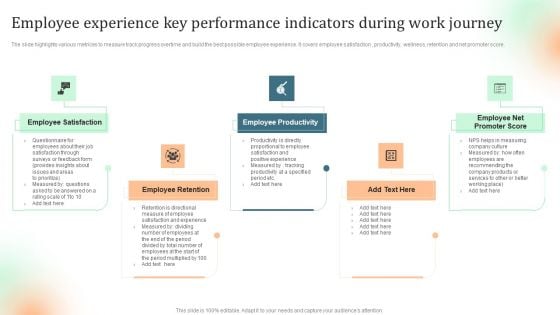
Employee Experience Key Performance Indicators During Work Journey Topics PDF
The slide highlights various metrices to measure track progress overtime and build the best possible employee experience. It covers employee satisfaction , productivity, wellness, retention and net promoter score. Presenting Employee Experience Key Performance Indicators During Work Journey Topics PDF to dispense important information. This template comprises five stages. It also presents valuable insights into the topics including Employee Productivity, Employee Retention, Employee Satisfaction. This is a completely customizable PowerPoint theme that can be put to use immediately. So, download it and address the topic impactfully.
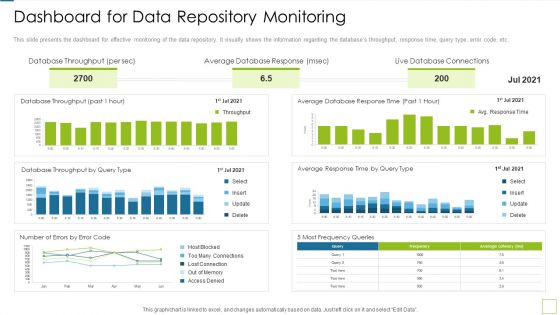
Database Expansion And Optimization Dashboard For Data Repository Monitoring Ppt Model Infographic Template
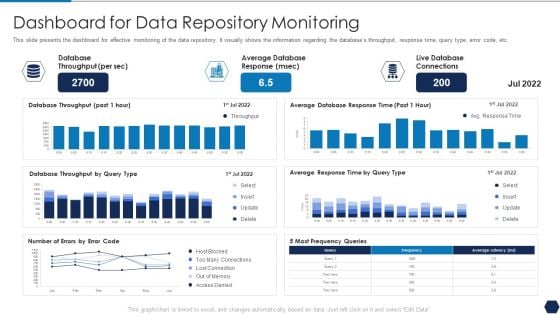
This slide presents the dashboard for effective monitoring of the data repository. It visually shows the information regarding the databases throughput, response time, query type, error code, etc. Deliver and pitch your topic in the best possible manner with this database expansion and optimization dashboard for data repository monitoring ppt model infographic template. Use them to share invaluable insights on database throughput, average database response, live database connections and impress your audience. This template can be altered and modified as per your expectations. So, grab it now.
Tactical Plan For Upgrading DBMS Dashboard For Data Repository Monitoring Diagrams PDF
This slide presents the dashboard for effective monitoring of the data repository. It visually shows the information regarding the databases throughput, response time, query type, error code, etc. Deliver and pitch your topic in the best possible manner with this tactical plan for upgrading dbms dashboard for data repository monitoring diagrams pdf. Use them to share invaluable insights on database throughput, average database response, live database connections and impress your audience. This template can be altered and modified as per your expectations. So, grab it now.
Retail Store Data Map Dashboard Ppt PowerPoint Presentation Gallery Display PDF
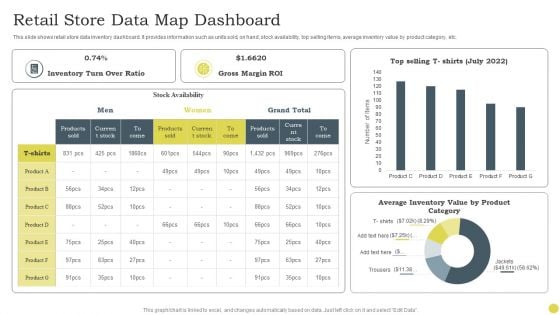
This slide shows retail store data inventory dashboard. It provides information such as units sold, on hand, stock availability, top selling items, average inventory value by product category, etc. Pitch your topic with ease and precision using this Retail Store Data Map Dashboard Ppt PowerPoint Presentation Gallery Display PDF. This layout presents information on Inventory Turn, Over Ratio, Gross Margin ROI. It is also available for immediate download and adjustment. So, changes can be made in the color, design, graphics or any other component to create a unique layout.
Personnel Salary Summary Dashboard With EPF And ESI Data Brochure PDF
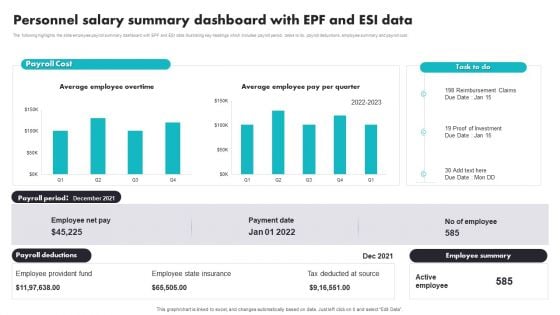
The following highlights the slide employee payroll summary dashboard with EPF and ESI data illustrating key headings which includes payroll period, tasks to do, payroll deductions, employee summary and payroll cost. Pitch your topic with ease and precision using this Personnel Salary Summary Dashboard With EPF And ESI Data Brochure PDF. This layout presents information on Employee Provident Fund, Employee State Insurance, Tax Deducted At Source. It is also available for immediate download and adjustment. So, changes can be made in the color, design, graphics or any other component to create a unique layout.
Successful Branding Technique For Electronic Commerce Corporation Dashboard Depicting Website Data Insights Microsoft PDF
Do you have to make sure that everyone on your team knows about any specific topic. I yes, then you should give Successful Branding Technique For Electronic Commerce Corporation Dashboard Depicting Website Data Insights Microsoft PDF a try. Our experts have put a lot of knowledge and effort into creating this impeccable Successful Branding Technique For Electronic Commerce Corporation Dashboard Depicting Website Data Insights Microsoft PDF. You can use this template for your upcoming presentations, as the slides are perfect to represent even the tiniest detail. You can download these templates from the Slidegeeks website and these are easy to edit. So grab these today.
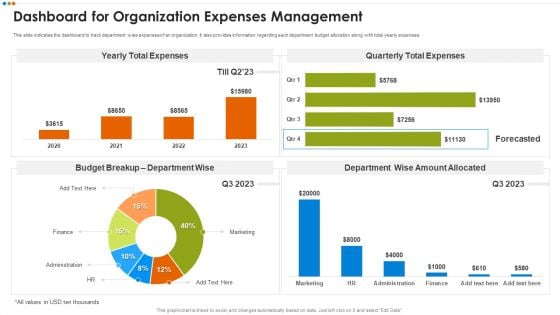
Quarterly Budget Analysis Of Business Organization Dashboard For Organization Expenses Microsoft PDF
This slide indicates the dashboard to track department wise expenses of an organization. It also provides information regarding each department budget allocation along with total yearly expenses.Deliver an awe inspiring pitch with this creative Quarterly Budget Analysis Of Business Organization Dashboard For Organization Expenses Microsoft PDF bundle. Topics like Budget Breakup, Quarterly Total Expenses, Department Wise Amount Allocated can be discussed with this completely editable template. It is available for immediate download depending on the needs and requirements of the user.
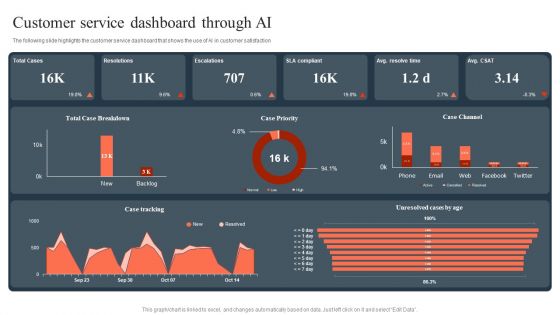
Ml And Big Data In Information Technology Processes Customer Service Dashboard Through AI Guidelines PDF
The following slide highlights the customer service dashboard that shows the use of AI in customer satisfaction Crafting an eye catching presentation has never been more straightforward. Let your presentation shine with this tasteful yet straightforward Ml And Big Data In Information Technology Processes Customer Service Dashboard Through AI Guidelines PDF template. It offers a minimalistic and classy look that is great for making a statement. The colors have been employed intelligently to add a bit of playfulness while still remaining professional. Construct the ideal Ml And Big Data In Information Technology Processes Customer Service Dashboard Through AI Guidelines PDF that effortlessly grabs the attention of your audience. Begin now and be certain to wow your customers.
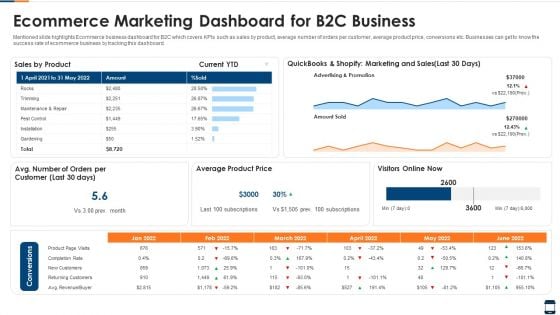
Ecommerce Marketing Dashboard For B2C Business Information PDF
Mentioned slide highlights Ecommerce business dashboard for B2C which covers KPIs such as sales by product, average number of orders per customer, average product price, conversions etc. Businesses can get to know the success rate of ecommerce business by tracking this dashboard. Showcasing this set of slides titled ecommerce marketing dashboard for b2c business information pdf. The topics addressed in these templates are ecommerce marketing dashboard for b2c business. All the content presented in this PPT design is completely editable. Download it and make adjustments in color, background, font etc. as per your unique business setting.
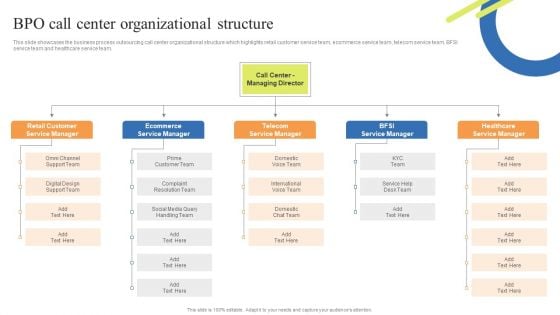
Customer Support Center BPO Call Center Organizational Structure Designs PDF
This slide showcases the business process outsourcing call center organizational structure which highlights retail customer service team, ecommerce service team, telecom service team, BFSI service team and healthcare service team. Slidegeeks is one of the best resources for PowerPoint templates. You can download easily and regulate Customer Support Center BPO Call Center Organizational Structure Designs PDF for your personal presentations from our wonderful collection. A few clicks is all it takes to discover and get the most relevant and appropriate templates. Use our Templates to add a unique zing and appeal to your presentation and meetings. All the slides are easy to edit and you can use them even for advertisement purposes.
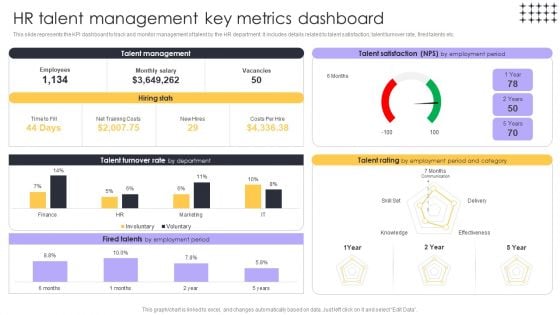
Tools For HR Business Analytics HR Talent Management Key Metrics Structure PDF
This slide represents the KPI dashboard to track and monitor management of talent by the HR department. It includes details related to talent satisfaction, talent turnover rate, fired talents etc. This modern and well-arranged Tools For HR Business Analytics HR Talent Management Key Metrics Structure PDF provides lots of creative possibilities. It is very simple to customize and edit with the Powerpoint Software. Just drag and drop your pictures into the shapes. All facets of this template can be edited with Powerpoint, no extra software is necessary. Add your own material, put your images in the places assigned for them, adjust the colors, and then you can show your slides to the world, with an animated slide included.
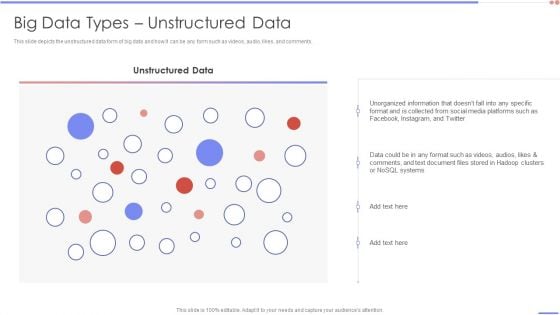
Data Analytics Management Big Data Types Unstructured Data Brochure PDF
This slide depicts the unstructured data form of big data and how it can be any form such as videos, audio, likes, and comments. Deliver and pitch your topic in the best possible manner with this Data Analytics Management Big Data Types Unstructured Data Brochure PDF. Use them to share invaluable insights on Unorganized Information, Format Collected, Document Stored and impress your audience. This template can be altered and modified as per your expectations. So, grab it now.
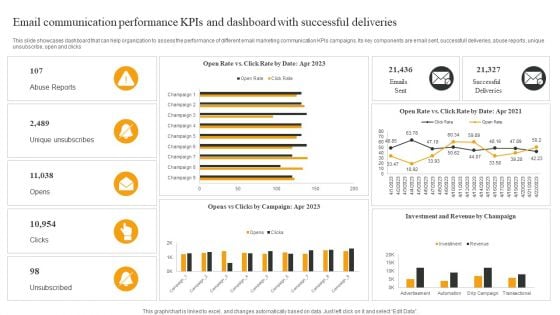
Email Communication Performance Kpis And Dashboard With Successful Deliveries Elements PDF
This slide showcases dashboard that can help organization to assess the performance of different email marketing communication KPIs campaigns. Its key components are email sent, successfull deliveries, abuse reports, unique unsubscribe, open and clicks. Showcasing this set of slides titled Email Communication Performance Kpis And Dashboard With Successful Deliveries Elements PDF. The topics addressed in these templates are Abuse Reports, Unique Unsubscribes, Opens. All the content presented in this PPT design is completely editable. Download it and make adjustments in color, background, font etc. as per your unique business setting.
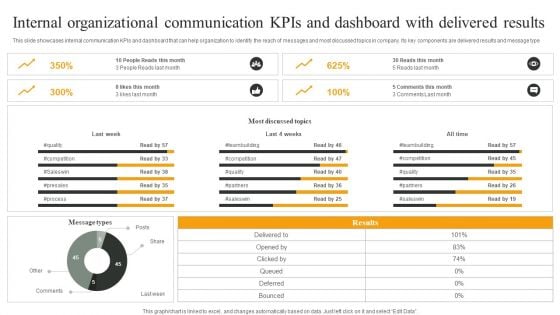
Internal Organizational Communication Kpis And Dashboard With Delivered Results Designs PDF
This slide showcases internal communication KPIs and dashboard that can help organization to identify the reach of messages and most discussed topics in company. Its key components are delivered results and message type. Showcasing this set of slides titled Internal Organizational Communication Kpis And Dashboard With Delivered Results Designs PDF. The topics addressed in these templates are Most Discussed Topics, All Time, Last Week. All the content presented in this PPT design is completely editable. Download it and make adjustments in color, background, font etc. as per your unique business setting.
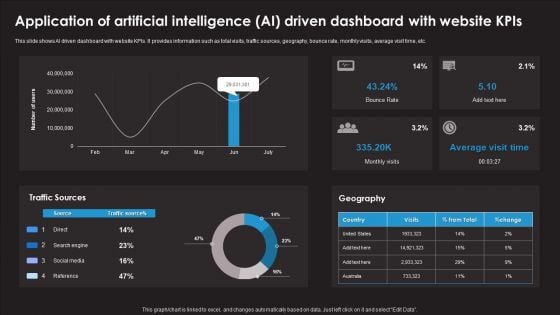
Application Of Artificial Intelligence AI Driven Dashboard With Website Kpis Formats PDF
This slide shows AI driven dashboard with website KPIs. It provides information such as total visits, traffic sources, geography, bounce rate, monthly visits, average visit time, etc. Showcasing this set of slides titled Application Of Artificial Intelligence AI Driven Dashboard With Website Kpis Formats PDF. The topics addressed in these templates are Bounce Rate, Monthly Visits, Traffic Sources. All the content presented in this PPT design is completely editable. Download it and make adjustments in color, background, font etc. as per your unique business setting.
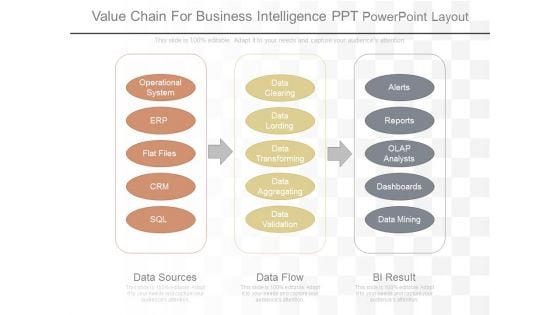
Value Chain For Business Intelligence Ppt Powerpoint Layout
This is a value chain for business intelligence ppt powerpoint layout. This is a three stage process. The stages in this process are operational system, erp, flat files, crm, sql, data sources, data clearing, data lording, data transforming, data aggregating, data validation, data flow, alerts, reports, olap analysts, dashboards, data mining, bi result.
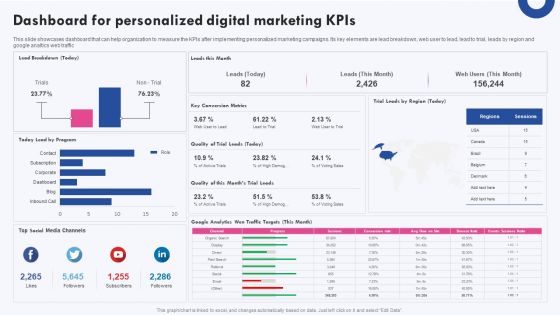
Targeted Marketing Campaigns To Improve Buyers Experience Dashboard For Personalized Digital Marketing Kpis Diagrams PDF
This slide showcases dashboard that can help organization to measure the KPIs after implementing personalized marketing campaigns. Its key elements are lead breakdown, web user to lead, lead to trial, leads by region and google analtics web traffic If you are looking for a format to display your unique thoughts, then the professionally designed Targeted Marketing Campaigns To Improve Buyers Experience Dashboard For Personalized Digital Marketing Kpis Diagrams PDF is the one for you. You can use it as a Google Slides template or a PowerPoint template. Incorporate impressive visuals, symbols, images, and other charts. Modify or reorganize the text boxes as you desire. Experiment with shade schemes and font pairings. Alter, share or cooperate with other people on your work. Download Targeted Marketing Campaigns To Improve Buyers Experience Dashboard For Personalized Digital Marketing Kpis Diagrams PDF and find out how to give a successful presentation. Present a perfect display to your team and make your presentation unforgettable.


 Continue with Email

 Home
Home


