Snapshot
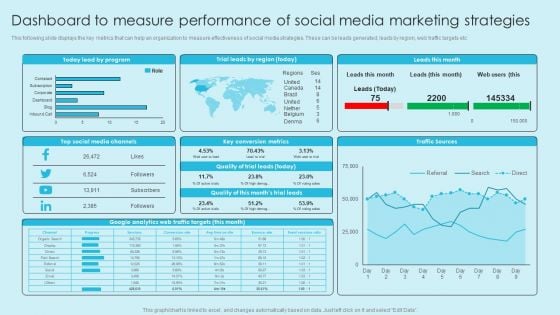
Online Marketing Techniques For Acquiring Clients Dashboard To Measure Performance Of Social Media Guidelines PDF
This following slide displays the key metrics that can help an organization to measure effectiveness of e commerce strategies. These can be revenue generated using e-commerce platform, conversion rates etc. This Online Marketing Techniques For Acquiring Clients Dashboard To Measure Performance Of Social Media Guidelines PDF from Slidegeeks makes it easy to present information on your topic with precision. It provides customization options, so you can make changes to the colors, design, graphics, or any other component to create a unique layout. It is also available for immediate download, so you can begin using it right away. Slidegeeks has done good research to ensure that you have everything you need to make your presentation stand out. Make a name out there for a brilliant performance.

Business Performance Review Dashboard To Measure Overall Business Performance Formats PDF
The following slide highlights a comprehensive quarterly business review QBR dashboard which can be used by the organization to evaluate business performance. The metrics used for review are total revenue, new customers, gross profit, overall costs, sales comparison, sales by different products and top performing channels. Showcasing this set of slides titled Business Performance Review Dashboard To Measure Overall Business Performance Formats PDF. The topics addressed in these templates are Sales Comparison, Sales Product, High Performing. All the content presented in this PPT design is completely editable. Download it and make adjustments in color, background, font etc. as per your unique business setting.
Success Metrics For Data Analytics Speculation Business Analysis Modification Toolkit Icons PDF
This slide shows the key success factors for evaluating the success of data analytics program. The foremost key metrics includes discovery, insights, outcomes and actions.Presenting Success Metrics For Data Analytics Speculation Business Analysis Modification Toolkit Icons PDF to provide visual cues and insights. Share and navigate important information on four stages that need your due attention. This template can be used to pitch topics like Observations Information, Generate Insights, Keys Success. In addtion, this PPT design contains high resolution images, graphics, etc, that are easily editable and available for immediate download.
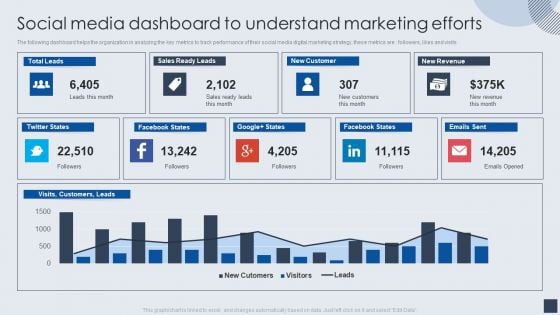
Implementing Marketing Mix Strategy To Enhance Overall Performance Social Media Dashboard To Understand Marketing Efforts Guidelines PDF
The following dashboard helps the organization in analyzing the key metrics to track performance of their social media digital marketing strategy, these metrics are followers, likes and visits. Deliver and pitch your topic in the best possible manner with this Implementing Marketing Mix Strategy To Enhance Overall Performance Social Media Dashboard To Understand Marketing Efforts Guidelines PDF. Use them to share invaluable insights on Sales, New Customer, New Revenue and impress your audience. This template can be altered and modified as per your expectations. So, grab it now.
Data Maturity Framework Assessment Icon Ppt PowerPoint Presentation Icon Infographic Template PDF
Presenting Data Maturity Framework Assessment Icon Ppt PowerPoint Presentation Icon Infographic Template PDF to dispense important information. This template comprises one stages. It also presents valuable insights into the topics including Data Maturity Framework, Assessment Icon. This is a completely customizable PowerPoint theme that can be put to use immediately. So, download it and address the topic impactfully.
Human Augmented Machine Learning IT Augmented Intelligence Information Tracking Dashboard Diagrams PDF
This slide depicts the information tracking dashboard by augmented intelligence model covering the data analysis. Data analysis includes image analysis, storage size, new users on the cloud platform, etc. Get a simple yet stunning designed Human Augmented Machine Learning IT Augmented Intelligence Information Tracking Dashboard Diagrams PDF. It is the best one to establish the tone in your meetings. It is an excellent way to make your presentations highly effective. So, download this PPT today from Slidegeeks and see the positive impacts. Our easy-to-edit Human Augmented Machine Learning IT Augmented Intelligence Information Tracking Dashboard Diagrams PDF can be your go-to option for all upcoming conferences and meetings. So, what are you waiting for. Grab this template today.
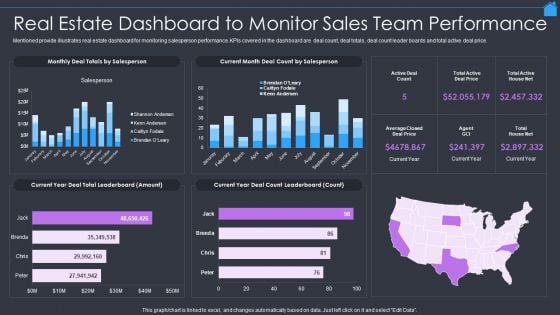
Marketing Strategy To Enhance Real Estate Sales Real Estate Dashboard To Monitor Sales Team Performance Infographics PDF
Mentioned provide illustrates real estate dashboard for monitoring salesperson performance. KPIs covered in the dashboard are deal count, deal totals, deal count leader boards and total active deal price. Deliver an awe inspiring pitch with this creative Marketing Strategy To Enhance Real Estate Sales Real Estate Dashboard To Monitor Sales Team Performance Infographics PDF bundle. Topics like Real Estate Dashboard, Monitor Sales Team Performance can be discussed with this completely editable template. It is available for immediate download depending on the needs and requirements of the user.
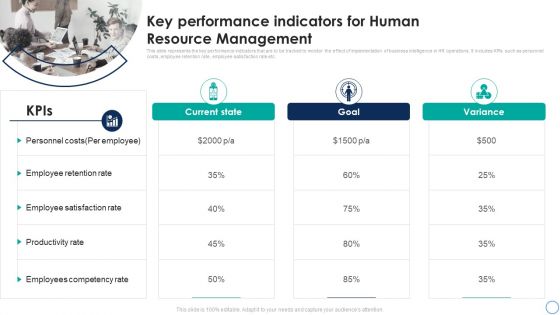
Business Analytics Application Key Performance Indicators For Human Resource Topics PDF
This slide represents the key performance indicators that are to be tracked to monitor the effect of implementation of business intelligence in HR operations. It includes KPIs such as personnel costs, employee retention rate, employee satisfaction rate etc. The Business Analytics Application Key Performance Indicators For Human Resource Topics PDF is a compilation of the most recent design trends as a series of slides. It is suitable for any subject or industry presentation, containing attractive visuals and photo spots for businesses to clearly express their messages. This template contains a variety of slides for the user to input data, such as structures to contrast two elements, bullet points, and slides for written information. Slidegeeks is prepared to create an impression.
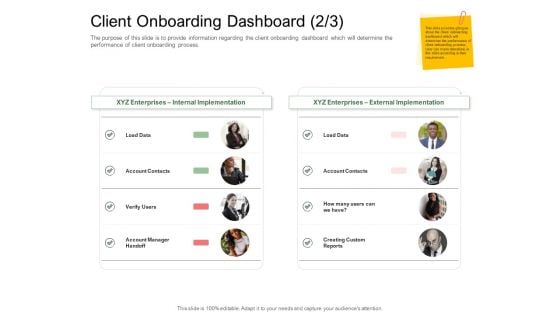
Digitization Of Client Onboarding Client Onboarding Dashboard Data Ppt Tips PDF
This is a digitization of client onboarding client onboarding dashboard data ppt tips pdf template with various stages. Focus and dispense information on two stages using this creative set, that comes with editable features. It contains large content boxes to add your information on topics like xyz enterprises internal implementation, xyz enterprises external implementation. You can also showcase facts, figures, and other relevant content using this PPT layout. Grab it now.
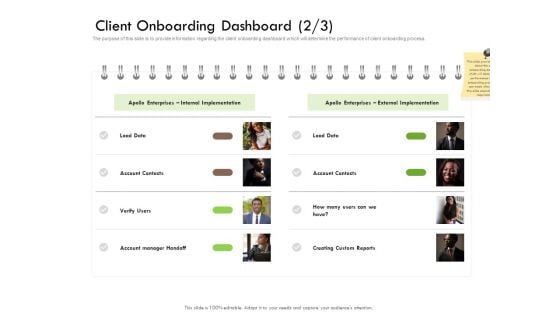
Future Of Customer Onboarding In Banks Client Onboarding Dashboard Data Ppt Infographic Template Slides PDF
This is a future of customer onboarding in banks client onboarding dashboard data ppt infographic template slides pdf template with various stages. Focus and dispense information on two stages using this creative set, that comes with editable features. It contains large content boxes to add your information on topics like xyz enterprises internal implementation, xyz enterprises external implementation. You can also showcase facts, figures, and other relevant content using this PPT layout. Grab it now.
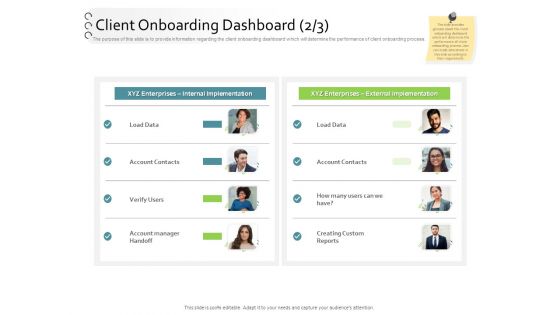
New Client Onboarding Automation Client Onboarding Dashboard Data Ppt Inspiration Format Ideas PDF
This is a new client onboarding automation client onboarding dashboard data ppt inspiration format ideas pdf template with various stages. Focus and dispense information on two stages using this creative set, that comes with editable features. It contains large content boxes to add your information on topics like xyz enterprises internal implementation, xyz enterprises external implementation. You can also showcase facts, figures, and other relevant content using this PPT layout. Grab it now.
Company Event Communication Dashboard For Tracking Event Revenue And Registrations Ideas PDF
This slide covers metrics for analyzing the event revenue and registrations. It includes KPIs such as gross revenue, gross revenue from promos, total refund, total registration, visits to purchase conversion, check-in- status, etc. There are so many reasons you need a Company Event Communication Dashboard For Tracking Event Revenue And Registrations Ideas PDF. The first reason is you can not spend time making everything from scratch, Thus, Slidegeeks has made presentation templates for you too. You can easily download these templates from our website easily.

Reputation Management Dashboard To Track Brands Effectiveness Pictures PDF
This slide provides information regarding reputation management to monitor brands effectiveness in terms of brand review summary, listing score, competition, listing accuracy, etc.Retrieve professionally designed Reputation Management Dashboard To Track Brands Effectiveness Pictures PDF to effectively convey your message and captivate your listeners. Save time by selecting pre-made slideshows that are appropriate for various topics, from business to educational purposes. These themes come in many different styles, from creative to corporate, and all of them are easily adjustable and can be edited quickly. Access them as PowerPoint templates or as Google Slides themes. You do not have to go on a hunt for the perfect presentation because Slidegeeks got you covered from everywhere.
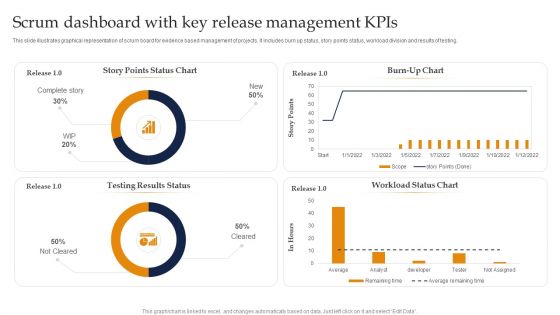
Scrum Dashboard With Key Release Management Kpis Ppt Summary Vector PDF
This slide illustrates graphical representation of scrum board for evidence based management of projects. It includes burn up status, story points status, workload division and results of testing. Showcasing this set of slides titled Scrum Dashboard With Key Release Management Kpis Ppt Summary Vector PDF. The topics addressed in these templates are Burn Up Chart, Workload Status Chart, Testing Results Status. All the content presented in this PPT design is completely editable. Download it and make adjustments in color, background, font etc. as per your unique business setting.
Integrating Logistics Automation Solution Shipping And Logistics Tracking Dashboard With Shipments And Fleet Status Ppt Ideas Model PDF
This slide covers Key performance indicators to track the automation system of the company. This dashboard includes Logistics Efficiency Status, delivery time accuracy etc. Make sure to capture your audiences attention in your business displays with our gratis customizable Integrating Logistics Automation Solution Shipping And Logistics Tracking Dashboard With Shipments And Fleet Status Ppt Ideas Model PDF. These are great for business strategies, office conferences, capital raising or task suggestions. If you desire to acquire more customers for your tech business and ensure they stay satisfied, create your own sales presentation with these plain slides.
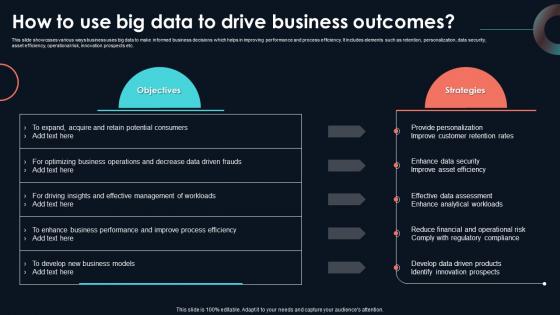
How To Use Big Data To Drive Business Developing Strategic Insights Using Big Data Analytics SS V
This slide showcases various ways business uses big data to make informed business decisions which helps in improving performance and process efficiency. It includes elements such as retention, personalization, data security, asset efficiency, operational risk, innovation prospects etc. Here you can discover an assortment of the finest PowerPoint and Google Slides templates. With these templates, you can create presentations for a variety of purposes while simultaneously providing your audience with an eye-catching visual experience. Download How To Use Big Data To Drive Business Developing Strategic Insights Using Big Data Analytics SS V to deliver an impeccable presentation. These templates will make your job of preparing presentations much quicker, yet still, maintain a high level of quality. Slidegeeks has experienced researchers who prepare these templates and write high-quality content for you. Later on, you can personalize the content by editing the How To Use Big Data To Drive Business Developing Strategic Insights Using Big Data Analytics SS V. This slide showcases various ways business uses big data to make informed business decisions which helps in improving performance and process efficiency. It includes elements such as retention, personalization, data security, asset efficiency, operational risk, innovation prospects etc.
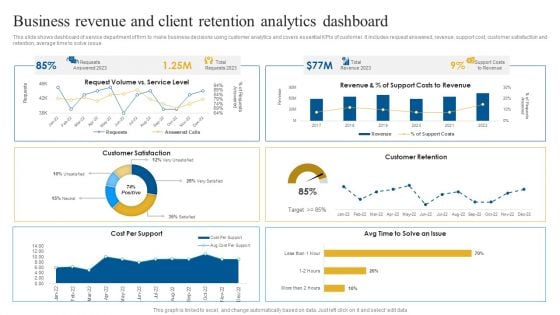
Business Revenue And Client Retention Analytics Dashboard Brochure PDF
This slide shows dashboard of service department of firm to make business decisions using customer analytics and covers essential KPIs of customer. It includes request answered, revenue, support cost, customer satisfaction and retention, average time to solve issue. Showcasing this set of slides titled Business Revenue And Client Retention Analytics Dashboard Brochure PDF. The topics addressed in these templates are Customer Satisfaction, Customer Retention, Revenue. All the content presented in this PPT design is completely editable. Download it and make adjustments in color, background, font etc. as per your unique business setting.
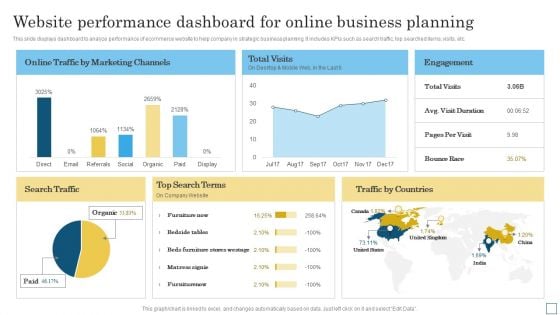
Website Performance Dashboard For Online Business Planning Graphics PDF
This slide displays dashboard to analyze performance of ecommerce website to help company in strategic business planning. It includes KPIs such as search traffic, top searched items, visits, etc. Showcasing this set of slides titled Website Performance Dashboard For Online Business Planning Graphics PDF. The topics addressed in these templates are Marketing Channels, Bounce Race, Search Traffic. All the content presented in this PPT design is completely editable. Download it and make adjustments in color, background, font etc. as per your unique business setting.
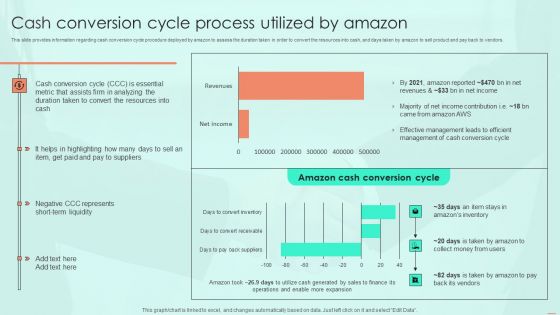
Cash Conversion Cycle Process Utilized By Amazon Ppt PowerPoint Presentation File Pictures PDF
This slide provides information regarding cash conversion cycle procedure deployed by amazon to assess the duration taken in order to convert the resources into cash, and days taken by amazon to sell product and pay back to vendors. Find a pre designed and impeccable Cash Conversion Cycle Process Utilized By Amazon Ppt PowerPoint Presentation File Pictures PDF. The templates can ace your presentation without additional effort. You can download these easy to edit presentation templates to make your presentation stand out from others. So, what are you waiting for Download the template from Slidegeeks today and give a unique touch to your presentation.
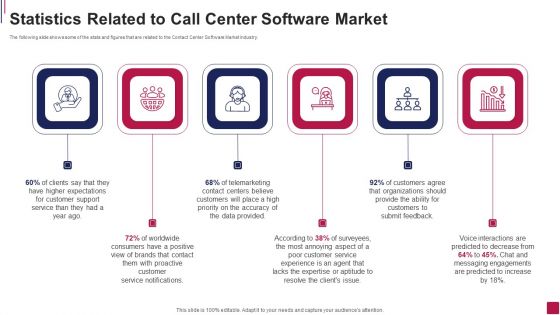
Statistics Related To Call Center Software Market Pictures PDF
The following slide shows some of the stats and figures that are related to the Contact Center Software Market Industry. This is a Statistics Related To Call Center Software Market Pictures PDF template with various stages. Focus and dispense information on six stages using this creative set, that comes with editable features. It contains large content boxes to add your information on topics like Higher Expectations, Customer Support, Telemarketing Contact You can also showcase facts, figures, and other relevant content using this PPT layout. Grab it now.
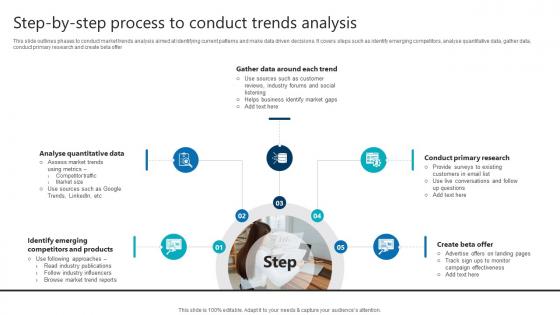
Step By Step Process To Conduct Trends Analysis Product Analytics Implementation Data Analytics V
This slide outlines phases to conduct market trends analysis aimed at identifying current patterns and make data driven decisions. It covers steps such as identify emerging competitors, analyse quantitative data, gather data, conduct primary research and create beta offerComing up with a presentation necessitates that the majority of the effort goes into the content and the message you intend to convey. The visuals of a PowerPoint presentation can only be effective if it supplements and supports the story that is being told. Keeping this in mind our experts created Step By Step Process To Conduct Trends Analysis Product Analytics Implementation Data Analytics V to reduce the time that goes into designing the presentation. This way, you can concentrate on the message while our designers take care of providing you with the right template for the situation. This slide outlines phases to conduct market trends analysis aimed at identifying current patterns and make data driven decisions. It covers steps such as identify emerging competitors, analyse quantitative data, gather data, conduct primary research and create beta offer
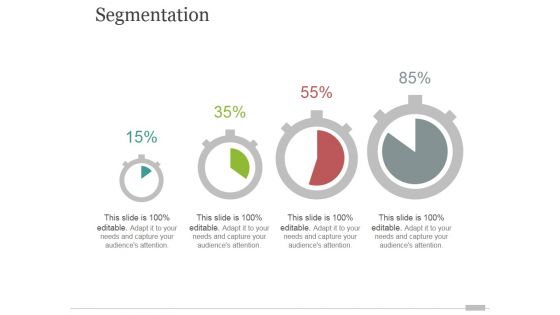
Segmentation Ppt PowerPoint Presentation Slides
This is a segmentation ppt powerpoint presentation slides. This is a four stage process. The stages in this process are business, marketing, strategy, success, process.
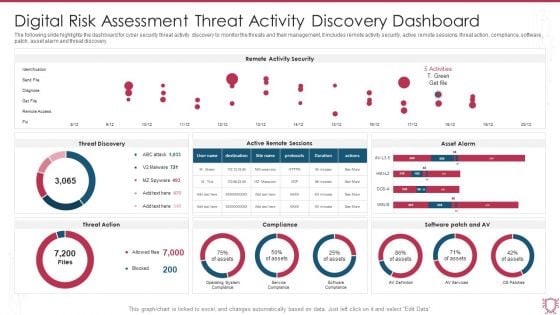
Digital Risk Assessment Threat Activity Discovery Dashboard Ppt Ideas Skills PDF
The following slide highlights the dashboard for cyber security threat activity discovery to monitor the threats and their management, it includes remote activity security, active remote sessions, threat action, compliance, software patch, asset alarm and threat discovery. Pitch your topic with ease and precision using this Digital Risk Assessment Threat Activity Discovery Dashboard Ppt Ideas Skills PDF. This layout presents information on Remote Activity Security, Threat Discovery, Asset Alarm. It is also available for immediate download and adjustment. So, changes can be made in the color, design, graphics or any other component to create a unique layout.
Data Analytics Planning With Key Performance Indicators Ppt PowerPoint Presentation Icon Infographic Template PDF
Presenting data analytics planning with key performance indicators ppt powerpoint presentation icon infographic template pdf to dispense important information. This template comprises four stages. It also presents valuable insights into the topics including performance, business, strategy. This is a completely customizable PowerPoint theme that can be put to use immediately. So, download it and address the topic impactfully.
Implementing Fixed Asset Management Fixed Asset Management Dashboard For Tracking Summary PDF
This slide represents fixed asset management dashboard for tracking equipment performance. It includes work management, downtime, work orders etc. Deliver and pitch your topic in the best possible manner with this Implementing Fixed Asset Management Fixed Asset Management Dashboard For Tracking Summary PDF. Use them to share invaluable insights on Data Sets, Asset Details, Labour Analysis, Purchasing Spend and impress your audience. This template can be altered and modified as per your expectations. So, grab it now.
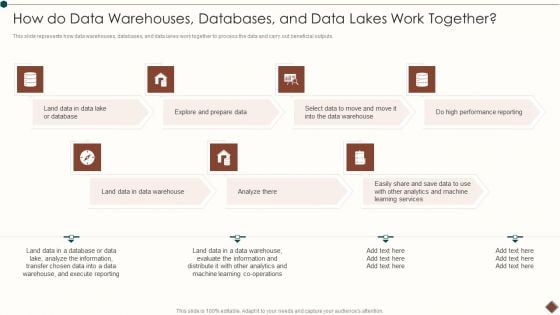
Data Warehouse Implementation How Do Data Warehouses Databases And Data Lakes Work Together Microsoft PDF
This slide represents how data warehouses, databases, and data lakes work together to process the data and carry out beneficial outputs.Deliver and pitch your topic in the best possible manner with this Data Warehouse Implementation How Do Data Warehouses Databases And Data Lakes Work Together Microsoft PDF. Use them to share invaluable insights on Analyze Information, Execute Reporting, Evaluate Information and impress your audience. This template can be altered and modified as per your expectations. So, grab it now.
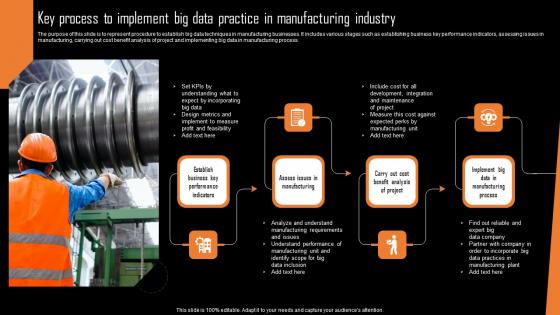
Key Process To Implement Big Data Practice In Manufacturing Industry Diagrams Pdf
The purpose of this slide is to represent procedure to establish big data techniques in manufacturing businesses. It includes various stages such as establishing business key performance indicators, assessing issues in manufacturing, carrying out cost benefit analysis of project and implementing big data in manufacturing process.Showcasing this set of slides titled Key Process To Implement Big Data Practice In Manufacturing Industry Diagrams Pdf The topics addressed in these templates are Expect Incorporating, Understand Performance, Manufacturing Plant All the content presented in this PPT design is completely editable. Download it and make adjustments in color, background, font etc. as per your unique business setting. The purpose of this slide is to represent procedure to establish big data techniques in manufacturing businesses. It includes various stages such as establishing business key performance indicators, assessing issues in manufacturing, carrying out cost benefit analysis of project and implementing big data in manufacturing process.
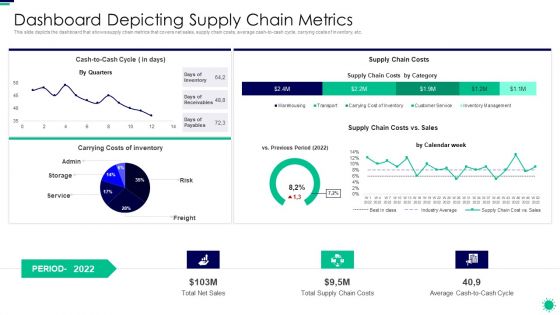
Purpose Digital Twin Internet Things Reducing Costs After COVID Era Dashboard Depicting Supply Introduction PDF
This slide depicts the dashboard that shows supply chain metrics that covers net sales, supply chain costs, average cash to cash cycle, carrying costs of inventory, etc. Deliver an awe inspiring pitch with this creative purpose digital twin internet things reducing costs after covid era dashboard depicting supply introduction pdf bundle. Topics like dashboard depicting supply chain metrics can be discussed with this completely editable template. It is available for immediate download depending on the needs and requirements of the user.
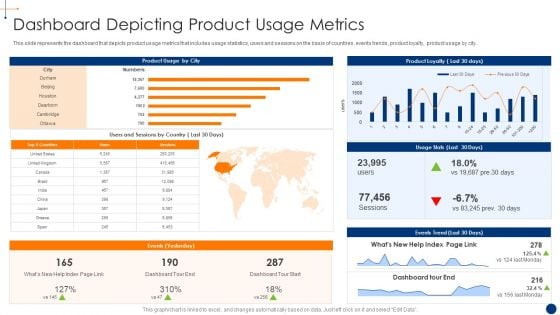
New Product Development Process Optimization Dashboard Depicting Product Usage Structure PDF
This slide represents the dashboard that depicts product usage metrics that includes usage statistics, users and sessions on the basis of countries, events trends, product loyalty, product usage by city.Deliver an awe inspiring pitch with this creative new product development process optimization dashboard depicting product usage structure pdf bundle. Topics like dashboard depicting product usage metrics can be discussed with this completely editable template. It is available for immediate download depending on the needs and requirements of the user.
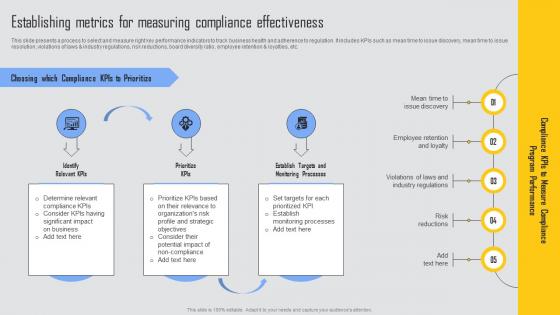
Establishing Metrics Measuring Managing Risks And Establishing Trust Through Efficient Ideas Pdf
This slide presents a process to select and measure right key performance indicators to track business health and adherence to regulation. It includes KPIs such as mean time to issue discovery, mean time to issue resolution, violations of laws and industry regulations, risk reductions, board diversity ratio, employee retention and loyalties, etc. Do you have to make sure that everyone on your team knows about any specific topic I yes, then you should give Establishing Metrics Measuring Managing Risks And Establishing Trust Through Efficient Ideas Pdf a try. Our experts have put a lot of knowledge and effort into creating this impeccable Establishing Metrics Measuring Managing Risks And Establishing Trust Through Efficient Ideas Pdf. You can use this template for your upcoming presentations, as the slides are perfect to represent even the tiniest detail. You can download these templates from the Slidegeeks website and these are easy to edit. So grab these today This slide presents a process to select and measure right key performance indicators to track business health and adherence to regulation. It includes KPIs such as mean time to issue discovery, mean time to issue resolution, violations of laws and industry regulations, risk reductions, board diversity ratio, employee retention and loyalties, etc.
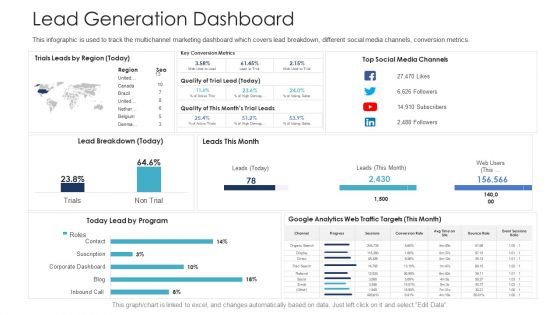
B2C Marketing Initiatives Strategies For Business Lead Generation Dashboard Ppt Styles Styles PDF
This infographic is used to track the multichannel marketing dashboard which covers lead breakdown, different social media channels, conversion metrics. Deliver and pitch your topic in the best possible manner with this B2C marketing initiatives strategies for business lead generation dashboard ppt styles styles pdf. Use them to share invaluable insights on social media channels, lead by program, analytics web traffic targets and impress your audience. This template can be altered and modified as per your expectations. So, grab it now.
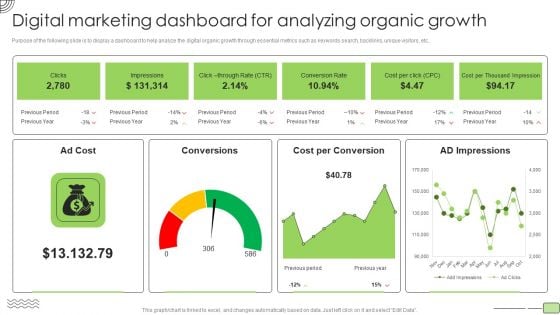
Organic Business Growth Strategies Digital Marketing Dashboard For Analyzing Organic Growth Introduction PDF
Purpose of the following slide is to display a dashboard to help analyze the digital organic growth through essential metrics such as keywords search, backlinks, unique visitors, etc. Deliver an awe inspiring pitch with this creative Organic Business Growth Strategies Digital Marketing Dashboard For Analyzing Organic Growth Introduction PDF bundle. Topics like Cost, Conversion Rate, Analyzing Organic Growth can be discussed with this completely editable template. It is available for immediate download depending on the needs and requirements of the user.

Financial Data Analysis For Risk Management Ppt PowerPoint Presentation Slides Picture
Presenting this set of slides with name financial data analysis for risk management ppt powerpoint presentation slides picture. This is a one stage process. The stages in this process are risk framework, risk management, planning process. This is a completely editable PowerPoint presentation and is available for immediate download. Download now and impress your audience.
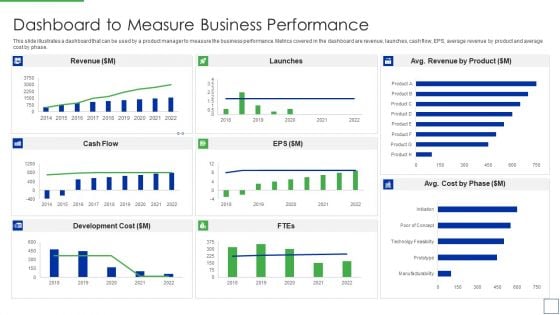
Product Portfolio Management For New Target Region Dashboard To Measure Business Rules PDF
This slide illustrates a dashboard that can be used by a product manager to measure the business performance. Metrics covered in the dashboard are revenue, launches, cash flow, EPS, average revenue by product and average cost by phase.Deliver and pitch your topic in the best possible manner with this Product Portfolio Management For New Target Region Dashboard To Measure Business Rules PDF Use them to share invaluable insights on Dashboard to Measure Business Performance and impress your audience. This template can be altered and modified as per your expectations. So, grab it now.
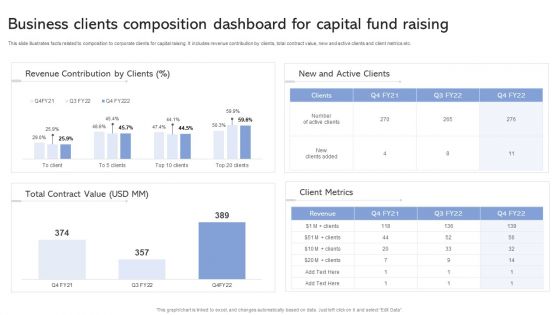
Business Clients Composition Dashboard For Capital Fund Raising Ppt Infographic Template Microsoft PDF
This slide illustrates facts related to composition to corporate clients for capital raising. It includes revenue contribution by clients, total contract value, new and active clients and client metrics etc. Showcasing this set of slides titled Business Clients Composition Dashboard For Capital Fund Raising Ppt Infographic Template Microsoft PDF. The topics addressed in these templates are Revenue Contribution Clients, Client Metrics, Total Contract Value. All the content presented in this PPT design is completely editable. Download it and make adjustments in color, background, font etc. as per your unique business setting.
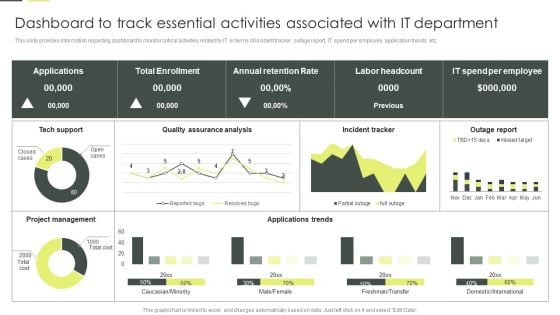
Dashboard To Track Essential Activities Associated With IT Department Brochure PDF
This slide provides information regarding dashboard to monitor critical activities related to IT in terms of incident tracker, outage report, IT spend per employee, application trends, etc. Slidegeeks is one of the best resources for PowerPoint templates. You can download easily and regulate Dashboard To Track Essential Activities Associated With IT Department Brochure PDF for your personal presentations from our wonderful collection. A few clicks is all it takes to discover and get the most relevant and appropriate templates. Use our Templates to add a unique zing and appeal to your presentation and meetings. All the slides are easy to edit and you can use them even for advertisement purposes.
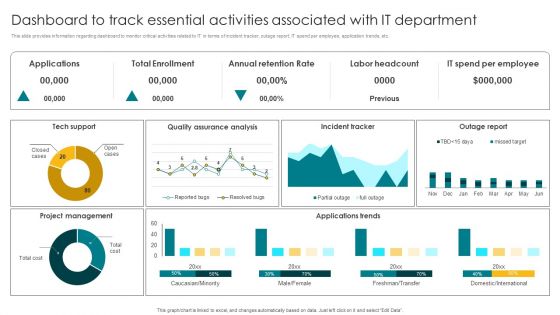
Dashboard To Track Essential Activities Associated With IT Department Inspiration PDF
This slide provides information regarding dashboard to monitor critical activities related to IT in terms of incident tracker, outage report, IT spend per employee, application trends, etc. Find a pre designed and impeccable Dashboard To Track Essential Activities Associated With IT Department Inspiration PDF. The templates can ace your presentation without additional effort. You can download these easy to edit presentation templates to make your presentation stand out from others. So, what are you waiting for Download the template from Slidegeeks today and give a unique touch to your presentation.
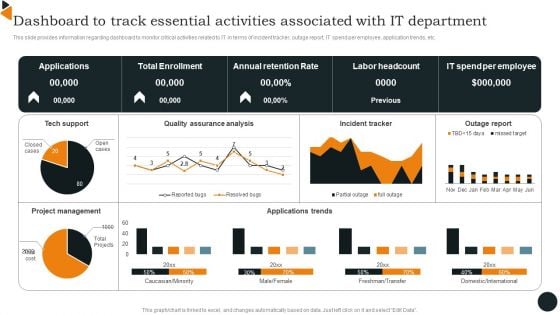
Dashboard To Track Essential Activities Associated With IT Department Demonstration PDF
This slide provides information regarding dashboard to monitor critical activities related to IT in terms of incident tracker, outage report, IT spend per employee, application trends, etc. Slidegeeks is one of the best resources for PowerPoint templates. You can download easily and regulate Dashboard To Track Essential Activities Associated With IT Department Demonstration PDF for your personal presentations from our wonderful collection. A few clicks is all it takes to discover and get the most relevant and appropriate templates. Use our Templates to add a unique zing and appeal to your presentation and meetings. All the slides are easy to edit and you can use them even for advertisement purposes.
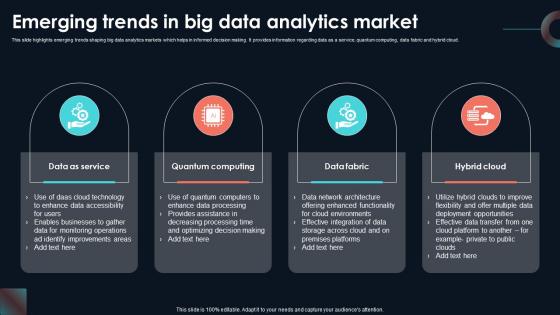
Emerging Trends In Big Data Analytics Developing Strategic Insights Using Big Data Analytics SS V
This slide highlights emerging trends shaping big data analytics markets which helps in informed decision making. It provides information regarding data as a service, quantum computing, data fabric and hybrid cloud. The Emerging Trends In Big Data Analytics Developing Strategic Insights Using Big Data Analytics SS V is a compilation of the most recent design trends as a series of slides. It is suitable for any subject or industry presentation, containing attractive visuals and photo spots for businesses to clearly express their messages. This template contains a variety of slides for the user to input data, such as structures to contrast two elements, bullet points, and slides for written information. Slidegeeks is prepared to create an impression. This slide highlights emerging trends shaping big data analytics markets which helps in informed decision making. It provides information regarding data as a service, quantum computing, data fabric and hybrid cloud.
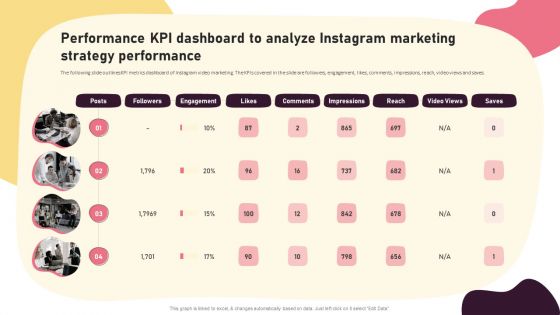
Video Promotion Techniques Performance KPI Dashboard To Analyze Instagram Marketing Portrait PDF
The following slide outlines KPI metrics dashboard of Instagram video marketing. The KPIs covered in the slide are followers, engagement, likes, comments, impressions, reach, video views and saves. Here you can discover an assortment of the finest PowerPoint and Google Slides templates. With these templates, you can create presentations for a variety of purposes while simultaneously providing your audience with an eye-catching visual experience. Download Video Promotion Techniques Performance KPI Dashboard To Analyze Instagram Marketing Portrait PDF to deliver an impeccable presentation. These templates will make your job of preparing presentations much quicker, yet still, maintain a high level of quality. Slidegeeks has experienced researchers who prepare these templates and write high-quality content for you. Later on, you can personalize the content by editing the Video Promotion Techniques Performance KPI Dashboard To Analyze Instagram Marketing Portrait PDF.
Optimizing Marketing Analytics To Enhance Organizational Growth Website Landing Page KPI Tracking Dashboard Graphics PDF
This slide covers a dashboard for analysing the metrics of the website landing page. It includes KPIs such as conversions, conversion rate, sessions, bounce rate, engagement sickness, etc. Do you have an important presentation coming up Are you looking for something that will make your presentation stand out from the rest Look no further than Optimizing Marketing Analytics To Enhance Organizational Growth Website Landing Page KPI Tracking Dashboard Graphics PDF. With our professional designs, you can trust that your presentation will pop and make delivering it a smooth process. And with Slidegeeks, you can trust that your presentation will be unique and memorable. So why wait Grab Optimizing Marketing Analytics To Enhance Organizational Growth Website Landing Page KPI Tracking Dashboard Graphics PDF today and make your presentation stand out from the rest.
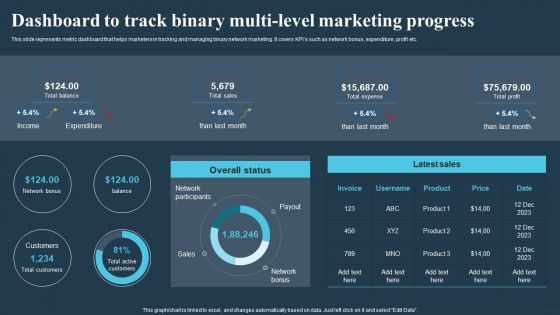
Comprehensive Guide For Multi Level Dashboard To Track Binary Multi Level Marketing Formats PDF
This slide represents metric dashboard that helps marketers in tracking and managing binary network marketing. It covers KPIs such as network bonus, expenditure, profit etc. This Comprehensive Guide For Multi Level Dashboard To Track Binary Multi Level Marketing Formats PDF is perfect for any presentation, be it in front of clients or colleagues. It is a versatile and stylish solution for organizing your meetings. The Comprehensive Guide For Multi Level Dashboard To Track Binary Multi Level Marketing Formats PDF features a modern design for your presentation meetings. The adjustable and customizable slides provide unlimited possibilities for acing up your presentation. Slidegeeks has done all the homework before launching the product for you. So, dont wait, grab the presentation templates today.
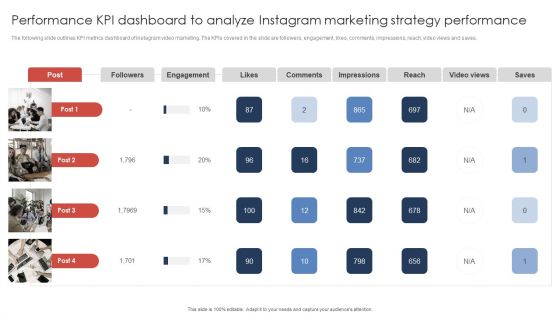
Performance Kpi Dashboard To Analyze Instagram Marketing Strategy Performance Microsoft PDF
The following slide outlines KPI metrics dashboard of Instagram video marketing. The KPIs covered in the slide are followers, engagement, likes, comments, impressions, reach, video views and saves. Find highly impressive Performance Kpi Dashboard To Analyze Instagram Marketing Strategy Performance Microsoft PDF on Slidegeeks to deliver a meaningful presentation. You can save an ample amount of time using these presentation templates. No need to worry to prepare everything from scratch because Slidegeeks experts have already done a huge research and work for you. You need to download Performance Kpi Dashboard To Analyze Instagram Marketing Strategy Performance Microsoft PDF for your upcoming presentation. All the presentation templates are 100 percent editable and you can change the color and personalize the content accordingly. Download now.
Talent Retention Initiatives For New Hire Onboarding Performance Dashboard Tracking Introduction PDF
This slide represents a dashboard tracking employee experience KPIs. It includes information about metrics such as employee engagement, experience vs expectation and intent to stay. Do you have to make sure that everyone on your team knows about any specific topic I yes, then you should give Talent Retention Initiatives For New Hire Onboarding Performance Dashboard Tracking Introduction PDF a try. Our experts have put a lot of knowledge and effort into creating this impeccable Talent Retention Initiatives For New Hire Onboarding Performance Dashboard Tracking Introduction PDF. You can use this template for your upcoming presentations, as the slides are perfect to represent even the tiniest detail. You can download these templates from the Slidegeeks website and these are easy to edit. So grab these today.
Naas Architectural Framework Naas As An Enabler For Cloud Transformation Brochure PDF
This slide talks about how NaaS works as a key driver for cloud transformation by providing secure and protected connectivity between businesses and their customers, internet of things devices with corporate applications, and so on. This modern and well-arranged Naas Architectural Framework Naas As An Enabler For Cloud Transformation Brochure PDF provides lots of creative possibilities. It is very simple to customize and edit with the Powerpoint Software. Just drag and drop your pictures into the shapes. All facets of this template can be edited with Powerpoint, no extra software is necessary. Add your own material, put your images in the places assigned for them, adjust the colors, and then you can show your slides to the world, with an animated slide included.

Recruitment Metrics For Human Resource Analytics Management Topics Pdf
This slide showcase key performance indicator that can help organization to measure effectiveness of recruitment process. It includes key pointers such as time to hire, sourcing channel efficiency, number of qualified candidates and submit to interview ratio.Showcasing this set of slides titled Recruitment Metrics For Human Resource Analytics Management Topics Pdf The topics addressed in these templates are Recruitment Process, Identify Bottleneck, Difference Between All the content presented in this PPT design is completely editable. Download it and make adjustments in color, background, font etc. as per your unique business setting. This slide showcase key performance indicator that can help organization to measure effectiveness of recruitment process. It includes key pointers such as time to hire, sourcing channel efficiency, number of qualified candidates and submit to interview ratio.
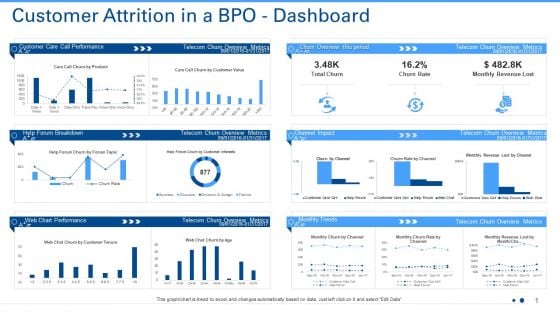
Customer Attrition In A BPO Dashboard Ppt Show File Formats PDF
Deliver an awe-inspiring pitch with this creative customer attrition in a bpo dashboard ppt show file formats pdf. bundle. Topics like customer care call performance, telecom churn overview metrics, telecom churn overview metrics can be discussed with this completely editable template. It is available for immediate download depending on the needs and requirements of the user.
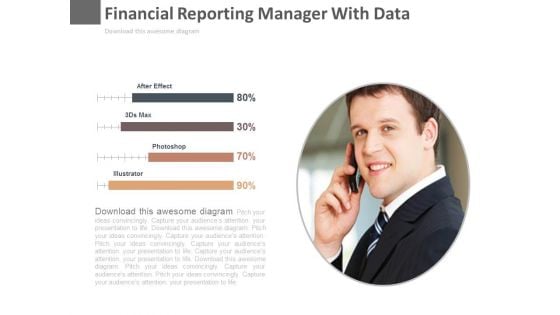
Financial Reporting Manager With Data Powerpoint Slides
This PowerPoint template has been designed with graphics of finance manager and percentage data. This diagram is useful to exhibit financial management. This diagram slide can be used to make impressive presentations.
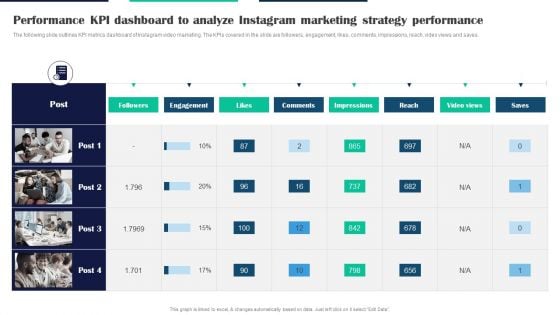
Executing Video Promotional Performance KPI Dashboard To Analyze Instagram Marketing Download PDF
The following slide outlines KPI metrics dashboard of Instagram video marketing. The KPIs covered in the slide are followers, engagement, likes, comments, impressions, reach, video views and saves. Are you searching for a Executing Video Promotional Performance KPI Dashboard To Analyze Instagram Marketing Download PDF that is uncluttered, straightforward, and original Its easy to edit, and you can change the colors to suit your personal or business branding. For a presentation that expresses how much effort youve put in, this template is ideal With all of its features, including tables, diagrams, statistics, and lists, its perfect for a business plan presentation. Make your ideas more appealing with these professional slides. Download Executing Video Promotional Performance KPI Dashboard To Analyze Instagram Marketing Download PDF from Slidegeeks today.
Implementing Effective Strategy Staff Training Effectiveness Tracking Dashboard Guidelines PDF
This slide provides information regarding workforce training effectiveness monitoring dashboard. The dashboard includes details such as training cost, cost per participant, number of participants, hours of training, etc. Take your projects to the next level with our ultimate collection of Implementing Effective Strategy Staff Training Effectiveness Tracking Dashboard Guidelines PDF. Slidegeeks has designed a range of layouts that are perfect for representing task or activity duration, keeping track of all your deadlines at a glance. Tailor these designs to your exact needs and give them a truly corporate look with your own brand colors theyll make your projects stand out from the rest.
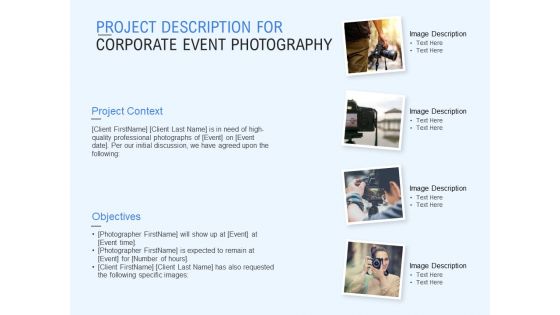
Project Description For Corporate Event Photography Ppt PowerPoint Presentation File Files
Presenting this set of slides with name project description for corporate event photography ppt powerpoint presentation file files. This is a four stage process. The stages in this process are our team, communication, management, business, planning. This is a completely editable PowerPoint presentation and is available for immediate download. Download now and impress your audience.
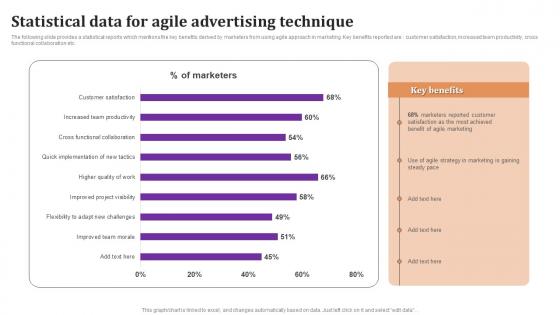
Statistical Data For Agile Advertising Technique Diagrams Pdf
The following slide provides a statistical reports which mentions the key benefits derived by marketers from using agile approach in marketing. Key benefits reported are customer satisfaction, increased team productivity, cross functional collaboration etc. Pitch your topic with ease and precision using this Statistical Data For Agile Advertising Technique Diagrams Pdf This layout presents information on Statistical Data, Agile Advertising, Technique It is also available for immediate download and adjustment. So, changes can be made in the color, design, graphics or any other component to create a unique layout. The following slide provides a statistical reports which mentions the key benefits derived by marketers from using agile approach in marketing. Key benefits reported are customer satisfaction, increased team productivity, cross functional collaboration etc.
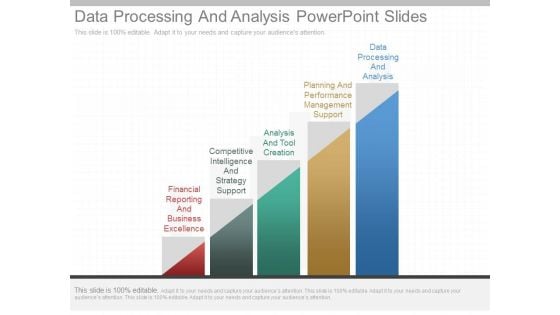
Data Processing And Analysis Powerpoint Slides
This is a data processing and analysis powerpoint slides. This is a five stage process. The stages in this process are financial reporting and business excellence, competitive intelligence and strategy support, analysis and tool creation, planning and performance management support, data processing and analysis.
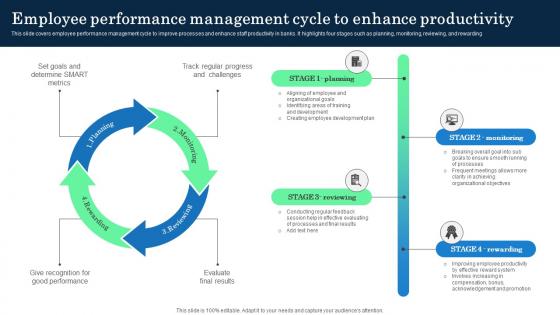
Employee Performance Management Cycle To Incorporating Banking Operational Growth
This slide covers employee performance management cycle to improve processes and enhance staff productivity in banks. It highlights four stages such as planning, monitoring, reviewing, and rewarding. Formulating a presentation can take up a lot of effort and time, so the content and message should always be the primary focus. The visuals of the PowerPoint can enhance the presenters message, so our Employee Performance Management Cycle To Incorporating Banking Operational Growth was created to help save time. Instead of worrying about the design, the presenter can concentrate on the message while our designers work on creating the ideal templates for whatever situation is needed. Slidegeeks has experts for everything from amazing designs to valuable content, we have put everything into Employee Performance Management Cycle To Incorporating Banking Operational Growth This slide covers employee performance management cycle to improve processes and enhance staff productivity in banks. It highlights four stages such as planning, monitoring, reviewing, and rewarding
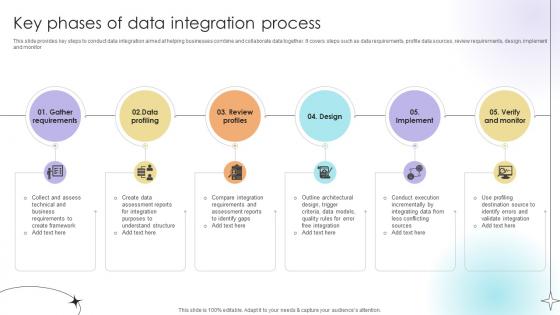
Key Phases Of Data Integration Process Data Analytics SS V
This slide provides key steps to conduct data integration aimed at helping businesses combine and collaborate data together. It covers steps such as data requirements, profile data sources, review requirements, design, implement and monitor.Slidegeeks is here to make your presentations a breeze with Key Phases Of Data Integration Process Data Analytics SS V With our easy-to-use and customizable templates, you can focus on delivering your ideas rather than worrying about formatting. With a variety of designs to choose from, you are sure to find one that suits your needs. And with animations and unique photos, illustrations, and fonts, you can make your presentation pop. So whether you are giving a sales pitch or presenting to the board, make sure to check out Slidegeeks first This slide provides key steps to conduct data integration aimed at helping businesses combine and collaborate data together. It covers steps such as data requirements, profile data sources, review requirements, design, implement and monitor.
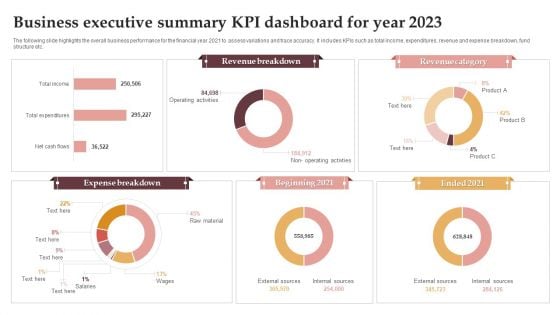
Business Executive Summary KPI Dashboard For Year 2023 Graphics PDF
The following slide highlights the overall business performance for the financial year 2021 to assess variations and trace accuracy. It includes KPIs such as total income, expenditures, revenue and expense breakdown, fund structure etc. Pitch your topic with ease and precision using this Business Executive Summary KPI Dashboard For Year 2023 Graphics PDF. This layout presents information on Revenue Breakdown, Revenue Category, Expense Breakdown. It is also available for immediate download and adjustment. So, changes can be made in the color, design, graphics or any other component to create a unique layout.
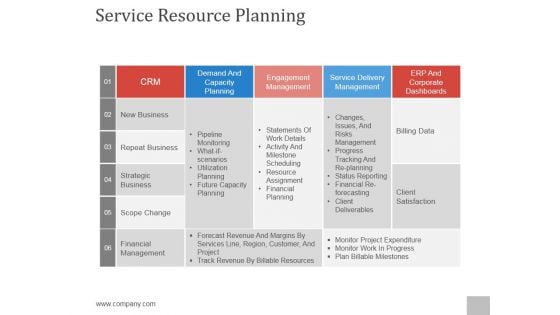
Service Resource Planning Ppt PowerPoint Presentation Designs Download
This is a service resource planning ppt powerpoint presentation designs download. This is a five stage process. The stages in this process are crm, demand and capacity planning, engagement management, service delivery management, erp and corporate dashboards.
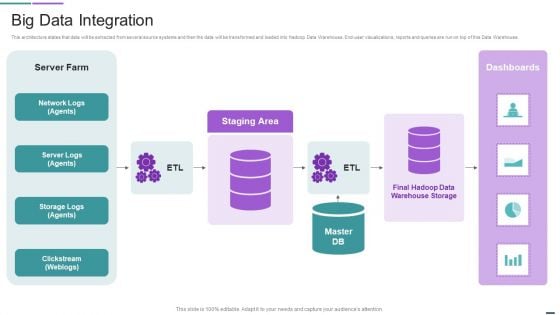
Data Management Solutions Big Data Integration Download PDF
This architecture states that data will be extracted from several source systems and then the data will be transformed and loaded into Hadoop Data Warehouse. End user visualizations, reports and queries are run on top of this Data Warehouse. Deliver and pitch your topic in the best possible manner with this Data Management Solutions Big Data Integration Download PDF. Use them to share invaluable insights on Network Logs, Storage Logs, Warehouse Storage and impress your audience. This template can be altered and modified as per your expectations. So, grab it now.
Developing Brand Awareness To Gain Customer Attention Different Brands Performance Tracking Dashboard Introduction PDF
This slide provides information regarding different brands performance tracking dashboard in terms of brand metric, brand commitment, advertising metrics, and purchase metrics. Make sure to capture your audiences attention in your business displays with our gratis customizable Developing Brand Awareness To Gain Customer Attention Different Brands Performance Tracking Dashboard Introduction PDF. These are great for business strategies, office conferences, capital raising or task suggestions. If you desire to acquire more customers for your tech business and ensure they stay satisfied, create your own sales presentation with these plain slides.
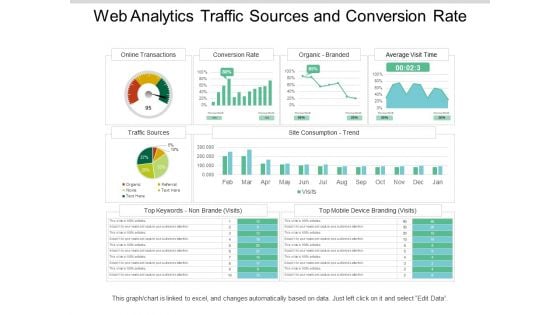
Web Analytics Traffic Sources And Conversion Rate Ppt PowerPoint Presentation Picture
This is a web analytics traffic sources and conversion rate ppt powerpoint presentation picture. This is a four stage process. The stages in this process are digital analytics, digital dashboard, marketing.


 Continue with Email

 Home
Home


