Snapshot
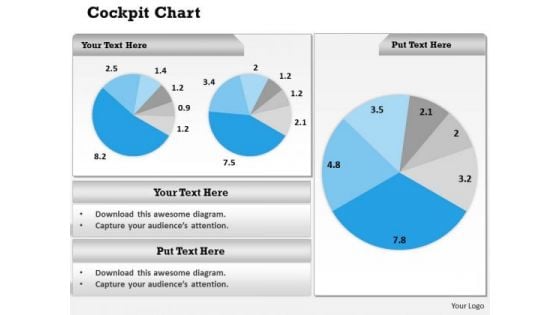
Business Framework Model Business Data Link In Dashboards Strategy Diagram
Document Your Views On Our Business Framework Model Business Data Link In Dashboards Strategy Diagram Powerpoint Templates. They Will Create A Strong Impression.
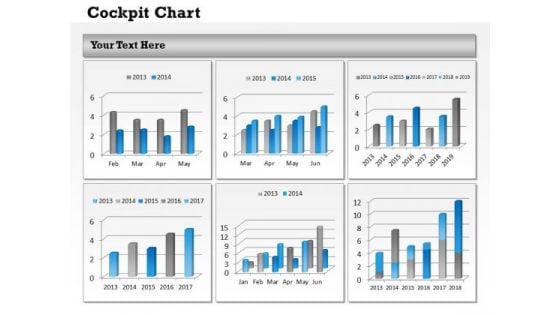
Business Cycle Diagram Display Data In Dashboard Layout Business Diagram
Analyze Ailments On Our Business Cycle Diagram Display Data In Dashboard Layout Business Diagram Powerpoint Templates. Bring Out The Thinking Doctor In You. Dock Your Thoughts With Our Business Cycle Diagram Display Data In Dashboard Layout Business Diagram Powerpoint Templates. They Will Launch Them Into Orbit.
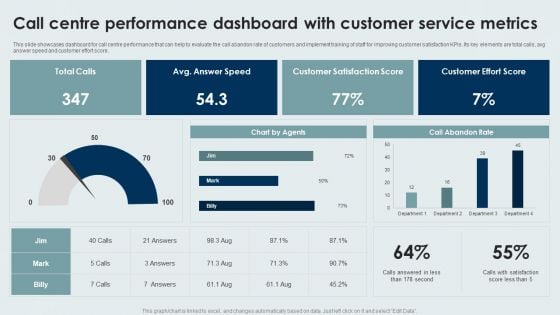
Call Centre Performance Dashboard With Customer Service Metrics Background PDF
This slide showcases dashboard for call centre performance that can help to evaluate the call abandon rate of customers and implement training of staff for improving customer satisfaction KPIs. Its key elements are total calls, avg answer speed and customer effort score. Showcasing this set of slides titled Call Centre Performance Dashboard With Customer Service Metrics Background PDF. The topics addressed in these templates are Call Centre Performance Dashboard, Customer Service Metrics. All the content presented in this PPT design is completely editable. Download it and make adjustments in color, background, font etc. as per your unique business setting.
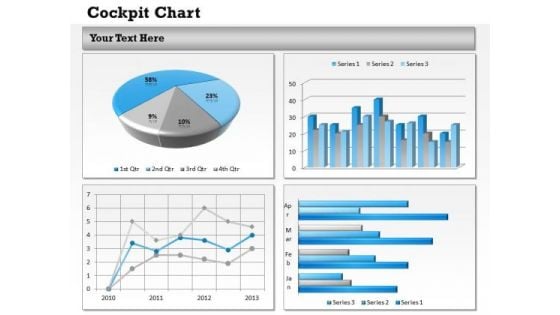
Marketing Diagram Data Driven Dashboard Design Business Diagram
Get The Doers Into Action. Activate Them With Our Marketing Diagram Data Driven Dashboard Design Business Diagram Powerpoint Templates.

Customer Support Center Call Center Action Plan Dashboard Highlighting Agent Diagrams PDF
This slide showcases dashboard for call center action plan which includes total calls, average answer speed, abandon rate, average calls per minute with agent performance and overall customer satisfaction score. Want to ace your presentation in front of a live audience Our Customer Support Center Call Center Action Plan Dashboard Highlighting Agent Diagrams PDF can help you do that by engaging all the users towards you.. Slidegeeks experts have put their efforts and expertise into creating these impeccable powerpoint presentations so that you can communicate your ideas clearly. Moreover, all the templates are customizable, and easy-to-edit and downloadable. Use these for both personal and commercial use.
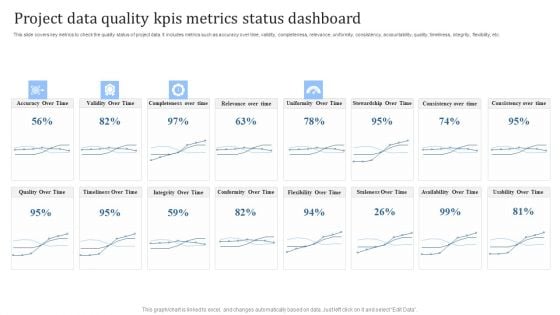
Project Data Quality Kpis Metrics Status Dashboard Designs PDF
This slide covers key metrics to check the quality status of project data. It includes metrics such as accuracy over time, validity, completeness, relevance, uniformity, consistency, accountability, quality, timeliness, integrity, flexibility, etc. Pitch your topic with ease and precision using this Project Data Quality Kpis Metrics Status Dashboard Designs PDF. This layout presents information on Accuracy Over Time, Validity Over Time. It is also available for immediate download and adjustment. So, changes can be made in the color, design, graphics or any other component to create a unique layout.
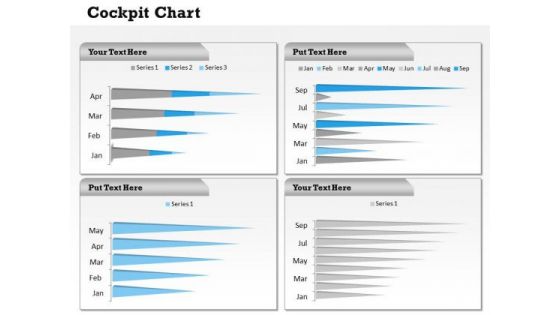
Business Diagram Dashboard Design For Data Management Marketing Diagram
Be The Doer With Our Business Diagram Dashboard Design For Data Management Marketing Diagram Powerpoint Templates. Put Your Thoughts Into Practice.
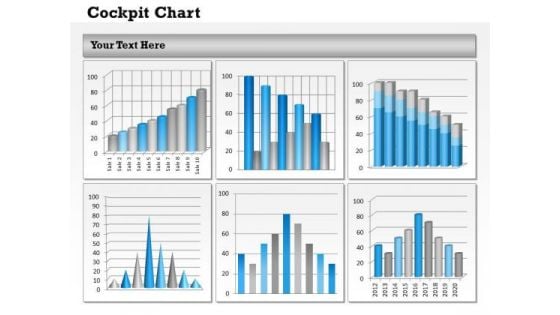
Consulting Diagram Dashboard To Visualize Business Data Consulting Diagram
Establish Your Dominion With Our Consulting Diagram Dashboard To Visualize Business Data Consulting Diagram Powerpoint Templates. Rule The Stage With Your Thoughts.
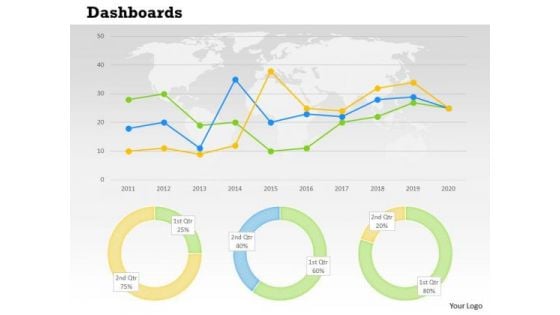
Sales Diagram Dashboard For Quantitative Business Data Consulting Diagram
Deliver The Right Dose With Our Sales Diagram Dashboard For Quantitative Business Data Consulting Diagram Powerpoint Templates. Your Ideas Will Get The Correct Illumination.
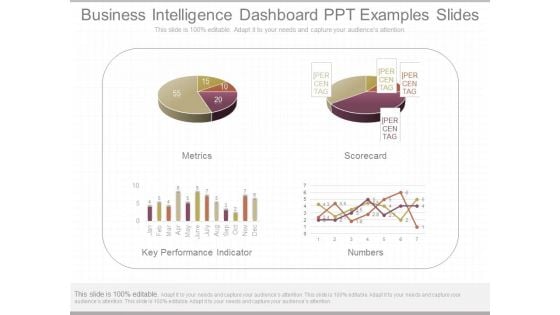
Business Intelligence Dashboard Ppt Examples Slides
This is a business intelligence dashboard ppt examples slides. This is a four stage process. The stages in this process are metrics, scorecard, key performance indicator, numbers.
Data Analysis Reports Under Magnifying Glass Ppt PowerPoint Presentation Icon Graphic Tips
Presenting this set of slides with name data analysis reports under magnifying glass ppt powerpoint presentation icon graphic tips. This is a three stage process. The stages in this process are data visualization icon, research analysis, business focus. This is a completely editable PowerPoint presentation and is available for immediate download. Download now and impress your audience.
Workforce Performance Measurement Meter Icon Ppt Portfolio Layouts PDF
Presenting Workforce Performance Measurement Meter Icon Ppt Portfolio Layouts PDF to dispense important information. This template comprises one stages. It also presents valuable insights into the topics including Workforce, Performance Measurement, Meter Icon. This is a completely customizable PowerPoint theme that can be put to use immediately. So, download it and address the topic impactfully.
Performance Management System Icon To Improve Employee Efficiency Introduction PDF
Presenting Performance Management System Icon To Improve Employee Efficiency Introduction PDF to dispense important information. This template comprises three stages. It also presents valuable insights into the topics including Performance Management System, Icon To Improve, Employee Efficiency. This is a completely customizable PowerPoint theme that can be put to use immediately. So, download it and address the topic impactfully.
Database Modeling Data Model Performance Tracking Dashboard Demonstration Pdf
This slide shows the data model performance tracking dashboard. The purpose of this slide is to represent the Information related to the change brought by data models graphically. Do you have to make sure that everyone on your team knows about any specific topic I yes, then you should give Database Modeling Data Model Performance Tracking Dashboard Demonstration Pdf a try. Our experts have put a lot of knowledge and effort into creating this impeccable Database Modeling Data Model Performance Tracking Dashboard Demonstration Pdf. You can use this template for your upcoming presentations, as the slides are perfect to represent even the tiniest detail. You can download these templates from the Slidegeeks website and these are easy to edit. So grab these today This slide shows the data model performance tracking dashboard. The purpose of this slide is to represent the Information related to the change brought by data models graphically.
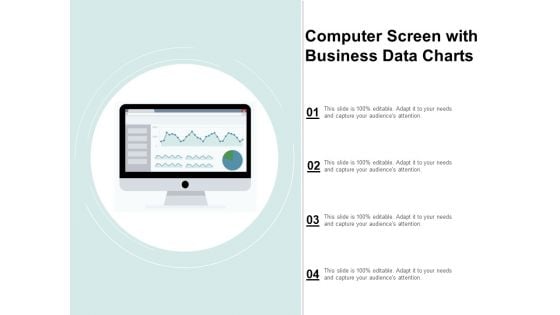
Computer Screen With Business Data Charts Ppt Powerpoint Presentation Show Vector
This is a computer screen with business data charts ppt powerpoint presentation show vector. This is a four stage process. The stages in this process are business metrics, business kpi, business dashboard.

Key Performance Indicator Analytics Dashboard Ppt PowerPoint Presentation Model Example Topics
This is a key performance indicator analytics dashboard ppt powerpoint presentation model example topics. This is a five stage process. The stages in this process are kpi proposal, kpi plan, kpi scheme.
Security Breach Events Tracking Dashboard Data Breach Prevention Themes Pdf
Slidegeeks is one of the best resources for PowerPoint templates. You can download easily and regulate Security Breach Events Tracking Dashboard Data Breach Prevention Themes Pdf for your personal presentations from our wonderful collection. A few clicks is all it takes to discover and get the most relevant and appropriate templates. Use our Templates to add a unique zing and appeal to your presentation and meetings. All the slides are easy to edit and you can use them even for advertisement purposes. This slide represents the dashboard to track data breach attacks. The purpose of this slide is to provide a graphical representation of cyber attacks that occurred in a specific period. It also depicts the overview of different types of attacks.
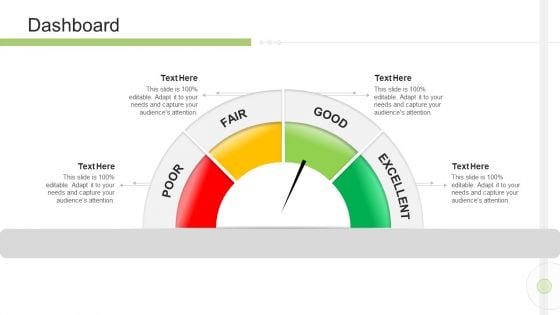
Execution Management In Business Dashboard Microsoft PDF
Deliver an awe inspiring pitch with this creative execution management in business dashboard microsoft pdf bundle. Topics like dashboard can be discussed with this completely editable template. It is available for immediate download depending on the needs and requirements of the user.
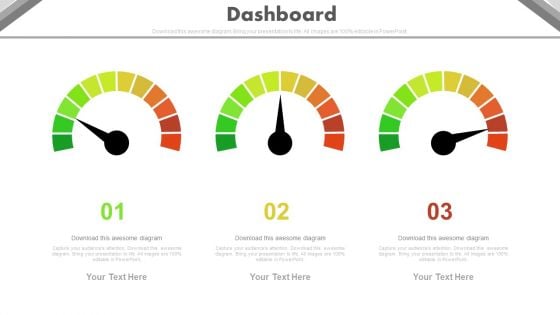
Three Steps Dashboard Charts For Financial Review Powerpoint Slides
This PowerPoint template has been designed with three dashboards. Use this PPT slide to depict financial review and plan. This professional diagram slide will help you express your views to target audience.
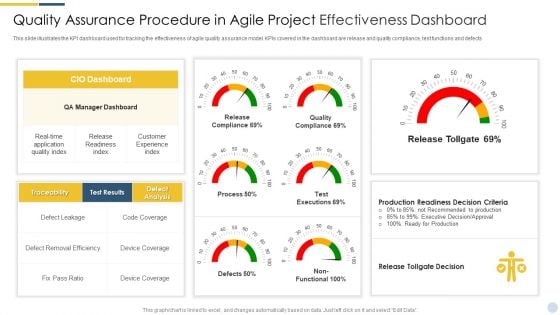
Quality Assurance Procedure In Agile Project Effectiveness Dashboard Formats PDF
This slide illustrates the KPI dashboard used for tracking the effectiveness of agile quality assurance model. KPIs covered in the dashboard are release and quality compliance, test functions and defects. Deliver and pitch your topic in the best possible manner with this quality assurance procedure in agile project effectiveness dashboard formats pdf. Use them to share invaluable insights on release tollgate decision, recommended to production, executive decision and impress your audience. This template can be altered and modified as per your expectations. So, grab it now.
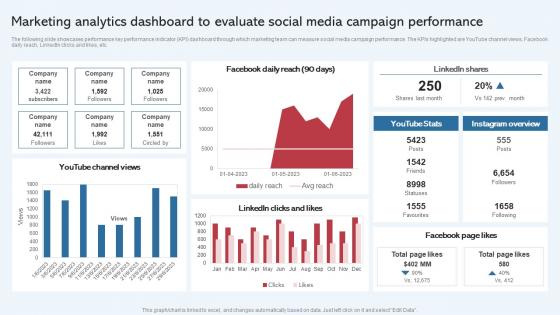
Marketing Analytics Dashboard To Evaluate Social Effective Startup Promotion Structure Rules Pdf
The following slide showcases performance key performance indicator KPI dashboard through which marketing team can measure social media campaign performance. The KPIs highlighted are YouTube channel views, Facebook daily reach, LinkedIn clicks and likes, etc. The best PPT templates are a great way to save time, energy, and resources. Slidegeeks have 100 percent editable powerpoint slides making them incredibly versatile. With these quality presentation templates, you can create a captivating and memorable presentation by combining visually appealing slides and effectively communicating your message. Download Marketing Analytics Dashboard To Evaluate Social Effective Startup Promotion Structure Rules Pdf from Slidegeeks and deliver a wonderful presentation. The following slide showcases performance key performance indicator KPI dashboard through which marketing team can measure social media campaign performance. The KPIs highlighted are YouTube channel views, Facebook daily reach, LinkedIn clicks and likes, etc.
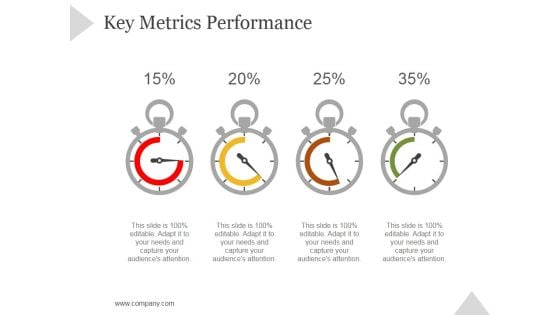
Key Metrics Performance Ppt PowerPoint Presentation Tips
This is a key metrics performance ppt powerpoint presentation tips. This is a four stage process. The stages in this process are business, strategy, marketing, success, dashboard, measuring.
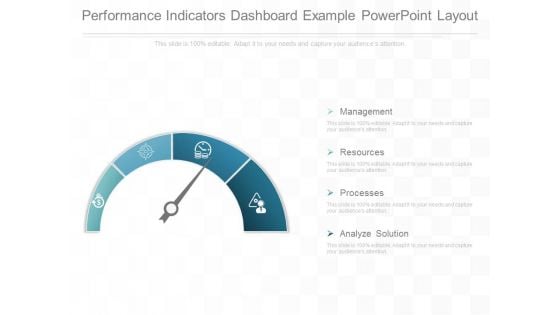
Performance Indicators Dashboard Example Powerpoint Layout
This is a performance indicators dashboard example powerpoint layout. This is a four stage process. The stages in this process are management, resources, processes, analyze solution.
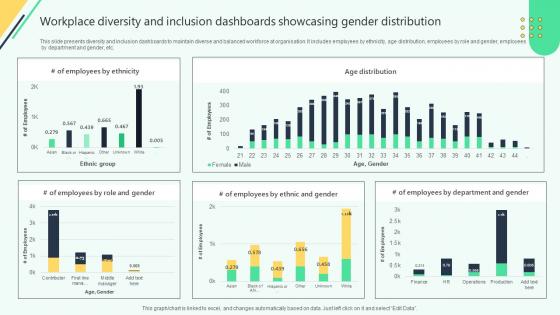
Workplace Diversity And Inclusion Dashboards Analysing Hr Data For Effective Decision Making
This slide presents diversity and inclusion dashboards to maintain diverse and balanced workforce at organisation. It includes employees by ethnicity, age distribution, employees by role and gender, employees by department and gender, etc. Whether you have daily or monthly meetings, a brilliant presentation is necessary. Workplace Diversity And Inclusion Dashboards Analysing Hr Data For Effective Decision Making can be your best option for delivering a presentation. Represent everything in detail using Workplace Diversity And Inclusion Dashboards Analysing Hr Data For Effective Decision Making and make yourself stand out in meetings. The template is versatile and follows a structure that will cater to your requirements. All the templates prepared by Slidegeeks are easy to download and edit. Our research experts have taken care of the corporate themes as well. So, give it a try and see the results. This slide presents diversity and inclusion dashboards to maintain diverse and balanced workforce at organisation. It includes employees by ethnicity, age distribution, employees by role and gender, employees by department and gender, etc.
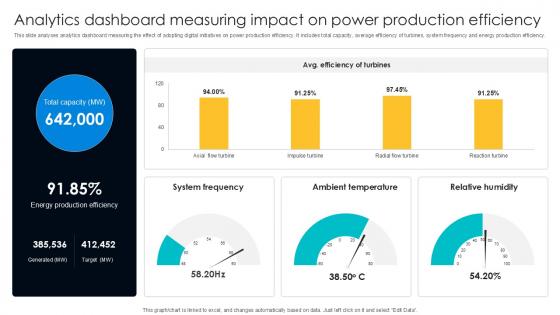
Analytics Dashboard Measuring Digital Transformation Journey PPT Slide DT SS V
This slide analyses analytics dashboard measuring the effect of adopting digital initiatives on power production efficiency. It includes total capacity, average efficiency of turbines, system frequency and energy production efficiency. Do you have to make sure that everyone on your team knows about any specific topic I yes, then you should give Analytics Dashboard Measuring Digital Transformation Journey PPT Slide DT SS V a try. Our experts have put a lot of knowledge and effort into creating this impeccable Analytics Dashboard Measuring Digital Transformation Journey PPT Slide DT SS V. You can use this template for your upcoming presentations, as the slides are perfect to represent even the tiniest detail. You can download these templates from the Slidegeeks website and these are easy to edit. So grab these today This slide analyses analytics dashboard measuring the effect of adopting digital initiatives on power production efficiency. It includes total capacity, average efficiency of turbines, system frequency and energy production efficiency.
Zero Trust Network Access Performance Tracking Dashboard Software Defined Perimeter SDP
This slide represents the performance tracking dashboard for zero trust network access. The purpose of this slide is to showcase the level of request modes, connected users, daily usage of the network, security rating, device risk and threat flow. The Zero Trust Network Access Performance Tracking Dashboard Software Defined Perimeter SDP is a compilation of the most recent design trends as a series of slides. It is suitable for any subject or industry presentation, containing attractive visuals and photo spots for businesses to clearly express their messages. This template contains a variety of slides for the user to input data, such as structures to contrast two elements, bullet points, and slides for written information. Slidegeeks is prepared to create an impression. This slide represents the performance tracking dashboard for zero trust network access. The purpose of this slide is to showcase the level of request modes, connected users, daily usage of the network, security rating, device risk and threat flow.
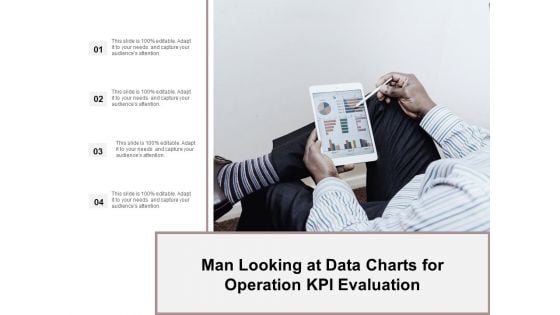
Man Looking At Data Charts For Operation Kpi Evaluation Ppt Powerpoint Presentation Ideas Demonstration
This is a man looking at data charts for operation kpi evaluation ppt powerpoint presentation ideas demonstration. This is a four stage process. The stages in this process are business metrics, business kpi, business dashboard.
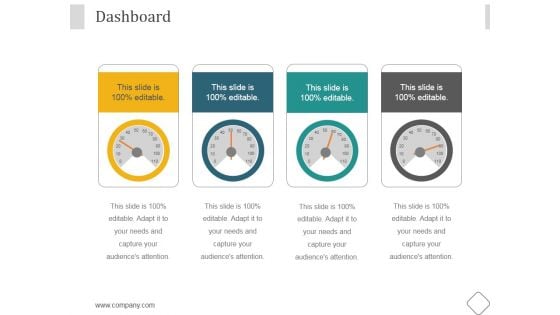
Dashboard Ppt PowerPoint Presentation Background Images
This is a dashboard ppt powerpoint presentation background images. This is a four stage process. The stages in this process are business, marketing, management, dashboard, analysis.
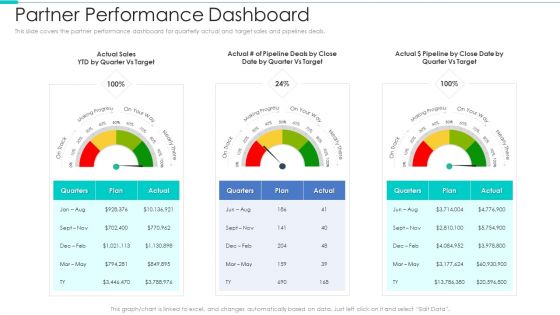
Business Relationship Management Tool Partner Performance Dashboard Template PDF
This slide covers the partner performance dashboard for quarterly actual and target sales and pipelines deals. Deliver an awe inspiring pitch with this creative business relationship management tool partner performance dashboard template pdf bundle. Topics like partner performance dashboard can be discussed with this completely editable template. It is available for immediate download depending on the needs and requirements of the user.
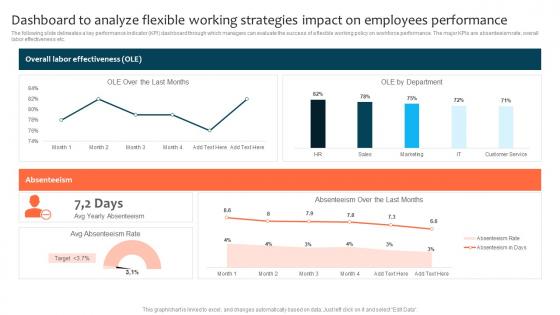
Dashboard To Analyze Flexible Working Strategies Impact Optimizing Staff Retention Rate Background Pdf
The following slide delineates a key performance indicator KPI dashboard through which managers can evaluate the success of a flexible working policy on workforce performance. The major KPIs are absenteeism rate, overall labor effectiveness etc. Slidegeeks has constructed Dashboard To Analyze Flexible Working Strategies Impact Optimizing Staff Retention Rate Background Pdf after conducting extensive research and examination. These presentation templates are constantly being generated and modified based on user preferences and critiques from editors. Here, you will find the most attractive templates for a range of purposes while taking into account ratings and remarks from users regarding the content. This is an excellent jumping-off point to explore our content and will give new users an insight into our top-notch PowerPoint Templates. The following slide delineates a key performance indicator KPI dashboard through which managers can evaluate the success of a flexible working policy on workforce performance. The major KPIs are absenteeism rate, overall labor effectiveness etc.
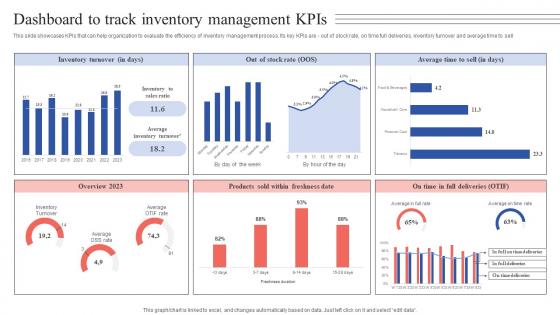
Dashboard To Track Inventory Management Kpis Tactical Guide Stock Administration Pictures Pdf
This slide showcases KPIs that can help organization to evaluate the efficiency of inventory management process. Its key KPIs are - out of stock rate, on time full deliveries, inventory turnover and average time to sell. Present like a pro with Dashboard To Track Inventory Management Kpis Tactical Guide Stock Administration Pictures Pdf Create beautiful presentations together with your team, using our easy-to-use presentation slides. Share your ideas in real-time and make changes on the fly by downloading our templates. So whether you are in the office, on the go, or in a remote location, you can stay in sync with your team and present your ideas with confidence. With Slidegeeks presentation got a whole lot easier. Grab these presentations today. This slide showcases KPIs that can help organization to evaluate the efficiency of inventory management process. Its key KPIs are - out of stock rate, on time full deliveries, inventory turnover and average time to sell.
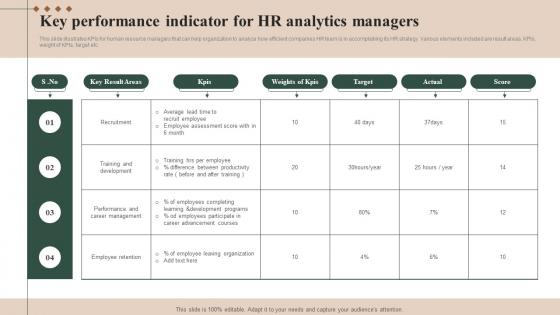
Key Performance Indicator For HR Analytics Managers Brochure Pdf
This slide illustrates KPIs for human resource managers that can help organization to analyze how efficient companies HR team is in accomplishing its HR strategy. Various elements included are result areas, KPIs, weight of KPIs, target etc.Pitch your topic with ease and precision using this Key Performance Indicator For HR Analytics Managers Brochure Pdf This layout presents information on Training Development, Career Management, Employee Retention It is also available for immediate download and adjustment. So, changes can be made in the color, design, graphics or any other component to create a unique layout. This slide illustrates KPIs for human resource managers that can help organization to analyze how efficient companies HR team is in accomplishing its HR strategy. Various elements included are result areas, KPIs, weight of KPIs, target etc.
Dashboard Icon Showing Business Performance Key Features Clipart PDF
Showcasing this set of slides titled dashboard icon showing business performance key features clipart pdf. The topics addressed in these templates are dashboard icon showing business performance key features. All the content presented in this PPT design is completely editable. Download it and make adjustments in color, background, font etc. as per your unique business setting.
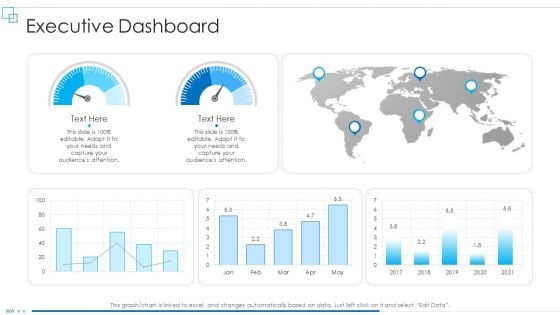
Business Scheme Management Synopsis Executive Dashboard Microsoft PDF
Deliver an awe inspiring pitch with this creative business scheme management synopsis executive dashboard microsoft pdf bundle. Topics like executive dashboard can be discussed with this completely editable template. It is available for immediate download depending on the needs and requirements of the user.
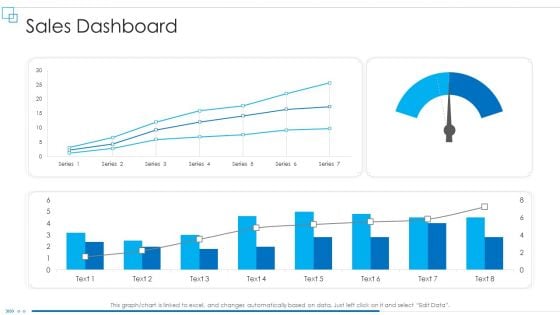
Business Scheme Management Synopsis Sales Dashboard Themes PDF
Deliver and pitch your topic in the best possible manner with this business scheme management synopsis sales dashboard themes pdf. Use them to share invaluable insights on sales dashboard and impress your audience. This template can be altered and modified as per your expectations. So, grab it now.

Business Intelligence And Data Visualization Tools DT SS V
This slide presents various business intelligence and data visualization tools that help SMEs make better business decisions. It also mentions applications such as data analysis, exploration, visualization, reporting and dashboard creations.Present like a pro with Business Intelligence And Data Visualization Tools DT SS V. Create beautiful presentations together with your team, using our easy-to-use presentation slides. Share your ideas in real-time and make changes on the fly by downloading our templates. So whether you are in the office, on the go, or in a remote location, you can stay in sync with your team and present your ideas with confidence. With Slidegeeks presentation got a whole lot easier. Grab these presentations today. This slide presents various business intelligence and data visualization tools that help SMEs make better business decisions. It also mentions applications such as data analysis, exploration, visualization, reporting and dashboard creations.
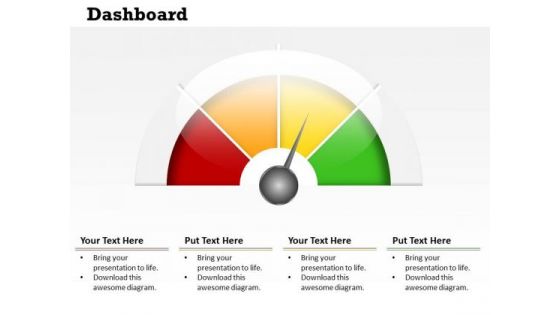
Business Framework Model Dashboard Design Business Strategy Diagram
Get The Doers Into Action. Activate Them With Our Business Framework Model Dashboard Design Business Strategy Diagram Powerpoint Templates.
Offshore Vs Outsourced Call Center Comparative Analysis Icons Pdf
The following slide highlights points like labor cost, service quality, communication, data security, time zone and customer feedback to show offshore vs onshore call center comparative analysis. It helps organization to make informed decision between offshore and onshore call center outsourcing based on important factors. Pitch your topic with ease and precision using this Offshore Vs Outsourced Call Center Comparative Analysis Icons Pdf. This layout presents information on Service Quality, Communication, Data Security, Customer Feedback. It is also available for immediate download and adjustment. So, changes can be made in the color, design, graphics or any other component to create a unique layout. The following slide highlights points like labor cost, service quality, communication, data security, time zone and customer feedback to show offshore vs onshore call center comparative analysis. It helps organization to make informed decision between offshore and onshore call center outsourcing based on important factors.
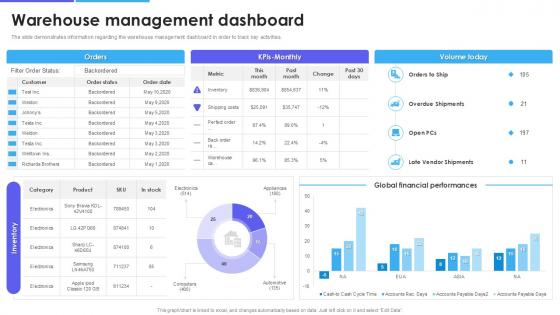
Warehouse Management Inventory Control Warehouse Management Dashboard
Do you have an important presentation coming up Are you looking for something that will make your presentation stand out from the rest Look no further than Warehouse Management Inventory Control Warehouse Management Dashboard. With our professional designs, you can trust that your presentation will pop and make delivering it a smooth process. And with Slidegeeks, you can trust that your presentation will be unique and memorable. So why wait Grab Warehouse Management Inventory Control Warehouse Management Dashboard today and make your presentation stand out from the rest The slide highlights an overview of the warehouse management dashboard, designed to monitor and track critical activities effectively. It includes key operational metrics such as order status, shipping cost, volume, financial performance, overdue shipments etc.

Key Steps To Conduct Heuristic Analysis Data Analytics SS V
This slide outlines major steps to conduct heuristics analysis aimed at helping businesses conduct evaluation and generate meaningful changes. It covers steps such as define analysis scope, end user knowledge, define heuristics, choose reporting style, set up scoring system and analyze.Do you have an important presentation coming up Are you looking for something that will make your presentation stand out from the rest Look no further than Key Steps To Conduct Heuristic Analysis Data Analytics SS V. With our professional designs, you can trust that your presentation will pop and make delivering it a smooth process. And with Slidegeeks, you can trust that your presentation will be unique and memorable. So why wait Grab Key Steps To Conduct Heuristic Analysis Data Analytics SS V today and make your presentation stand out from the rest This slide outlines major steps to conduct heuristics analysis aimed at helping businesses conduct evaluation and generate meaningful changes. It covers steps such as define analysis scope, end user knowledge, define heuristics, choose reporting style, set up scoring system and analyze.
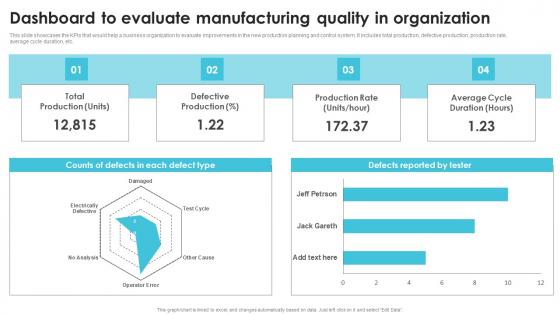
Dashboard To Evaluate Manufacturing Quality Streamlining Production Operational Professional PDF
This slide showcases the KPIs that would help a business organization to evaluate improvements in the new production planning and control system. It includes total production, defective production, production rate, average cycle duration, etc. Do you have to make sure that everyone on your team knows about any specific topic I yes, then you should give Dashboard To Evaluate Manufacturing Quality Streamlining Production Operational Professional PDF a try. Our experts have put a lot of knowledge and effort into creating this impeccable Dashboard To Evaluate Manufacturing Quality Streamlining Production Operational Professional PDF. You can use this template for your upcoming presentations, as the slides are perfect to represent even the tiniest detail. You can download these templates from the Slidegeeks website and these are easy to edit. So grab these today This slide showcases the KPIs that would help a business organization to evaluate improvements in the new production planning and control system. It includes total production, defective production, production rate, average cycle duration, etc.
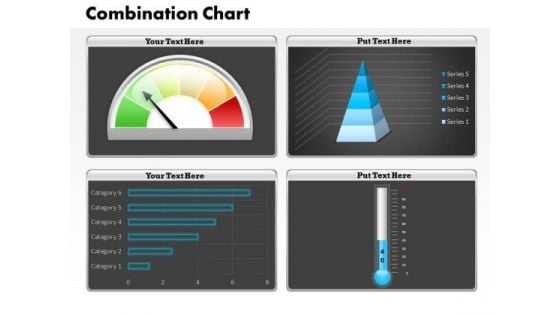
Business Cycle Diagram Business Dashboard Combination Chart Strategy Diagram
Analyze Ailments On Our Business Cycle Diagram Business Dashboard Combination Chart Strategy Diagram Powerpoint Templates. Bring Out The Thinking Doctor In You. Dock Your Thoughts With Our Business Cycle Diagram Business Dashboard Combination Chart Strategy Diagram Powerpoint Templates. They Will Launch Them Into Orbit.

HR Framework Dashboard Indicating Kpis Of Employees Introduction PDF
This slide represents human resource HR structure dashboard indicating key performance indicators KPIs of employees. it provides information regarding absenteeism, overtime hours, training costs etc.Pitch your topic with ease and precision using this HR Framework Dashboard Indicating Kpis Of Employees Introduction PDF. This layout presents information on Absenteeism Rate, Costs, Average. It is also available for immediate download and adjustment. So, changes can be made in the color, design, graphics or any other component to create a unique layout.
Monthly Sales Reporting And Projections Dashboard Icon Ppt Icon Clipart Images PDF
Persuade your audience using this Monthly Sales Reporting And Projections Dashboard Icon Ppt Icon Clipart Images PDF. This PPT design covers three stages, thus making it a great tool to use. It also caters to a variety of topics including Monthly Sale,s Reporting And Projections, Dashboard Icon. Download this PPT design now to present a convincing pitch that not only emphasizes the topic but also showcases your presentation skills.
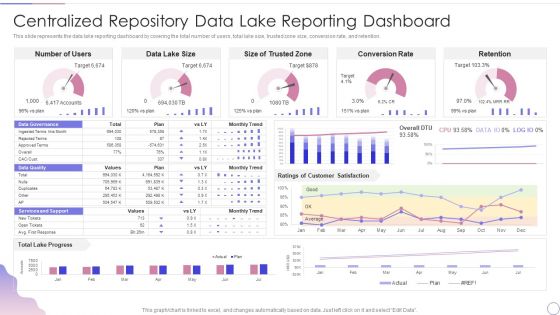
Data Lake Architecture Future Of Data Analysis Centralized Repository Data Lake Reporting Dashboard Elements PDF
This slide represents the data lake reporting dashboard by covering the total number of users, total lake size, trusted zone size, conversion rate, and retention.Deliver an awe inspiring pitch with this creative Data Lake Architecture Future Of Data Analysis Centralized Repository Data Lake Reporting Dashboard Elements PDF bundle. Topics like Data Governance, Conversion Rate, Retention can be discussed with this completely editable template. It is available for immediate download depending on the needs and requirements of the user.
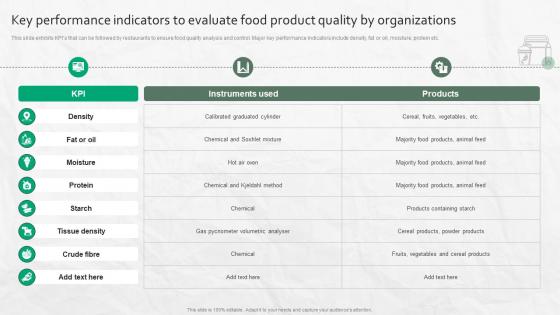
Key Performance Indicators To Evaluate Food Product Quality By Organizations
This slide exhibits KPIs that can be followed by restaurants to ensure food quality analysis and control. Major key performance indicators include density, fat or oil, moisture, protein etc.This modern and well-arranged Key Performance Indicators To Evaluate Food Product Quality By Organizations provides lots of creative possibilities. It is very simple to customize and edit with the Powerpoint Software. Just drag and drop your pictures into the shapes. All facets of this template can be edited with Powerpoint, no extra software is necessary. Add your own material, put your images in the places assigned for them, adjust the colors, and then you can show your slides to the world, with an animated slide included. This slide exhibits KPIs that can be followed by restaurants to ensure food quality analysis and control. Major key performance indicators include density, fat or oil, moisture, protein etc.
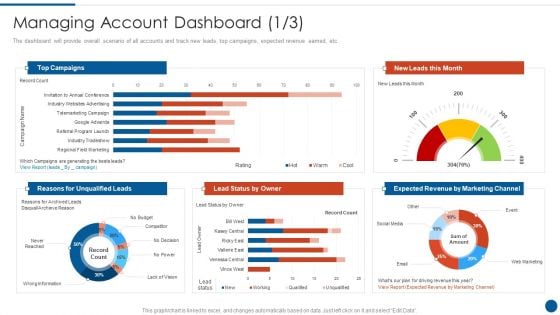
Business Development And Promotion Orchestration For Customer Profile Nurturing Managing Account Dashboard Leads Designs PDF
The dashboard will provide overall scenario of all accounts and track new leads, top campaigns, expected revenue earned, etc. Deliver an awe inspiring pitch with this creative business development and promotion orchestration for customer profile nurturing managing account dashboard leads designs pdf bundle. Topics like managing account dashboard can be discussed with this completely editable template. It is available for immediate download depending on the needs and requirements of the user.
Fuel Indicator Vector Icons Ppt PowerPoint Presentation File Example File
This is a fuel indicator vector icons ppt powerpoint presentation file example file. This is a three stage process. The stages in this process are fuel gauge, gas gauge, fuel containers.
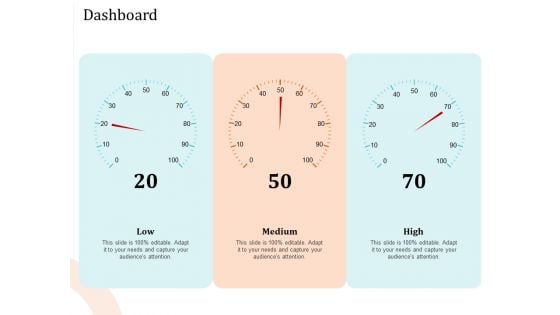
5 Pillars Business Long Term Plan Dashboard Ppt Model Format Ideas PDF
Deliver and pitch your topic in the best possible manner with this 5 pillars business long term plan dashboard ppt model format ideas pdf. Use them to share invaluable insights on dashboard, low, medium, high and impress your audience. This template can be altered and modified as per your expectations. So, grab it now.
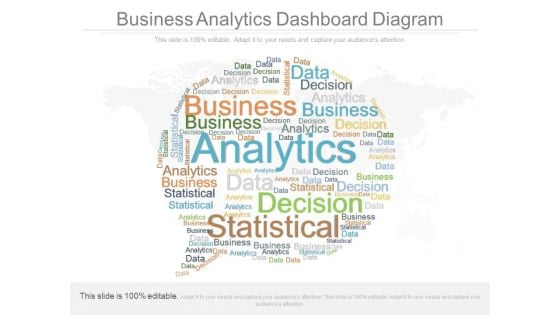
Business Analytics Dashboard Diagram
This is a business analytics dashboard diagram. This is a one stage process. The stages in this process are analytics, decision, data, business, statistics.
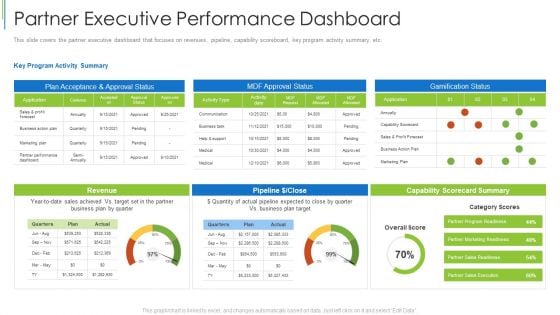
Partner Executive Performance Dashboard Ppt Styles PDF
This slide covers the partner executive dashboard that focuses on revenues, pipeline, capability scoreboard, key program activity summary, etc. Deliver an awe inspiring pitch with this creative partner executive performance dashboard ppt styles pdf bundle. Topics like business action plan, marketing plan, dashboard can be discussed with this completely editable template. It is available for immediate download depending on the needs and requirements of the user.
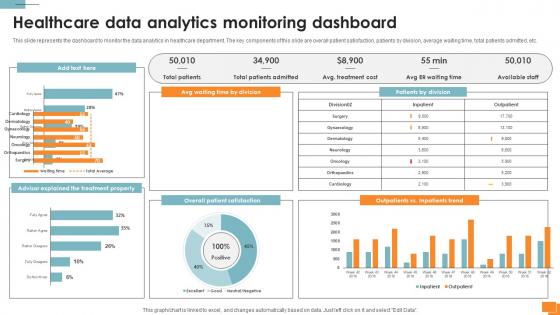
Statistical Tools For Evidence Healthcare Data Analytics Monitoring Dashboard
This slide represents the dashboard to monitor the data analytics in healthcare department. The key components of this slide are overall patient satisfaction, patients by division, average waiting time, total patients admitted, etc. Welcome to our selection of the Statistical Tools For Evidence Healthcare Data Analytics Monitoring Dashboard. These are designed to help you showcase your creativity and bring your sphere to life. Planning and Innovation are essential for any business that is just starting out. This collection contains the designs that you need for your everyday presentations. All of our PowerPoints are 100Percent editable, so you can customize them to suit your needs. This multi-purpose template can be used in various situations. Grab these presentation templates today. This slide represents the dashboard to monitor the data analytics in healthcare department. The key components of this slide are overall patient satisfaction, patients by division, average waiting time, total patients admitted, etc.
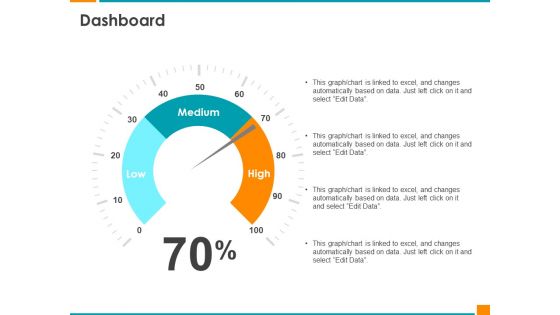
Executing Organization Commodity Strategy Dashboard Rules PDF
Deliver an awe inspiring pitch with this creative executing organization commodity strategy dashboard rules pdf bundle. Topics like dashboard can be discussed with this completely editable template. It is available for immediate download depending on the needs and requirements of the user.
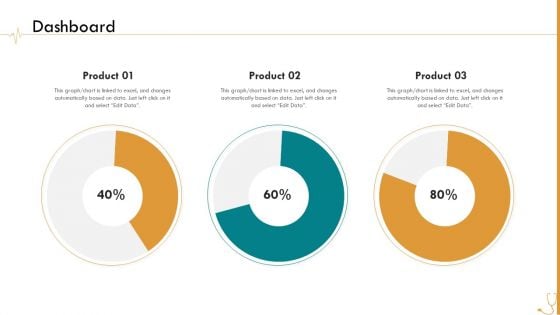
Pharmaceutical Management Dashboard Ppt Layouts Structure PDF
Deliver an awe inspiring pitch with this creative pharmaceutical management dashboard ppt layouts structure pdf bundle. Topics like dashboard can be discussed with this completely editable template. It is available for immediate download depending on the needs and requirements of the user.
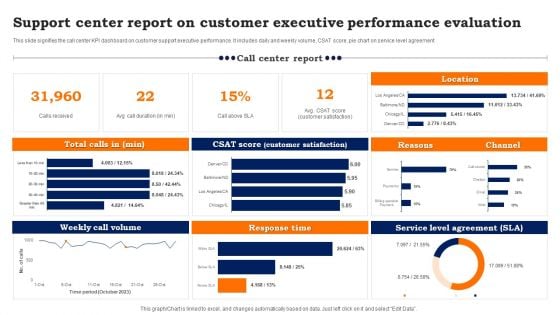
Support Center Report On Customer Executive Performance Evaluation Background PDF
This slide signifies the call center KPI dashboard on customer support executive performance. It includes daily and weekly volume, CSAT score, pie chart on service level agreement. Pitch your topic with ease and precision using this Support Center Report On Customer Executive Performance Evaluation Background PDF. This layout presents information on Weekly Call Volume, Response Time, Service Level Agreement. It is also available for immediate download and adjustment. So, changes can be made in the color, design, graphics or any other component to create a unique layout.
Cost Control Performance Dashboard Icon Themes Pdf
Showcasing this set of slides titled Cost Control Performance Dashboard Icon Themes Pdf. The topics addressed in these templates are Cost Control, Performance, Dashboard. All the content presented in this PPT design is completely editable. Download it and make adjustments in color, background, font etc. as per your unique business setting. Our Cost Control Performance Dashboard Icon Themes Pdf are topically designed to provide an attractive backdrop to any subject. Use them to look like a presentation pro.
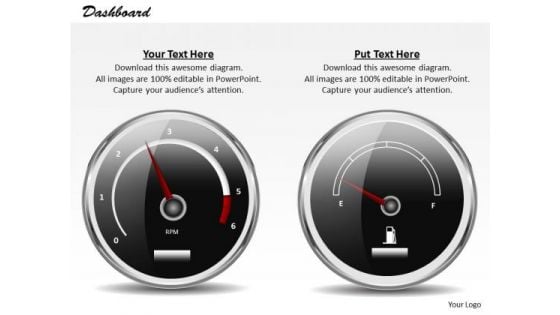
Business Cycle Diagram Dashboard Design To Communicate Effectively Strategy Diagram
Get Out Of The Dock With Our Business Cycle Diagram Dashboard Design To Communicate Effectively Strategy Diagram Powerpoint Templates. Your Mind Will Be Set Free.
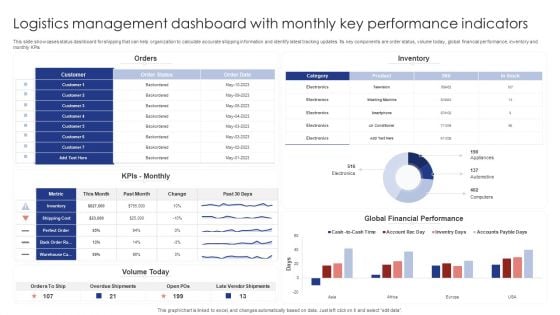
Logistics Management Dashboard With Monthly Key Performance Indicators Rules PDF
This slide showcases status dashboard for shipping that can help organization to calculate accurate shipping information and identify latest tracking updates. Its key components are order status, volume today, global financial performance, inventory and monthly KPIs. Pitch your topic with ease and precision using this Logistics Management Dashboard With Monthly Key Performance Indicators Rules PDF. This layout presents information on Orders, Inventory, Kpis Monthly. It is also available for immediate download and adjustment. So, changes can be made in the color, design, graphics or any other component to create a unique layout.
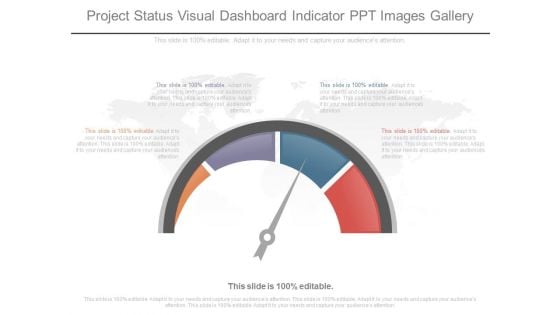
Project Status Visual Dashboard Indicator Ppt Images Gallery
This is a project status visual dashboard indicator ppt images gallery. This is a four stage process. The stages in this process are business, marketing, dashboard, measure, presentation.
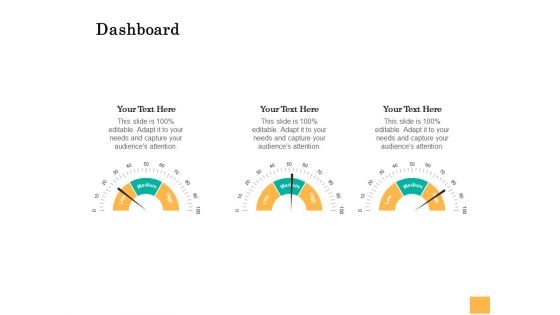
Equity Capital Funding Dashboard Ppt Model Show PDF
Deliver an awe-inspiring pitch with this creative equity capital funding dashboard ppt model show pdf bundle. Topic like dashboard can be discussed with this completely editable template. It is available for immediate download depending on the needs and requirements of the user.


 Continue with Email

 Home
Home


