Snapshot
Corporate Branding Performance Tracking Dashboard Effective Brand Maintenance Pictures Pdf
This slide provides information regarding corporate branding performance tracking dashboard in terms of leads, conversion metrics, web traffic, etc. Find highly impressive Corporate Branding Performance Tracking Dashboard Effective Brand Maintenance Pictures Pdf on Slidegeeks to deliver a meaningful presentation. You can save an ample amount of time using these presentation templates. No need to worry to prepare everything from scratch because Slidegeeks experts have already done a huge research and work for you. You need to download Corporate Branding Performance Tracking Dashboard Effective Brand Maintenance Pictures Pdf for your upcoming presentation. All the presentation templates are 100 percent editable and you can change the color and personalize the content accordingly. Download now. This slide provides information regarding corporate branding performance tracking dashboard in terms of leads, conversion metrics, web traffic, etc.

Global Data Security Industry Report Porters Framework Detailed Five Forces Analysis For Cybersecurity IR SS V
The slide highlights Porters framework and its implications in the cybersecurity industry. Evaluating the five forces can assist businesses in anticipating changes in the competition, influencing the evolution of industry structure, and finding more beneficial strategic positions. It covers the threat of new entrants and substitutes, competitive rivalry, and the bargaining power of suppliers and buyers. Welcome to our selection of the Global Data Security Industry Report Porters Framework Detailed Five Forces Analysis For Cybersecurity IR SS V. These are designed to help you showcase your creativity and bring your sphere to life. Planning and Innovation are essential for any business that is just starting out. This collection contains the designs that you need for your everyday presentations. All of our PowerPoints are 100Percent editable, so you can customize them to suit your needs. This multi-purpose template can be used in various situations. Grab these presentation templates today. The slide highlights Porters framework and its implications in the cybersecurity industry. Evaluating the five forces can assist businesses in anticipating changes in the competition, influencing the evolution of industry structure, and finding more beneficial strategic positions. It covers the threat of new entrants and substitutes, competitive rivalry, and the bargaining power of suppliers and buyers.
Icon For Measuring Customer Satisfaction In Quality Kpis Of Project Management Template PDF
Presenting Icon For Measuring Customer Satisfaction In Quality Kpis Of Project Management Template PDF to dispense important information. This template comprises three stages. It also presents valuable insights into the topics including Icon For Measuring Customer, Satisfaction In Quality, Kpis Of Project Management. This is a completely customizable PowerPoint theme that can be put to use immediately. So, download it and address the topic impactfully.

Employee Relations In Human Resource Dashboard To Analyze Employees Related Metrics Performance
This slide shows dashboard which can be used by organizations to measure the results of employee relation management. It includes metrics such as media coverage rate, social media engagement rate, share of voice and brand mentions. Present like a pro with Employee Relations In Human Resource Dashboard To Analyze Employees Related Metrics Performance. Create beautiful presentations together with your team, using our easy-to-use presentation slides. Share your ideas in real-time and make changes on the fly by downloading our templates. So whether you are in the office, on the go, or in a remote location, you can stay in sync with your team and present your ideas with confidence. With Slidegeeks presentation got a whole lot easier. Grab these presentations today. This slide shows dashboard which can be used by organizations to measure the results of employee relation management. It includes metrics such as media coverage rate, social media engagement rate, share of voice and brand mentions.
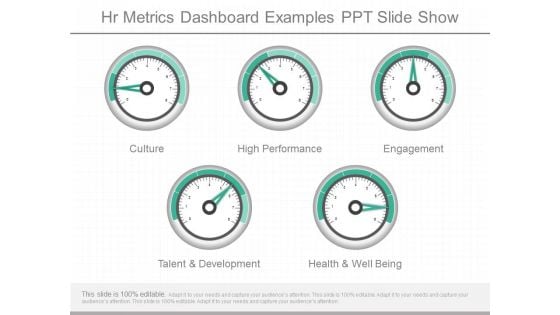
Hr Metrics Dashboard Examples Ppt Slide Show
This is a hr metrics dashboard examples ppt slide show. This is a five stage process. The stages in this process are culture, high performance, engagement, talent and development, health and well being.
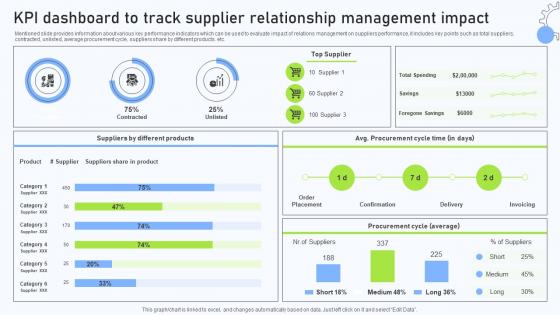
Relationship Management Automation KPI Dashboard To Track Supplier Relationship
Mentioned slide provides information about various key performance indicators which can be used to evaluate impact of relations management on suppliers performance, it includes key points such as total suppliers, contracted, unlisted, average procurement cycle, suppliers share by different products. etc. This Relationship Management Automation KPI Dashboard To Track Supplier Relationship is perfect for any presentation, be it in front of clients or colleagues. It is a versatile and stylish solution for organizing your meetings. The Relationship Management Automation KPI Dashboard To Track Supplier Relationship features a modern design for your presentation meetings. The adjustable and customizable slides provide unlimited possibilities for acing up your presentation. Slidegeeks has done all the homework before launching the product for you. So, do not wait, grab the presentation templates today Mentioned slide provides information about various key performance indicators which can be used to evaluate impact of relations management on suppliers performance, it includes key points such as total suppliers, contracted, unlisted, average procurement cycle, suppliers share by different products. etc.

Product Analytics Dashboard To Track Engagement Driving Business Success Integrating Product
This slide illustrates a dashboard to monitor customer engagement on company website by leveraging product analytics tools aimed at making necessary improvements. It covers insights regarding active monthly users, new users, total completed purchases, screen views, average duration of session, etc. There are so many reasons you need a Product Analytics Dashboard To Track Engagement Driving Business Success Integrating Product. The first reason is you can not spend time making everything from scratch, Thus, Slidegeeks has made presentation templates for you too. You can easily download these templates from our website easily. This slide illustrates a dashboard to monitor customer engagement on company website by leveraging product analytics tools aimed at making necessary improvements. It covers insights regarding active monthly users, new users, total completed purchases, screen views, average duration of session, etc.
Employee Key Performance Indicators Dashboard Icon Designs PDF
Showcasing this set of slides titled Employee Key Performance Indicators Dashboard Icon Designs PDF The topics addressed in these templates are Employee Key, Performance Indicators, Dashboard Icon All the content presented in this PPT design is completely editable. Download it and make adjustments in color, background, font etc. as per your unique business setting.
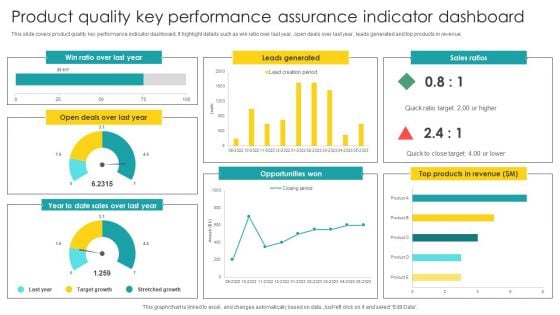
Product Quality Key Performance Assurance Indicator Dashboard Graphics PDF
Showcasing this set of slides titled Product Quality Key Performance Assurance Indicator Dashboard Graphics PDF. The topics addressed in these templates are Key Performance, Assurance Indicator, Dashboard. All the content presented in this PPT design is completely editable. Download it and make adjustments in color, background, font etc. as per your unique business setting.
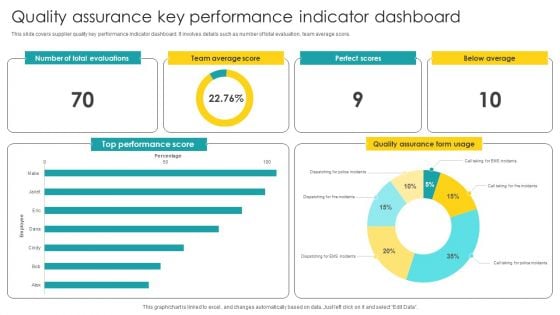
Quality Assurance Key Performance Indicator Dashboard Structure PDF
Showcasing this set of slides titled Quality Assurance Key Performance Indicator Dashboard Structure PDF. The topics addressed in these templates are Key Performance, Indicator Dashboard. All the content presented in this PPT design is completely editable. Download it and make adjustments in color, background, font etc. as per your unique business setting.
Sales Key Performance Indicators Dashboard Ppt PowerPoint Presentation Icon PDF
Presenting this set of slides with name sales key performance indicators dashboard ppt powerpoint presentation icon pdf. The topics discussed in these slides are current ticket volume, sales key performance, indicators dashboard. This is a completely editable PowerPoint presentation and is available for immediate download. Download now and impress your audience.
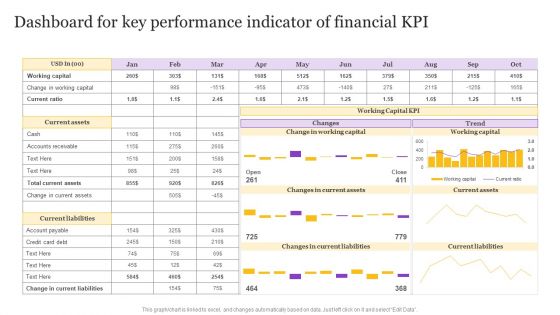
Dashboard For Key Performance Indicator Of Financial KPI Background PDF
Pitch your topic with ease and precision using this Dashboard For Key Performance Indicator Of Financial KPI Background PDF. This layout presents information on Dashboard For Key, Performance Indicator, Financial KPI. It is also available for immediate download and adjustment. So, changes can be made in the color, design, graphics or any other component to create a unique layout.
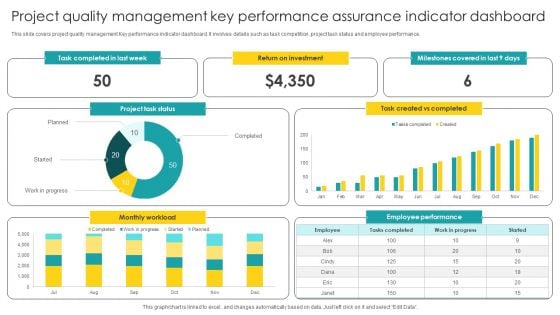
Project Quality Management Key Performance Assurance Indicator Dashboard Guidelines PDF
Pitch your topic with ease and precision using this Project Quality Management Key Performance Assurance Indicator Dashboard Guidelines PDF. This layout presents information on Management Key, Performance Assurance, Indicator Dashboard. It is also available for immediate download and adjustment. So, changes can be made in the color, design, graphics or any other component to create a unique layout.

Alliance Evaluation Dashboard Ppt Pictures Sample PDF
Presenting this set of slides with name alliance evaluation dashboard ppt pictures sample pdf. This is a three stage process. The stages in this process are low, medium, high. This is a completely editable PowerPoint presentation and is available for immediate download. Download now and impress your audience.
Overall Brand Performance Tracking Dashboard Toolkit For Brand Planning Information Pdf
This slide provides information regarding brand performance tracking dashboard capturing KPIs such as brand metric, brand commitment, advertising metrics, and purchase metrics. Here you can discover an assortment of the finest PowerPoint and Google Slides templates. With these templates, you can create presentations for a variety of purposes while simultaneously providing your audience with an eye catching visual experience. Download Overall Brand Performance Tracking Dashboard Toolkit For Brand Planning Information Pdf to deliver an impeccable presentation. These templates will make your job of preparing presentations much quicker, yet still, maintain a high level of quality. Slidegeeks has experienced researchers who prepare these templates and write high quality content for you. Later on, you can personalize the content by editing the Overall Brand Performance Tracking Dashboard Toolkit For Brand Planning Information Pdf. This slide provides information regarding brand performance tracking dashboard capturing KPIs such as brand metric, brand commitment, advertising metrics, and purchase metrics.
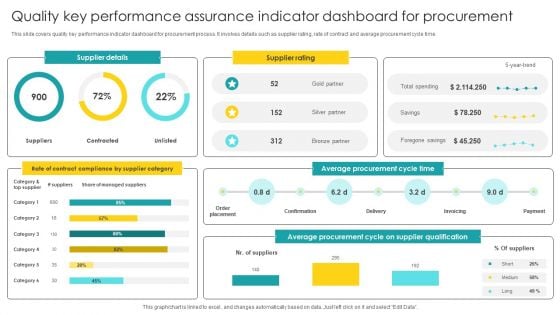
Quality Key Performance Assurance Indicator Dashboard For Procurement Elements PDF
Pitch your topic with ease and precision using this Quality Key Performance Assurance Indicator Dashboard For Procurement Elements PDF. This layout presents information on Indicator Dashboard, Procurement. It is also available for immediate download and adjustment. So, changes can be made in the color, design, graphics or any other component to create a unique layout.
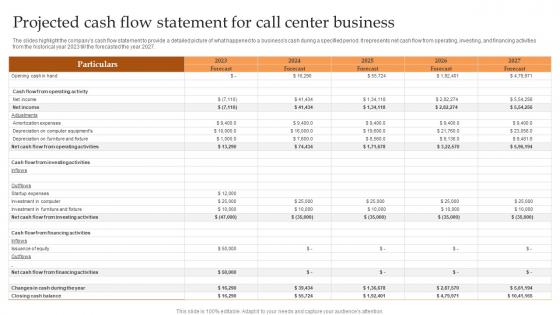
Projected Cash Flow Statement For Call Center IT And Tech Support Business Pictures Pdf
The slides highlight the companys cash flow statement to provide a detailed picture of what happened to a businesss cash during a specified period. It represents net cash flow from operating, investing, and financing activities from the historical year 2023 till the forecasted the year 2027. Create an editable Projected Cash Flow Statement For Call Center IT And Tech Support Business Pictures Pdf that communicates your idea and engages your audience. Whether you are presenting a business or an educational presentation, pre-designed presentation templates help save time. Projected Cash Flow Statement For Call Center IT And Tech Support Business Pictures Pdf is highly customizable and very easy to edit, covering many different styles from creative to business presentations. Slidegeeks has creative team members who have crafted amazing templates. So, go and get them without any delay. The slides highlight the companys cash flow statement to provide a detailed picture of what happened to a businesss cash during a specified period. It represents net cash flow from operating, investing, and financing activities from the historical year 2023 till the forecasted the year 2027.
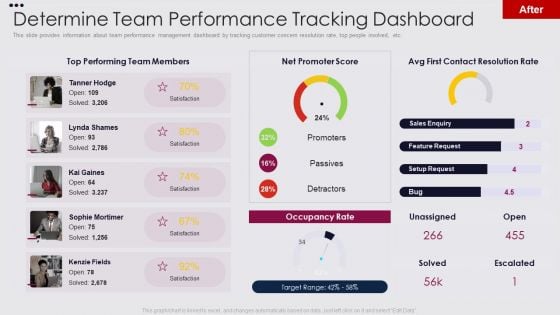
Employee Performance Improvement Framework Determine Team Performance Ideas PDF
This slide provides information about team performance management dashboard by tracking customer concern resolution rate, top people involved, etc. Deliver and pitch your topic in the best possible manner with this employee performance improvement framework determine team performance ideas pdf. Use them to share invaluable insights on determine team performance tracking dashboard and impress your audience. This template can be altered and modified as per your expectations. So, grab it now.
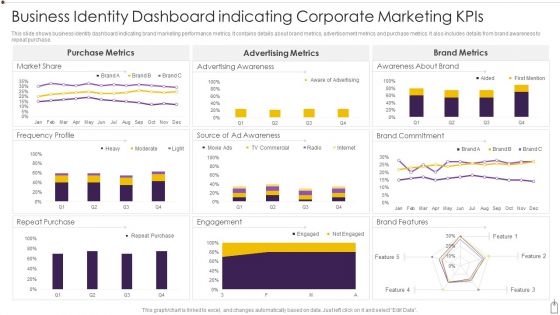
Business Identity Dashboard Indicating Corporate Marketing Kpis Diagrams PDF
This slide shows business identity dashboard indicating brand marketing performance metrics. It contains details about brand metrics, advertisement metrics and purchase metrics. It also includes details from brand awareness to repeat purchase. Showcasing this set of slides titled Business Identity Dashboard Indicating Corporate Marketing Kpis Diagrams PDF. The topics addressed in these templates are Purchase, Engagement, Market Share. All the content presented in this PPT design is completely editable. Download it and make adjustments in color, background, font etc. as per your unique business setting.
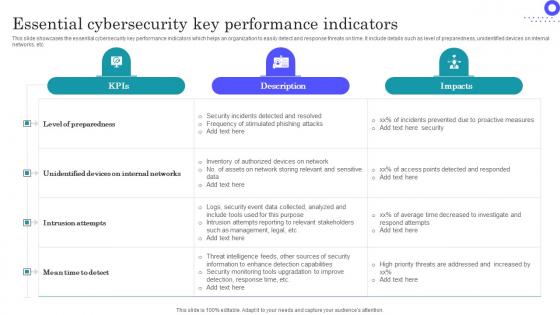
Essential Cybersecurity Key Performance Indicators Download Pdf
Showcasing this set of slides titled Essential Cybersecurity Key Performance Indicators Download Pdf The topics addressed in these templates are Level Preparedness, Internal Networks, Intrusion Attempts All the content presented in this PPT design is completely editable. Download it and make adjustments in color, background, font etc. as per your unique business setting. This slide showcases the essential cybersecurity key performance indicators which helps an organization to easily detect and response threats on time. It include details such as level of preparedness, unidentified devices on internal networks, etc.
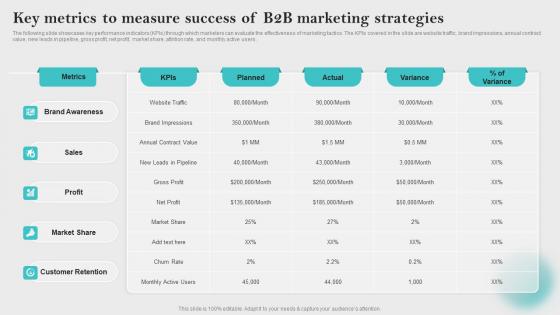
Key Metrics To Measure Success Innovative Business Promotion Ideas Pictures Pdf
The following slide showcases key performance indicators KPIs through which marketers can evaluate the effectiveness of marketing tactics. The KPIs covered in the slide are website traffic, brand impressions, annual contract value, new leads in pipeline, gross profit, net profit, market share, attrition rate, and monthly active users. Slidegeeks has constructed Key Metrics To Measure Success Innovative Business Promotion Ideas Pictures Pdf after conducting extensive research and examination. These presentation templates are constantly being generated and modified based on user preferences and critiques from editors. Here, you will find the most attractive templates for a range of purposes while taking into account ratings and remarks from users regarding the content. This is an excellent jumping off point to explore our content and will give new users an insight into our top notch PowerPoint Templates. The following slide showcases key performance indicators KPIs through which marketers can evaluate the effectiveness of marketing tactics. The KPIs covered in the slide are website traffic, brand impressions, annual contract value, new leads in pipeline, gross profit, net profit, market share, attrition rate, and monthly active users.
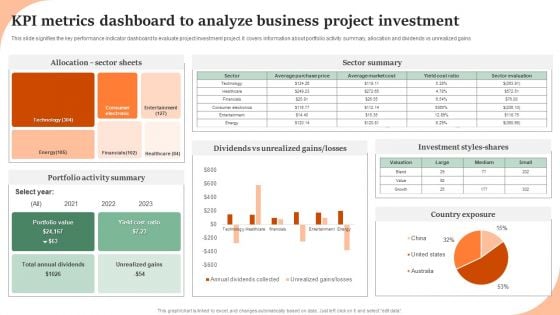
KPI Metrics Dashboard To Analyze Business Project Investment Graphics PDF
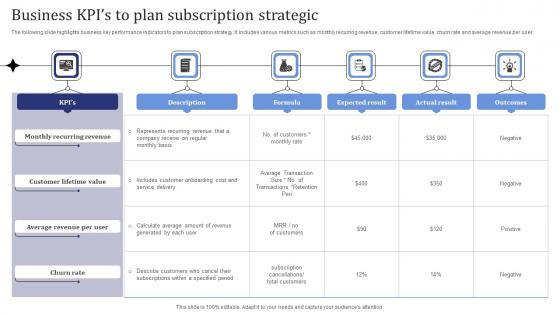
Business Kpis To Plan Subscription Strategic Pictures Pdf
The following slide highlights business key performance indicators to plan subscription strategy. It includes various metrics such as monthly recurring revenue, customer lifetime value, churn rate and average revenue per user. Showcasing this set of slides titled Business Kpis To Plan Subscription Strategic Pictures Pdf. The topics addressed in these templates are Monthly Recurring Revenue, Customer Lifetime Value, Churn Rate. All the content presented in this PPT design is completely editable. Download it and make adjustments in color, background, font etc. as per your unique business setting. The following slide highlights business key performance indicators to plan subscription strategy. It includes various metrics such as monthly recurring revenue, customer lifetime value, churn rate and average revenue per user.
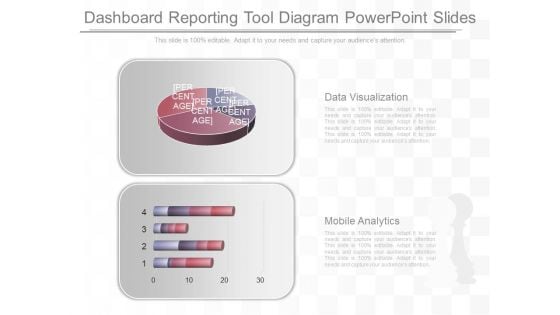
Dashboard Reporting Tool Diagram Powerpoint Slides
This is a dashboard reporting tool diagram powerpoint slides. This is a two stage process. The stages in this process are data visualization, mobile analytics.
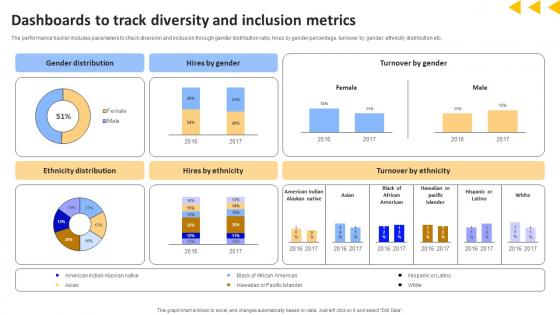
Workforce Productivity Improvement Dashboards To Track Diversity And Inclusion Metrics Structure Pdf
The performance tracker includes parameters to check diversion and inclusion through gender distribution ratio, hires by gender percentage, turnover by gender, ethnicity distribution etc. Coming up with a presentation necessitates that the majority of the effort goes into the content and the message you intend to convey. The visuals of a PowerPoint presentation can only be effective if it supplements and supports the story that is being told. Keeping this in mind our experts created Workforce Productivity Improvement Dashboards To Track Diversity And Inclusion Metrics Structure Pdf to reduce the time that goes into designing the presentation. This way, you can concentrate on the message while our designers take care of providing you with the right template for the situation. The performance tracker includes parameters to check diversion and inclusion through gender distribution ratio, hires by gender percentage, turnover by gender, ethnicity distribution etc.
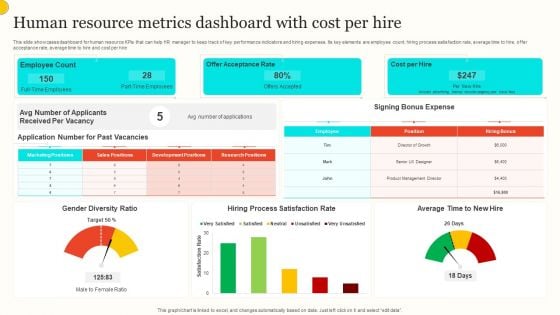
Human Resource Metrics Dashboard With Cost Per Hire Portrait PDF
This slide showcases dashboard for human resource KPIs that can help HR manager to keep track of key performance indicators and hiring expenses. Its key elements are employee count, hiring process satisfaction rate, average time to hire, offer acceptance rate, average time to hire and cost per hire. Showcasing this set of slides titled Human Resource Metrics Dashboard With Cost Per Hire Portrait PDF. The topics addressed in these templates are Employee Count, Offer Acceptance Rate, Cost Per Hire. All the content presented in this PPT design is completely editable. Download it and make adjustments in color, background, font etc. as per your unique business setting.
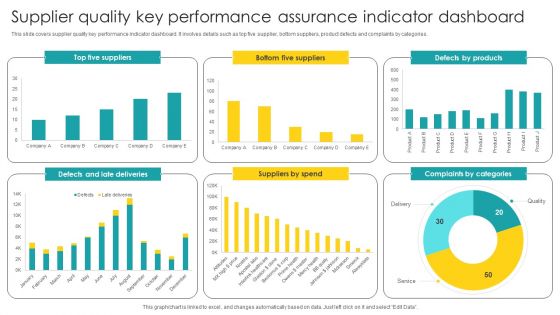
Supplier Quality Key Performance Assurance Indicator Dashboard Diagrams PDF
Showcasing this set of slides titled Supplier Quality Key Performance Assurance Indicator Dashboard Diagrams PDF. The topics addressed in these templates are Supplier Quality, Key Performance, Assurance Indicator. All the content presented in this PPT design is completely editable. Download it and make adjustments in color, background, font etc. as per your unique business setting.
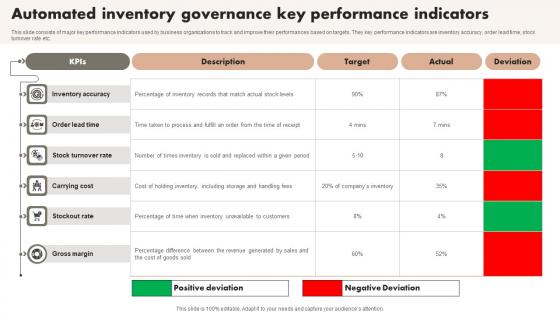
Automated Inventory Governance Key Performance Indicators Information Pdf
This slide consists of major key performance indicators used by business organizations to track and improve their performances based on targets. They key performance indicators are inventory accuracy, order lead time, stock turnover rate etc. Showcasing this set of slides titled Automated Inventory Governance Key Performance Indicators Information Pdf. The topics addressed in these templates are Description, Target, Actual. All the content presented in this PPT design is completely editable. Download it and make adjustments in color, background, font etc. as per your unique business setting. This slide consists of major key performance indicators used by business organizations to track and improve their performances based on targets. They key performance indicators are inventory accuracy, order lead time, stock turnover rate etc.

Financial Kpis For Business Growth Liquidity Efficiency And Solvency Ppt Powerpoint Presentation Summary Gridlines
This is a financial kpis for business growth liquidity efficiency and solvency ppt powerpoint presentation summary gridlines. This is a seven stage process. The stages in this process are dashboard, kpi, metrics.
Client Self Service Key Performance Indicators Icons Pdf
The following slide highlights key performance indicators of customer self service to offer enterprises actual and desired cost of support, measure efficiency etc. It includes key performance indicators such as net promoter score, customer effort score, self-service re-contact rate, conversion ratio and case deflection rate. Pitch your topic with ease and precision using this Client Self Service Key Performance Indicators Icons Pdf. This layout presents information on Description, Target, Actual. It is also available for immediate download and adjustment. So, changes can be made in the color, design, graphics or any other component to create a unique layout. The following slide highlights key performance indicators of customer self service to offer enterprises actual and desired cost of support, measure efficiency etc. It includes key performance indicators such as net promoter score, customer effort score, self-service re-contact rate, conversion ratio and case deflection rate.
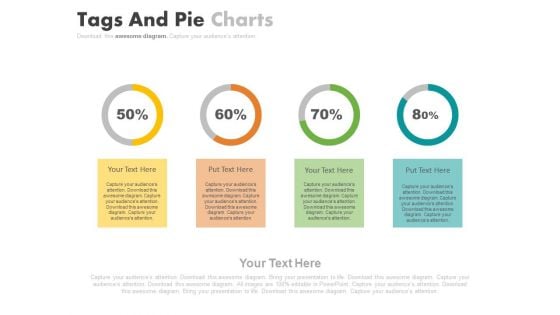
Four Steps For Financial Data Analysis Powerpoint Slides
This PowerPoint contains four circles with percentage values. Download this diagram slide to display financial data analysis. This template is editable, You can edit text, color, shade and style of this diagram as per you need.
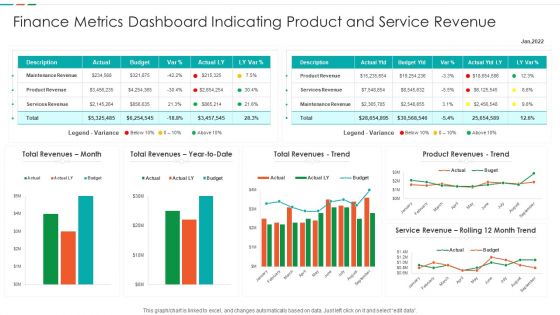
Finance Metrics Dashboard Indicating Product And Service Revenue Designs PDF
This graph or chart is linked to excel, and changes automatically based on data. Just left click on it and select edit data. Showcasing this set of slides titled Finance Metrics Dashboard Indicating Product And Service Revenue Designs PDF. The topics addressed in these templates are Maintenance Revenue Product, Revenue Product Revenues, Service Revenue Rolling. All the content presented in this PPT design is completely editable. Download it and make adjustments in color, background, font etc. as per your unique business setting.
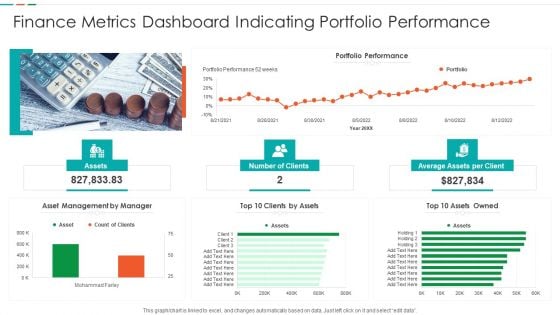
Finance Metrics Dashboard Indicating Portfolio Performance Microsoft PDF
This graph or chart is linked to excel, and changes automatically based on data. Just left click on it and select edit data. Pitch your topic with ease and precision using this Finance Metrics Dashboard Indicating Portfolio Performance Microsoft PDF. This layout presents information on Portfolio Performance Portfolio, Asset Management Manager, Top 10 Assets. It is also available for immediate download and adjustment. So, changes can be made in the color, design, graphics or any other component to create a unique layout.
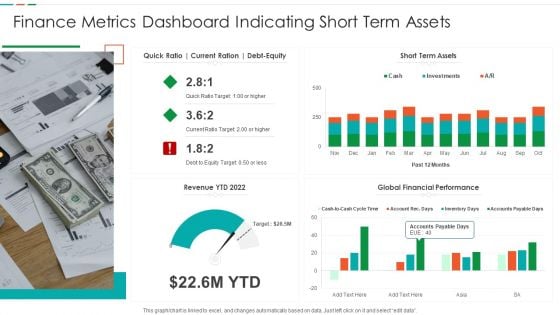
Finance Metrics Dashboard Indicating Short Term Assets Download PDF
This graph or chart is linked to excel, and changes automatically based on data. Just left click on it and select edit data. Pitch your topic with ease and precision using this Finance Metrics Dashboard Indicating Short Term Assets Download PDF. This layout presents information on Short Term Assets, Global Financial Performance, Revenue YTD 2022. It is also available for immediate download and adjustment. So, changes can be made in the color, design, graphics or any other component to create a unique layout.
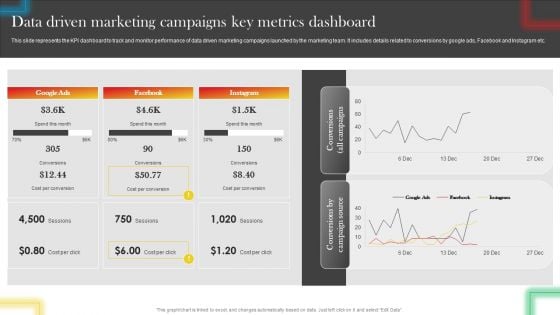
Data Driven Marketing Campaigns Key Metrics Dashboard Microsoft PDF
This slide represents the KPI dashboard to track and monitor performance of data driven marketing campaigns launched by the marketing team. It includes details related to conversions by google ads, Facebook and Instagram etc. There are so many reasons you need a Data Driven Marketing Campaigns Key Metrics Dashboard Microsoft PDF. The first reason is you can not spend time making everything from scratch, Thus, Slidegeeks has made presentation templates for you too. You can easily download these templates from our website easily.
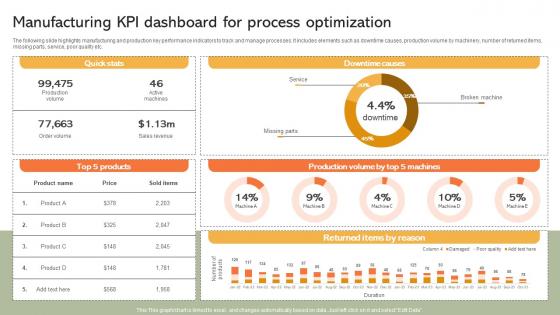
Manufacturing KPI Dashboard For Process Implementing Manufacturing Strategy SS V
The following slide highlights manufacturing and production key performance indicators to track and manage processes. It includes elements such as downtime causes, production volume by machinery, number of returned items, missing parts, service, poor quality etc. Formulating a presentation can take up a lot of effort and time, so the content and message should always be the primary focus. The visuals of the PowerPoint can enhance the presenters message, so our Manufacturing KPI Dashboard For Process Implementing Manufacturing Strategy SS V was created to help save time. Instead of worrying about the design, the presenter can concentrate on the message while our designers work on creating the ideal templates for whatever situation is needed. Slidegeeks has experts for everything from amazing designs to valuable content, we have put everything into Manufacturing KPI Dashboard For Process Implementing Manufacturing Strategy SS V The following slide highlights manufacturing and production key performance indicators to track and manage processes. It includes elements such as downtime causes, production volume by machinery, number of returned items, missing parts, service, poor quality etc.

Cybersecurity Key Performance Indicators With Applications Summary Pdf
Pitch your topic with ease and precision using this Cybersecurity Key Performance Indicators With Applications Summary Pdf This layout presents information on Identify Weaknesses, Review Improvement, Security Policies It is also available for immediate download and adjustment. So, changes can be made in the color, design, graphics or any other component to create a unique layout. This slide showcases the cyber security key performance indicators with applications which helps an organization to determine readiness. It include details such as security policies, identify weaknesses, obligation to compliance framework, etc.
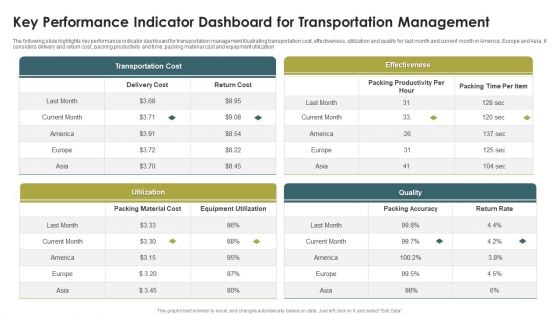
Key Performance Indicator Dashboard For Transportation Management Formats PDF
The following slide highlights key performance indicator dashboard for transportation management illustrating transportation cost, effectiveness, utilization and quality for last month and current month in America, Europe and Asia, it considers delivery and return cost, packing productivity and time, packing material cost and equipment utilization. Showcasing this set of slides titled Key Performance Indicator Dashboard For Transportation Management Formats PDF. The topics addressed in these templates are Transportation Cost, Effectiveness, Utilization, Quality. All the content presented in this PPT design is completely editable. Download it and make adjustments in color, background, font etc. as per your unique business setting.
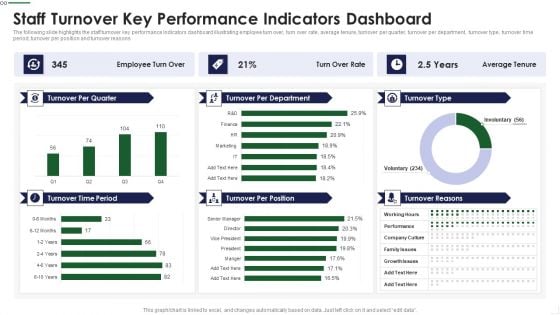
Staff Turnover Key Performance Indicators Dashboard Sample PDF
The following slide highlights the staff turnover key performance Indicators dashboard illustrating employee turn over, turn over rate, average tenure, turnover per quarter, turnover per department, turnover type, turnover time period, turnover per position and turnover reasons Deliver and pitch your topic in the best possible manner with this Staff Turnover Key Performance Indicators Dashboard Sample PDF Use them to share invaluable insights on Management Goals, Subjective Appraisal, Product Defects and impress your audience. This template can be altered and modified as per your expectations. So, grab it now.
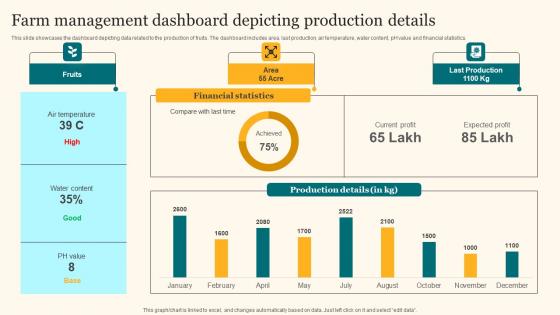
Farm Management Dashboard Depicting Agricultural Product Promotion Pictures Pdf
This slide showcases the dashboard depicting data related to the production of fruits. The dashboard includes area, last production, air temperature, water content, pH value and financial statistics. This modern and well-arranged Farm Management Dashboard Depicting Agricultural Product Promotion Pictures Pdf provides lots of creative possibilities. It is very simple to customize and edit with the Powerpoint Software. Just drag and drop your pictures into the shapes. All facets of this template can be edited with Powerpoint, no extra software is necessary. Add your own material, put your images in the places assigned for them, adjust the colors, and then you can show your slides to the world, with an animated slide included. This slide showcases the dashboard depicting data related to the production of fruits. The dashboard includes area, last production, air temperature, water content, pH value and financial statistics.
Application Performance Dashboard Mobile App Development Advertising Service Icons Pdf
This slide covers application performance in market KPIs and metrics such as impressions, clicks, searches for app, conversion rate etc. Find a pre designed and impeccable Application Performance Dashboard Mobile App Development Advertising Service Icons Pdf. The templates can ace your presentation without additional effort. You can download these easy to edit presentation templates to make your presentation stand out from others. So, what are you waiting for Download the template from Slidegeeks today and give a unique touch to your presentation. This slide covers application performance in market KPIs and metrics such as impressions, clicks, searches for app, conversion rate etc.
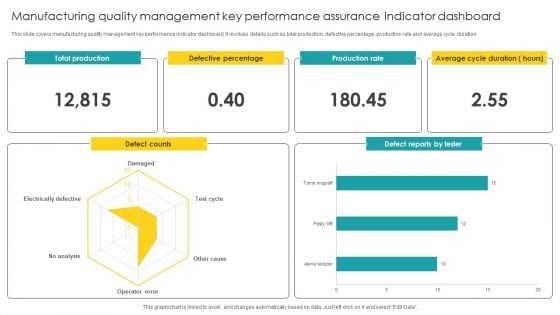
Manufacturing Quality Management Key Performance Assurance Indicator Dashboard Microsoft PDF
Pitch your topic with ease and precision using this Manufacturing Quality Management Key Performance Assurance Indicator Dashboard Microsoft PDF. This layout presents information on Quality Management, Key Performance Assurance. It is also available for immediate download and adjustment. So, changes can be made in the color, design, graphics or any other component to create a unique layout.
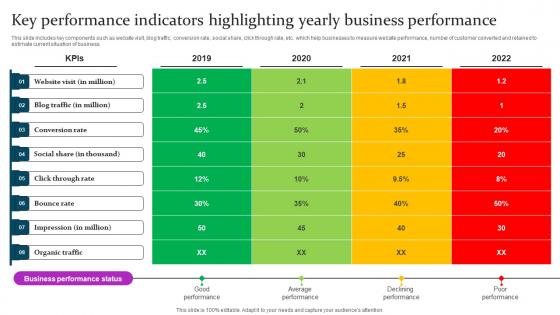
Key Performance Indicators Marketing Mix Communication Guide Client Elements Pdf
This slide includes key components such as website visit, blog traffic, conversion rate, social share, click through rate, etc. which help businesses to measure website performance, number of customer converted and retained to estimate current situation of business. Whether you have daily or monthly meetings, a brilliant presentation is necessary. Key Performance Indicators Marketing Mix Communication Guide Client Elements Pdf can be your best option for delivering a presentation. Represent everything in detail using Key Performance Indicators Marketing Mix Communication Guide Client Elements Pdf and make yourself stand out in meetings. The template is versatile and follows a structure that will cater to your requirements. All the templates prepared by Slidegeeks are easy to download and edit. Our research experts have taken care of the corporate themes as well. So, give it a try and see the results. This slide includes key components such as website visit, blog traffic, conversion rate, social share, click through rate, etc. which help businesses to measure website performance, number of customer converted and retained to estimate current situation of business.

Key Performance Indicators To Measure Seo Performance Step By Step Guide Download PDF
Following slide showcases indicators to track performance of implemented SEO strategies on website. It include metrics such as conversion rates, load time, search rankings, backlinks etc. This Key Performance Indicators To Measure Seo Performance Step By Step Guide Download PDF is perfect for any presentation, be it in front of clients or colleagues. It is a versatile and stylish solution for organizing your meetings. The Key Performance Indicators To Measure Seo Performance Step By Step Guide Download PDF features a modern design for your presentation meetings. The adjustable and customizable slides provide unlimited possibilities for acing up your presentation. Slidegeeks has done all the homework before launching the product for you. So, do not wait, grab the presentation templates today Following slide showcases indicators to track performance of implemented SEO strategies on website. It include metrics such as conversion rates, load time, search rankings, backlinks etc.
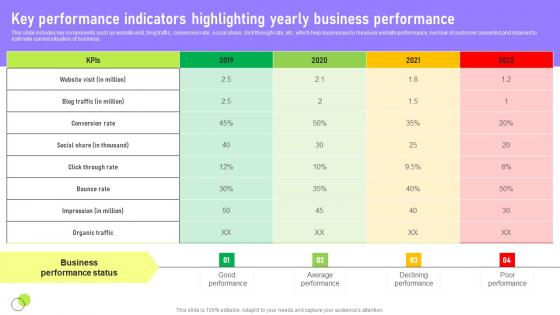
Key Performance Indicators Deployment Of Marketing Communication Clipart Pdf
This slide includes key components such as website visit, blog traffic, conversion rate, social share, click through rate, etc. which help businesses to measure website performance, number of customer converted and retained to estimate current situation of business. Are you in need of a template that can accommodate all of your creative concepts This one is crafted professionally and can be altered to fit any style. Use it with Google Slides or PowerPoint. Include striking photographs, symbols, depictions, and other visuals. Fill, move around, or remove text boxes as desired. Test out color palettes and font mixtures. Edit and save your work, or work with colleagues. Download Key Performance Indicators Deployment Of Marketing Communication Clipart Pdf and observe how to make your presentation outstanding. Give an impeccable presentation to your group and make your presentation unforgettable. This slide includes key components such as website visit, blog traffic, conversion rate, social share, click through rate, etc. which help businesses to measure website performance, number of customer converted and retained to estimate current situation of business.
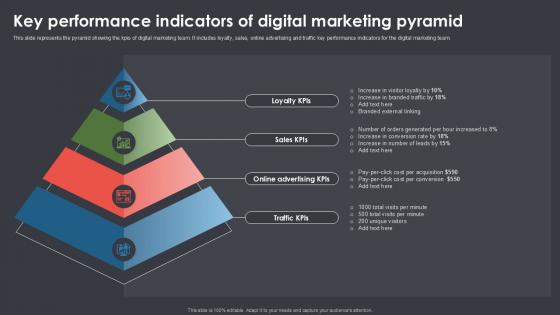
Key Performance Indicators Of Digital Marketing Pyramid Ppt Presentation SS
The following slide showcases green business management with triple bottom line method. It provides information about people, planet, profits, ambitions, commitments, enablers, etc Welcome to our selection of the Key Performance Indicators Of Digital Marketing Pyramid Ppt Presentation SS These are designed to help you showcase your creativity and bring your sphere to life. Planning and Innovation are essential for any business that is just starting out. This collection contains the designs that you need for your everyday presentations. All of our PowerPoints are 100Percent editable, so you can customize them to suit your needs. This multi-purpose template can be used in various situations. Grab these presentation templates today. The following slide showcases green business management with triple bottom line method. It provides information about people, planet, profits, ambitions, commitments, enablers, etc
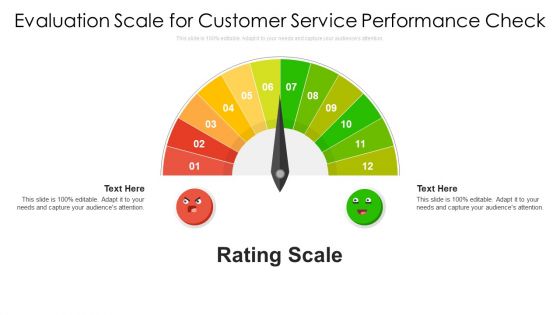
Evaluation Scale For Customer Service Ppt PowerPoint Presentation File Designs PDF
Persuade your audience using this evaluation scale for customer service ppt powerpoint presentation file designs pdf. This PPT design covers two stages, thus making it a great tool to use. It also caters to a variety of topics including evaluation scale for customer service performance check. Download this PPT design now to present a convincing pitch that not only emphasizes the topic but also showcases your presentation skills.
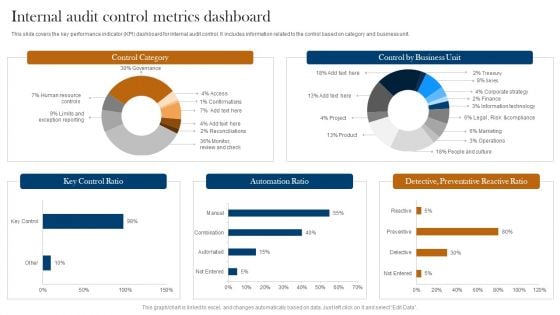
Internal Audit Control Metrics Dashboard Ppt Professional Design Templates PDF
This slide covers the key performance indicator KPI dashboard for internal audit control. It includes information related to the control based on category and business unit. Showcasing this set of slides titled Internal Audit Control Metrics Dashboard Ppt Professional Design Templates PDF. The topics addressed in these templates are Control Category, Key Control Ratio, Automation Ratio. All the content presented in this PPT design is completely editable. Download it and make adjustments in color, background, font etc. as per your unique business setting.

Reach Your Target Audience Marketing Dashboard Ppt Pictures Show PDF
This is a reach your target audience marketing dashboard ppt pictures show pdf template with various stages. Focus and dispense information on three stages using this creative set, that comes with editable features. It contains large content boxes to add your information on topics like marketing dashboard. You can also showcase facts, figures, and other relevant content using this PPT layout. Grab it now.
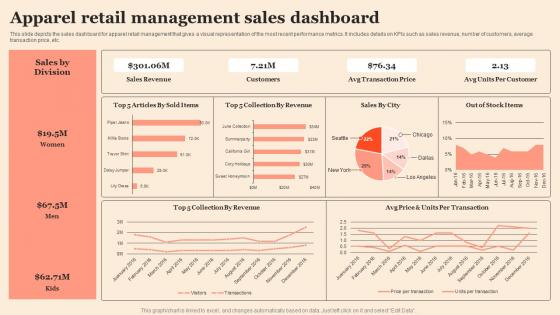
Apparel Retail Management Sales Dashboard Professional Pdf
This slide depicts the sales dashboard for apparel retail management that gives a visual representation of the most recent performance metrics. It includes details on KPIs such as sales revenue, number of customers, average transaction price, etc.Pitch your topic with ease and precision using this Apparel Retail Management Sales Dashboard Professional Pdf This layout presents information on Sales Revenue, Transaction Price, Units Per Customer It is also available for immediate download and adjustment. So, changes can be made in the color, design, graphics or any other component to create a unique layout. This slide depicts the sales dashboard for apparel retail management that gives a visual representation of the most recent performance metrics. It includes details on KPIs such as sales revenue, number of customers, average transaction price, etc.
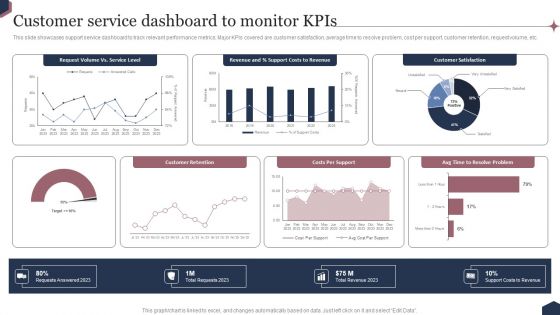
Enhance Customer Engagement Through After Sales Activities Customer Service Dashboard To Monitor Kpis Introduction PDF
This slide showcases support service dashboard to track relevant performance metrics. Major KPIs covered are customer satisfaction, average time to resolve problem, cost per support, customer retention, request volume, etc. Slidegeeks is here to make your presentations a breeze with Enhance Customer Engagement Through After Sales Activities Customer Service Dashboard To Monitor Kpis Introduction PDF With our easy to use and customizable templates, you can focus on delivering your ideas rather than worrying about formatting. With a variety of designs to choose from, you are sure to find one that suits your needs. And with animations and unique photos, illustrations, and fonts, you can make your presentation pop. So whether you are giving a sales pitch or presenting to the board, make sure to check out Slidegeeks first.
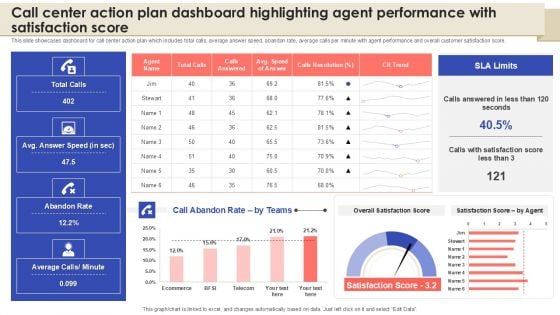
Call Center Action Plan Dashboard Highlighting Agent Performance With Satisfaction Score Topics PDF
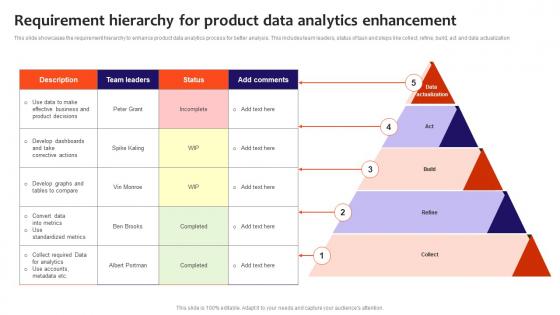
Requirement Hierarchy For Product Data Analytics Enhancement Clipart Pdf
This slide showcases the requirement hierarchy to enhance product data analytics process for better analysis. This includes team leaders, status of task and steps like collect, refine, build, act and data actualization Showcasing this set of slides titled Requirement Hierarchy For Product Data Analytics Enhancement Clipart Pdf. The topics addressed in these templates are Develop Graphs, Collect Required Data, Develop Dashboards. All the content presented in this PPT design is completely editable. Download it and make adjustments in color, background, font etc. as per your unique business setting. This slide showcases the requirement hierarchy to enhance product data analytics process for better analysis. This includes team leaders, status of task and steps like collect, refine, build, act and data actualization
Data Quality Measurement Dashboard Vector Icon Ppt PowerPoint Presentation Slides Designs Download PDF
Persuade your audience using this data quality measurement dashboard vector icon ppt powerpoint presentation slides designs download pdf. This PPT design covers three stages, thus making it a great tool to use. It also caters to a variety of topics including data quality measurement dashboard vector icon. Download this PPT design now to present a convincing pitch that not only emphasizes the topic but also showcases your presentation skills.
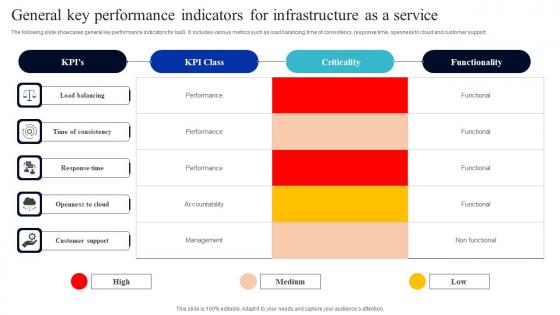
General Key Performance Indicators For Infrastructure As A Service Download Pdf
The following slide showcases general key performance indicators for IaaS. It includes various metrics such as load balancing, time of consistency, response time, openness to cloud and customer support. Pitch your topic with ease and precision using this General Key Performance Indicators For Infrastructure As A Service Download Pdf. This layout presents information on Response Time, Openness To Cloud, Customer Support. It is also available for immediate download and adjustment. So, changes can be made in the color, design, graphics or any other component to create a unique layout. The following slide showcases general key performance indicators for IaaS. It includes various metrics such as load balancing, time of consistency, response time, openness to cloud and customer support.
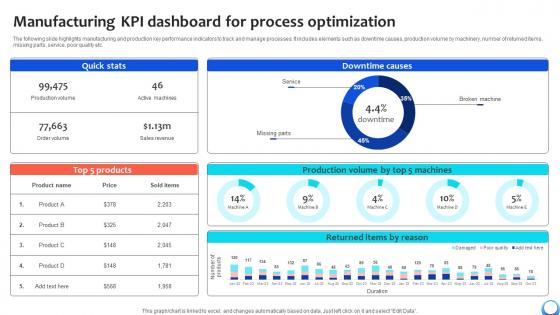
Manufacturing KPI Dashboard For Process Optimization Automating Production Process Strategy SS V
The following slide highlights manufacturing and production key performance indicators to track and manage processes. It includes elements such as downtime causes, production volume by machinery, number of returned items, missing parts, service, poor quality etc. Formulating a presentation can take up a lot of effort and time, so the content and message should always be the primary focus. The visuals of the PowerPoint can enhance the presenters message, so our Manufacturing KPI Dashboard For Process Optimization Automating Production Process Strategy SS V was created to help save time. Instead of worrying about the design, the presenter can concentrate on the message while our designers work on creating the ideal templates for whatever situation is needed. Slidegeeks has experts for everything from amazing designs to valuable content, we have put everything into Manufacturing KPI Dashboard For Process Optimization Automating Production Process Strategy SS V The following slide highlights manufacturing and production key performance indicators to track and manage processes. It includes elements such as downtime causes, production volume by machinery, number of returned items, missing parts, service, poor quality etc.
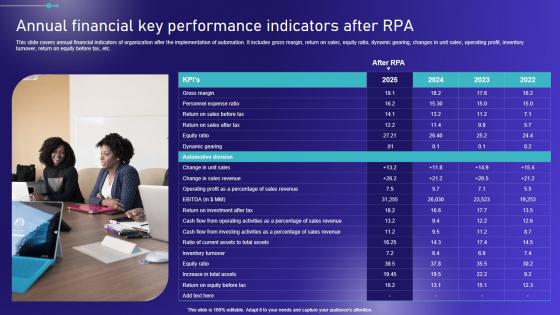
Annual Financial Key Performance Indicators After Embracing Robotic Process Elements PDF
This slide covers annual financial indicators of organization after the implementation of automation. It includes gross margin, return on sales, equity ratio, dynamic gearing, changes in unit sales, operating profit, inventory turnover, return on equity before tax, etc. Slidegeeks is one of the best resources for PowerPoint templates. You can download easily and regulate Annual Financial Key Performance Indicators After Embracing Robotic Process Elements PDF for your personal presentations from our wonderful collection. A few clicks is all it takes to discover and get the most relevant and appropriate templates. Use our Templates to add a unique zing and appeal to your presentation and meetings. All the slides are easy to edit and you can use them even for advertisement purposes. This slide covers annual financial indicators of organization after the implementation of automation. It includes gross margin, return on sales, equity ratio, dynamic gearing, changes in unit sales, operating profit, inventory turnover, return on equity before tax, etc.
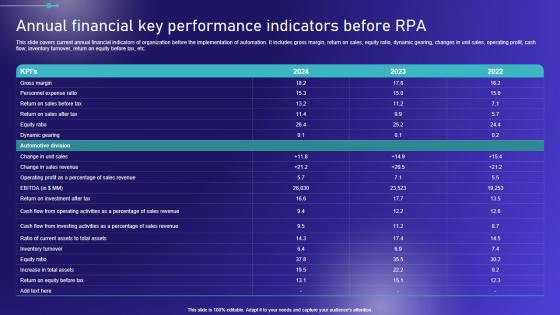
Annual Financial Key Performance Indicators Before Embracing Robotic Process Graphics PDF
This slide covers current annual financial indicators of organization before the implementation of automation. It includes gross margin, return on sales, equity ratio, dynamic gearing, changes in unit sales, operating profit, cash flow, inventory turnover, return on equity before tax, etc. Want to ace your presentation in front of a live audience Our Annual Financial Key Performance Indicators Before Embracing Robotic Process Graphics PDF can help you do that by engaging all the users towards you. Slidegeeks experts have put their efforts and expertise into creating these impeccable powerpoint presentations so that you can communicate your ideas clearly. Moreover, all the templates are customizable, and easy-to-edit and downloadable. Use these for both personal and commercial use. This slide covers current annual financial indicators of organization before the implementation of automation. It includes gross margin, return on sales, equity ratio, dynamic gearing, changes in unit sales, operating profit, cash flow, inventory turnover, return on equity before tax, etc.
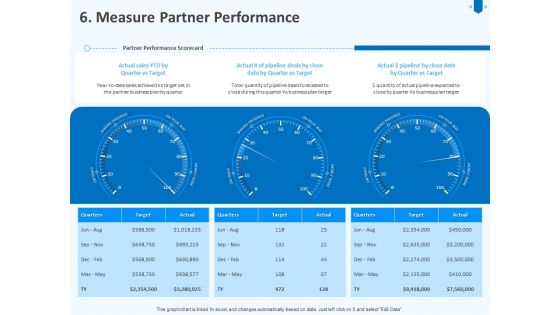
Developing And Implementing Corporate Partner Action Plan Measure Partner Performance Download PDF
Deliver and pitch your topic in the best possible manner with this developing and implementing corporate partner action plan measure partner performance download pdf. Use them to share invaluable insights on target, business, plan, sales, performance and impress your audience. This template can be altered and modified as per your expectations. So, grab it now.
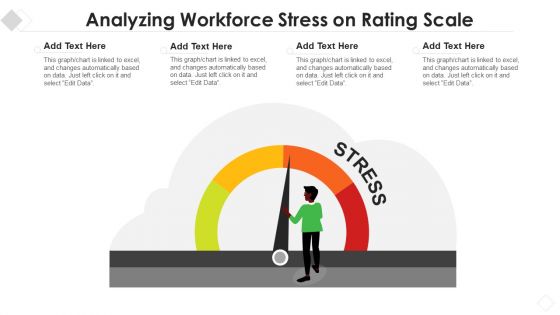
Analyzing Workforce Stress On Rating Scale Portrait PDF
Showcasing this set of slides titled analyzing workforce stress on rating scale portrait pdf. The topics addressed in these templates are analyzing workforce stress on rating scale. All the content presented in this PPT design is completely editable. Download it and make adjustments in color, background, font etc. as per your unique business setting.


 Continue with Email

 Home
Home


