Snapshot
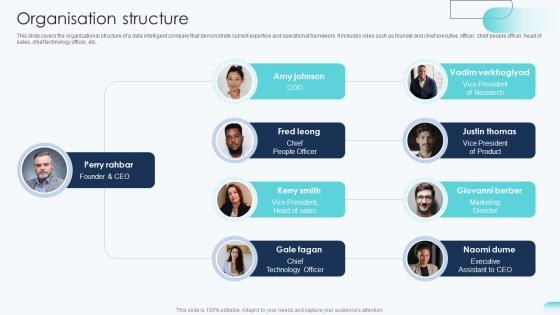
Organisation Structure Big Data Analytics Investor Funding Elevator Pitch Deck
This slide covers the organizational structure of a data intelligent company that demonstrate current expertise and operational framework. It includes roles such as founder and chief executive officer, chief people officer, head of sales, chief technology officer, etc. Crafting an eye-catching presentation has never been more straightforward. Let your presentation shine with this tasteful yet straightforward Organisation Structure Big Data Analytics Investor Funding Elevator Pitch Deck template. It offers a minimalistic and classy look that is great for making a statement. The colors have been employed intelligently to add a bit of playfulness while still remaining professional. Construct the ideal Organisation Structure Big Data Analytics Investor Funding Elevator Pitch Deck that effortlessly grabs the attention of your audience Begin now and be certain to wow your customers This slide covers the organizational structure of a data intelligent company that demonstrate current expertise and operational framework. It includes roles such as founder and chief executive officer, chief people officer, head of sales, chief technology officer, etc.
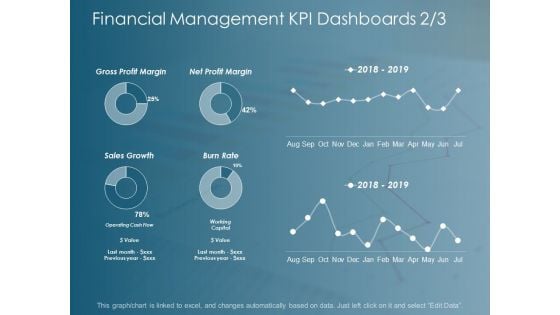
Financial Management Kpi Dashboards Business Ppt Powerpoint Presentation Inspiration Designs
This is a financial management kpi dashboards business ppt powerpoint presentation inspiration designs. This is a six stage process. The stages in this process are finance, marketing, management, investment, analysis.
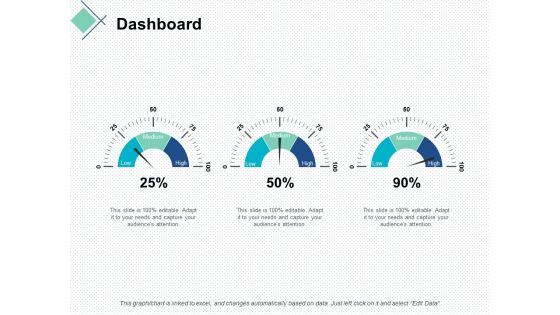
dashboard marketing business ppt powerpoint presentation gallery slide portrait
This is a dashboard marketing business ppt powerpoint presentation gallery slide portrait. This is a three stage process. The stages in this process are finance, marketing, management, investment, analysis.
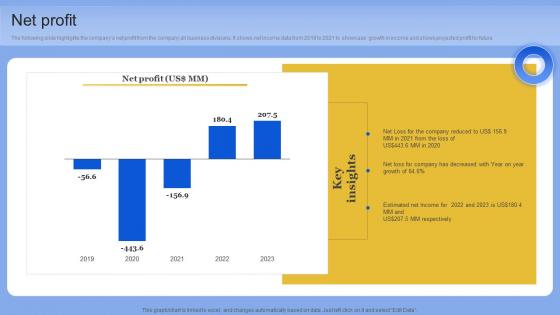
Net Profit Data Analytics Company Outline Diagrams PDF
The following slide highlights the companys net profit from the company all business divisions. It shows net income data from 2019 to 2021 to showcase growth in income and shows projected profit for future. Retrieve professionally designed Net Profit Data Analytics Company Outline Diagrams PDF to effectively convey your message and captivate your listeners. Save time by selecting pre-made slideshows that are appropriate for various topics, from business to educational purposes. These themes come in many different styles, from creative to corporate, and all of them are easily adjustable and can be edited quickly. Access them as PowerPoint templates or as Google Slides themes. You do not have to go on a hunt for the perfect presentation because Slidegeeks got you covered from everywhere. The following slide highlights the companys net profit from the company all business divisions. It shows net income data from 2019 to 2021 to showcase growth in income and shows projected profit for future
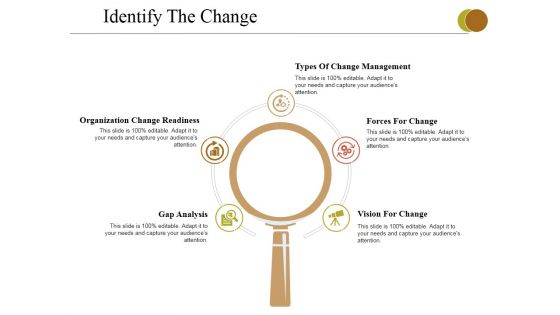
Identify The Change Ppt PowerPoint Presentation Slides Graphics Pictures
This is a identify the change ppt powerpoint presentation slides graphics pictures. This is a five stage process. The stages in this process are organization change readiness, gap analysis, types of change management, forces for change, vision for change.
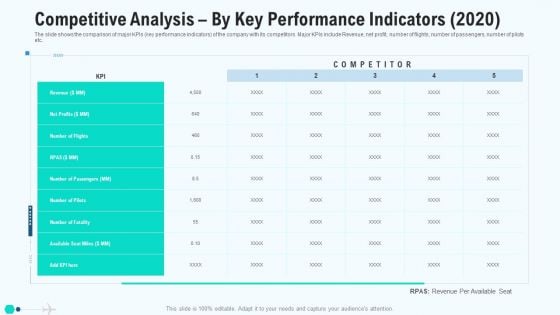
Competitive Analysis By Key Performance Indicators 2020 Elements PDF
The slide shows the comparison of major KPIs key performance indicators of the company with its competitors. Major KPIs include Revenue, net profit, number of flights, number of passengers, number of pilots etc. Deliver an awe inspiring pitch with this creative competitive analysis by key performance indicators 2020 elements pdf bundle. Topics like competitive analysis by key performance indicators can be discussed with this completely editable template. It is available for immediate download depending on the needs and requirements of the user.
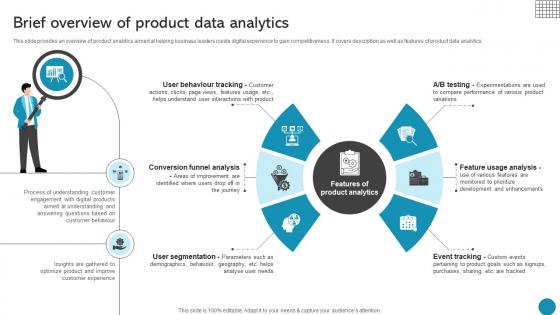
Brief Overview Of Product Data Analytics Driving Business Success Integrating Product
This slide provides an overview of product analytics aimed at helping business leaders create digital experience to gain competitiveness. It covers description as well as features of product data analytics Get a simple yet stunning designed Brief Overview Of Product Data Analytics Driving Business Success Integrating Product. It is the best one to establish the tone in your meetings. It is an excellent way to make your presentations highly effective. So, download this PPT today from Slidegeeks and see the positive impacts. Our easy-to-edit Brief Overview Of Product Data Analytics Driving Business Success Integrating Product can be your go-to option for all upcoming conferences and meetings. So, what are you waiting for Grab this template today. This slide provides an overview of product analytics aimed at helping business leaders create digital experience to gain competitiveness. It covers description as well as features of product data analytics
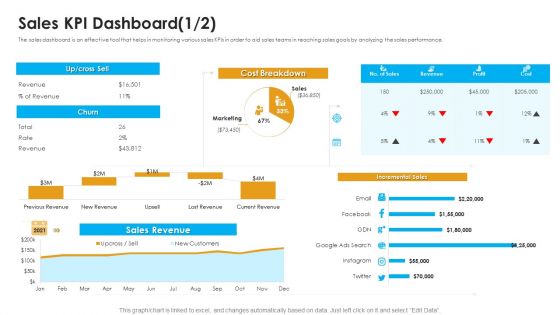
Sales Assistance Boost Overall Efficiency Sales KPI Dashboard Ppt Pictures File Formats PDF
The sales dashboard is an effective tool that helps in monitoring various sales KPIs in order to aid sales teams in reaching sales goals by analyzing the sales performance. Deliver an awe-inspiring pitch with this creative sales assistance boost overall efficiency sales kpi dashboard ppt pictures file formats pdf bundle. Topics like sales revenue, cost breakdown, incremental sales can be discussed with this completely editable template. It is available for immediate download depending on the needs and requirements of the user.
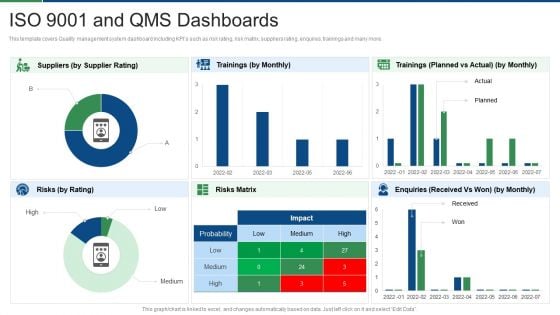
International Standard For Quality Management System ISO 9001 And Qms Dashboards Pictures PDF
This template covers Quality management system dashboard including KPIs such as risk rating, risk matrix, suppliers rating, enquires, trainings and many more. Deliver an awe inspiring pitch with this creative international standard for quality management system iso 9001 and qms dashboards pictures pdf bundle. Topics like suppliers, trainings, enquiries, risks matrix, risks can be discussed with this completely editable template. It is available for immediate download depending on the needs and requirements of the user.
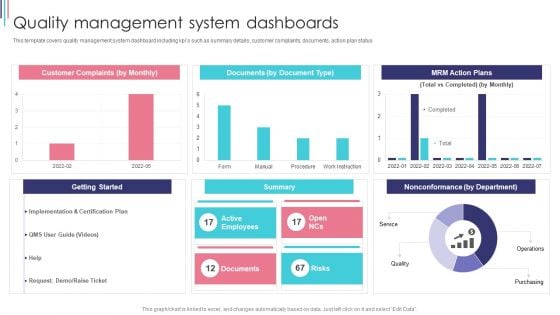
ISO 9001 Standard For Quality Control Quality Management System Dashboards Pictures PDF
This template covers quality management system dashboard including kpis such as summary details, customer complaints, documents, action plan status. Deliver and pitch your topic in the best possible manner with this ISO 9001 Standard For Quality Control Quality Management System Dashboards Pictures PDF. Use them to share invaluable insights on Implementation, Certification Plan, Risks and impress your audience. This template can be altered and modified as per your expectations. So, grab it now.
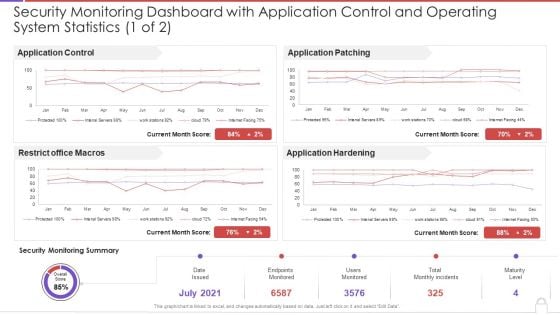
Security Monitoring Dashboard With Application Control And Operating System Statistics Template PDF
This graph or chart is linked to excel, and changes automatically based on data. Just left click on it and select Edit Data. Deliver and pitch your topic in the best possible manner with this security monitoring dashboard with application control and operating system statistics template pdf. Use them to share invaluable insights on application control, restrict office macros, application patching, application hardening and impress your audience. This template can be altered and modified as per your expectations. So, grab it now.
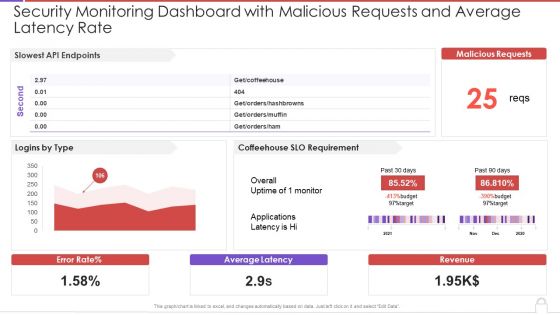
Security Monitoring Dashboard With Malicious Requests And Average Latency Rate Topics PDF
This graph or chart is linked to excel, and changes automatically based on data. Just left click on it and select Edit Data. Deliver an awe inspiring pitch with this creative security monitoring dashboard with malicious requests and average latency rate topics pdf bundle. Topics like slowest api endpoints, malicious requests, coffeehouse slo can be discussed with this completely editable template. It is available for immediate download depending on the needs and requirements of the user.
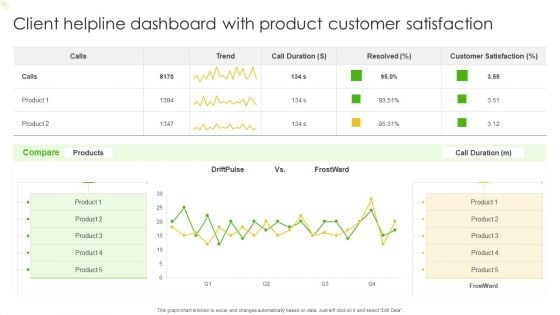
Client Helpline Dashboard With Product Customer Satisfaction Ppt Slides Graphics Template PDF
This graph or chart is linked to excel, and changes automatically based on data. Just left click on it and select Edit Data. Pitch your topic with ease and precision using this Client Helpline Dashboard With Product Customer Satisfaction Ppt Slides Graphics Template PDF. This layout presents information on Customer Satisfaction, Product, Compare. It is also available for immediate download and adjustment. So, changes can be made in the color, design, graphics or any other component to create a unique layout.
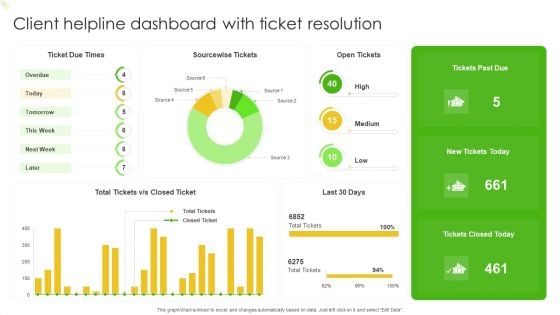
Client Helpline Dashboard With Ticket Resolution Ppt Model Graphics Design PDF
This graph or chart is linked to excel, and changes automatically based on data. Just left click on it and select Edit Data. Pitch your topic with ease and precision using this Client Helpline Dashboard With Ticket Resolution Ppt Model Graphics Design PDF. This layout presents information on Ticket Due Times, Sourcewise Tickets, Open Tickets. It is also available for immediate download and adjustment. So, changes can be made in the color, design, graphics or any other component to create a unique layout.
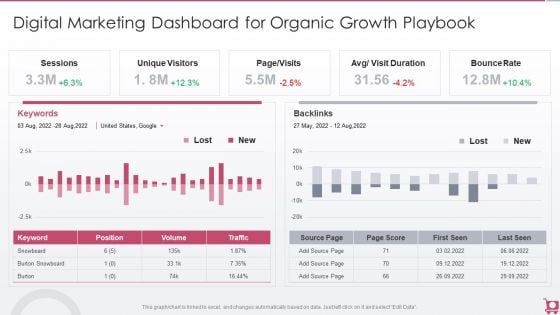
Playbook For Sales Growth Strategies Digital Marketing Dashboard For Organic Growth Designs PDF
This graph or chart is linked to excel, and changes automatically based on data. Just left click on it and select Edit Data. Deliver and pitch your topic in the best possible manner with this Playbook For Sales Growth Strategies Digital Marketing Dashboard For Organic Growth Designs PDF. Use them to share invaluable insights on Unique Visitors, Sessions, Bounce Rate and impress your audience. This template can be altered and modified as per your expectations. So, grab it now.
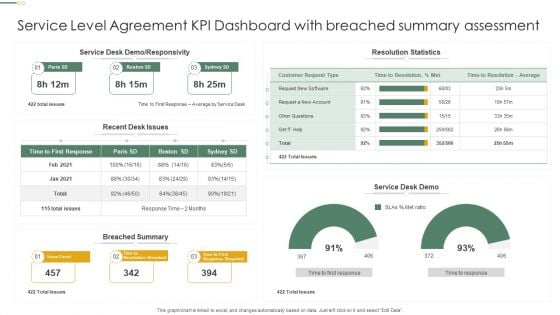
Service Level Agreement KPI Dashboard With Breached Summary Assessment Professional PDF
This graph or chart is linked to excel, and changes automatically based on data. Just left click on it and select Edit Data. Pitch your topic with ease and precision using this Service Level Agreement KPI Dashboard With Breached Summary Assessment Professional PDF. This layout presents information on Resolution Statistics, Service Desk Demo, Breached Summary. It is also available for immediate download and adjustment. So, changes can be made in the color, design, graphics or any other component to create a unique layout.
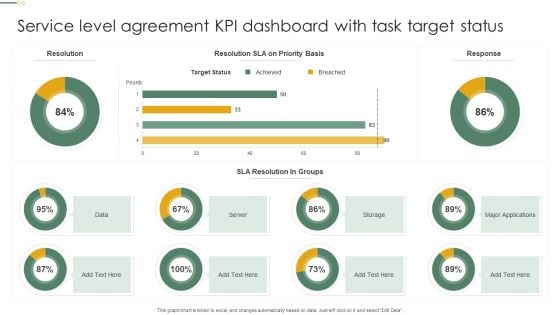
Service Level Agreement KPI Dashboard With Task Target Status Microsoft PDF
This graph or chart is linked to excel, and changes automatically based on data. Just left click on it and select Edit Data. Pitch your topic with ease and precision using this Service Level Agreement KPI Dashboard With Task Target Status Microsoft PDF. This layout presents information on Target Status, Sla Resolution, Groups, Server. It is also available for immediate download and adjustment. So, changes can be made in the color, design, graphics or any other component to create a unique layout.
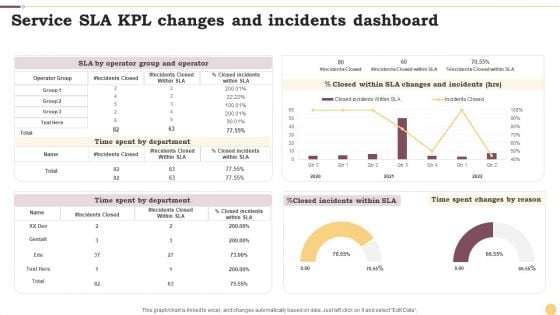
Service SLA KPL Changes And Incidents Dashboard Ppt Inspiration Infographics PDF
This graph or chart is linked to excel, and changes automatically based on data. Just left click on it and select Edit Data. Pitch your topic with ease and precision using this Service SLA KPL Changes And Incidents Dashboard Ppt Inspiration Infographics PDF. This layout presents information on Time Spent Department, Incidents Closed, Operator Group. It is also available for immediate download and adjustment. So, changes can be made in the color, design, graphics or any other component to create a unique layout.
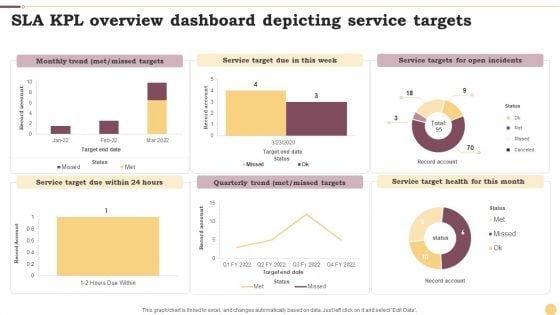
SLA KPL Overview Dashboard Depicting Service Targets Ppt Slides Maker PDF
This graph or chart is linked to excel, and changes automatically based on data. Just left click on it and select Edit Data. Pitch your topic with ease and precision using this SLA KPL Overview Dashboard Depicting Service Targets Ppt Slides Maker PDF. This layout presents information on Monthly Trend, Service Target, Quarterly Trend. It is also available for immediate download and adjustment. So, changes can be made in the color, design, graphics or any other component to create a unique layout.
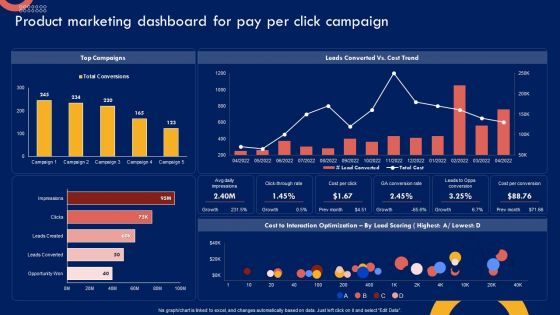
Product Marketing Leadership Product Marketing Dashboard For Pay Per Microsoft PDF
This graph or chart is linked to excel, and changes automatically based on data. Just left click on it and select Edit Data. Find a pre-designed and impeccable Product Marketing Leadership Product Marketing Dashboard For Pay Per Microsoft PDF. The templates can ace your presentation without additional effort. You can download these easy-to-edit presentation templates to make your presentation stand out from others. So, what are you waiting for Download the template from Slidegeeks today and give a unique touch to your presentation.
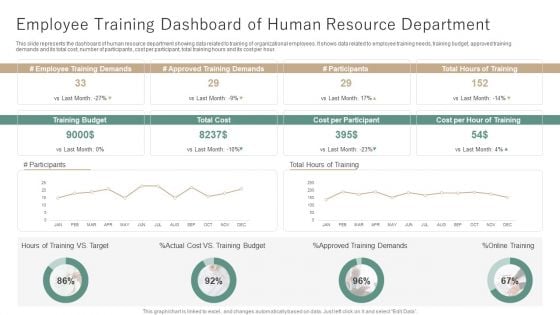
Employee Training Dashboard Of Human Resource Department Ppt Outline Themes PDF
This slide represents the dashboard of human resource department showing data related to training of organizational employees. It shows data related to employee training needs, training budget, approved training demands and its total cost, number of participants, cost per participant, total training hours and its cost per hour. Showcasing this set of slides titled Employee Training Dashboard Of Human Resource Department Ppt Outline Themes PDF. The topics addressed in these templates are Employee Training Demands, Approved Training Demands, Cost per Participant. All the content presented in this PPT design is completely editable. Download it and make adjustments in color, background, font etc. as per your unique business setting.
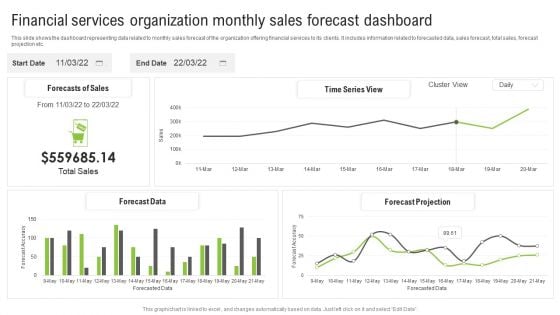
Financial Services Organization Monthly Sales Forecast Dashboard Ppt Summary Slideshow PDF
This slide shows the dashboard representing data related to monthly sales forecast of the organization offering financial services to its clients. It includes information related to forecasted data, sales forecast, total sales, forecast projection etc. Showcasing this set of slides titled Financial Services Organization Monthly Sales Forecast Dashboard Ppt Summary Slideshow PDF. The topics addressed in these templates are Forecasts Sales, Time Series View, Forecast Projection. All the content presented in this PPT design is completely editable. Download it and make adjustments in color, background, font etc. as per your unique business setting.
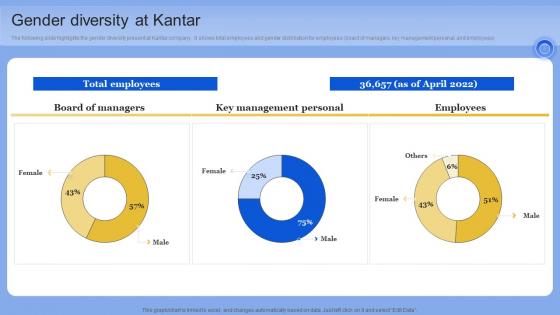
Gender Diversity At Kantar Data Analytics Company Outline Portrait PDF
The following slide highlights the gender diversity present at Kantar company. It shows total employees and gender distribution for employees board of managers, key management personal, and employees. If you are looking for a format to display your unique thoughts, then the professionally designed Gender Diversity At Kantar Data Analytics Company Outline Portrait PDF is the one for you. You can use it as a Google Slides template or a PowerPoint template. Incorporate impressive visuals, symbols, images, and other charts. Modify or reorganize the text boxes as you desire. Experiment with shade schemes and font pairings. Alter, share or cooperate with other people on your work. Download Gender Diversity At Kantar Data Analytics Company Outline Portrait PDF and find out how to give a successful presentation. Present a perfect display to your team and make your presentation unforgettable. The following slide highlights the gender diversity present at Kantar company. It shows total employees and gender distribution for employees board of managers, key management personal, and employees
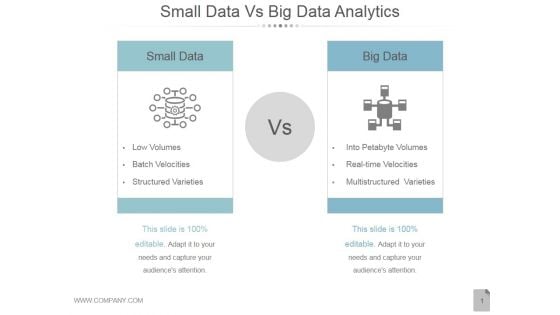
Small Data Vs Big Data Analytics Ppt PowerPoint Presentation Influencers
This is a small data vs big data analytics ppt powerpoint presentation influencers. This is a two stage process. The stages in this process are small data, big data.
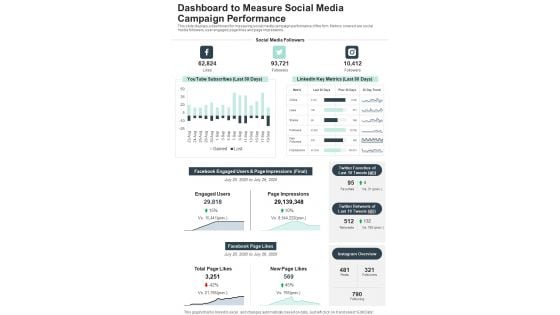
Dashboard To Measure Social Media Campaign Performance One Pager Documents
This slide displays a dashboard for measuring social media campaign performance of the firm. Metrics covered are social media followers, user engaged, page likes and page impressions. Presenting you a fantastic Dashboard To Measure Social Media Campaign Performance One Pager Documents. This piece is crafted on hours of research and professional design efforts to ensure you have the best resource. It is completely editable and its design allow you to rehash its elements to suit your needs. Get this Dashboard To Measure Social Media Campaign Performance One Pager Documents A4 One-pager now.

Big Data Analytics In Improving Transforming Medical Workflows Via His Integration Download Pdf
This slide covers big data analytics in enhancing patient outcomes. It involves real time alerting, smart staffing and improved supply chain management. There are so many reasons you need a Big Data Analytics In Improving Transforming Medical Workflows Via His Integration Download Pdf. The first reason is you can not spend time making everything from scratch, Thus, Slidegeeks has made presentation templates for you too. You can easily download these templates from our website easily. This slide covers big data analytics in enhancing patient outcomes. It involves real time alerting, smart staffing and improved supply chain management.
Data Science Analytics Icon For Content Marketing Ppt Slides Infographic Template Pdf
Showcasing this set of slides titled Data Science Analytics Icon For Content Marketing Ppt Slides Infographic Template Pdf. The topics addressed in these templates are Data Science Analytics Icon, Content Marketing. All the content presented in this PPT design is completely editable. Download it and make adjustments in color, background, font etc. as per your unique business setting. Our Data Science Analytics Icon For Content Marketing Ppt Slides Infographic Template Pdf are topically designed to provide an attractive backdrop to any subject. Use them to look like a presentation pro.
Data Science Analytics Icon For Healthcare Marketing Ppt Model Demonstration Pdf
Pitch your topic with ease and precision using this Data Science Analytics Icon For Healthcare Marketing Ppt Model Demonstration Pdf. This layout presents information on Data Science, Analytics Icon, Healthcare Marketing. It is also available for immediate download and adjustment. So, changes can be made in the color, design, graphics or any other component to create a unique layout. Our Data Science Analytics Icon For Healthcare Marketing Ppt Model Demonstration Pdf are topically designed to provide an attractive backdrop to any subject. Use them to look like a presentation pro.
Data Science Analytics Icon For Social Media Marketing Ppt Inspiration Pdf
Showcasing this set of slides titled Data Science Analytics Icon For Social Media Marketing Ppt Inspiration Pdf. The topics addressed in these templates are Data Science, Analytics Icon, Social Media Marketing. All the content presented in this PPT design is completely editable. Download it and make adjustments in color, background, font etc. as per your unique business setting. Our Data Science Analytics Icon For Social Media Marketing Ppt Inspiration Pdf are topically designed to provide an attractive backdrop to any subject. Use them to look like a presentation pro.
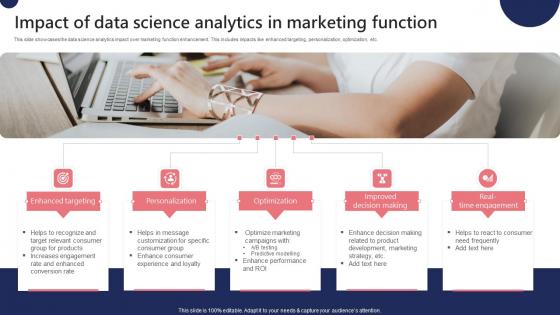
Impact Of Data Science Analytics In Marketing Function Ppt Ideas Templates Pdf
This slide showcases the data science analytics impact over marketing function enhancement. This includes impacts like enhanced targeting, personalization, optimization, etc. Showcasing this set of slides titled Impact Of Data Science Analytics In Marketing Function Ppt Ideas Templates Pdf. The topics addressed in these templates are Enhanced Targeting, Personalization, Optimization. All the content presented in this PPT design is completely editable. Download it and make adjustments in color, background, font etc. as per your unique business setting. This slide showcases the data science analytics impact over marketing function enhancement. This includes impacts like enhanced targeting, personalization, optimization, etc.
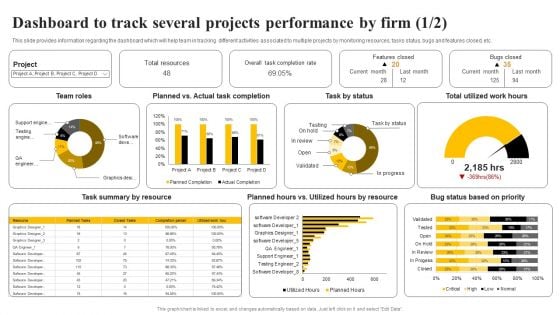
Organizational Plan Overview Dashboard To Track Several Projects Performance By Firm Pictures PDF
This slide provides information regarding the dashboard which will help team in tracking different activities associated to multiple projects by monitoring resources, tasks status, bugs and features closed, etc. This Organizational Plan Overview Dashboard To Track Several Projects Performance By Firm Pictures PDF from Slidegeeks makes it easy to present information on your topic with precision. It provides customization options, so you can make changes to the colors, design, graphics, or any other component to create a unique layout. It is also available for immediate download, so you can begin using it right away. Slidegeeks has done good research to ensure that you have everything you need to make your presentation stand out. Make a name out there for a brilliant performance.
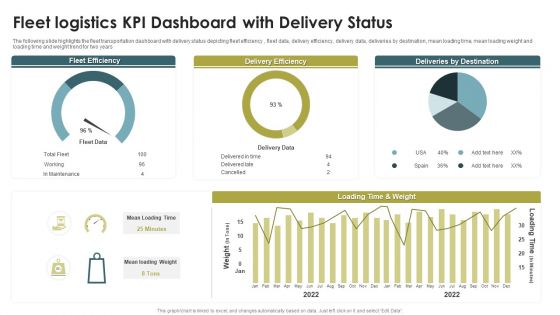
Fleet Logistics KPI Dashboard With Delivery Status Ppt Model Guide PDF
The following slide highlights the fleet transportation dashboard with delivery status depicting fleet efficiency , fleet data, delivery efficiency, delivery data, deliveries by destination, mean loading time, mean loading weight and loading time and weight trend for two years. Pitch your topic with ease and precision using this Fleet Logistics KPI Dashboard With Delivery Status Ppt Model Guide PDF. This layout presents information on Fleet Efficiency, Delivery Efficiency, Deliveries By Destination. It is also available for immediate download and adjustment. So, changes can be made in the color, design, graphics or any other component to create a unique layout.
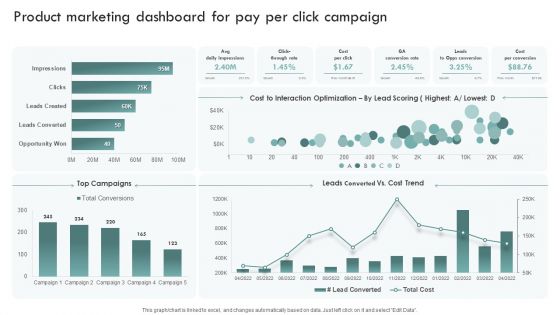
Brand Awareness Plan Product Marketing Dashboard For Pay Per Click Campaign Template PDF
This graph or chart is linked to excel, and changes automatically based on data. Just left click on it and select Edit Data. Get a simple yet stunning designed Brand Awareness Plan Product Marketing Dashboard For Pay Per Click Campaign Template PDF. It is the best one to establish the tone in your meetings. It is an excellent way to make your presentations highly effective. So, download this PPT today from Slidegeeks and see the positive impacts. Our easy-to-edit Brand Awareness Plan Product Marketing Dashboard For Pay Per Click Campaign Template PDF can be your go-to option for all upcoming conferences and meetings. So, what are you waiting for Grab this template today.
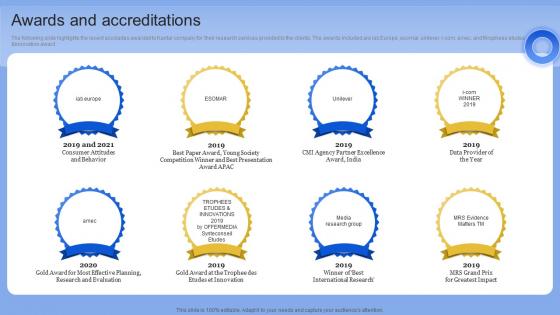
Awards And Accreditations Data Analytics Company Outline Guidelines PDF
The following slide highlights the recent accolades awarded to Kantar company for their research services provided to the clients. The awards included are iab Europe, esomar, unilever, i-com, amec, and throphees etudes andinnovation award. Boost your pitch with our creative Awards And Accreditations Data Analytics Company Outline Guidelines PDF Deliver an awe-inspiring pitch that will mesmerize everyone. Using these presentation templates you will surely catch everyones attention. You can browse the ppts collection on our website. We have researchers who are experts at creating the right content for the templates. So you do not have to invest time in any additional work. Just grab the template now and use them. The following slide highlights the recent accolades awarded to Kantar company for their research services provided to the clients. The awards included are iab Europe, esomar, unilever, i-com, amec, and throphees etudes andinnovation award
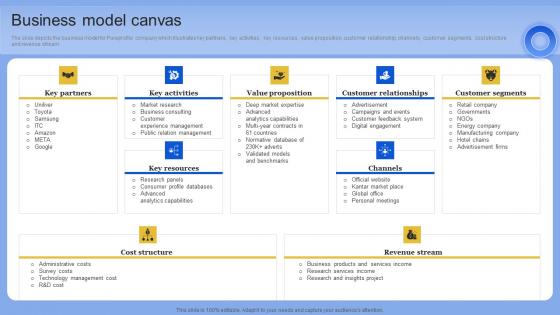
Business Model Canvas Data Analytics Company Outline Demonstration PDF
The slide depicts the business model for Pureprofile company which illustrates key partners, key activities, key resources, value proposition, customer relationship, channels, customer segments, cost structure and revenue stream. Slidegeeks is one of the best resources for PowerPoint templates. You can download easily and regulate Business Model Canvas Data Analytics Company Outline Demonstration PDF for your personal presentations from our wonderful collection. A few clicks is all it takes to discover and get the most relevant and appropriate templates. Use our Templates to add a unique zing and appeal to your presentation and meetings. All the slides are easy to edit and you can use them even for advertisement purposes. The slide depicts the business model for Pureprofile company which illustrates key partners, key activities, key resources, value proposition, customer relationship, channels, customer segments, cost structure and revenue stream.
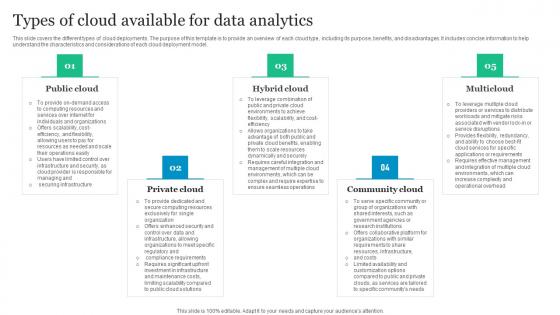
Types Of Cloud Available For Data Analytics Brochure Pdf
This slide covers the different types of cloud deployments. The purpose of this template is to provide an overview of each cloud type, including its purpose, benefits, and disadvantages. It includes concise information to help understand the characteristics and considerations of each cloud deployment model. Pitch your topic with ease and precision using this Types Of Cloud Available For Data Analytics Brochure Pdf. This layout presents information on Public Cloud, Hybrid Cloud, Community Cloud. It is also available for immediate download and adjustment. So, changes can be made in the color, design, graphics or any other component to create a unique layout. This slide covers the different types of cloud deployments. The purpose of this template is to provide an overview of each cloud type, including its purpose, benefits, and disadvantages. It includes concise information to help understand the characteristics and considerations of each cloud deployment model.
Social Media Marketing Performance Tracking Dashboard Guide To Personal Branding Inspiration PDF
Following slide displays KPI dashboard that can be used to monitor the performance of social media marketing campaign. Metrics covered are related to fans number, engagement rate and page impressions.Are you searching for a Social Media Marketing Performance Tracking Dashboard Guide To Personal Branding Inspiration PDF that is uncluttered, straightforward, and original Its easy to edit, and you can change the colors to suit your personal or business branding. For a presentation that expresses how much effort you ve put in, this template is ideal With all of its features, including tables, diagrams, statistics, and lists, its perfect for a business plan presentation. Make your ideas more appealing with these professional slides. Download xxxxxxxxxxxxxxxxxxxx from Slidegeeks today.

Transforming Recruitment Process Role Of Data Analytics In Optimizing Recruitment CRP DK SS
This slide showcases role data analytics in transforming hiring operations such as benchmarking applicants, avoiding bias and developing strategy. Create an editable Transforming Recruitment Process Role Of Data Analytics In Optimizing Recruitment CRP DK SS that communicates your idea and engages your audience. Whether you are presenting a business or an educational presentation, pre-designed presentation templates help save time. Transforming Recruitment Process Role Of Data Analytics In Optimizing Recruitment CRP DK SS is highly customizable and very easy to edit, covering many different styles from creative to business presentations. Slidegeeks has creative team members who have crafted amazing templates. So, go and get them without any delay. This slide showcases role data analytics in transforming hiring operations such as benchmarking applicants, avoiding bias and developing strategy.

KPIs For Food Quality Analysis Quality Control Guide For Food PPT Example
This slide consists of major key performance indicators that can be followed by restaurants to ensure food quality analysis and control. Major key performance indicators include density, fat or oil, moisture, protein etc. The best PPT templates are a great way to save time, energy, and resources. Slidegeeks have 100 percent editable powerpoint slides making them incredibly versatile. With these quality presentation templates, you can create a captivating and memorable presentation by combining visually appealing slides and effectively communicating your message. Download KPIs For Food Quality Analysis Quality Control Guide For Food PPT Example from Slidegeeks and deliver a wonderful presentation. This slide consists of major key performance indicators that can be followed by restaurants to ensure food quality analysis and control. Major key performance indicators include density, fat or oil, moisture, protein etc.
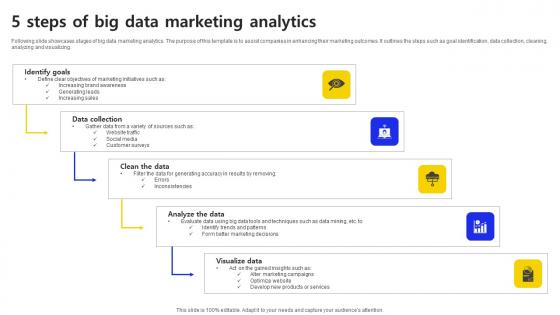
5 Steps Of Big Data Marketing Analytics Ppt Outline Example File PDF
Following slide showcases stages of big data marketing analytics. The purpose of this template is to assist companies in enhancing their marketing outcomes. It outlines the steps such as goal identification, data collection, cleaning, analyzing and visualizing. Showcasing this set of slides titled 5 Steps Of Big Data Marketing Analytics Ppt Outline Example File PDF. The topics addressed in these templates are Goal Identification, Data Collection, Cleaning. All the content presented in this PPT design is completely editable. Download it and make adjustments in color, background, font etc. as per your unique business setting. Following slide showcases stages of big data marketing analytics. The purpose of this template is to assist companies in enhancing their marketing outcomes. It outlines the steps such as goal identification, data collection, cleaning, analyzing and visualizing.
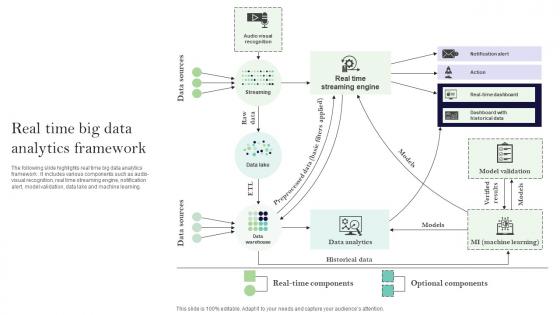
Real Time Big Data Analytics Framework Ppt Ideas Designs Download Pdf
The following slide highlights real time big data analytics framework. It includes various components such as audio-visual recognition, real time streaming engine, notification alert, model validation, data lake and machine learning. Pitch your topic with ease and precision using this Real Time Big Data Analytics Framework Ppt Ideas Designs Download Pdf. This layout presents information on Notification Alert, Model Validation, Data Lake. It is also available for immediate download and adjustment. So, changes can be made in the color, design, graphics or any other component to create a unique layout. The following slide highlights real time big data analytics framework. It includes various components such as audio-visual recognition, real time streaming engine, notification alert, model validation, data lake and machine learning.
Dashboard For Tracking Social Media Platforms Consumer Contact Point Guide Graphics PDF
This slide covers the KPI dashboard for analyzing social media channels. It includes metrics such as social media followers, Facebook daily reach, Facebook engaged users and page impressions, etc. Retrieve professionally designed Dashboard For Tracking Social Media Platforms Consumer Contact Point Guide Graphics PDF to effectively convey your message and captivate your listeners. Save time by selecting pre-made slideshows that are appropriate for various topics, from business to educational purposes. These themes come in many different styles, from creative to corporate, and all of them are easily adjustable and can be edited quickly. Access them as PowerPoint templates or as Google Slides themes. You do not have to go on a hunt for the perfect presentation because Slidegeeks got you covered from everywhere.
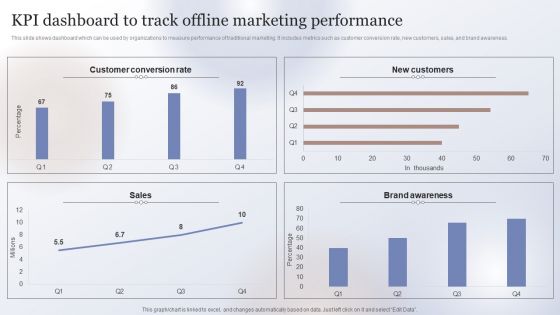
Marketing Strategy To Enhance KPI Dashboard To Track Offline Marketing Performance Ideas PDF
This slide shows dashboard which can be used by organizations to measure performance of traditional marketing. It includes metrics such as customer conversion rate, new customers, sales, and brand awareness. Welcome to our selection of the Marketing Strategy To Enhance KPI Dashboard To Track Offline Marketing Performance Ideas PDF. These are designed to help you showcase your creativity and bring your sphere to life. Planning and Innovation are essential for any business that is just starting out. This collection contains the designs that you need for your everyday presentations. All of our PowerPoints are 100 percent editable, so you can customize them to suit your needs. This multi-purpose template can be used in various situations. Grab these presentation templates today.
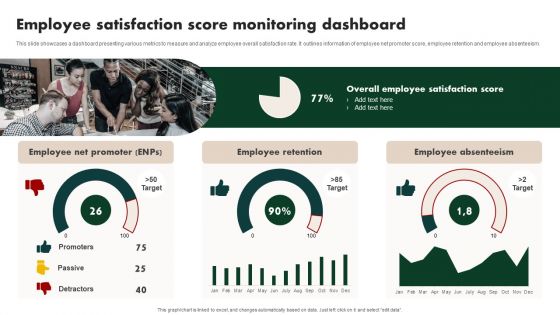
Creating Employee Value Proposition Employee Satisfaction Score Monitoring Dashboard Sample PDF
This slide showcases a dashboard presenting various metrics to measure and analyze employee overall satisfaction rate. It outlines information of employee net promoter score, employee retention and employee absenteeism. Do you know about Slidesgeeks Creating Employee Value Proposition Employee Satisfaction Score Monitoring Dashboard Sample PDF These are perfect for delivering any kind od presentation. Using it, create PowerPoint presentations that communicate your ideas and engage audiences. Save time and effort by using our pre-designed presentation templates that are perfect for a wide range of topic. Our vast selection of designs covers a range of styles, from creative to business, and are all highly customizable and easy to edit. Download as a PowerPoint template or use them as Google Slides themes.
Ultimate Guide To Improve Customer Support And Services Kpi Dashboard For Tracking Customer Retention Guidelines PDF
This slide covers the dashboard for analyzing customer loyalty with metrics such as NPS, loyal customer rate, premium users, CLV, customer churn, revenue churn, net retention, MRR growth, etc. Welcome to our selection of the Ultimate Guide To Improve Customer Support And Services Kpi Dashboard For Tracking Customer Retention Guidelines PDF. These are designed to help you showcase your creativity and bring your sphere to life. Planning and Innovation are essential for any business that is just starting out. This collection contains the designs that you need for your everyday presentations. All of our PowerPoints are 100 percent editable, so you can customize them to suit your needs. This multi purpose template can be used in various situations. Grab these presentation templates today.
Kpi Dashboard For Tracking Monthly Personal Finances Ppt Outline Graphics Example PDF
This slide shows dashboard which can be used by individuals to track monthly expenses in order to get better understanding of his or her finances. It includes metrics such as users spending, savings, debt, etc. Welcome to our selection of the Kpi Dashboard For Tracking Monthly Personal Finances Ppt Outline Graphics Example PDF. These are designed to help you showcase your creativity and bring your sphere to life. Planning and Innovation are essential for any business that is just starting out. This collection contains the designs that you need for your everyday presentations. All of our PowerPoints are 100 percent editable, so you can customize them to suit your needs. This multi purpose template can be used in various situations. Grab these presentation templates today.
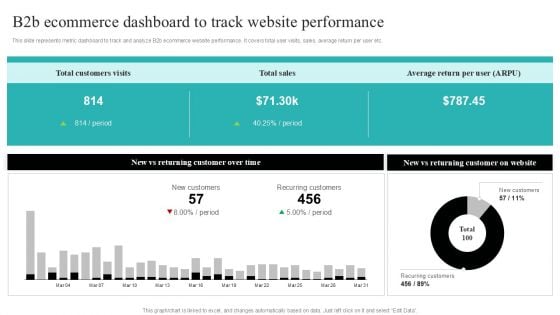
Strategic Ecommerce Plan For B2B Enterprises B2b Ecommerce Dashboard To Track Website Performance Inspiration PDF
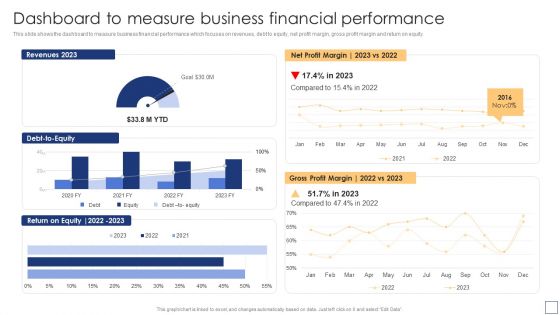
Dashboard To Measure Business Financial Performance Summary PDF
This slide shows the dashboard to measure business financial performance which focuses on revenues, debt to equity, net profit margin, gross profit margin and return on equity. Are you searching for a Dashboard To Measure Business Financial Performance Summary PDF that is uncluttered, straightforward, and original Its easy to edit, and you can change the colors to suit your personal or business branding. For a presentation that expresses how much effort youve put in, this template is ideal With all of its features, including tables, diagrams, statistics, and lists, its perfect for a business plan presentation. Make your ideas more appealing with these professional slides. Download Dashboard To Measure Business Financial Performance Summary PDF from Slidegeeks today.
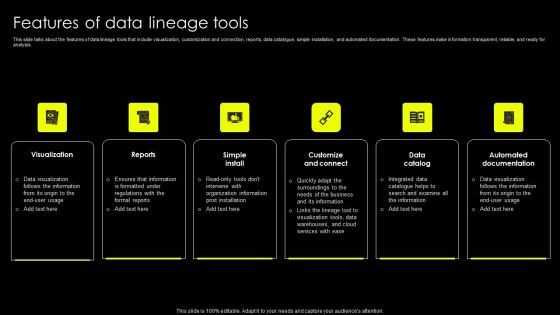
Data Lineage Implementation Features Of Data Lineage Tools Template PDF
This slide talks about the features of data lineage tools that include visualization, customization and connection, reports, data catalogue, simple installation, and automated documentation. These features make information transparent, reliable, and ready for analysis. The best PPT templates are a great way to save time, energy, and resources. Slidegeeks have 100 percent editable powerpoint slides making them incredibly versatile. With these quality presentation templates, you can create a captivating and memorable presentation by combining visually appealing slides and effectively communicating your message. Download Data Lineage Implementation Features Of Data Lineage Tools Template PDF from Slidegeeks and deliver a wonderful presentation.
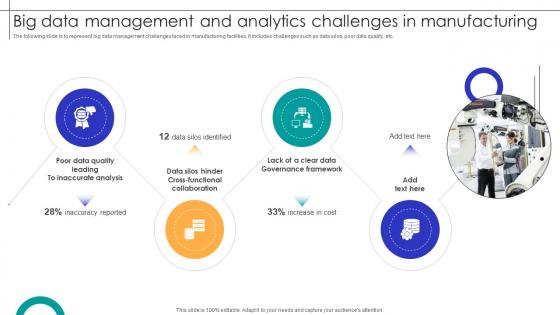
Big Data Management And Analytics Challenges In Manufacturing Streamlining Production Ppt Example
The following slide is to represent big data management challenges faced in manufacturing facilities. It includes challenges such as data silos, poor data quality, etc. Whether you have daily or monthly meetings, a brilliant presentation is necessary. Big Data Management And Analytics Challenges In Manufacturing Streamlining Production Ppt Example can be your best option for delivering a presentation. Represent everything in detail using Big Data Management And Analytics Challenges In Manufacturing Streamlining Production Ppt Example and make yourself stand out in meetings. The template is versatile and follows a structure that will cater to your requirements. All the templates prepared by Slidegeeks are easy to download and edit. Our research experts have taken care of the corporate themes as well. So, give it a try and see the results. The following slide is to represent big data management challenges faced in manufacturing facilities. It includes challenges such as data silos, poor data quality, etc.
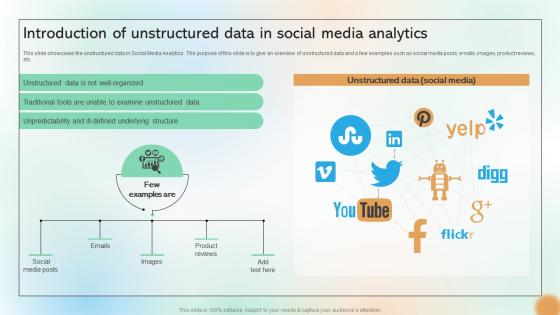
Introduction Of Unstructured Data In Social Media Analytics Cracking The Code Of Social Media
This slide showcases the unstructured data in Social Media Analytics. The purpose of this slide is to give an overview of unstructured data and a few examples such as social media posts, emails, images, product reviews, etc. Present like a pro with Introduction Of Unstructured Data In Social Media Analytics Cracking The Code Of Social Media. Create beautiful presentations together with your team, using our easy-to-use presentation slides. Share your ideas in real-time and make changes on the fly by downloading our templates. So whether you are in the office, on the go, or in a remote location, you can stay in sync with your team and present your ideas with This slide showcases the unstructured data in Social Media Analytics. The purpose of this slide is to give an overview of unstructured data and a few examples such as social media posts, emails, images, product reviews, etc.
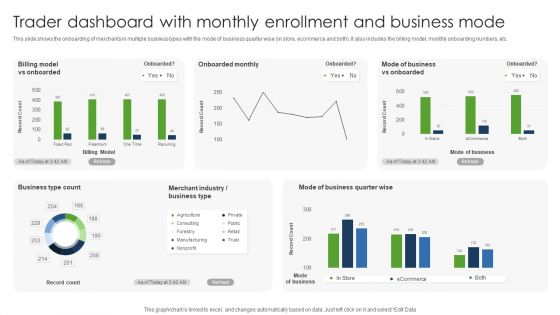
Trader Dashboard With Monthly Enrollment And Business Mode Professional PDF
This slide shows the onboarding of merchants in multiple business types with the mode of business quarter wise in store, ecommerce and both. It also includes the billing model, monthly onboarding numbers, etc. Showcasing this set of slides titled Trader Dashboard With Monthly Enrollment And Business Mode Professional PDF. The topics addressed in these templates are Monthly Enrollment, Business Mode, Trader Dashboard. All the content presented in this PPT design is completely editable. Download it and make adjustments in color, background, font etc. as per your unique business setting.
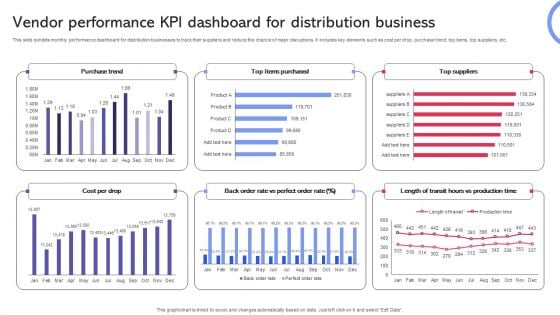
Vendor Performance KPI Dashboard For Distribution Business Formats PDF
This slide exhibits monthly performance dashboard for distribution businesses to track their suppliers and reduce the chance of major disruptions. It includes key elements such as cost per drop, purchase trend, top items, top suppliers, etc. Showcasing this set of slides titled Vendor Performance KPI Dashboard For Distribution Business Formats PDF. The topics addressed in these templates are Purchase Trend, Suppliers, Distribution Business. All the content presented in this PPT design is completely editable. Download it and make adjustments in color, background, font etc. as per your unique business setting.
Referral Program Performance Tracking Dashboard Consumer Contact Point Guide Icons PDF
This slide covers the KPI dashboard for analyzing referral campaign results. It includes metrics such as total revenue generated, monthly recurring revenue, new customers, clicks, cancelled customers, paying customers, etc. Are you in need of a template that can accommodate all of your creative concepts This one is crafted professionally and can be altered to fit any style. Use it with Google Slides or PowerPoint. Include striking photographs, symbols, depictions, and other visuals. Fill, move around, or remove text boxes as desired. Test out color palettes and font mixtures. Edit and save your work, or work with colleagues. Download Referral Program Performance Tracking Dashboard Consumer Contact Point Guide Icons PDF and observe how to make your presentation outstanding. Give an impeccable presentation to your group and make your presentation unforgettable.
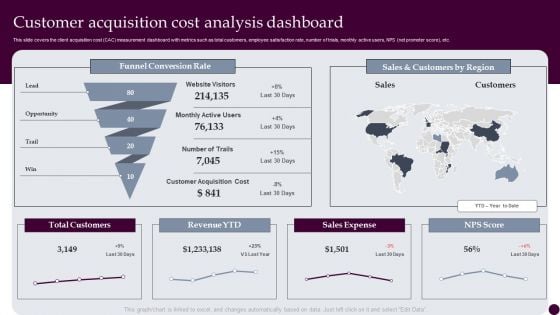
Customer Acquisition Cost Analysis Dashboard Strategies For Acquiring Consumers Elements PDF
This slide covers the client acquisition cost CAC measurement dashboard with metrics such as total customers, employee satisfaction rate, number of trials, monthly active users, NPS net promoter score, etc. Slidegeeks has constructed Customer Acquisition Cost Analysis Dashboard Strategies For Acquiring Consumers Elements PDF after conducting extensive research and examination. These presentation templates are constantly being generated and modified based on user preferences and critiques from editors. Here, you will find the most attractive templates for a range of purposes while taking into account ratings and remarks from users regarding the content. This is an excellent jumping-off point to explore our content and will give new users an insight into our top-notch PowerPoint Templates.
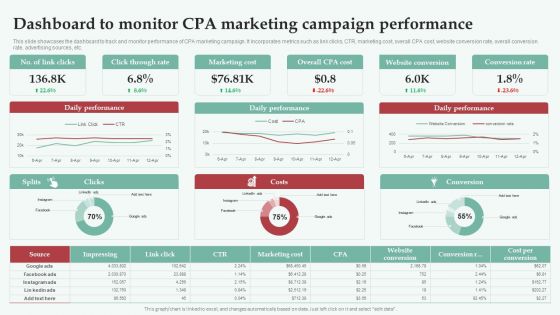
Integrating CPA Marketing Dashboard To Monitor CPA Marketing Campaign Guidelines PDF
This slide showcases the dashboard to track and monitor performance of CPA marketing campaign. It incorporates metrics such as link clicks, CTR, marketing cost, overall CPA cost, website conversion rate, overall conversion rate, advertising sources, etc. This Integrating CPA Marketing Dashboard To Monitor CPA Marketing Campaign Guidelines PDF from Slidegeeks makes it easy to present information on your topic with precision. It provides customization options, so you can make changes to the colors, design, graphics, or any other component to create a unique layout. It is also available for immediate download, so you can begin using it right away. Slidegeeks has done good research to ensure that you have everything you need to make your presentation stand out. Make a name out there for a brilliant performance.
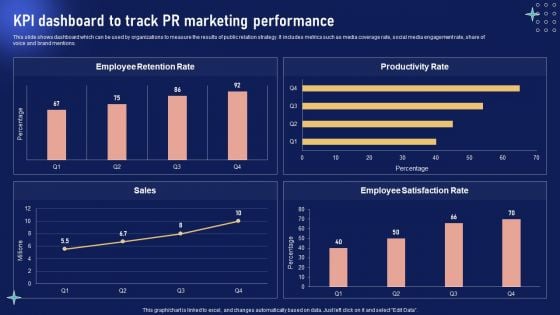
Implementing Internal Marketing Kpi Dashboard To Track PR Marketing Performance Mockup PDF
This slide shows dashboard which can be used by organizations to measure the results of public relation strategy. It includes metrics such as media coverage rate, social media engagement rate, share of voice and brand mentions. Present like a pro with Implementing Internal Marketing Kpi Dashboard To Track PR Marketing Performance Mockup PDF Create beautiful presentations together with your team, using our easy-to-use presentation slides. Share your ideas in real-time and make changes on the fly by downloading our templates. So whether youre in the office, on the go, or in a remote location, you can stay in sync with your team and present your ideas with confidence. With Slidegeeks presentation got a whole lot easier. Grab these presentations today.
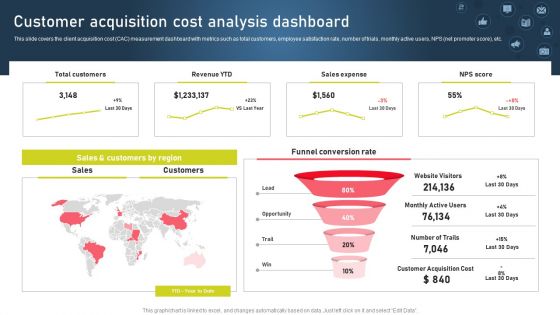
Strategies For Acquiring Online And Offline Clients Customer Acquisition Cost Analysis Dashboard Graphics PDF
This slide covers the client acquisition cost CAC measurement dashboard with metrics such as total customers, employee satisfaction rate, number of trials, monthly active users, NPS net promoter score, etc.Are you in need of a template that can accommodate all of your creative concepts This one is crafted professionally and can be altered to fit any style. Use it with Google Slides or PowerPoint. Include striking photographs, symbols, depictions, and other visuals. Fill, move around, or remove text boxes as desired. Test out color palettes and font mixtures. Edit and save your work, or work with colleagues. Download Strategies For Acquiring Online And Offline Clients Customer Acquisition Cost Analysis Dashboard Graphics PDF and observe how to make your presentation outstanding. Give an impeccable presentation to your group and make your presentation unforgettable.
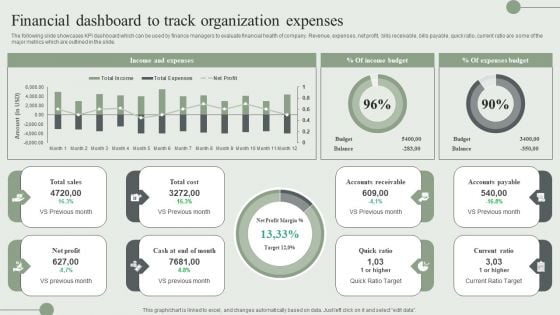
Financial Dashboard To Track Organization Expenses Ppt PowerPoint Presentation File Ideas PDF
The following slide showcases KPI dashboard which can be used by finance managers to evaluate financial health of company. Revenue, expenses, net profit, bills receivable, bills payable, quick ratio, current ratio are some of the major metrics which are outlined in the slide. Boost your pitch with our creative Financial Dashboard To Track Organization Expenses Ppt PowerPoint Presentation File Ideas PDF. Deliver an awe-inspiring pitch that will mesmerize everyone. Using these presentation templates you will surely catch everyones attention. You can browse the ppts collection on our website. We have researchers who are experts at creating the right content for the templates. So you do not have to invest time in any additional work. Just grab the template now and use them.
Lead Generation Dashboard For Tracking Conversion Rates Enhancing Client Lead Conversion Rates Inspiration PDF
This slide covers the KPI dashboard for tracking lead conversion rates. It includes metrics such as visitors, average session rate, per visit, bounce rate, page views, etc. Slidegeeks has constructed Lead Generation Dashboard For Tracking Conversion Rates Enhancing Client Lead Conversion Rates Inspiration PDF after conducting extensive research and examination. These presentation templates are constantly being generated and modified based on user preferences and critiques from editors. Here, you will find the most attractive templates for a range of purposes while taking into account ratings and remarks from users regarding the content. This is an excellent jumping off point to explore our content and will give new users an insight into our top notch PowerPoint Templates.


 Continue with Email

 Home
Home


