Snapshot

Proposal For Corporate Photography And Videography Services Example Document Report Doc Pdf Ppt
Heres a predesigned Proposal For Corporate Photography And Videography Services Example Document Report Doc Pdf Ppt for you. Built on extensive research and analysis, this one-complete deck has all the center pieces of your specific requirements. This temple exudes brilliance and professionalism. Being completely editable, you can make changes to suit your purpose. Get this Proposal For Corporate Photography And Videography Services Example Document Report Doc Pdf Ppt A4 One-pager now.
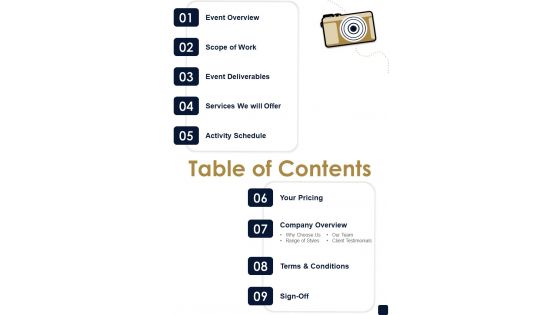
Table Of Contents Proposal For Corporate Photography And Videography Services One Pager Sample Example Document
Presenting you an exemplary Table Of Contents Proposal For Corporate Photography And Videography Services One Pager Sample Example Document. Our one-pager comprises all the must-have essentials of an inclusive document. You can edit it with ease, as its layout is completely editable. With such freedom, you can tweak its design and other elements to your requirements. Download this Table Of Contents Proposal For Corporate Photography And Videography Services One Pager Sample Example Document brilliant piece now.
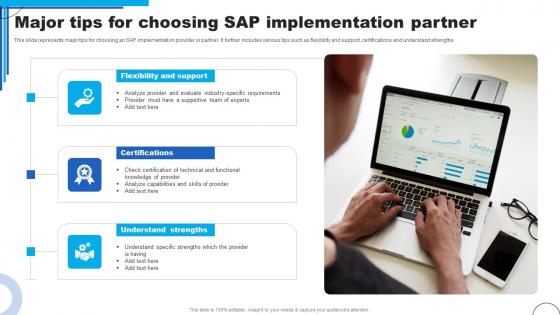
Major Tips For Choosing SAP Implementation Partner Ppt Pictures Guide Pdf
This slide represents major tips for choosing an SAP implementation provider or partner. It further includes various tips such as Flexibility And Support, Certifications, Understand Strengths. Showcasing this set of slides titled Major Tips For Choosing SAP Implementation Partner Ppt Pictures Guide Pdf. The topics addressed in these templates are Flexibility And Support, Certifications, Understand Strengths. All the content presented in this PPT design is completely editable. Download it and make adjustments in color, background, font etc. as per your unique business setting. This slide represents major tips for choosing an SAP implementation provider or partner. It further includes various tips such as Flexibility And Support, Certifications, Understand Strengths.

Technical Proof Of Concept For IT Project Ppt Styles Pictures Pdf
This slide showcase technical proof of concept for information technology project. It includes elements such as project alpha, project beta, schedule and value etc. Pitch your topic with ease and precision using this Technical Proof Of Concept For IT Project Ppt Styles Pictures Pdf. This layout presents information on Project Alpha, Project Beta, Schedule And Value. It is also available for immediate download and adjustment. So, changes can be made in the color, design, graphics or any other component to create a unique layout. This slide showcase technical proof of concept for information technology project. It includes elements such as project alpha, project beta, schedule and value etc.
Target Market Assessment Analysis Icon Mockup PDF
Persuade your audience using this Target Market Assessment Analysis Icon Mockup PDF. This PPT design covers four stages, thus making it a great tool to use. It also caters to a variety of topics including Target Market Assessment, Analysis Icon. Download this PPT design now to present a convincing pitch that not only emphasizes the topic but also showcases your presentation skills.
Business Objectives Impact Analysis Icon Themes PDF
Presenting Business Objectives Impact Analysis Icon Themes PDF to dispense important information. This template comprises three stages. It also presents valuable insights into the topics including Business Objectives, Impact Analysis Icon. This is a completely customizable PowerPoint theme that can be put to use immediately. So, download it and address the topic impactfully.
Business Process Impact Analysis Icon Demonstration PDF
Persuade your audience using this Business Process Impact Analysis Icon Demonstration PDF. This PPT design covers three stages, thus making it a great tool to use. It also caters to a variety of topics including Business Process, Impact Analysis Icon. Download this PPT design now to present a convincing pitch that not only emphasizes the topic but also showcases your presentation skills.
Problem Analysis Overview Procedure Icon Summary PDF
Presenting Problem Analysis Overview Procedure Icon Summary PDF to dispense important information. This template comprises three stages. It also presents valuable insights into the topics including Problem Analysis, Overview Procedure Icon . This is a completely customizable PowerPoint theme that can be put to use immediately. So, download it and address the topic impactfully.
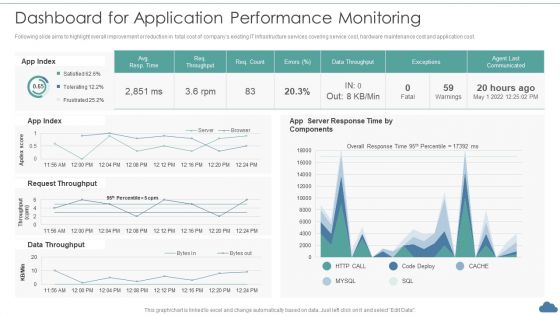
Cloud Optimization Infrastructure Model Dashboard For Application Performance Monitoring Mockup PDF
Following slide aims to highlight overall improvement or reduction in total cost of companys existing IT Infrastructure services covering service cost, hardware maintenance cost and application cost.Deliver and pitch your topic in the best possible manner with this Cloud Optimization Infrastructure Model Dashboard For Application Performance Monitoring Mockup PDF Use them to share invaluable insights on Request Throughput, Data Throughput, Server Response and impress your audience. This template can be altered and modified as per your expectations. So, grab it now.
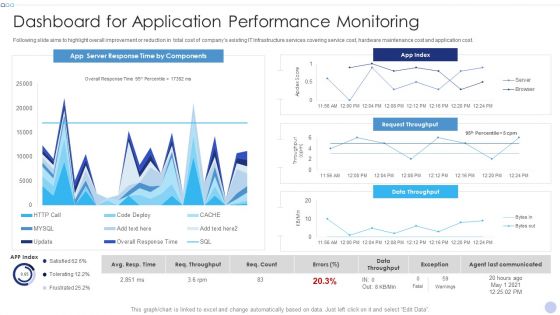
Techniques To Implement Cloud Infrastructure Dashboard For Application Performance Monitoring Topics PDF
Following slide aims to highlight overall improvement or reduction in total cost of companys existing IT Infrastructure services covering service cost, hardware maintenance cost and application cost.Deliver and pitch your topic in the best possible manner with this Techniques To Implement Cloud Infrastructure Dashboard For Application Performance Monitoring Topics PDF. Use them to share invaluable insights on Server Response, Data Throughput, Request Throughput and impress your audience. This template can be altered and modified as per your expectations. So, grab it now.
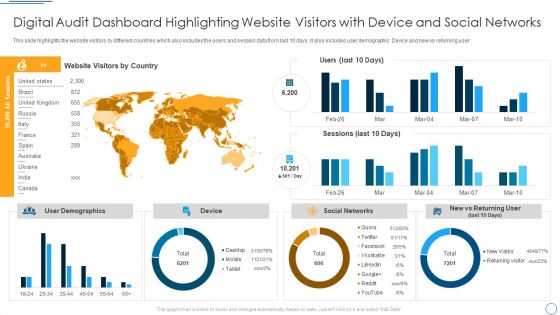
Digital Audit Dashboard Highlighting Website Visitors With Device And Social Networks Download PDF
This slide highlights the website visitors by different countries which also includes the users and session data from last 10 days, it also includes user demographic. Device and new vs returning user.Deliver an awe inspiring pitch with this creative Digital Audit Dashboard Highlighting Website Visitors With Device And Social Networks Download PDF bundle. Topics like Website Visitors, Social Networks can be discussed with this completely editable template. It is available for immediate download depending on the needs and requirements of the user.
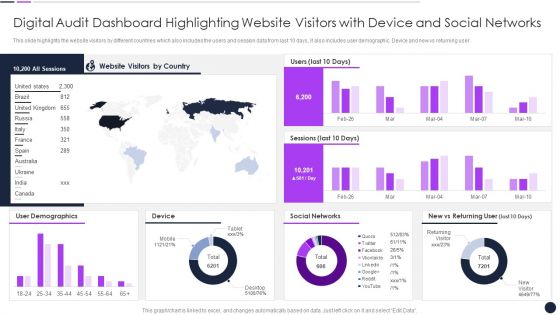
Digital Audit Dashboard Highlighting Website Visitors With Device And Social Networks Themes PDF
This slide highlights the website visitors by different countries which also includes the users and session data from last 10 days, it also includes user demographic. Device and new vs returning user.Deliver an awe inspiring pitch with this creative Digital Audit Dashboard Highlighting Website Visitors With Device And Social Networks Themes PDF bundle. Topics like Visitors Country, Social Networks, Demographics can be discussed with this completely editable template. It is available for immediate download depending on the needs and requirements of the user.
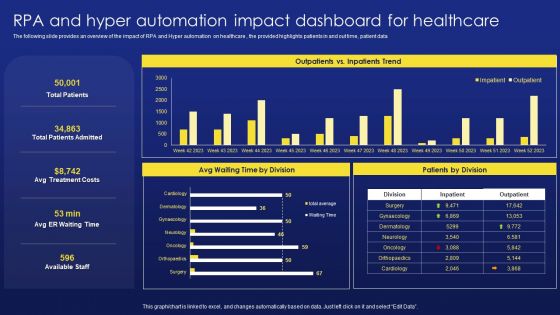
Deployment Procedure Of Hyper Automation RPA And Hyper Automation Impact Dashboard For Healthcare Formats PDF
The following slide provides an overview of the impact of RPA and Hyper automation on healthcare , the provided highlights patients in and out time, patient data. There are so many reasons you need a Deployment Procedure Of Hyper Automation RPA And Hyper Automation Impact Dashboard For Healthcare Formats PDF. The first reason is you can not spend time making everything from scratch, Thus, Slidegeeks has made presentation templates for you too. You can easily download these templates from our website easily.
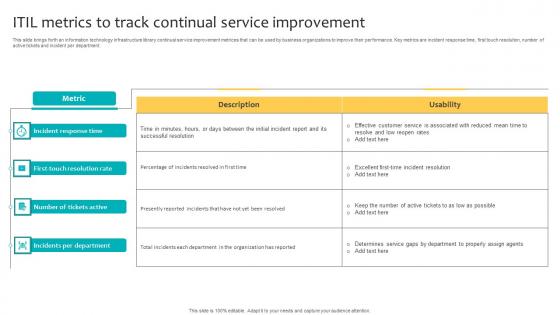
ITIL Metrics To Track Continual Service Improvement Infographics Pdf
This slide brings forth an information technology infrastructure library continual service improvement metrices that can be used by business organizations to improve their performance. Key metrics are incident response time, first touch resolution, number of active tickets and incident per department. Pitch your topic with ease and precision using this ITIL Metrics To Track Continual Service Improvement Infographics Pdf. This layout presents information on Incident Response Time, Number Of Tickets Active, Incidents Per Department. It is also available for immediate download and adjustment. So, changes can be made in the color, design, graphics or any other component to create a unique layout. This slide brings forth an information technology infrastructure library continual service improvement metrices that can be used by business organizations to improve their performance. Key metrics are incident response time, first touch resolution, number of active tickets and incident per department.
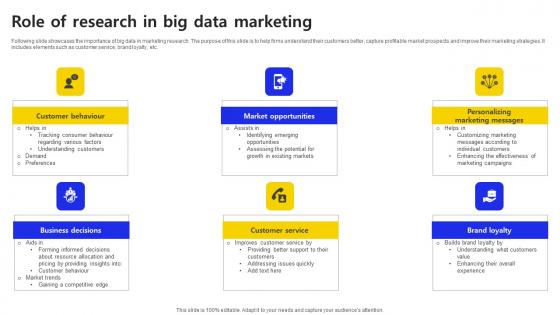
Role Of Research In Big Data Marketing Ppt Pictures Slideshow PDF
Following slide showcases the importance of big data in marketing research. The purpose of this slide is to help firms understand their customers better, capture profitable market prospects and improve their marketing strategies. It includes elements such as customer service, brand loyalty, etc. Pitch your topic with ease and precision using this Role Of Research In Big Data Marketing Ppt Pictures Slideshow PDF. This layout presents information on Customer Service, Brand Loyalty, Marketing. It is also available for immediate download and adjustment. So, changes can be made in the color, design, graphics or any other component to create a unique layout. Following slide showcases the importance of big data in marketing research. The purpose of this slide is to help firms understand their customers better, capture profitable market prospects and improve their marketing strategies. It includes elements such as customer service, brand loyalty, etc.
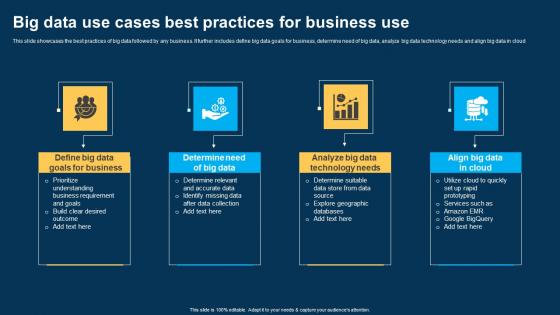
Big Data Use Cases Best Practices For Business Use Ppt Pictures Show pdf
This slide showcases the best practices of big data followed by any business. It further includes define big data goals for business, determine need of big data, analyze big data technology needs and align big data in cloud. Pitch your topic with ease and precision using this Big Data Use Cases Best Practices For Business Use Ppt Pictures Show pdf. This layout presents information on Determine Need, Big Data, Align Big Data,Cloud. It is also available for immediate download and adjustment. So, changes can be made in the color, design, graphics or any other component to create a unique layout. This slide showcases the best practices of big data followed by any business. It further includes define big data goals for business, determine need of big data, analyze big data technology needs and align big data in cloud.
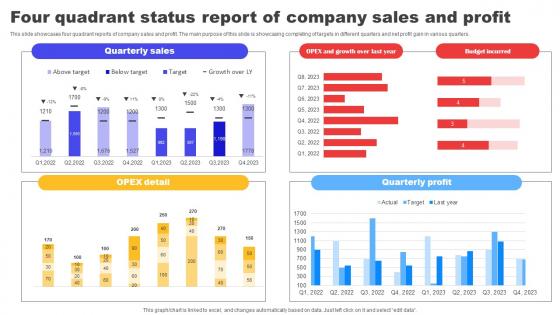
Four Quadrant Status Report Of Company Sales And Profit Pictures pdf
This slide showcases four quadrant reports of company sales and profit. The main purpose of this slide is showcasing completing of targets in different quarters and net profit gain in various quarters. Showcasing this set of slides titled Four Quadrant Status Report Of Company Sales And Profit Pictures pdf. The topics addressed in these templates are Quarterly Sales,OPEX Detail,Quarterly Profit. All the content presented in this PPT design is completely editable. Download it and make adjustments in color, background, font etc. as per your unique business setting. This slide showcases four quadrant reports of company sales and profit. The main purpose of this slide is showcasing completing of targets in different quarters and net profit gain in various quarters.
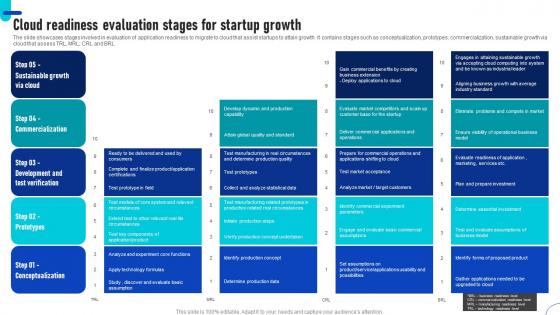
Cloud Readiness Evaluation Stages For Startup Growth Ppt Pictures Graphics Pdf
The slide showcases stages involved in evaluation of application readiness to migrate to cloud that assist startups to attain growth. It contains stages such as conceptualization, prototypes, commercialization, sustainable growth via cloud that assess TRL, MRL, CRL and BRL. Showcasing this set of slides titled Cloud Readiness Evaluation Stages For Startup Growth Ppt Pictures Graphics Pdf. The topics addressed in these templates are Conceptualization, Prototypes, Commercialization. All the content presented in this PPT design is completely editable. Download it and make adjustments in color, background, font etc. as per your unique business setting. The slide showcases stages involved in evaluation of application readiness to migrate to cloud that assist startups to attain growth. It contains stages such as conceptualization, prototypes, commercialization, sustainable growth via cloud that assess TRL, MRL, CRL and BRL.

New Product Rollout Pricing Strategy For Brands Ppt Pictures Background Pdf
This slide showcases various pricing strategies for new product launch by brands to enhance revenue. This includes strategies like price skimming, penetrative pricing, competitive pricing, premium pricing, and dynamic pricing. Showcasing this set of slides titled New Product Rollout Pricing Strategy For Brands Ppt Pictures Background Pdf. The topics addressed in these templates are Price Skimming, Penetrative Pricing, Competitive Pricing. All the content presented in this PPT design is completely editable. Download it and make adjustments in color, background, font etc. as per your unique business setting. This slide showcases various pricing strategies for new product launch by brands to enhance revenue. This includes strategies like price skimming, penetrative pricing, competitive pricing, premium pricing, and dynamic pricing.
B2B Lead Generation Strategy To Boost Revenue Ppt Pictures Icon Pdf
This slide shows various techniques use by B2B in lead generation for boosting sales revenue. It includes techniques such as referrals, email marketing, social media, inbound and content marketing , print advertisement etc. Showcasing this set of slides titled B2B Lead Generation Strategy To Boost Revenue Ppt Pictures Icon Pdf. The topics addressed in these templates are Lead Generated, B2b Business, Direct Mail Contributed. All the content presented in this PPT design is completely editable. Download it and make adjustments in color, background, font etc. as per your unique business setting. This slide shows various techniques use by B2B in lead generation for boosting sales revenue. It includes techniques such as referrals, email marketing, social media, inbound and content marketing , print advertisement etc.
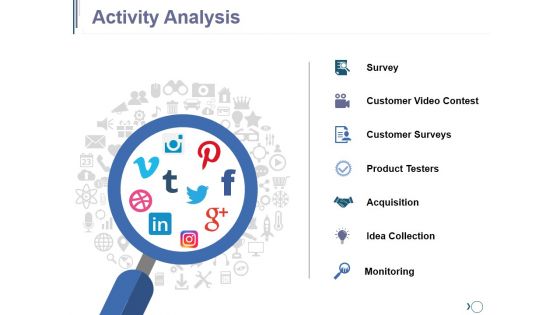
Activity Analysis Ppt PowerPoint Presentation Diagram Images
This is a activity analysis ppt powerpoint presentation diagram images. This is a one stage process. The stages in this process are survey, customer video contest, customer surveys, product testers, acquisition, idea collection.

Techniques To Enhance Customer Engagement Via Digital Platforms Dashboard To Measure Performance Of E Commerce Marketing Strategies Slides PDF
This following slide displays the key metrics that can help an organization to measure effectiveness of e-commerce strategies. These can be revenue generated using e-commerce platform, conversion rates etc. Present like a pro with Techniques To Enhance Customer Engagement Via Digital Platforms Dashboard To Measure Performance Of E Commerce Marketing Strategies Slides PDF Create beautiful presentations together with your team, using our easy-to-use presentation slides. Share your ideas in real-time and make changes on the fly by downloading our templates. So whether you are in the office, on the go, or in a remote location, you can stay in sync with your team and present your ideas with confidence. With Slidegeeks presentation got a whole lot easier. Grab these presentations today.

Adopted Mobile Analytics Tool With Benefits Comprehensive Guide For Marketing Technology
Following slide provides information about various benefits of adopting mobile analytics solution. It includes key benefits such as real time data and insights, journey analysis, tracking, crash reporting,scalability, cloud integration, etc.Create an editable Adopted Mobile Analytics Tool With Benefits Comprehensive Guide For Marketing Technology that communicates your idea and engages your audience. Whether you are presenting a business or an educational presentation, pre-designed presentation templates help save time. Adopted Mobile Analytics Tool With Benefits Comprehensive Guide For Marketing Technology is highly customizable and very easy to edit, covering many different styles from creative to business presentations. Slidegeeks has creative team members who have crafted amazing templates. So, go and get them without any delay. Following slide provides information about various benefits of adopting mobile analytics solution. It includes key benefits such as real time data and insights, journey analysis, tracking, crash reporting,scalability, cloud integration, etc.
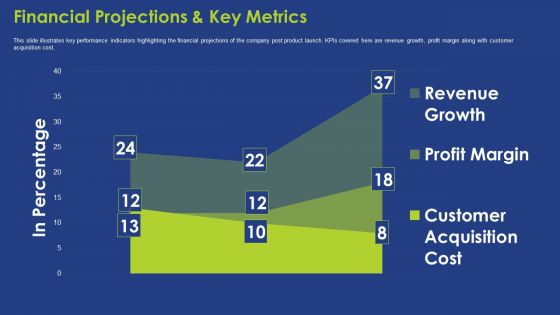
Financial Projections And Key Metrics Ppt Summary Background PDF
This slide illustrates key performance indicators highlighting the financial projections of the company post product launch. KPIs covered here are revenue growth, profit margin along with customer acquisition cost. Deliver an awe inspiring pitch with this creative financial projections and key metrics ppt summary background pdf bundle. Topics like financial projections and key metrics can be discussed with this completely editable template. It is available for immediate download depending on the needs and requirements of the user.
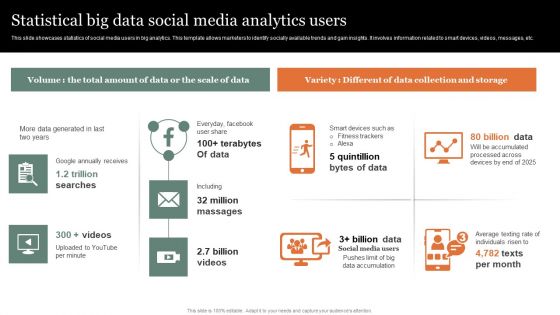
Statistical Big Data Social Media Analytics Users Pictures PDF
Showcasing this set of slides titled Statistical Big Data Social Media Analytics Users Pictures PDF Brochure. The topics addressed in these templates are Statistical, Social, Analytics. All the content presented in this PPT design is completely editable. Download it and make adjustments in color, background, font etc. as per your unique business setting.
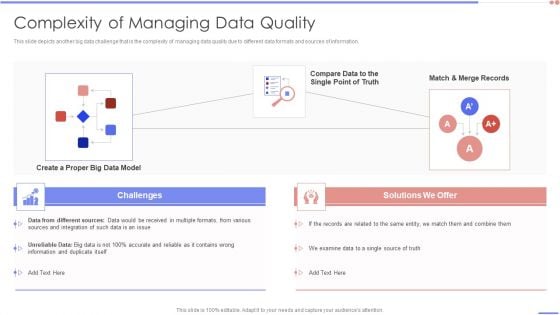
Data Analytics Management Complexity Of Managing Data Quality Summary PDF
This slide depicts another big data challenge that is the complexity of managing data quality due to different data formats and sources of information.Deliver an awe inspiring pitch with this creative Data Analytics Management Complexity Of Managing Data Quality Summary PDF bundle. Topics like Received In Multiple, Accurate Reliable, Information Duplicate can be discussed with this completely editable template. It is available for immediate download depending on the needs and requirements of the user.
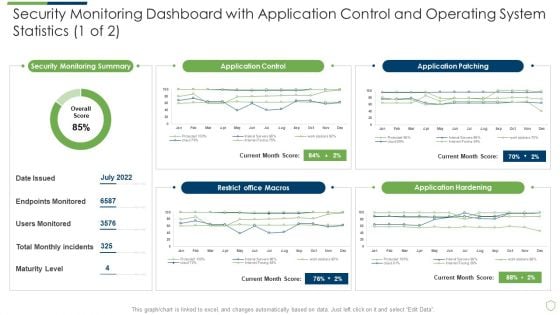
Modern Security Observation Plan To Eradicate Cybersecurity Risk And Data Breach Security Monitoring Dashboard With Application Slides PDF
Deliver and pitch your topic in the best possible manner with this modern security observation plan to eradicate cybersecurity risk and data breach security monitoring dashboard with application slides pdf. Use them to share invaluable insights on security monitoring dashboard with application control and operating system statistics and impress your audience. This template can be altered and modified as per your expectations. So, grab it now.
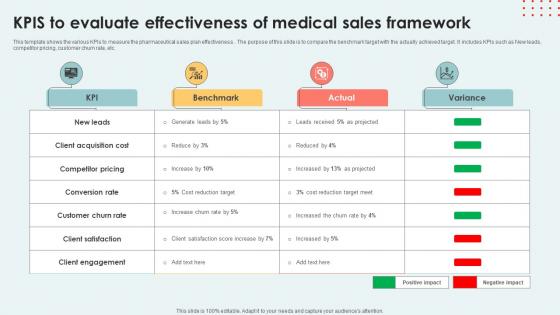
KPIs To Evaluate Effectiveness Of Medical Sales Framework Download Pdf
This template shows the various KPIs to measure the pharmaceutical sales plan effectiveness. . The purpose of this slide is to compare the benchmark target with the actually achieved target. It includes KPIs such as New leads, competitor pricing, customer churn rate, etc. Pitch your topic with ease and precision using this KPIs To Evaluate Effectiveness Of Medical Sales Framework Download Pdf This layout presents information on Conversion Rate, Customer Churn, Client Satisfaction It is also available for immediate download and adjustment. So, changes can be made in the color, design, graphics or any other component to create a unique layout. This template shows the various KPIs to measure the pharmaceutical sales plan effectiveness. . The purpose of this slide is to compare the benchmark target with the actually achieved target. It includes KPIs such as New leads, competitor pricing, customer churn rate, etc.
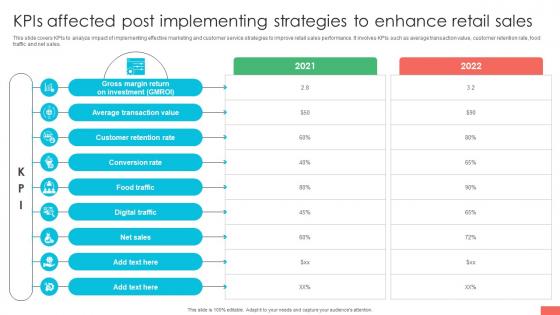
Marketing Strategies For Effective Kpis Affected Post Implementing Strategies
This slide covers KPIs to analyze impact of implementing effective marketing and customer service strategies to improve retail sales performance. It involves KPIs such as average transaction value, customer retention rate, food traffic and net sales. Welcome to our selection of the Marketing Strategies For Effective Kpis Affected Post Implementing Strategies. These are designed to help you showcase your creativity and bring your sphere to life. Planning and Innovation are essential for any business that is just starting out. This collection contains the designs that you need for your everyday presentations. All of our PowerPoints are 100Percent editable, so you can customize them to suit your needs. This multi-purpose template can be used in various situations. Grab these presentation templates today. This slide covers KPIs to analyze impact of implementing effective marketing and customer service strategies to improve retail sales performance. It involves KPIs such as average transaction value, customer retention rate, food traffic and net sales.
Automating Supply Chain Dashboard For Tracking Impact Of Supply Chain Automation Pictures PDF
This slide covers the dashboard for back-end tracking of overall impact automation. It include KPIs such as retailer capacity, warehouse capacity, truck efficiency, time to reach warehouse, sustainability, etc. Deliver and pitch your topic in the best possible manner with this Automating Supply Chain Dashboard For Tracking Impact Of Supply Chain Automation Pictures PDF. Use them to share invaluable insights on Supply Chain Manager, Warehouse Manager, Truck Driver and impress your audience. This template can be altered and modified as per your expectations. So, grab it now.
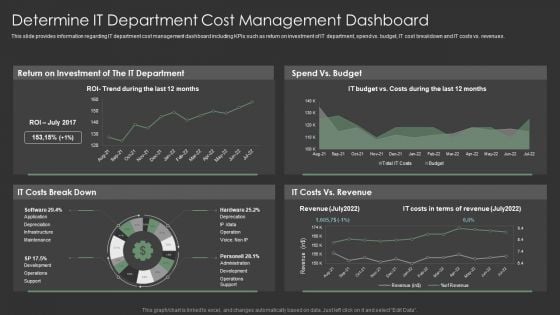
IT Spend Management Priorities By Cios Determine IT Department Cost Management Dashboard Pictures PDF
This slide provides information regarding IT department cost management dashboard including KPIs such as return on investment of IT department, spend vs. budget, IT cost breakdown and IT costs vs. revenues. Deliver and pitch your topic in the best possible manner with this IT Spend Management Priorities By Cios Determine IT Department Cost Management Dashboard Pictures PDF. Use them to share invaluable insights on Revenue, Costs, Budget and impress your audience. This template can be altered and modified as per your expectations. So, grab it now.
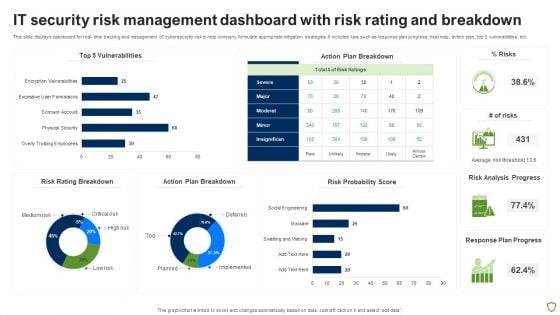
IT Security Risk Management Dashboard With Risk Rating And Breakdown Pictures PDF
This slide displays dashboard for real- time tracking and management of cybersecurity risk to help company formulate appropriate mitigation strategies. It includes kpis such as response plan progress, heat map, action plan, top 5 vulnerabilities, etc. Pitch your topic with ease and precision using this IT Security Risk Management Dashboard With Risk Rating And Breakdown Pictures PDF. This layout presents information on Risk Rating Breakdown, Action Plan Breakdown, Risk Probability Score, Risk Analysis Progress. It is also available for immediate download and adjustment. So, changes can be made in the color, design, graphics or any other component to create a unique layout.
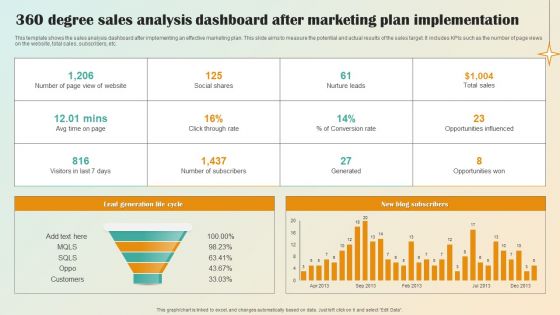
360 Degree Sales Analysis Dashboard After Marketing Plan Implementation Pictures PDF
This template shows the sales analysis dashboard after implementing an effective marketing plan. This slide aims to measure the potential and actual results of the sales target. It includes KPIs such as the number of page views on the website, total sales, subscribers, etc.Pitch your topic with ease and precision using this 360 Degree Sales Analysis Dashboard After Marketing Plan Implementation Pictures PDF. This layout presents information on Lead Generation Life, Conversion Rate. It is also available for immediate download and adjustment. So, changes can be made in the color, design, graphics or any other component to create a unique layout.
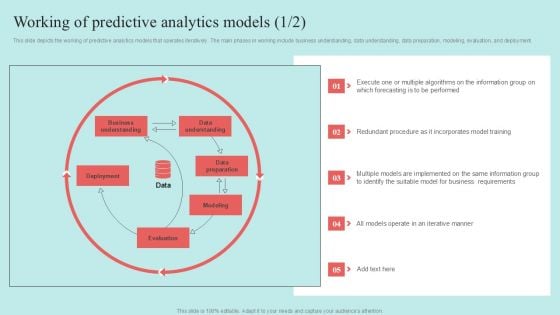
Predictive Data Model Working Of Predictive Analytics Models Pictures PDF
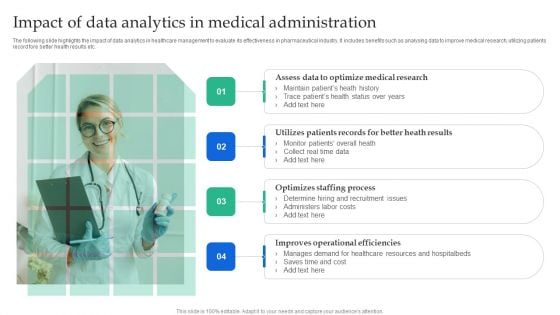
Impact Of Data Analytics In Medical Administration Pictures PDF
The following slide highlights the impact of data analytics in healthcare management to evaluate its effectiveness in pharmaceutical industry. It includes benefits such as analysing data to improve medical research, utilizing patients record fore better health results etc.Pitch your topic with ease and precision using this Impact Of Data Analytics In Medical Administration Pictures PDF. This layout presents information on Determine Hiring, Administers Labor, Operational Efficiencies. It is also available for immediate download and adjustment. So, changes can be made in the color, design, graphics or any other component to create a unique layout.
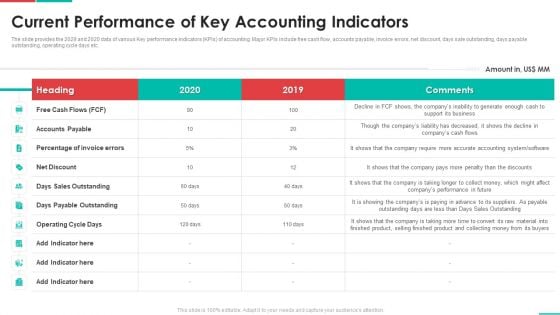
Roadmap For Financial Accounting Transformation Current Performance Of Key Accounting Indicators Elements PDF
The slide provides the 2029 and 2020 data of various Key performance indicators KPIs of accounting. Major KPIs include free cash flow, accounts payable, invoice errors, net discount, days sale outstanding, days payable outstanding, operating cycle days etc. Deliver an awe inspiring pitch with this creative roadmap for financial accounting transformation current performance of key accounting indicators elements pdf bundle. Topics like accounts payable, operating cycle days, days payable outstanding, net discount can be discussed with this completely editable template. It is available for immediate download depending on the needs and requirements of the user.
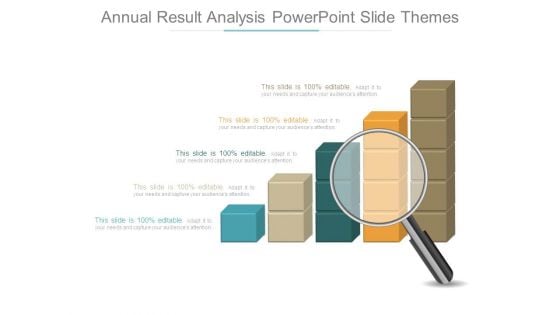
Annual Result Analysis Powerpoint Slide Themes
This is a annual result analysis powerpoint slide themes. This is a five stage process. The stages in this process are business, process, presentation, strategy, analysis.

Kpis To Control Food Product Quality And Product Service Hygiene
The slide covers KPIs that can be used to track and evaluate the quality of food and services for continuous improvement. Major metrics are customer complaint rate, food waste percentage, etc.Explore a selection of the finest Kpis To Control Food Product Quality And Product Service Hygiene here. With a plethora of professionally designed and pre-made slide templates, you can quickly and easily find the right one for your upcoming presentation. You can use our Kpis To Control Food Product Quality And Product Service Hygiene to effectively convey your message to a wider audience. Slidegeeks has done a lot of research before preparing these presentation templates. The content can be personalized and the slides are highly editable. Grab templates today from Slidegeeks. The slide covers KPIs that can be used to track and evaluate the quality of food and services for continuous improvement. Major metrics are customer complaint rate, food waste percentage, etc.
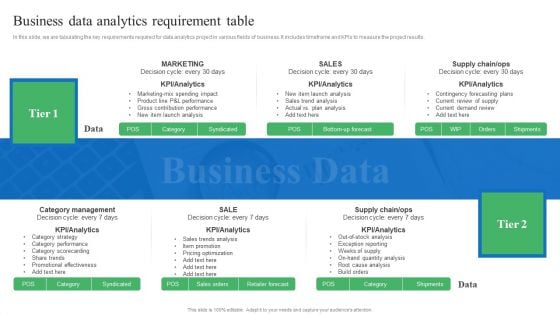
Toolkit For Data Science And Analytics Transition Business Data Analytics Requirement Table Sample PDF
In this slide, we are tabulating the key requirements required for data analytics project in various fields of business. It includes timeframe and KPIs to measure the project results. This Toolkit For Data Science And Analytics Transition Business Data Analytics Requirement Table Sample PDF from Slidegeeks makes it easy to present information on your topic with precision. It provides customization options, so you can make changes to the colors, design, graphics, or any other component to create a unique layout. It is also available for immediate download, so you can begin using it right away. Slidegeeks has done good research to ensure that you have everything you need to make your presentation stand out. Make a name out there for a brilliant performance.
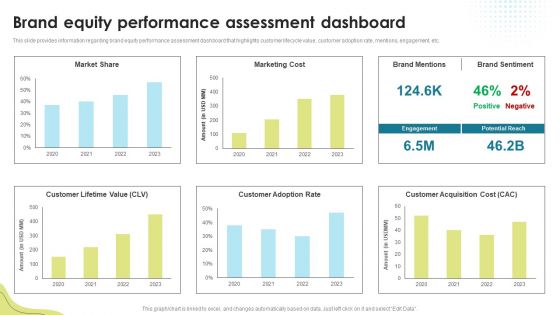
Brand Equity Performance Assessment Dashboard Brand Administration Template PDF
This slide provides information regarding brand equity performance assessment dashboard that highlights customer lifecycle value, customer adoption rate, mentions, engagement, etc. This modern and well-arranged Brand Equity Performance Assessment Dashboard Brand Administration Template PDF provides lots of creative possibilities. It is very simple to customize and edit with the Powerpoint Software. Just drag and drop your pictures into the shapes. All facets of this template can be edited with Powerpoint no extra software is necessary. Add your own material, put your images in the places assigned for them, adjust the colors, and then you can show your slides to the world, with an animated slide included.
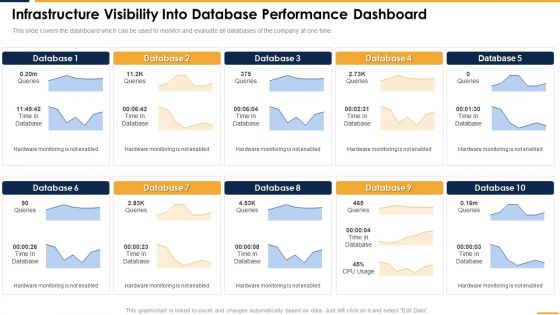
Infrastructure Visibility Into Database Performance Dashboard Rules PDF
This slide covers the dashboard which can be used to monitor and evaluate all databases of the company at one time. This modern and well arranged Infrastructure Visibility Into Database Performance Dashboard Rules PDF provides lots of creative possibilities. It is very simple to customize and edit with the Powerpoint Software. Just drag and drop your pictures into the shapes. All facets of this template can be edited with Powerpoint no extra software is necessary. Add your own material, put your images in the places assigned for them, adjust the colors, and then you can show your slides to the world, with an animated slide included.
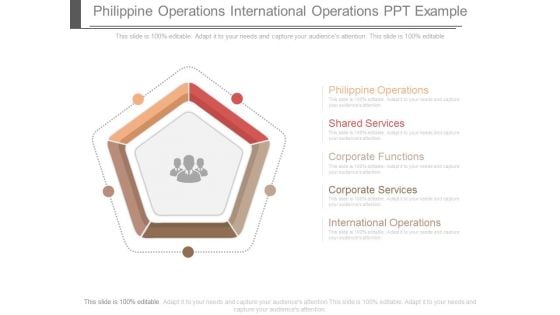
Philippine Operations International Operations Ppt Example
This is a philippine operations international operations ppt example. This is a five stage process. The stages in this process are shapes, marketing, business.
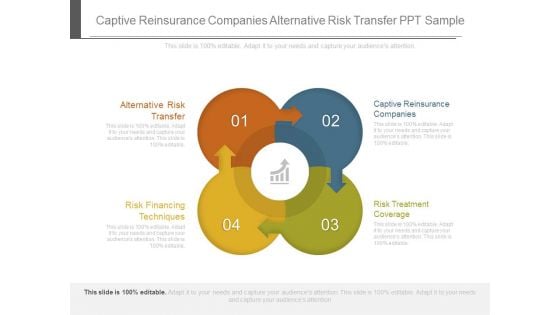
Captive Reinsurance Companies Alternative Risk Transfer Ppt Sample
This is a captive reinsurance companies alternative risk transfer ppt sample. This is a four stage process. The stages in this process are arrow, marketing, business.
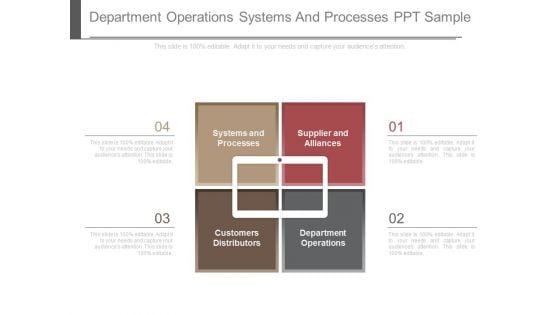
Department Operations Systems And Processes Ppt Sample
This is a department operations systems and processes ppt sample. This is a four stage process. The stages in this process are business, marketing.
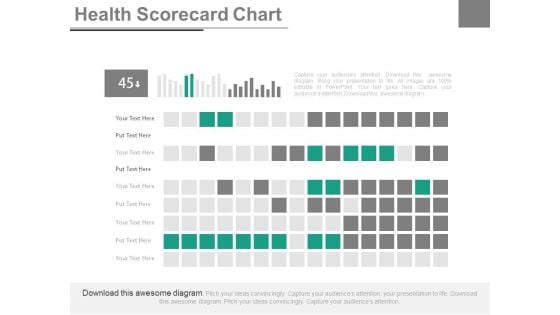
Health Scorecard Chart Ppt Slides
This is a health scorecard chart ppt slides. This is a nine stage process. The stages in this process are business, marketing.

Manger Presenting Business Data Statistics Report Ppt PowerPoint Presentation File Images PDF
Persuade your audience using this manger presenting business data statistics report ppt powerpoint presentation file images pdf. This PPT design covers three stages, thus making it a great tool to use. It also caters to a variety of topics including manger presenting business data statistics report. Download this PPT design now to present a convincing pitch that not only emphasizes the topic but also showcases your presentation skills.
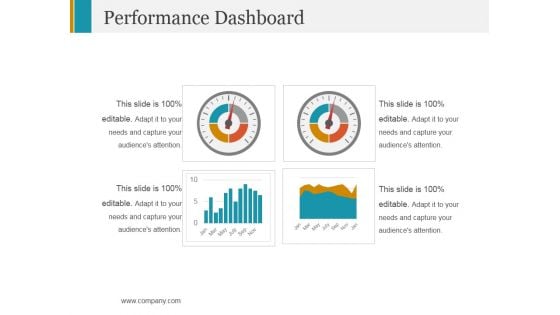
Performance Dashboard Template 2 Ppt PowerPoint Presentation Model Format
This is a performance dashboard template 2 ppt powerpoint presentation model format. This is a four stage process. The stages in this process are dashboard, finance, business, marketing.
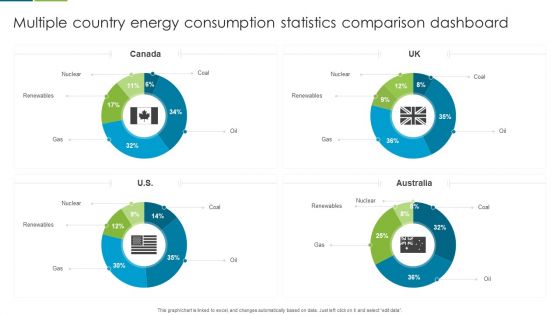
Multiple Country Energy Consumption Statistics Comparison Dashboard Formats PDF
This graph or chart is linked to excel, and changes automatically based on data. Just left click on it and select edit data. Pitch your topic with ease and precision using this Multiple Country Energy Consumption Statistics Comparison Dashboard Formats PDF. This layout presents information on Nuclear, Renewables, Gas. It is also available for immediate download and adjustment. So, changes can be made in the color, design, graphics or any other component to create a unique layout.
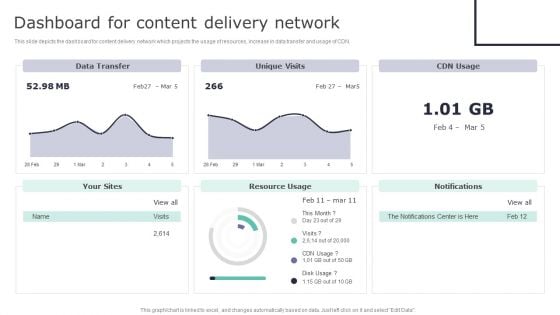
Deploying Content Distribution Network System Dashboard For Content Delivery Network Mockup PDF
This slide depicts the dashboard for content delivery network which projects the usage of resources, increase in data transfer and usage of CDN. Find highly impressive Deploying Content Distribution Network System Dashboard For Content Delivery Network Mockup PDF on Slidegeeks to deliver a meaningful presentation. You can save an ample amount of time using these presentation templates. No need to worry to prepare everything from scratch because Slidegeeks experts have already done a huge research and work for you. You need to download Deploying Content Distribution Network System Dashboard For Content Delivery Network Mockup PDF for your upcoming presentation. All the presentation templates are 100 percent editable and you can change the color and personalize the content accordingly. Download now
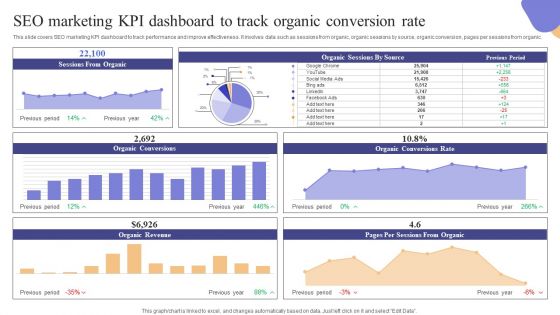
SEO Marketing KPI Dashboard To Track Organic Conversion Rate Microsoft PDF
This slide covers SEO marketing KPI dashboard to track performance and improve effectiveness. It involves data such as sessions from organic, organic sessions by source, organic conversion, pages per sessions from organic. Formulating a presentation can take up a lot of effort and time, so the content and message should always be the primary focus. The visuals of the PowerPoint can enhance the presenters message, so our SEO Marketing KPI Dashboard To Track Organic Conversion Rate Microsoft PDF was created to help save time. Instead of worrying about the design, the presenter can concentrate on the message while our designers work on creating the ideal templates for whatever situation is needed. Slidegeeks has experts for everything from amazing designs to valuable content, we have put everything into SEO Marketing KPI Dashboard To Track Organic Conversion Rate Microsoft PDF
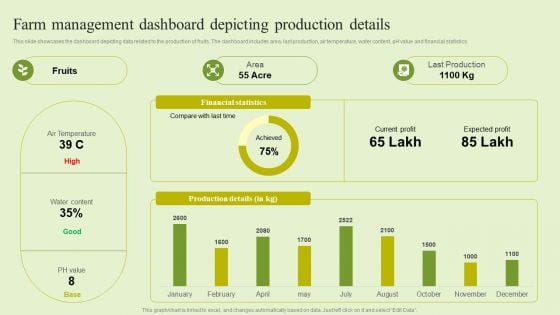
Agriculture Marketing Strategy To Improve Revenue Performance Farm Management Dashboard Depicting Production Themes PDF
This slide showcases the dashboard depicting data related to the production of fruits. The dashboard includes area, last production, air temperature, water content, pH value and financial statistics. Coming up with a presentation necessitates that the majority of the effort goes into the content and the message you intend to convey. The visuals of a PowerPoint presentation can only be effective if it supplements and supports the story that is being told. Keeping this in mind our experts created Agriculture Marketing Strategy To Improve Revenue Performance Farm Management Dashboard Depicting Production Themes PDF to reduce the time that goes into designing the presentation. This way, you can concentrate on the message while our designers take care of providing you with the right template for the situation.
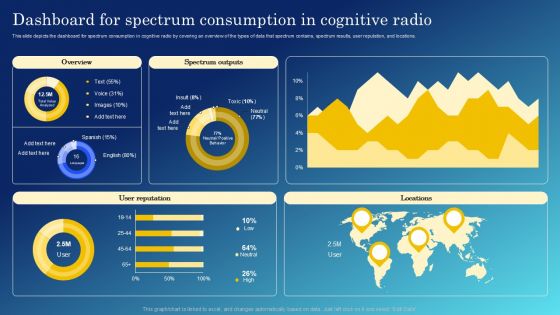
Cognitive Sensing Innovation Dashboard For Spectrum Consumption In Cognitive Radio Brochure PDF

Smart Wireless Sensor Networks Dashboard For Spectrum Consumption In Cognitive Radio Professional PDF
This slide depicts the dashboard for spectrum consumption in cognitive radio by covering an overview of the types of data that spectrum contains, spectrum results, user reputation, and locations. Get a simple yet stunning designed Smart Wireless Sensor Networks Dashboard For Spectrum Consumption In Cognitive Radio Professional PDF. It is the best one to establish the tone in your meetings. It is an excellent way to make your presentations highly effective. So, download this PPT today from Slidegeeks and see the positive impacts. Our easy-to-edit Smart Wireless Sensor Networks Dashboard For Spectrum Consumption In Cognitive Radio Professional PDF can be your go-to option for all upcoming conferences and meetings. So, what are you waiting for Grab this template today.
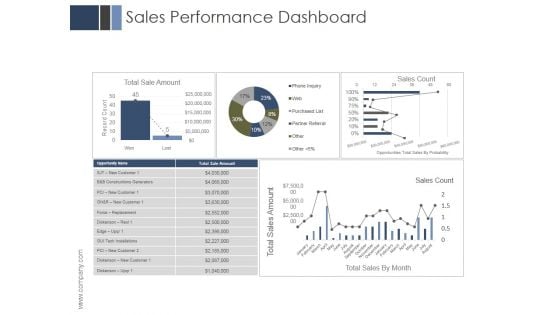
Sales Performance Dashboard Ppt PowerPoint Presentation Example 2015
This is a sales performance dashboard ppt powerpoint presentation example 2015. This is a four stage process. The stages in this process are business, marketing, management, finance, dashboard.
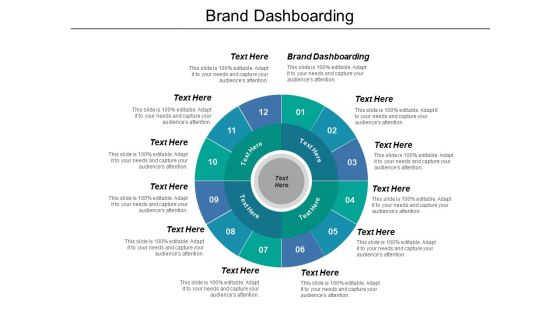
Brand Dashboarding Ppt PowerPoint Presentation Inspiration Graphics Cpb
This is a brand dashboarding ppt powerpoint presentation inspiration graphics cpb. This is a twelve stage process. The stages in this process are brand dashboarding, business, management, marketing.
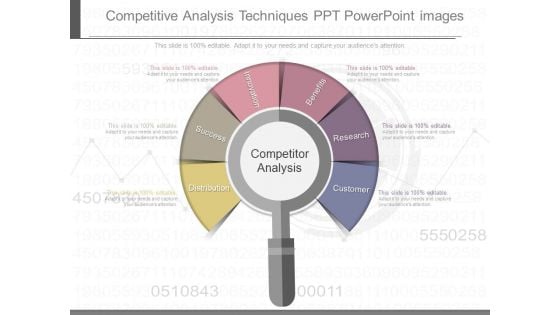
Competitive Analysis Techniques Ppt Powerpoint Images
This is a competitive analysis techniques ppt powerpoint images. This is a six stage process. The stages in this process are competitor analysis, distribution, success, innovation, benefits, research, customer.

Trend Line Technical Analysis Powerpoint Themes
This is a trend line technical analysis powerpoint themes. This is a five stage process. The stages in this process are complex systems, statistical modeling, uncertainty, lateral thinking, mathematical analysis.

Analytics Services Marketing Research Services Management Business Summary Pdf
The following slide highlights the reporting and analytics services offered by Pureprofile. It provides advanced data cleaning, data weighting, RIM weighting and verbatim coding Find a pre-designed and impeccable Analytics Services Marketing Research Services Management Business Summary Pdf. The templates can ace your presentation without additional effort. You can download these easy-to-edit presentation templates to make your presentation stand out from others. So, what are you waiting for Download the template from Slidegeeks today and give a unique touch to your presentation. The following slide highlights the reporting and analytics services offered by Pureprofile. It provides advanced data cleaning, data weighting, RIM weighting and verbatim coding
Data Interpretation Icon To Measure Business Growth Background Pdf
This slide depicts the project management streamline of data analytics on daily basis by setting different target days.Pitch your topic with ease and precision using this Data Interpretation Icon To Measure Business Growth Background Pdf This layout presents information on Data Interpretation, Project Management, Gantt Chart It is also available for immediate download and adjustment. So, changes can be made in the color, design, graphics or any other component to create a unique layout. This slide depicts the project management streamline of data analytics on daily basis by setting different target days.
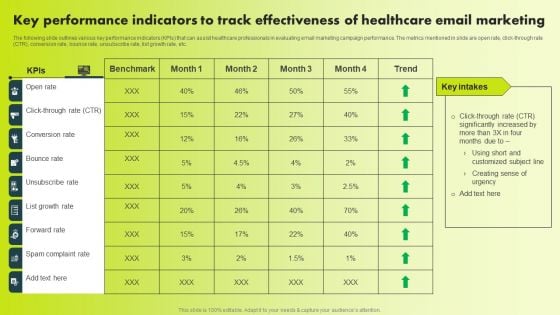
Key Performance Indicators To Track Effectiveness Of Healthcare Email Marketing Introduction PDF
The following slide outlines various key performance indicators KPIs that can assist healthcare professionals in evaluating email marketing campaign performance. The metrics mentioned in slide are open rate, click-through rate CTR, conversion rate, bounce rate, unsubscribe rate, list growth rate, etc. Present like a pro with Key Performance Indicators To Track Effectiveness Of Healthcare Email Marketing Introduction PDF Create beautiful presentations together with your team, using our easy-to-use presentation slides. Share your ideas in real-time and make changes on the fly by downloading our templates. So whether you are in the office, on the go, or in a remote location, you can stay in sync with your team and present your ideas with confidence. With Slidegeeks presentation got a whole lot easier. Grab these presentations today.


 Continue with Email

 Home
Home


