Year To Year Comparison
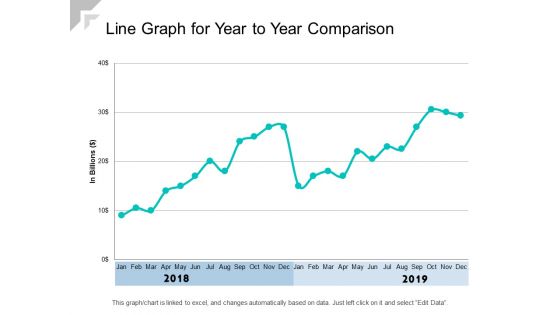
Line Graph For Year To Year Comparison Ppt PowerPoint Presentation Show Graphics Example
Presenting this set of slides with name line graph for year to year comparison ppt powerpoint presentation show graphics example. The topics discussed in these slides are revenue trend, bar chart, financial. This is a completely editable PowerPoint presentation and is available for immediate download. Download now and impress your audience.
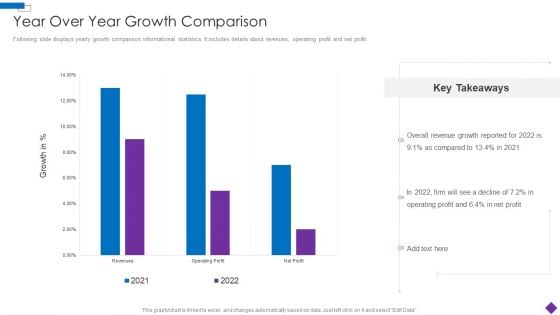
Introducing A New Product To The Market Year Over Year Growth Comparison Elements PDF
Following slide displays yearly growth comparison informational statistics. It includes details about revenues, operating profit and net profit. Deliver and pitch your topic in the best possible manner with this Introducing A New Product To The Market Year Over Year Growth Comparison Elements PDF. Use them to share invaluable insights on Year Over Year Growth Comparison and impress your audience. This template can be altered and modified as per your expectations. So, grab it now.
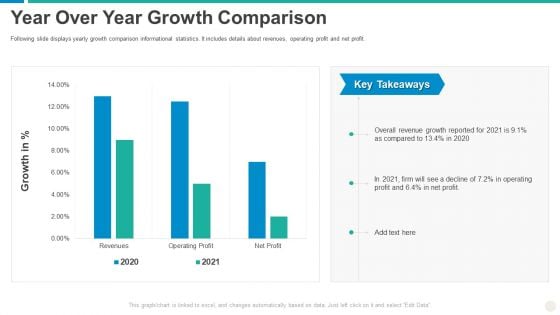
Establishing Successful Brand Strategy To Captivate Consumers Year Over Year Growth Comparison Professional PDF
Following slide displays yearly growth comparison informational statistics. It includes details about revenues, operating profit and net profit. Deliver an awe inspiring pitch with this creative establishing successful brand strategy to captivate consumers year over year growth comparison professional pdf bundle. Topics like operating profit, revenue, growth can be discussed with this completely editable template. It is available for immediate download depending on the needs and requirements of the user.
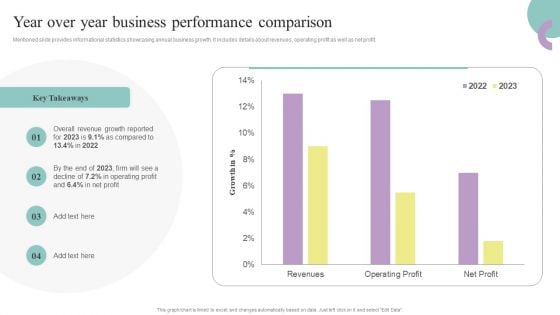
Comprehensive Guide To Enhance Year Over Year Business Performance Comparison Professional PDF
Mentioned slide provides informational statistics showcasing annual business growth. It includes details about revenues, operating profit as well as net profit. From laying roadmaps to briefing everything in detail, our templates are perfect for you. You can set the stage with your presentation slides. All you have to do is download these easy-to-edit and customizable templates. Comprehensive Guide To Enhance Year Over Year Business Performance Comparison Professional PDF will help you deliver an outstanding performance that everyone would remember and praise you for. Do download this presentation today.
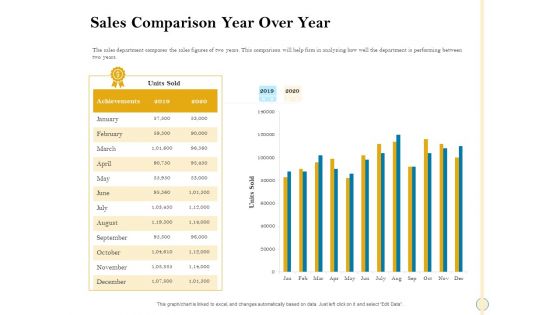
Sales Optimization Best Practices To Close More Deals Sales Comparison Year Over Year Structure PDF
The sales department compares the sales figures of two years. This comparison will help firm in analyzing how well the department is performing between two years. Deliver an awe inspiring pitch with this creative sales optimization best practices to close more deals sales comparison year over year structure pdf bundle. Topics like sales comparison year over year can be discussed with this completely editable template. It is available for immediate download depending on the needs and requirements of the user.
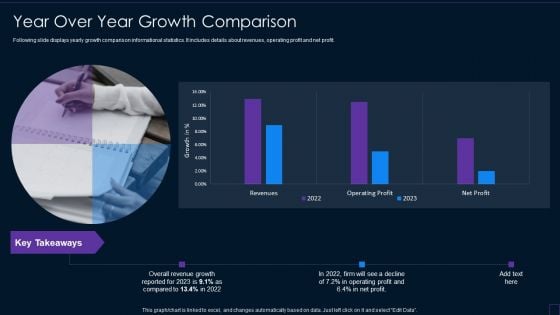
Brand Development Manual Year Over Year Growth Comparison Ideas PDF
Following slide displays yearly growth comparison informational statistics. It includes details about revenues, operating profit and net profit. Deliver and pitch your topic in the best possible manner with this Brand Development Manual Year Over Year Growth Comparison Ideas PDF Use them to share invaluable insights on Year Over Year Growth Comparison and impress your audience. This template can be altered and modified as per your expectations. So, grab it now.
Year Over Year Comparison Of Online Banking Topics PDF
Persuade your audience using this Year Over Year Comparison Of Online Banking Topics PDF. This PPT design covers three stages, thus making it a great tool to use. It also caters to a variety of topics including Year Over Year, Comparison, Online Banking. Download this PPT design now to present a convincing pitch that not only emphasizes the topic but also showcases your presentation skills.
Multinational Firms Year Over Year Revenue Comparison Slides PDF
Presenting Multinational Firms Year Over Year Revenue Comparison Slides PDF to dispense important information. This template comprises three stages. It also presents valuable insights into the topics including Multinational Firms, Year Over Year, Revenue Comparison. This is a completely customizable PowerPoint theme that can be put to use immediately. So, download it and address the topic impactfully.
Year Over Year Comparison Of Global Retail Market Icons PDF
Presenting Year Over Year Comparison Of Global Retail Market Icons PDF to dispense important information. This template comprises three stages. It also presents valuable insights into the topics including Year Over Year, Comparison Global, Retail Market. This is a completely customizable PowerPoint theme that can be put to use immediately. So, download it and address the topic impactfully.
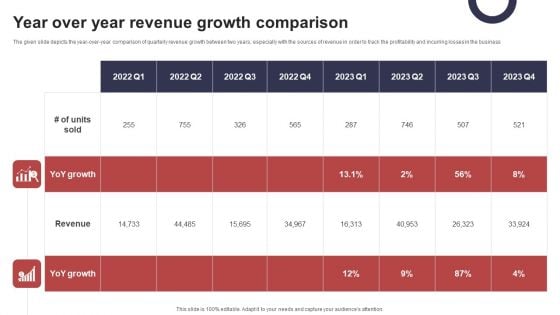
Year Over Year Revenue Growth Comparison Diagrams PDF
The given slide depicts the year over year comparison of quarterly revenue growth between two years, especially with the sources of revenue in order to track the profitability and incurring losses in the business. Showcasing this set of slides titled Year Over Year Revenue Growth Comparison Diagrams PDF. The topics addressed in these templates are Year Over Year, Revenue Growth, Comparison. All the content presented in this PPT design is completely editable. Download it and make adjustments in color, background, font etc. as per your unique business setting.
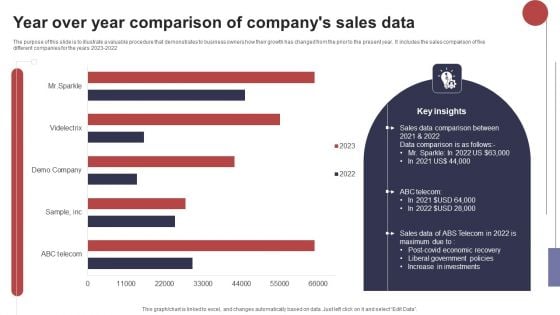
Year Over Year Comparison Of Companys Sales Data Microsoft PDF
The purpose of this slide is to illustrate a valuable procedure that demonstrates to business owners how their growth has changed from the prior to the present year. It includes the sales comparison of five different companies for the years 2023 2022. Pitch your topic with ease and precision using this Year Over Year Comparison Of Companys Sales Data Microsoft PDF. This layout presents information on Sales Data Comparison, Liberal Government, Increase Investments. It is also available for immediate download and adjustment. So, changes can be made in the color, design, graphics or any other component to create a unique layout.
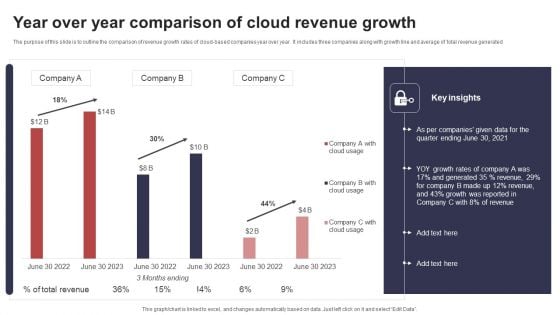
Year Over Year Comparison Of Cloud Revenue Growth Sample PDF
The purpose of this slide is to outline the comparison of revenue growth rates of cloud based companies year over year. It includes three companies along with growth line and average of total revenue generated. Showcasing this set of slides titled Year Over Year Comparison Of Cloud Revenue Growth Sample PDF. The topics addressed in these templates are Yoy Growth Rates, Generated, Growth Reported. All the content presented in this PPT design is completely editable. Download it and make adjustments in color, background, font etc. as per your unique business setting.

Social Media Global Usage Year Over Year Comparison Professional PDF
The purpose of this slide is to showcase the utilization of social media marketing worldwide with an upward trend influenced by technical advancements. The years include 2013 2023 along with the key insights. Showcasing this set of slides titled Social Media Global Usage Year Over Year Comparison Professional PDF. The topics addressed in these templates are Social Media, Technological Advancement, Technical Innovations. All the content presented in this PPT design is completely editable. Download it and make adjustments in color, background, font etc. as per your unique business setting.
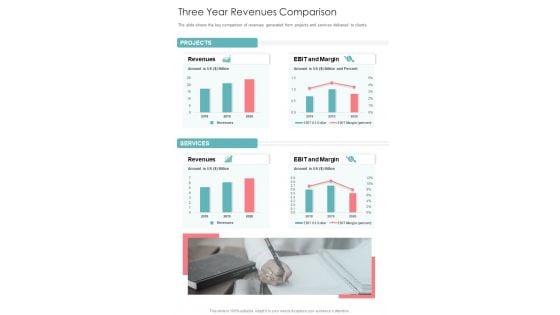
Three Year Revenues Comparison One Pager Documents
The slide shows the key comparison of revenues generated from projects and services delivered to clients. Presenting you a fantastic Three Year Revenues Comparison One Pager Documents. This piece is crafted on hours of research and professional design efforts to ensure you have the best resource. It is completely editable and its design allow you to rehash its elements to suit your needs. Get this Three Year Revenues Comparison One Pager Documents A4 One-pager now.
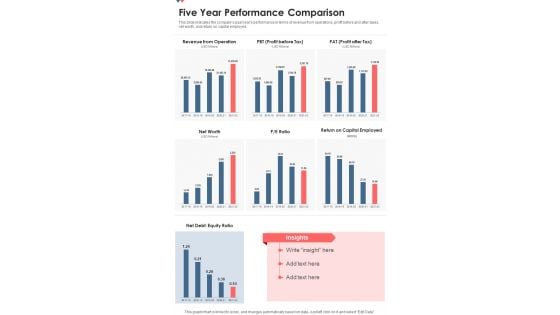
Five Year Performance Comparison One Pager Documents
This slide indicates the companys past years performance in terms of revenue from operations, profit before and after taxes, net worth, and return on capital employed. Presenting you a fantastic Five Year Performance Comparison One Pager Documents. This piece is crafted on hours of research and professional design efforts to ensure you have the best resource. It is completely editable and its design allow you to rehash its elements to suit your needs. Get this Five Year Performance Comparison One Pager Documents A4 One-pager now.
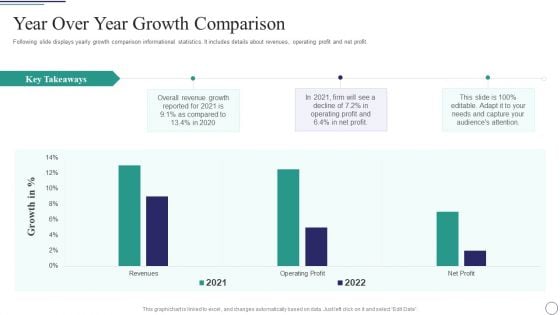
Successful Brand Development Plan Year Over Year Growth Comparison Clipart PDF
Following slide displays yearly growth comparison informational statistics. It includes details about revenues, operating profit and net profit. Deliver and pitch your topic in the best possible manner with this successful brand development plan year over year growth comparison clipart pdf. Use them to share invaluable insights on year over year growth comparison and impress your audience. This template can be altered and modified as per your expectations. So, grab it now.
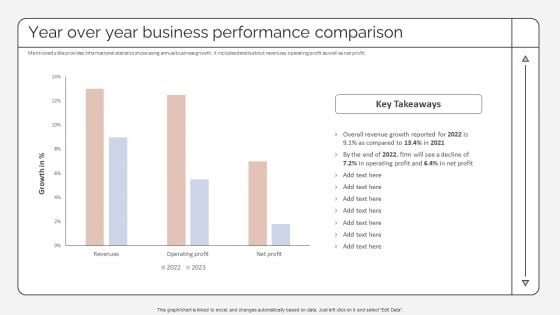
Year Over Year Business Performance Comparison Strategic Promotion Plan Pictures PDF
Mentioned slide provides informational statistics showcasing annual business growth. It includes details about revenues, operating profit as well as net profit. Are you in need of a template that can accommodate all of your creative concepts This one is crafted professionally and can be altered to fit any style. Use it with Google Slides or PowerPoint. Include striking photographs, symbols, depictions, and other visuals. Fill, move around, or remove text boxes as desired. Test out color palettes and font mixtures. Edit and save your work, or work with colleagues. Download Year Over Year Business Performance Comparison Strategic Promotion Plan Pictures PDF and observe how to make your presentation outstanding. Give an impeccable presentation to your group and make your presentation unforgettable.
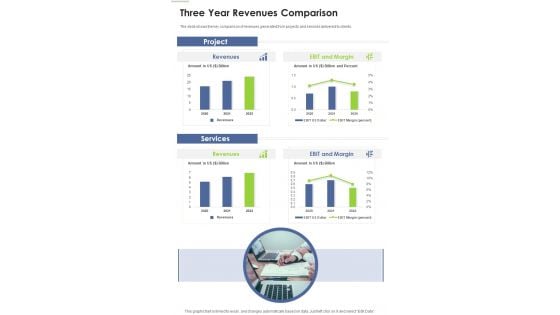
Three Year Revenues Comparison Template 328 One Pager Documents
The slide shows the key comparison of revenues generated from projects and services delivered to clients. Presenting you a fantastic Three Year Revenues Comparison Template 328 One Pager Documents. This piece is crafted on hours of research and professional design efforts to ensure you have the best resource. It is completely editable and its design allow you to rehash its elements to suit your needs. Get this Three Year Revenues Comparison Template 328 One Pager Documents A4 One-pager now.
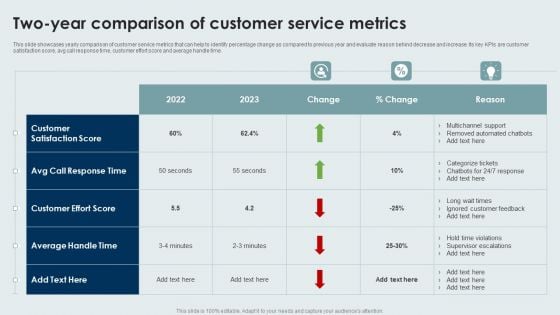
Two Year Comparison Of Customer Service Metrics Information PDF
This slide showcases yearly comparison of customer service metrics that can help to identify percentage change as compared to previous year and evaluate reason behind decrease and increase. Its key KPIs are customer satisfaction score, avg call response time, customer effort score and average handle time. Pitch your topic with ease and precision using this Two Year Comparison Of Customer Service Metrics Information PDF. This layout presents information on Customer Effort Score, Customer Satisfaction Score, Average Handle Time. It is also available for immediate download and adjustment. So, changes can be made in the color, design, graphics or any other component to create a unique layout.
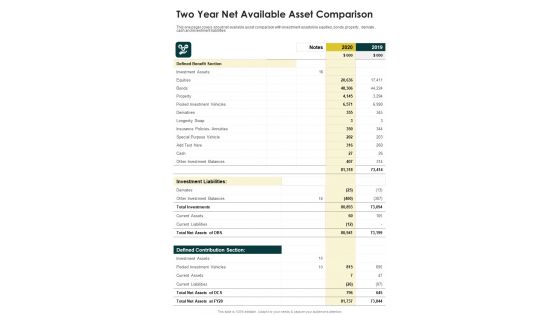
Two Year Net Available Asset Comparison One Pager Documents
This one pager covers about net available asset comparison with investment assets like equities ,bonds, property , derivate , cash and investment liabilities. Presenting you a fantastic Two Year Net Available Asset Comparison One Pager Documents. This piece is crafted on hours of research and professional design efforts to ensure you have the best resource. It is completely editable and its design allow you to rehash its elements to suit your needs. Get this Two Year Net Available Asset Comparison One Pager Documents A4 One-pager now.
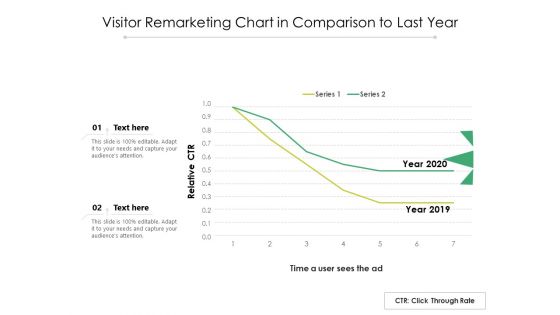
Visitor Remarketing Chart In Comparison To Last Year Ppt PowerPoint Presentation File Themes PDF
Showcasing this set of slides titled visitor remarketing chart in comparison to last year ppt powerpoint presentation file themes pdf. The topics addressed in these templates are visitor remarketing chart in comparison to last year. All the content presented in this PPT design is completely editable. Download it and make adjustments in color, background, font etc. as per your unique business setting.

Introduction To Mobile Money In Developing Countries Five Year Comparison Of Registered Demonstration PDF
This slide shows the information statistics about region wise registered mobile money customers spread during last 5 years. It indicates that customers spread in South Asia recorded highest that is 28.4persent over the last five years.Deliver an awe inspiring pitch with this creative introduction to mobile money in developing countries five year comparison of registered demonstration pdf bundle. Topics like five year comparison of registered mobile money customers spread by region can be discussed with this completely editable template. It is available for immediate download depending on the needs and requirements of the user.
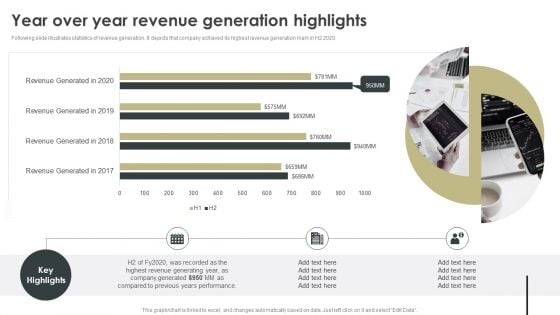
Year Over Year Revenue Generation Highlights Inspiration PDF
Following slide illustrates statistics of revenue generation. It depicts that company achieved its highest revenue generation mark in H2 2020. This Year Over Year Revenue Generation Highlights Inspiration PDF from Slidegeeks makes it easy to present information on your topic with precision. It provides customization options, so you can make changes to the colors, design, graphics, or any other component to create a unique layout. It is also available for immediate download, so you can begin using it right away. Slidegeeks has done good research to ensure that you have everything you need to make your presentation stand out. Make a name out there for a brilliant performance.
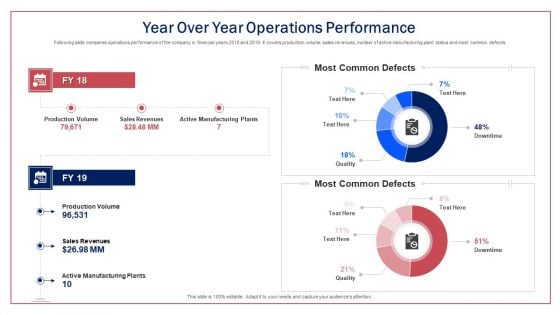
Year Over Year Operations Performance Ppt Infographic Template Shapes PDF
Following slide compares operations performance of the company in financial years 2018 and 2019. It covers production volume, sales revenues, number of active manufacturing plant status and most common defects.Deliver and pitch your topic in the best possible manner with this year over year operations performance ppt infographic template shapes pdf. Use them to share invaluable insights on most common defects, most common defects, active manufacturing plants, production volume and impress your audience. This template can be altered and modified as per your expectations. So, grab it now.

Two Consecutive Years Revenue Comparison Topics PDF
This slide showcases profitability comparison with the help of a trend chart. It represents revenue, cost of goods sold, gross profit, net profit, etc. Pitch your topic with ease and precision using this Two Consecutive Years Revenue Comparison Topics PDF. This layout presents information on Revenue, Gross Profit, Net Income. It is also available for immediate download and adjustment. So, changes can be made in the color, design, graphics or any other component to create a unique layout.
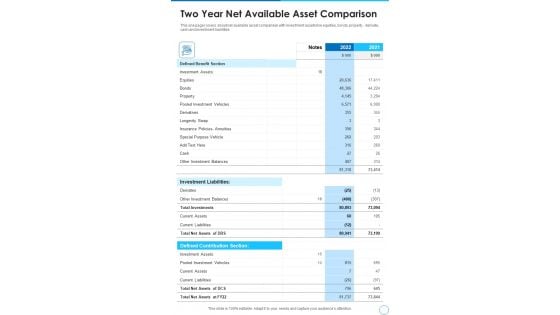
Two Year Net Available Asset Comparison Template 139 One Pager Documents
Presenting you a fantastic Two Year Net Available Asset Comparison Template 139 One Pager Documents. This piece is crafted on hours of research and professional design efforts to ensure you have the best resource. It is completely editable and its design allow you to rehash its elements to suit your needs. Get this Two Year Net Available Asset Comparison Template 139 One Pager Documents A4 One-pager now.
Chart Illustrating Two Year Comparison Of Business Data Icon Ppt Outline Example Topics PDF
Persuade your audience using this Chart Illustrating Two Year Comparison Of Business Data Icon Ppt Outline Example Topics PDF. This PPT design covers three stages, thus making it a great tool to use. It also caters to a variety of topics including chart illustrating two year comparison of business data icon. Download this PPT design now to present a convincing pitch that not only emphasizes the topic but also showcases your presentation skills.
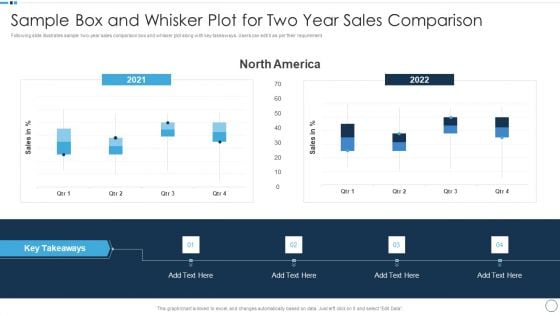
QA Plan Set 1 Sample Box And Whisker Plot For Two Year Sales Comparison Themes PDF
Following slide illustrates sample two year sales comparison box and whisker plot along with key takeaways. Users can edit it as per their requirement. Deliver and pitch your topic in the best possible manner with this QA Plan Set 1 Sample Box And Whisker Plot For Two Year Sales Comparison Themes PDF. Use them to share invaluable insights on Sales Comparison and impress your audience. This template can be altered and modified as per your expectations. So, grab it now.
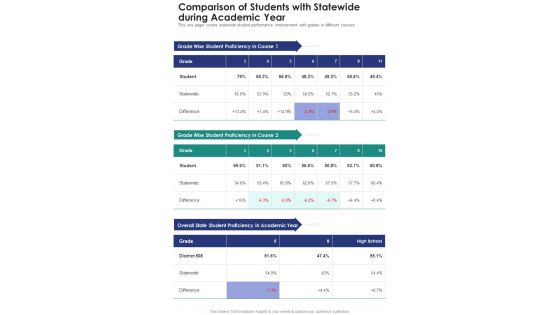
Comparison Of Students With Statewide During Academic Year One Pager Documents
This one pager covers statewide student performance improvement with grades in different courses. Presenting you an exemplary Comparison Of Students With Statewide During Academic Year One Pager Documents. Our one-pager comprises all the must-have essentials of an inclusive document. You can edit it with ease, as its layout is completely editable. With such freedom, you can tweak its design and other elements to your requirements. Download this Comparison Of Students With Statewide During Academic Year One Pager Documents brilliant piece now.
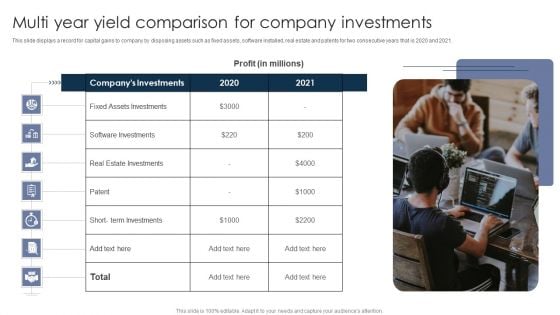
Multi Year Yield Comparison For Company Investments Ppt PowerPoint Presentation Pictures Layouts PDF
This slide displays a record for capital gains to company by disposing assets such as fixed assets, software installed, real estate and patents for two consecutive years that is 2020 and 2021.Presenting Multi Year Yield Comparison For Company Investments Ppt PowerPoint Presentation Pictures Layouts PDF to dispense important information. This template comprises one stage. It also presents valuable insights into the topics including Assets Investments, Estate Investments, Term Investments. This is a completely customizable PowerPoint theme that can be put to use immediately. So, download it and address the topic impactfully.
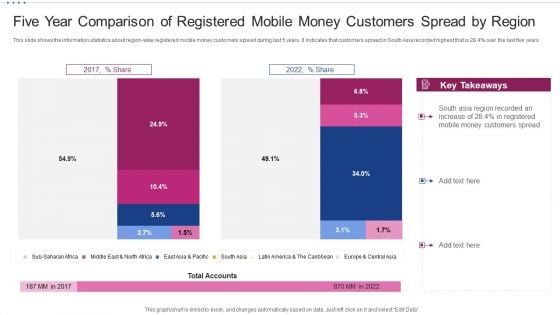
M Banking System Improving Consumer Five Year Comparison Of Registered Mobile Money Topics PDF
This slide shows the information statistics about region-wise registered mobile money customers spread during last 5 years. It indicates that customers spread in South Asia recorded highest that is 28.4 percent over the last five years. This is a m banking system improving consumer five year comparison of registered mobile money topics pdf template with various stages. Focus and dispense information on one stages using this creative set, that comes with editable features. It contains large content boxes to add your information on topics like total accounts, customers spread, mobile money. You can also showcase facts, figures, and other relevant content using this PPT layout. Grab it now.
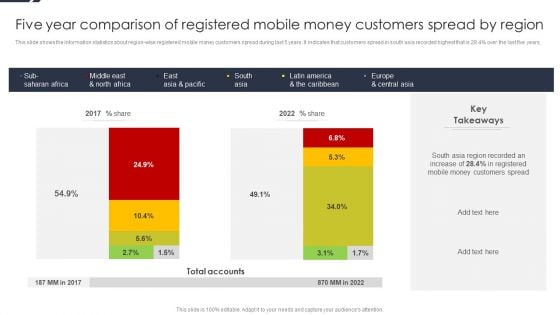
Five Year Comparison Of Registered Mobile Money Customers Spread By Region Introduction PDF
This slide shows the information statistics about region wise registered mobile money customers spread during last 5 years. It indicates that customers spread in south asia recorded highest that is 28.4persent over the last five years.Deliver and pitch your topic in the best possible manner with this Five Year Comparison Of Registered Mobile Money Customers Spread By Region Introduction PDF. Use them to share invaluable insights on Region Recorded, Mobile Money, Customers Spread and impress your audience. This template can be altered and modified as per your expectations. So, grab it now.
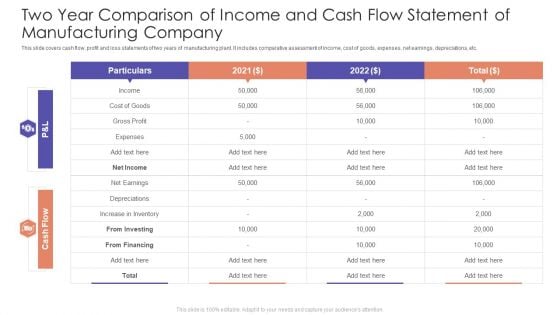
Two Year Comparison Of Income And Cash Flow Statement Of Manufacturing Company Demonstration PDF
This slide covers cash flow, profit and loss statements of two years of manufacturing plant. It includes comparative assessment of income, cost of goods, expenses, net earnings, depreciations, etc. Pitch your topic with ease and precision using this Two Year Comparison Of Income And Cash Flow Statement Of Manufacturing Company Demonstration PDF. This layout presents information on Cost Goods, Income, Cash Flow, Net Income. It is also available for immediate download and adjustment. So, changes can be made in the color, design, graphics or any other component to create a unique layout.
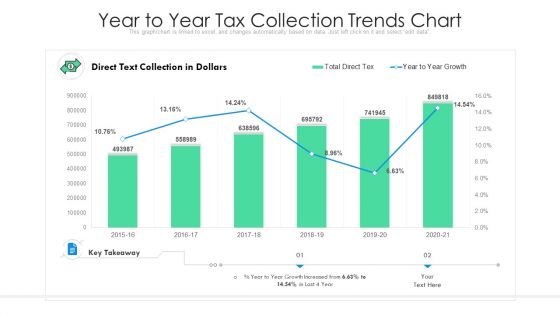
Year To Year Tax Collection Trends Chart Ppt Infographic Template Influencers PDF
Pitch your topic with ease and precision using this year to year tax collection trends chart ppt infographic template influencers pdf. This layout presents information on year to year tax collection trends chart. It is also available for immediate download and adjustment. So, changes can be made in the color, design, graphics or any other component to create a unique layout.

Cross Selling Your Products To Existing Customers Year Over Year Business Success Playbook Information PDF
Purpose of the following slide displays cross selling as a strategy to sell products to existing customers, it include key points such as based on consumer behavior, discounted rate to buy more, Complete product package etc. Presenting this PowerPoint presentation, titled Cross Selling Your Products To Existing Customers Year Over Year Business Success Playbook Information PDF, with topics curated by our researchers after extensive research. This editable presentation is available for immediate download and provides attractive features when used. Download now and captivate your audience. Presenting this Cross Selling Your Products To Existing Customers Year Over Year Business Success Playbook Information PDF. Our researchers have carefully researched and created these slides with all aspects taken into consideration. This is a completely customizable Cross Selling Your Products To Existing Customers Year Over Year Business Success Playbook Information PDF that is available for immediate downloading. Download now and make an impact on your audience. Highlight the attractive features available with our PPTs.
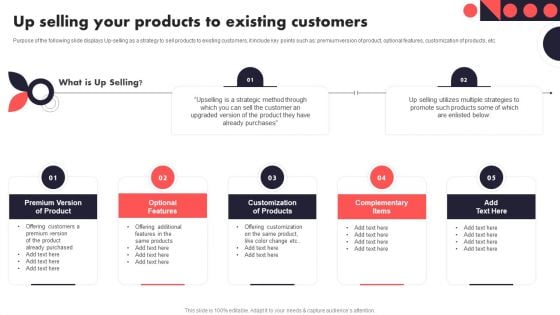
Up Selling Your Products To Existing Customers Year Over Year Business Success Playbook Designs PDF
Purpose of the following slide displays Up-selling as a strategy to sell products to existing customers, it include key points such as premium version of product, optional features, customization of products, etc.This Up Selling Your Products To Existing Customers Year Over Year Business Success Playbook Designs PDF is perfect for any presentation, be it in front of clients or colleagues. It is a versatile and stylish solution for organizing your meetings. The product features a modern design for your presentation meetings. The adjustable and customizable slides provide unlimited possibilities for acing up your presentation. Slidegeeks has done all the homework before launching the product for you. So, don not wait, grab the presentation templates today.
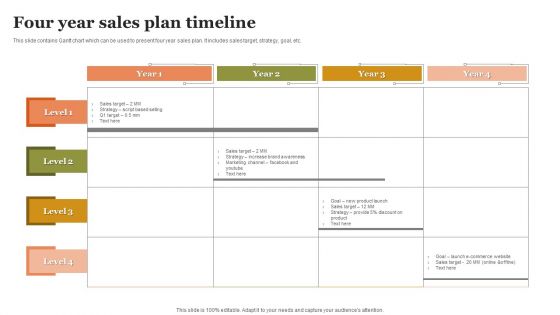
Four Year Sales Plan Timeline Summary PDF
This slide contains Gantt chart which can be used to present four year sales plan. It includes sales target, strategy, goal, etc. Pitch your topic with ease and precision using this Four Year Sales Plan Timeline Summary PDF. This layout presents information on Brand Awareness, Marketing Channel, Sales Target. It is also available for immediate download and adjustment. So, changes can be made in the color, design, graphics or any other component to create a unique layout.
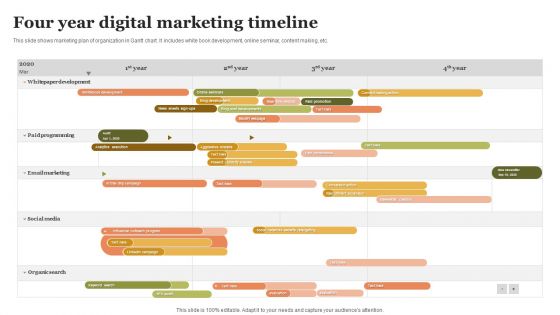
Four Year Digital Marketing Timeline Brochure PDF
Pitch your topic with ease and precision using this Four Year Digital Marketing Timeline Brochure PDF. This layout presents information on Email Marketing, Organic Search, Social Media. It is also available for immediate download and adjustment. So, changes can be made in the color, design, graphics or any other component to create a unique layout.
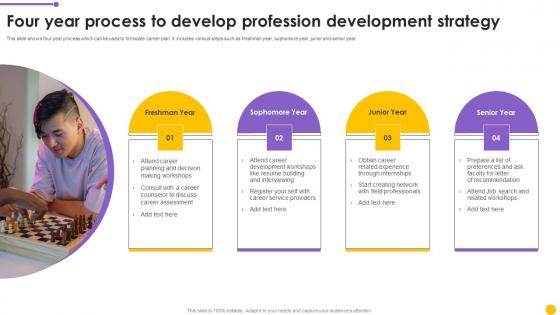
Four Year Process To Develop Profession Development Strategy Graphics Pdf
This slide shows four year process which can be used to formulate career plan. It includes various steps such as freshman year, sophomore year, junior and senior year. Pitch your topic with ease and precision using this Four Year Process To Develop Profession Development Strategy Graphics Pdf. This layout presents information on Freshman Year, Sophomore Year, Junior Year. It is also available for immediate download and adjustment. So, changes can be made in the color, design, graphics or any other component to create a unique layout. This slide shows four year process which can be used to formulate career plan. It includes various steps such as freshman year, sophomore year, junior and senior year.
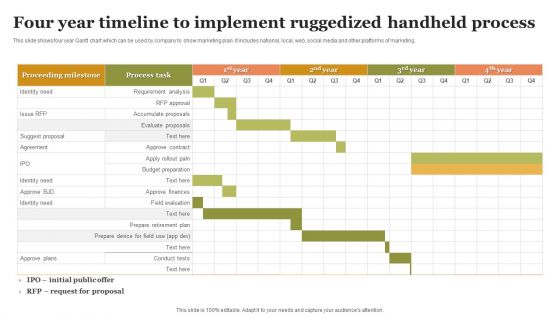
Four Year Timeline To Implement Ruggedized Handheld Process Mockup PDF
This slide shows four year Gantt chart which can be used by company to show marketing plan. It includes national, local, web, social media and other platforms of marketing. Pitch your topic with ease and precision using this Four Year Timeline To Implement Ruggedized Handheld Process Mockup PDF. This layout presents information on Prepare Retirement Plan, Evaluation, Finances. It is also available for immediate download and adjustment. So, changes can be made in the color, design, graphics or any other component to create a unique layout.
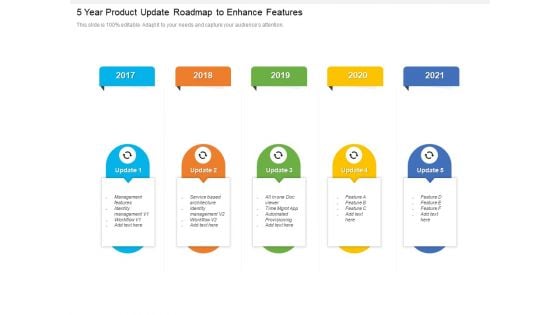
5 Year Product Update Roadmap To Enhance Features Brochure
Presenting the 5 year product update roadmap to enhance features brochure. The template includes a roadmap that can be used to initiate a strategic plan. Not only this, the PowerPoint slideshow is completely editable and you can effortlessly modify the font size, font type, and shapes according to your needs. This PPT slide can be easily reached in standard screen and widescreen aspect ratios. The set is also available in various formats like PDF, PNG, and JPG. So download and use it multiple times as per your knowledge.
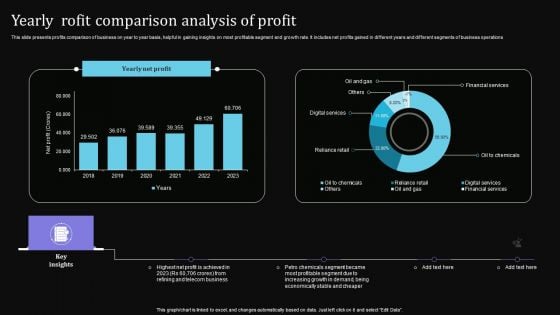
Yearly Rofit Comparison Analysis Of Profit Slides PDF
This slide presents profits comparison of business on year to year basis, helpful in gaining insights on most profitable segment and growth rate. It includes net profits gained in different years and different segments of business operations. Showcasing this set of slides titled Yearly Rofit Comparison Analysis Of Profit Slides PDF. The topics addressed in these templates are Highest Net Profit, Telecom Business, Stable Cheaper. All the content presented in this PPT design is completely editable. Download it and make adjustments in color, background, font etc. as per your unique business setting.
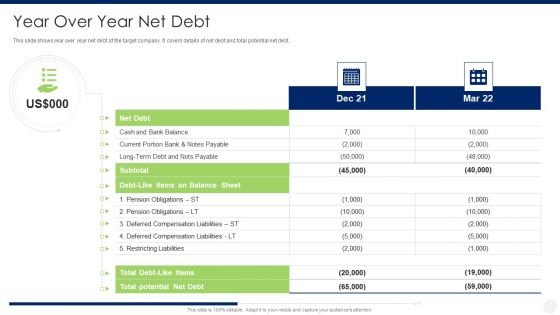
Merger And Acquisition Due Diligence Year Over Year Net Debt Diagrams PDF
This slide shows year over year net debt of the target company. It covers details of net debt and total potential net debt. Deliver and pitch your topic in the best possible manner with this merger and acquisition due diligence year over year net debt diagrams pdf. Use them to share invaluable insights on net debt, compensation liabilities, potential net debt, notes payable and impress your audience. This template can be altered and modified as per your expectations. So, grab it now.
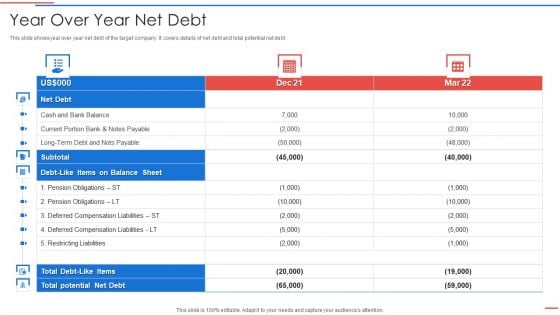
Due Diligence Process In Merger And Acquisition Agreement Year Over Year Net Debt Elements PDF
This slide shows year over year net debt of the target company. It covers details of net debt and total potential net debt.Deliver and pitch your topic in the best possible manner with this due diligence process in merger and acquisition agreement year over year net debt elements pdf Use them to share invaluable insights on current portion, deferred compensation, pension obligations and impress your audience. This template can be altered and modified as per your expectations. So, grab it now.
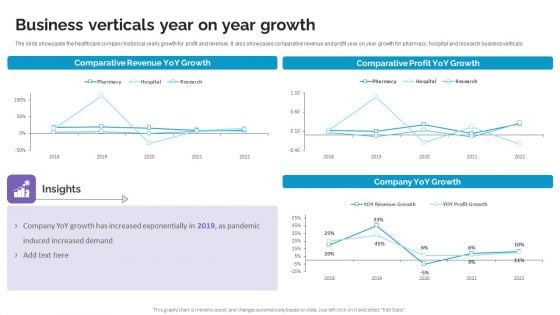
Business Verticals Year On Year Growth Life Science And Healthcare Solutions Company Profile Brochure PDF
The slide showcases the healthcare company historical yearly growth for profit and revenue. It also showcases comparative revenue and profit year on year growth for pharmacy, hospital and research business verticals. Formulating a presentation can take up a lot of effort and time, so the content and message should always be the primary focus. The visuals of the PowerPoint can enhance the presenters message, so our Business Verticals Year On Year Growth Life Science And Healthcare Solutions Company Profile Brochure PDF was created to help save time. Instead of worrying about the design, the presenter can concentrate on the message while our designers work on creating the ideal templates for whatever situation is needed. Slidegeeks has experts for everything from amazing designs to valuable content, we have put everything into Business Verticals Year On Year Growth Life Science And Healthcare Solutions Company Profile Brochure PDF
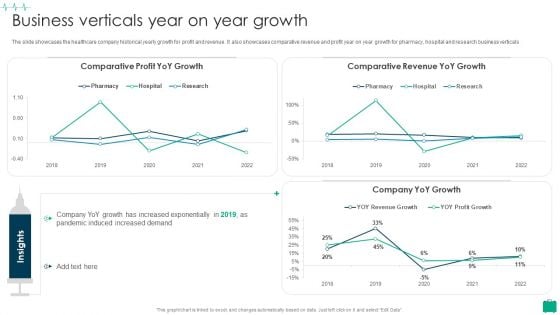
Healthcare Services Company Profile Business Verticals Year On Year Growth Summary PDF
The slide showcases the healthcare company historical yearly growth for profit and revenue. It also showcases comparative revenue and profit year on year growth for pharmacy, hospital and research business verticals.Deliver and pitch your topic in the best possible manner with this Healthcare Services Company Profile Business Verticals Year On Year Growth Summary PDF Use them to share invaluable insights on Comparative Profit, Comparative Revenue, Increased Exponentially and impress your audience. This template can be altered and modified as per your expectations. So, grab it now.
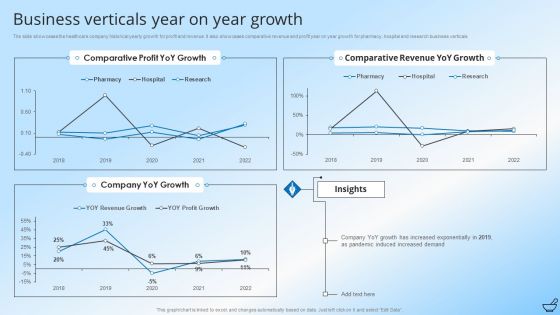
Pharmaceutical And Clinical Research Summary Business Verticals Year On Year Growth Ideas PDF
The slide showcases the healthcare company historical yearly growth for profit and revenue. It also showcases comparative revenue and profit year on year growth for pharmacy, hospital and research business verticals. Deliver and pitch your topic in the best possible manner with this Pharmaceutical And Clinical Research Summary Business Verticals Year On Year Growth Ideas PDF. Use them to share invaluable insights on Comparative Profit, Growth and impress your audience. This template can be altered and modified as per your expectations. So, grab it now.
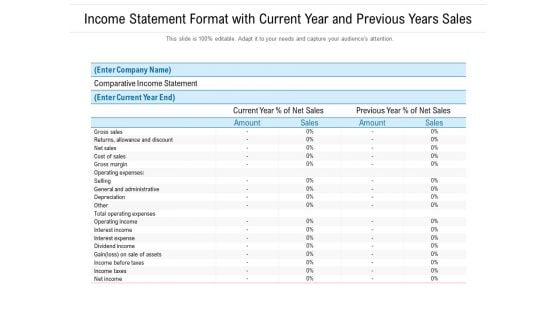
Income Statement Format With Current Year And Previous Years Sales Ppt PowerPoint Presentation Gallery Summary PDF
Pitch your topic with ease and precision using this income statement format with current year and previous years sales ppt powerpoint presentation gallery summary pdf. This layout presents information on expenses, sales, cost. It is also available for immediate download and adjustment. So, changes can be made in the color, design, graphics or any other component to create a unique layout.
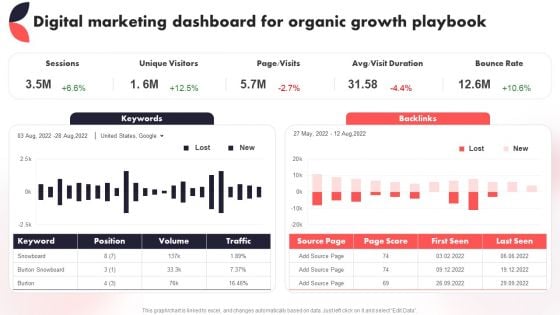
Digital Marketing Dashboard For Organic Growth Playbook Year Over Year Business Success Playbook Themes PDF
This Digital Marketing Dashboard For Organic Growth Playbook Year Over Year Business Success Playbook Themes PDF from Slidegeeks makes it easy to present information on your topic with precision. It provides customization options, so you can make changes to the colors, design, graphics, or any other component to create a unique layout. It is also available for immediate download, so you can begin using it right away. Slidegeeks has done good research to ensure that you have everything you need to make your presentation stand out. Make a name out there for a brilliant performance.
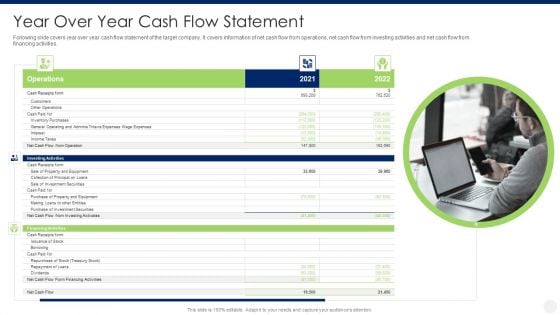
Merger And Acquisition Due Diligence Year Over Year Cash Flow Statement Rules PDF
Following slide covers year over year cash flow statement of the target company. It covers information of net cash flow from operations, net cash flow from investing activities and net cash flow from financing activities. This is a merger and acquisition due diligence year over year cash flow statement rules pdf template with various stages. Focus and dispense information on three stages using this creative set, that comes with editable features. It contains large content boxes to add your information on topics like operations, investing activities, financing activities. You can also showcase facts, figures, and other relevant content using this PPT layout. Grab it now.
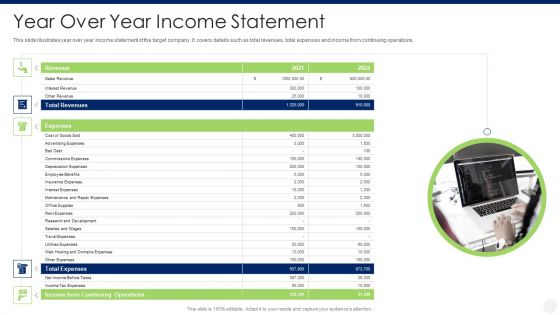
Merger And Acquisition Due Diligence Year Over Year Income Statement Themes PDF
This slide illustrates year over year income statement of the target company. It covers details such as total revenues, total expenses and income from continuing operations. This is a merger and acquisition due diligence year over year income statement themes pdf template with various stages. Focus and dispense information on five stages using this creative set, that comes with editable features. It contains large content boxes to add your information on topics like total revenues, total expenses, income from continuing operations. You can also showcase facts, figures, and other relevant content using this PPT layout. Grab it now.
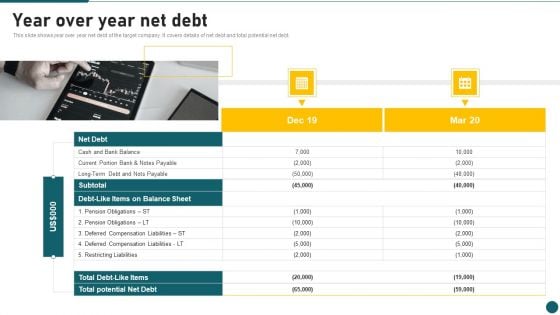
Due Diligence In Amalgamation And Acquisition Year Over Year Net Debt Information PDF
This slide shows year over year net debt of the target company. It covers details of net debt and total potential net debt. This is a Due Diligence In Amalgamation And Acquisition Year Over Year Net Debt Information PDF template with various stages. Focus and dispense information on two stages using this creative set, that comes with editable features. It contains large content boxes to add your information on topics like Potential Net Debt, Restricting Liabilities, Nots Payable. You can also showcase facts, figures, and other relevant content using this PPT layout. Grab it now.
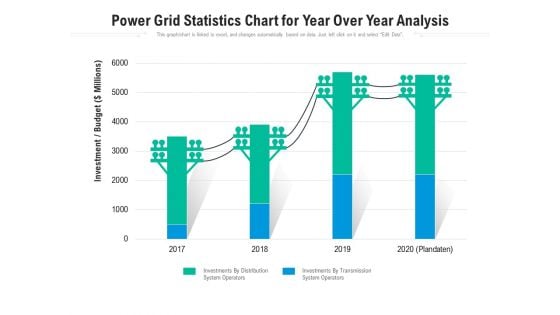
Power Grid Statistics Chart For Year Over Year Analysis Ppt PowerPoint Presentation Show Model PDF
Pitch your topic with ease and precision using this power grid statistics chart for year over year analysis ppt powerpoint presentation show model pdf. This layout presents information on investments by distribution system operators, investments by transmission system operators, 2017 to 2020. It is also available for immediate download and adjustment. So, changes can be made in the color, design, graphics or any other component to create a unique layout.
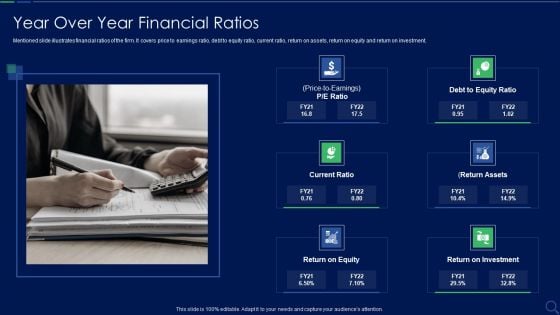
Audit Checklist For Mergers And Acquisitions Year Over Year Financial Ratios Microsoft PDF
Mentioned slide illustrates financial ratios of the firm. It covers price to earnings ratio, debt to equity ratio, current ratio, return on assets, return on equity and return on investment. This is a audit checklist for mergers and acquisitions year over year financial ratios microsoft pdf template with various stages. Focus and dispense information on six stages using this creative set, that comes with editable features. It contains large content boxes to add your information on topics like debt to equity ratio, return assets, current ratio, return on equity, return on investment. You can also showcase facts, figures, and other relevant content using this PPT layout. Grab it now.
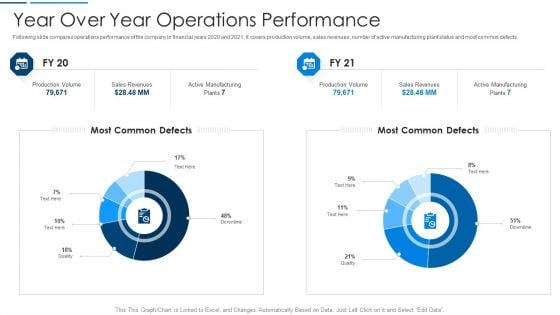
Information Technology Transformation Organization Year Over Year Operations Performance Professional PDF
Following slide compares operations performance of the company in financial years 2020 and 2021. It covers production volume, sales revenues, number of active manufacturing plant status and most common defects. Deliver and pitch your topic in the best possible manner with this information technology transformation organization year over year operations performance professional pdf. Use them to share invaluable insights on sales revenues, manufacturing, production volume and impress your audience. This template can be altered and modified as per your expectations. So, grab it now.

Due Diligence Process In Merger And Acquisition Agreement Year Over Year Financial Ratios Ideas PDF
Mentioned slide illustrates financial ratios of the firm. It covers price to earnings ratio, debt to equity ratio, current ratio, return on assets, return on equity and return on investment.This is a due diligence process in merger and acquisition agreement year over year financial ratios ideas pdf template with various stages. Focus and dispense information on six stages using this creative set, that comes with editable features. It contains large content boxes to add your information on topics like return on assets, return on equity, return on investment You can also showcase facts, figures, and other relevant content using this PPT layout. Grab it now.
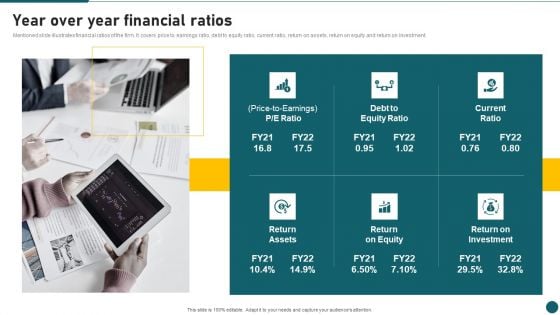
Due Diligence In Amalgamation And Acquisition Year Over Year Financial Ratios Template PDF
Mentioned slide illustrates financial ratios of the firm. It covers price to earnings ratio, debt to equity ratio, current ratio, return on assets, return on equity and return on investment. This is a Due Diligence In Amalgamation And Acquisition Year Over Year Financial Ratios Template PDF template with various stages. Focus and dispense information on six stages using this creative set, that comes with editable features. It contains large content boxes to add your information on topics like Equity Ratio, Current Ratio, Return On Investment. You can also showcase facts, figures, and other relevant content using this PPT layout. Grab it now.
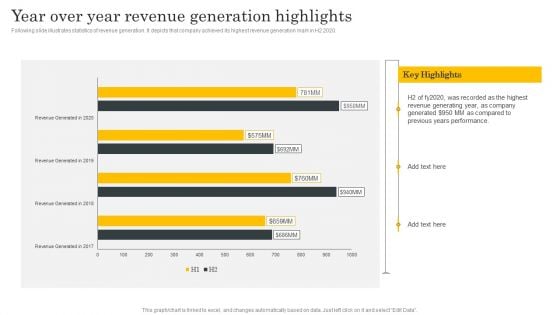
Financial Evaluation Report Year Over Year Revenue Generation Highlights Designs PDF
Following slide illustrates statistics of revenue generation. It depicts that company achieved its highest revenue generation mark in H2 2020. Are you searching for a Financial Evaluation Report Year Over Year Revenue Generation Highlights Designs PDF that is uncluttered, straightforward, and original Its easy to edit, and you can change the colors to suit your personal or business branding. For a presentation that expresses how much effort youve put in, this template is ideal With all of its features, including tables, diagrams, statistics, and lists, its perfect for a business plan presentation. Make your ideas more appealing with these professional slides. Download Financial Evaluation Report Year Over Year Revenue Generation Highlights Designs PDF from Slidegeeks today.
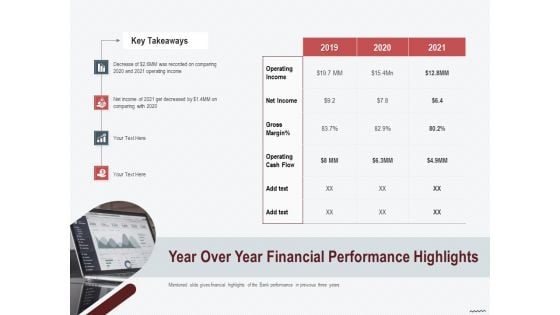
Cross Sell In Banking Industry Year Over Year Financial Performance Highlights Ppt Ideas Styles PDF
This is a cross sell in banking industry year over year financial performance highlights ppt ideas styles pdf template with various stages. Focus and dispense information on four stages using this creative set, that comes with editable features. It contains large content boxes to add your information on topics like operating income, net income, gross margin, operating cash flow. You can also showcase facts, figures, and other relevant content using this PPT layout. Grab it now.
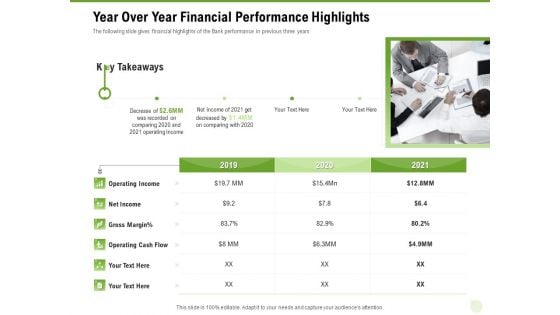
Cross Selling Of Retail Banking Products Year Over Year Financial Performance Highlights Ppt Styles Gallery PDF
This is a cross selling of retail banking products year over year financial performance highlights ppt styles gallery pdf template with various stages. Focus and dispense information on six stages using this creative set, that comes with editable features. It contains large content boxes to add your information on topics like operating income, net income, gross margin, operating cash flow. You can also showcase facts, figures, and other relevant content using this PPT layout. Grab it now.


 Continue with Email

 Home
Home


