Year To Year Comparison
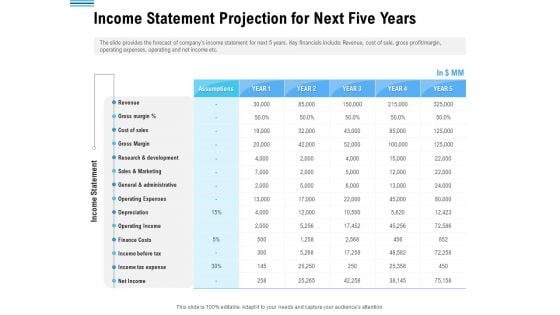
Pitch Deck To Collect Funding From Initial Financing Income Statement Projection For Next Five Years Themes PDF
The slide provides the forecast of companys income statement for next 5 years. Key financials include Revenue, cost of sale, gross profit or margin, operating expenses, operating and net income etc. Deliver an awe inspiring pitch with this creative pitch deck to collect funding from initial financing income statement projection for next five years themes pdf bundle. Topics like revenue, cost, sales, marketing, finance can be discussed with this completely editable template. It is available for immediate download depending on the needs and requirements of the user.
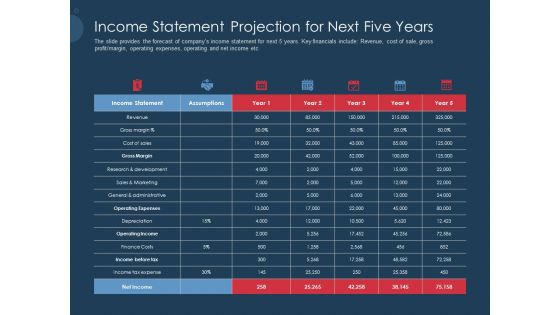
Pitch Deck To Gather Funding From Initial Capital Income Statement Projection For Next Five Years Infographics PDF
The slide provides the forecast of companys income statement for next 5 years. Key financials include Revenue, cost of sale, gross profit or margin, operating expenses, operating and net income etc. Deliver an awe inspiring pitch with this creative pitch deck to gather funding from initial capital income statement projection for next five years infographics pdf bundle. Topics like revenue, cost, sales, marketing, finance can be discussed with this completely editable template. It is available for immediate download depending on the needs and requirements of the user.
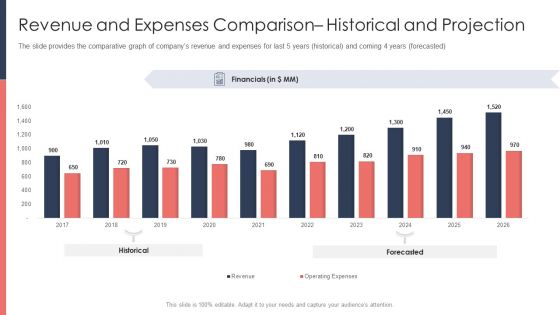
Pitch Deck For Fundraising From Post Market Financing Revenue And Expenses Comparison Historical And Projection Designs PDF
The slide provides the comparative graph of companys revenue and expenses for last 5 years historical and coming 4 years forecastedDeliver and pitch your topic in the best possible manner with this pitch deck for fundraising from post market financing revenue and expenses comparison historical and projection designs pdf. Use them to share invaluable insights on historical, forecasted, financials and impress your audience. This template can be altered and modified as per your expectations. So, grab it now.
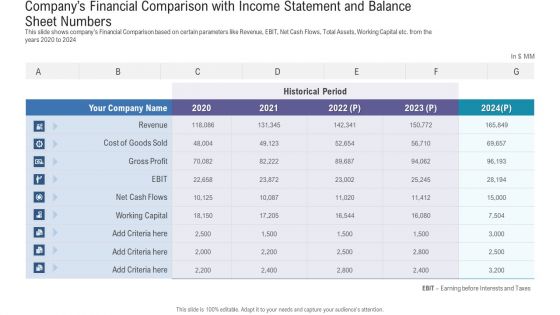
Pitch Deck For Fundraising From Angel Investors Companys Financial Comparison With Income Statement And Balance Sheet Numbers Guidelines PDF
This slide shows companys Financial Comparison based on certain parameters like Revenue, EBIT, Net Cash Flows, Total Assets, Working Capital etc. from the years 2020 to 2024. Deliver and pitch your topic in the best possible manner with this pitch deck for fundraising from angel investors companys financial comparison with income statement and balance sheet numbers guidelines pdf. Use them to share invaluable insights on revenue, gross profit, net cash flows, working capital, historical period and impress your audience. This template can be altered and modified as per your expectations. So, grab it now.
Pitch Deck For Fund Raising From Series C Funding Companys Financial Comparison With Revenue And Total Assets Icons PDF
This slide shows companys Financial Comparison based on certain parameters like Revenue, EBIT, Net Cash Flows, Total Assets, Working Capital etc. from the years 2017 to 2024. Deliver an awe inspiring pitch with this creative pitch deck for fund raising from series c funding companys financial comparison with revenue and total assets icons pdf bundle. Topics like revenue, gross profit, working capital, cost, criteria can be discussed with this completely editable template. It is available for immediate download depending on the needs and requirements of the user.
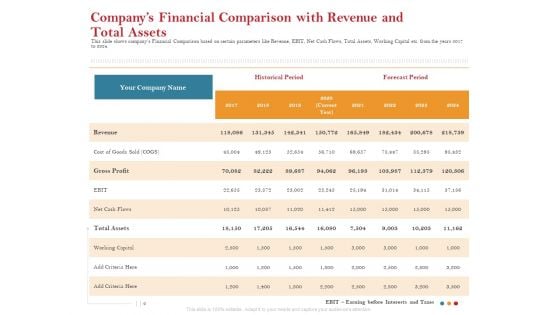
Pitch Deck For Raising Capital For Inorganic Growth Companys Financial Comparison With Revenue And Total Assets Structure PDF
This slide shows companys Financial Comparison based on certain parameters like Revenue, EBIT, Net Cash Flows, Total Assets, Working Capital etc. from the years 2017 to 2024. Deliver an awe inspiring pitch with this creative pitch deck for raising capital for inorganic growth companys financial comparison with revenue and total assets structure pdf bundle. Topics like revenue, gross profit, working capital, cost, criteria can be discussed with this completely editable template. It is available for immediate download depending on the needs and requirements of the user.
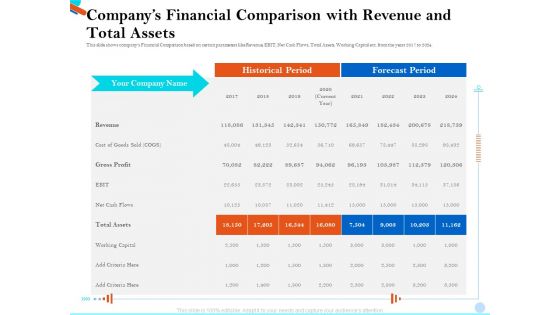
Pitch Presentation Raising Series C Funds Investment Companys Financial Comparison With Revenue And Total Assets Ideas PDF
This slide shows companys Financial Comparison based on certain parameters like Revenue, EBIT, Net Cash Flows, Total Assets, Working Capital etc. from the years 2017 to 2024. Deliver an awe inspiring pitch with this creative pitch presentation raising series c funds investment companys financial comparison with revenue and total assets ideas pdf bundle. Topics like revenue, cost, gross profit, working capital, criteria can be discussed with this completely editable template. It is available for immediate download depending on the needs and requirements of the user.
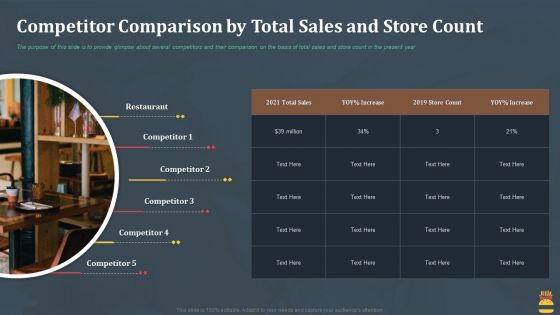
Startup Pitch Deck For Fast Food Restaurant Competitor Comparison By Total Sales And Store Count Summary PDF
The purpose of this slide is to provide glimpse about several competitors and their comparison on the basis of total sales and store count in the present year. Deliver an awe inspiring pitch with this creative startup pitch deck for fast food restaurant competitor comparison by total sales and store count summary pdf bundle. Topics like competitor comparison by total sales and store count can be discussed with this completely editable template. It is available for immediate download depending on the needs and requirements of the user.
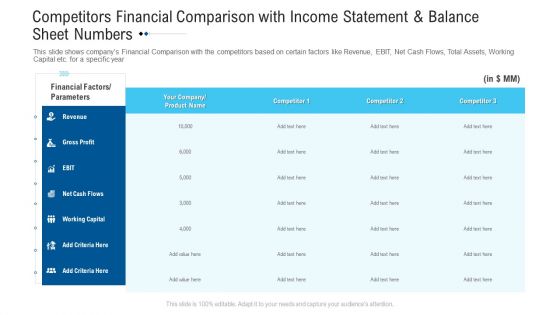
Funding Deck Raise Grant Funds Public Organizations Competitors Financial Comparison With Income Statement And Balance Sheet Numbers Infographics PDF
This slide shows companys Financial Comparison with the competitors based on certain factors like Revenue, EBIT, Net Cash Flows, Total Assets, Working Capital etc. for a specific year. Deliver and pitch your topic in the best possible manner with this funding deck raise grant funds public organizations competitors financial comparison with income statement and balance sheet numbers infographics pdf. Use them to share invaluable insights on financial factors parameters, competitor, revenue, net cash flows, gross profit and impress your audience. This template can be altered and modified as per your expectations. So, grab it now.
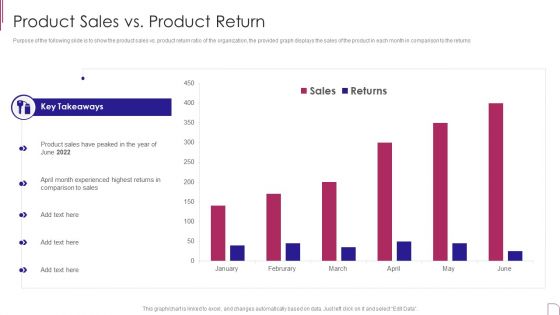
Yearly Product Performance Assessment Repor Product Sales Vs Product Return Information PDF
Purpose of the following slide is to show the product sales vs. product return ratio of the organization, the provided graph displays the sales of the product in each month in comparison to the returns.Deliver an awe inspiring pitch with this creative Yearly Product Performance Assessment Repor Product Sales Vs Product Return Information PDF bundle. Topics like Key Takeaways, Experienced Highest, Comparison Sales can be discussed with this completely editable template. It is available for immediate download depending on the needs and requirements of the user.
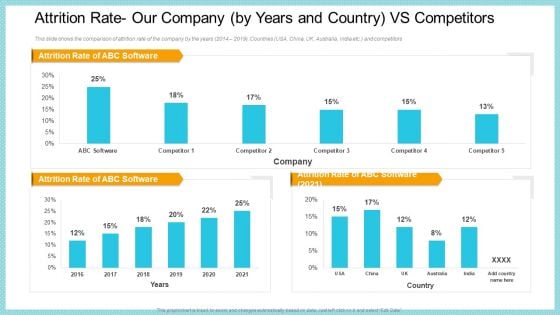
Attrition Rate Our Company By Years And Country VS Competitors Elements PDF
This slide shows the comparison of attrition rate of the company by the years 2014 to 2019, Countries USA, China, UK, Australia, India etc. and competitors. Deliver an awe inspiring pitch with this creative attrition rate our company by years and country vs competitors elements pdf bundle. Topics like attrition rate our company by years and country vs competitors can be discussed with this completely editable template. It is available for immediate download depending on the needs and requirements of the user.
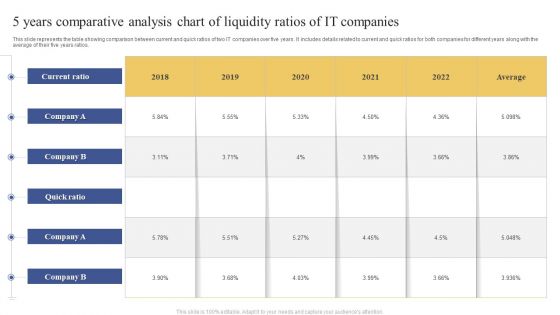
5 Years Comparative Analysis Chart Of Liquidity Ratios Of IT Companies Ppt Portfolio Visual Aids PDF
This slide represents the table showing comparison between current and quick ratios of two IT companies over five years. It includes details related to current and quick ratios for both companies for different years along with the average of their five years ratios. Pitch your topic with ease and precision using this 5 Years Comparative Analysis Chart Of Liquidity Ratios Of IT Companies Ppt Portfolio Visual Aids PDF. This layout presents information on Current Ratio, Average, 2018 To 2022. It is also available for immediate download and adjustment. So, changes can be made in the color, design, graphics or any other component to create a unique layout.
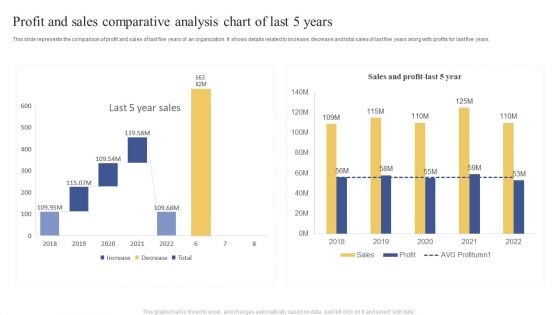
Profit And Sales Comparative Analysis Chart Of Last 5 Years Ppt Visual Aids Example 2015 PDF
This slide represents the comparison of profit and sales of last five years of an organization. It shows details related to increase, decrease and total sales of last five years along with profits for last five years. Showcasing this set of slides titled Profit And Sales Comparative Analysis Chart Of Last 5 Years Ppt Visual Aids Example 2015 PDF. The topics addressed in these templates are Last 5 Year, Sales, 2018 To 2022. All the content presented in this PPT design is completely editable. Download it and make adjustments in color, background, font etc. as per your unique business setting.
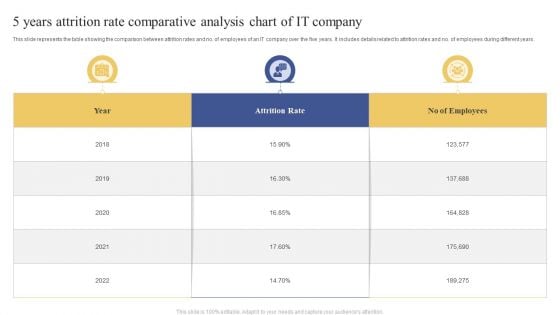
5 Years Attrition Rate Comparative Analysis Chart Of IT Company Ppt Layouts Examples PDF
This slide represents the table showing the comparison between attrition rates and no. of employees of an IT company over the five years. It includes details related to attrition rates and no. of employees during different years. Showcasing this set of slides titled 5 Years Attrition Rate Comparative Analysis Chart Of IT Company Ppt Layouts Examples PDF. The topics addressed in these templates are Attrition Rate, No Employees, 2018 To 2022. All the content presented in this PPT design is completely editable. Download it and make adjustments in color, background, font etc. as per your unique business setting.
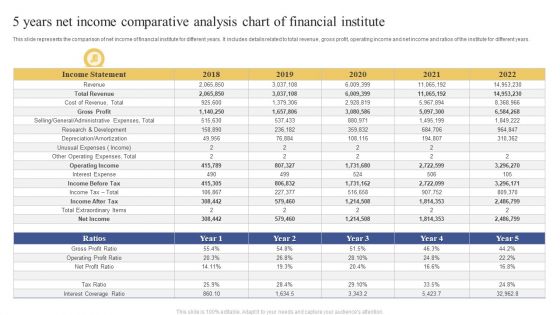
5 Years Net Income Comparative Analysis Chart Of Financial Institute Ppt Show Designs PDF
This slide represents the comparison of net income of financial institute for different years. It includes details related to total revenue, gross profit, operating income and net income and ratios of the institute for different years. Showcasing this set of slides titled 5 Years Net Income Comparative Analysis Chart Of Financial Institute Ppt Show Designs PDF. The topics addressed in these templates are Income Statement, 2018 To 2022, Ratios. All the content presented in this PPT design is completely editable. Download it and make adjustments in color, background, font etc. as per your unique business setting.
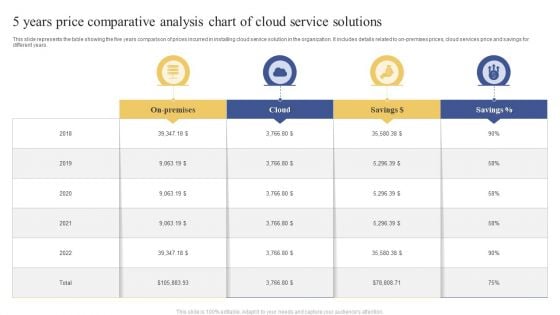
5 Years Price Comparative Analysis Chart Of Cloud Service Solutions Brochure PDF
This slide represents the table showing the five years comparison of prices incurred in installing cloud service solution in the organization. It includes details related to on-premises prices, cloud services price and savings for different years. Showcasing this set of slides titled 5 Years Price Comparative Analysis Chart Of Cloud Service Solutions Brochure PDF. The topics addressed in these templates are Cloud, Savings, 2018 To 2022. All the content presented in this PPT design is completely editable. Download it and make adjustments in color, background, font etc. as per your unique business setting.
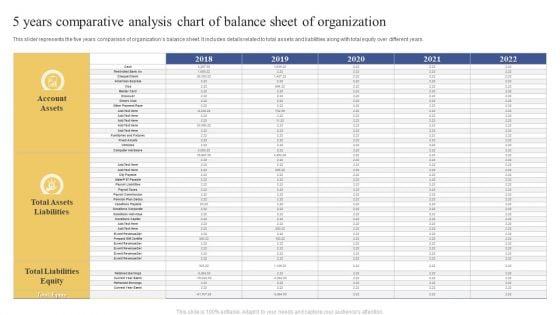
5 Years Comparative Analysis Chart Of Balance Sheet Of Organization Ppt Inspiration Slide PDF
This slider represents the five years comparison of organizations balance sheet. It includes details related to total assets and liabilities along with total equity over different years. Pitch your topic with ease and precision using this 5 Years Comparative Analysis Chart Of Balance Sheet Of Organization Ppt Inspiration Slide PDF. This layout presents information on Account Assets, Total Assets Liabilities, Total Liabilities Equity. It is also available for immediate download and adjustment. So, changes can be made in the color, design, graphics or any other component to create a unique layout.
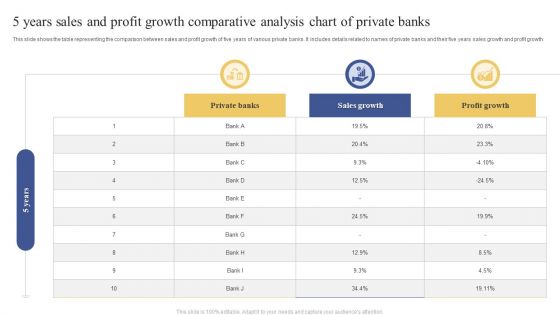
5 Years Sales And Profit Growth Comparative Analysis Chart Of Private Banks Infographics PDF
This slide shows the table representing the comparison between sales and profit growth of five years of various private banks. It includes details related to names of private banks and their five years sales growth and profit growth. Pitch your topic with ease and precision using this 5 Years Sales And Profit Growth Comparative Analysis Chart Of Private Banks Infographics PDF. This layout presents information on Private Banks, Sales Growth, Profit Growth. It is also available for immediate download and adjustment. So, changes can be made in the color, design, graphics or any other component to create a unique layout.
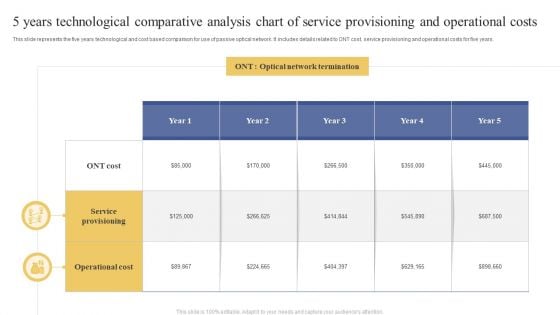
5 Years Technological Comparative Analysis Chart Of Service Provisioning And Operational Costs Information PDF
This slide represents the five years technological and cost based comparison for use of passive optical network. It includes details related to ONT cost, service provisioning and operational costs for five years. Pitch your topic with ease and precision using this 5 Years Technological Comparative Analysis Chart Of Service Provisioning And Operational Costs Information PDF. This layout presents information on Optical Network Termination, Service Provisioning, Operational Cost. It is also available for immediate download and adjustment. So, changes can be made in the color, design, graphics or any other component to create a unique layout.
5 Years Profit And Loss Comparative Analysis Chart Of Enterprise Ppt Icon Graphics PDF
This slide represents the comparison of profit and loss of an organization for the five years. It includes details related to profit and loss from various accounts such as order fees, concession income, facility rental etc. Pitch your topic with ease and precision using this 5 Years Profit And Loss Comparative Analysis Chart Of Enterprise Ppt Icon Graphics PDF. This layout presents information on Account, 2018 To 2022, Exchange Fees. It is also available for immediate download and adjustment. So, changes can be made in the color, design, graphics or any other component to create a unique layout.
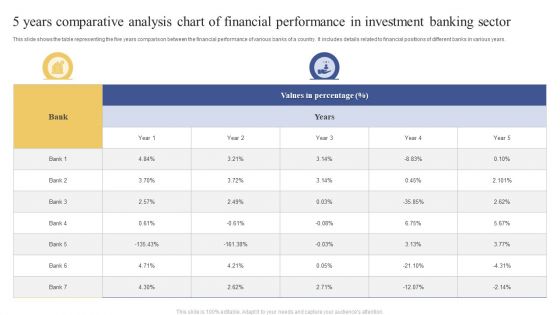
5 Years Comparative Analysis Chart Of Financial Performance In Investment Banking Sector Themes PDF
This slide shows the table representing the five years comparison between the financial performance of various banks of a country. It includes details related to financial positions of different banks in various years. Showcasing this set of slides titled 5 Years Comparative Analysis Chart Of Financial Performance In Investment Banking Sector Themes PDF. The topics addressed in these templates are Values Percentage, Bank, Year. All the content presented in this PPT design is completely editable. Download it and make adjustments in color, background, font etc. as per your unique business setting.
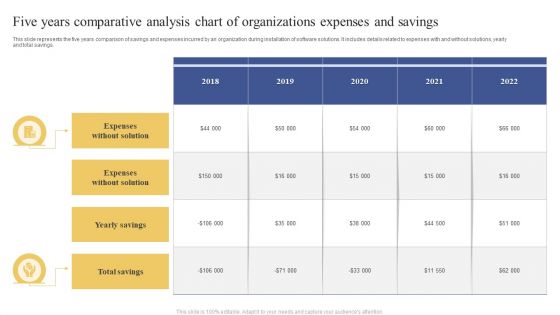
Five Years Comparative Analysis Chart Of Organizations Expenses And Savings Topics PDF
This slide represents the five years comparison of savings and expenses incurred by an organization during installation of software solutions. It includes details related to expenses with and without solutions, yearly and total savings. Showcasing this set of slides titled Five Years Comparative Analysis Chart Of Organizations Expenses And Savings Topics PDF. The topics addressed in these templates are Expenses Without Solution, Yearly Savings, Total Savings. All the content presented in this PPT design is completely editable. Download it and make adjustments in color, background, font etc. as per your unique business setting.
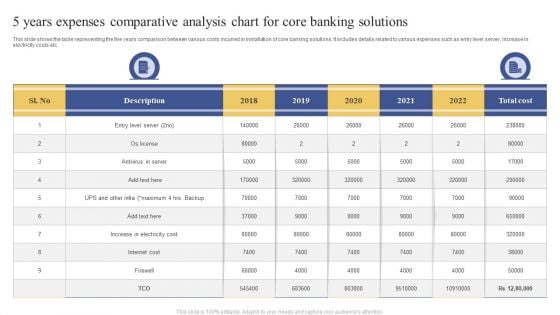
5 Years Expenses Comparative Analysis Chart For Core Banking Solutions Ppt Portfolio Clipart Images PDF
This slide shows the table representing the five years comparison between various costs incurred in installation of core banking solutions. It includes details related to various expenses such as entry level server, increase in electricity costs etc. Pitch your topic with ease and precision using this 5 Years Expenses Comparative Analysis Chart For Core Banking Solutions Ppt Portfolio Clipart Images PDF. This layout presents information on Entry Level Server, Antivirus Server, Increase Electricity Cost. It is also available for immediate download and adjustment. So, changes can be made in the color, design, graphics or any other component to create a unique layout.
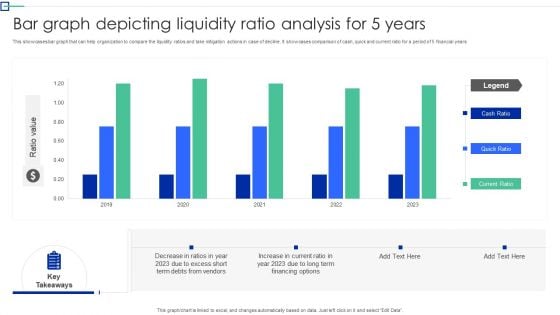
Bar Graph Depicting Liquidity Ratio Analysis For 5 Years Graphics PDF
This showcases bar graph that can help organization to compare the liquidity ratios and take mitigation actions in case of decline. It showcases comparison of cash, quick and current ratio for a period of 5 financial years. Showcasing this set of slides titled Bar Graph Depicting Liquidity Ratio Analysis For 5 Years Graphics PDF. The topics addressed in these templates are Organization To Compare, The Liquidity Ratios, Mitigation Action Decline. All the content presented in this PPT design is completely editable. Download it and make adjustments in color, background, font etc. as per your unique business setting.
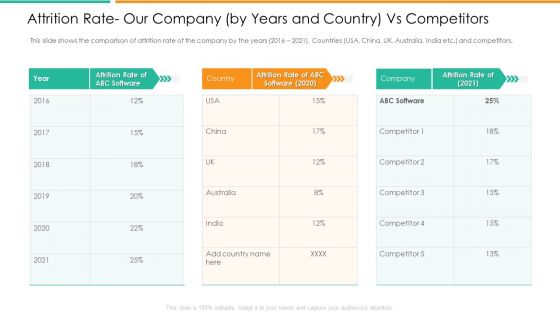
Attrition Rate Our Company By Years And Country Vs Competitors Background PDF
This slide shows the comparison of attrition rate of the company by the years 2016 2021, Countries USA, China, UK, Australia, India etc. and competitors. Deliver and pitch your topic in the best possible manner with this attrition rate our company by years and country vs competitors background pdf. Use them to share invaluable insights on attrition rate our company by years and country vs competitors and impress your audience. This template can be altered and modified as per your expectations. So, grab it now.
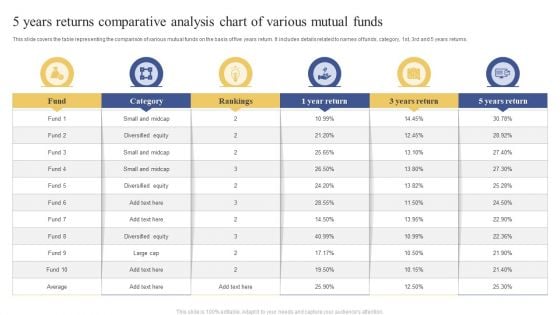
5 Years Returns Comparative Analysis Chart Of Various Mutual Funds Ppt Slides Microsoft PDF
This slide covers the table representing the comparison of various mutual funds on the basis of five years return. It includes details related to names of funds, category, 1st, 3rd and 5 years returns. Showcasing this set of slides titled 5 Years Returns Comparative Analysis Chart Of Various Mutual Funds Ppt Slides Microsoft PDF. The topics addressed in these templates are Diversified Equity, Small And Midcap, Diversified Equity. All the content presented in this PPT design is completely editable. Download it and make adjustments in color, background, font etc. as per your unique business setting.
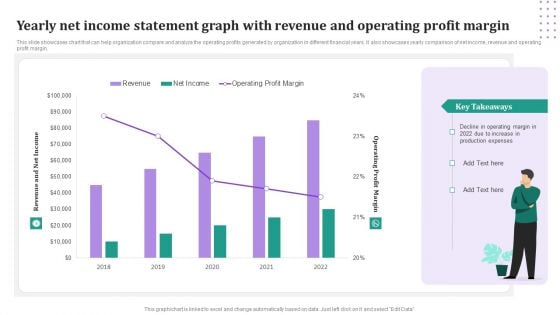
Yearly Net Income Statement Graph With Revenue And Operating Profit Margin Download PDF
This slide showcases chart that can help organization compare and analyze the operating profits generated by organization in different financial years. It also showcases yearly comparison of net income, revenue and operating profit margin. Pitch your topic with ease and precision using this Yearly Net Income Statement Graph With Revenue And Operating Profit Margin Download PDF. This layout presents information on Revenue, Net Income, Operating Profit Margin. It is also available for immediate download and adjustment. So, changes can be made in the color, design, graphics or any other component to create a unique layout.
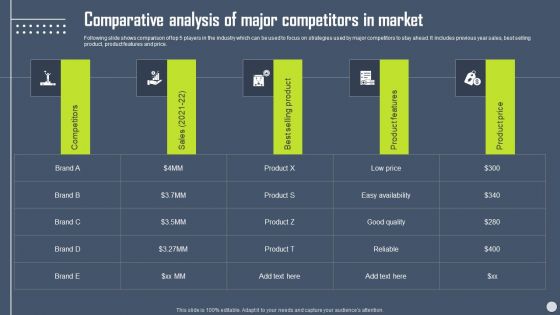
Boosting Yearly Business Revenue Comparative Analysis Of Major Competitors In Market Infographics PDF
Following slide shows comparison of top 5 players in the industry which can be used to focus on strategies used by major competitors to stay ahead. It includes previous year sales, best selling product, product features and price. If you are looking for a format to display your unique thoughts, then the professionally designed Boosting Yearly Business Revenue Comparative Analysis Of Major Competitors In Market Infographics PDF is the one for you. You can use it as a Google Slides template or a PowerPoint template. Incorporate impressive visuals, symbols, images, and other charts. Modify or reorganize the text boxes as you desire. Experiment with shade schemes and font pairings. Alter, share or cooperate with other people on your work. Download Boosting Yearly Business Revenue Comparative Analysis Of Major Competitors In Market Infographics PDF and find out how to give a successful presentation. Present a perfect display to your team and make your presentation unforgettable.
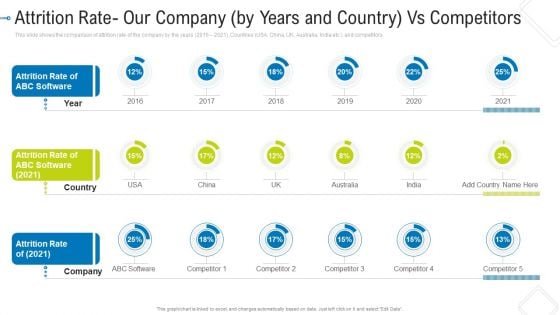
Attrition Rate Our Company By Years And Country Vs Competitors Introduction PDF
This slide shows the comparison of attrition rate of the company by the years 2016 to 2021, Countries USA, China, UK, Australia, India etc. and competitors Deliver an awe inspiring pitch with this creative attrition rate our company by years and country vs competitors introduction pdf bundle. Topics like attrition rate of abc software, attrition rate of abc software 2021, attrition rate of 2021 can be discussed with this completely editable template. It is available for immediate download depending on the needs and requirements of the user.
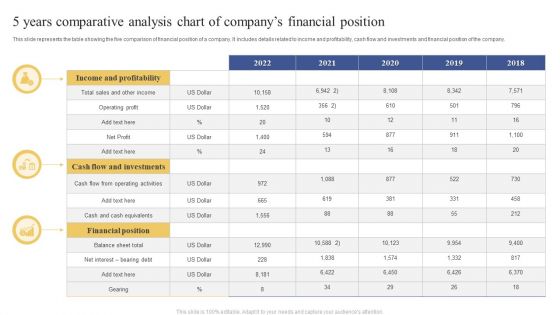
5 Years Comparative Analysis Chart Of Companys Financial Position Ppt Layouts Structure PDF
This slide represents the table showing the five comparison of financial position of a company. It includes details related to income and profitability, cash flow and investments and financial position of the company. Showcasing this set of slides titled 5 Years Comparative Analysis Chart Of Companys Financial Position Ppt Layouts Structure PDF. The topics addressed in these templates are Income And Profitability, Financial Position, Balance Sheet Total. All the content presented in this PPT design is completely editable. Download it and make adjustments in color, background, font etc. as per your unique business setting.
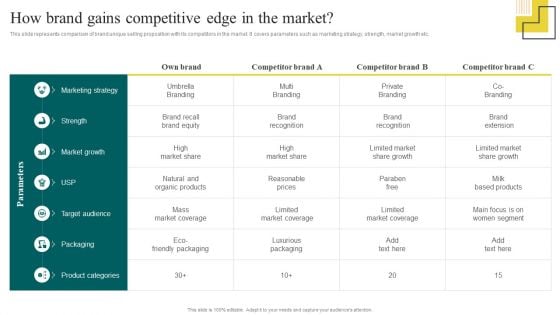
Yearly Brand Promotion Plan How Brand Gains Competitive Edge In The Market Designs PDF
This slide represents comparison of brand unique selling proposition with its competitors in the market. It covers parameters such as marketing strategy, strength, market growth etc. Present like a pro with Yearly Brand Promotion Plan How Brand Gains Competitive Edge In The Market Designs PDF Create beautiful presentations together with your team, using our easy-to-use presentation slides. Share your ideas in real-time and make changes on the fly by downloading our templates. So whether youre in the office, on the go, or in a remote location, you can stay in sync with your team and present your ideas with confidence. With Slidegeeks presentation got a whole lot easier. Grab these presentations today.
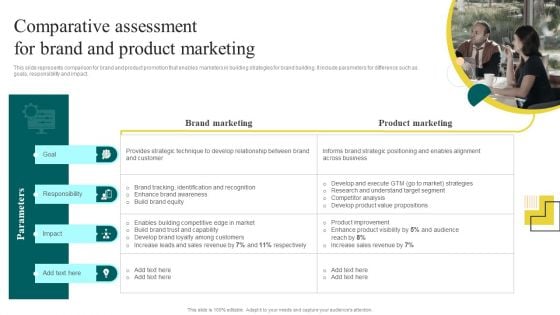
Yearly Brand Promotion Plan Comparative Assessment For Brand And Product Marketing Pictures PDF
This slide represents comparison for brand and product promotion that enables marketers in building strategies for brand building. It include parameters for difference such as goals, responsibility and impact. Crafting an eye-catching presentation has never been more straightforward. Let your presentation shine with this tasteful yet straightforward Yearly Brand Promotion Plan Comparative Assessment For Brand And Product Marketing Pictures PDF template. It offers a minimalistic and classy look that is great for making a statement. The colors have been employed intelligently to add a bit of playfulness while still remaining professional. Construct the ideal Yearly Brand Promotion Plan Comparative Assessment For Brand And Product Marketing Pictures PDF that effortlessly grabs the attention of your audience. Begin now and be certain to wow your customers.
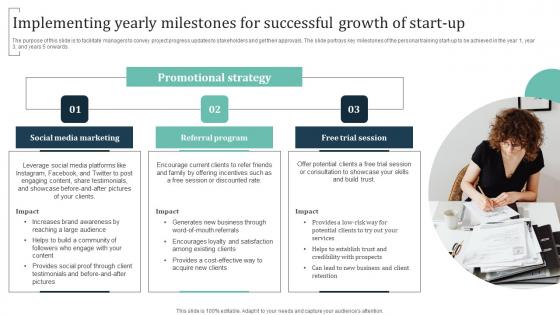
Implementing Yearly Milestones For Successful Growth Group Training Business Slides Pdf
The purpose of this slide is to facilitate managers to convey project progress updates to stakeholders and get their approvals. The slide portrays key milestones of the personal training start-up to be achieved in the year 1, year 3, and years 5 onwards. This Implementing Yearly Milestones For Successful Growth Group Training Business Slides Pdf from Slidegeeks makes it easy to present information on your topic with precision. It provides customization options, so you can make changes to the colors, design, graphics, or any other component to create a unique layout. It is also available for immediate download, so you can begin using it right away. Slidegeeks has done good research to ensure that you have everything you need to make your presentation stand out. Make a name out there for a brilliant performance. The purpose of this slide is to facilitate managers to convey project progress updates to stakeholders and get their approvals. The slide portrays key milestones of the personal training start-up to be achieved in the year 1, year 3, and years 5 onwards.
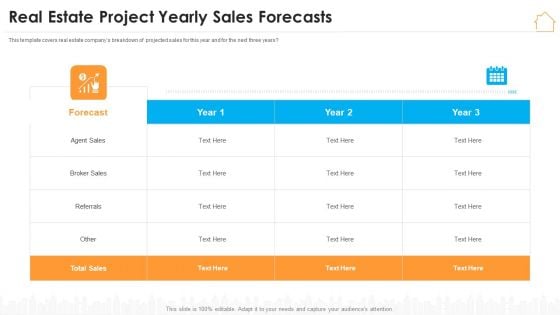
Real Estate Marketing Strategy Vendors Real Estate Project Yearly Sales Forecasts Structure PDF
This template covers real estate companys breakdown of projected sales for this year and for the next three years. Deliver and pitch your topic in the best possible manner with this real estate marketing strategy vendors real estate project yearly sales forecasts structure pdf. Use them to share invaluable insights on real estate project yearly sales forecasts and impress your audience. This template can be altered and modified as per your expectations. So, grab it now.
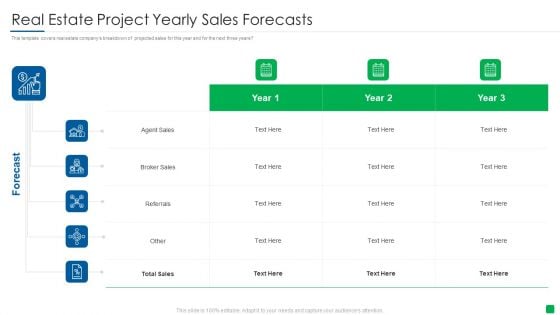
Marketing Strategy For Real Estate Property Real Estate Project Yearly Sales Forecasts Designs PDF
This template covers real estate companys breakdown of projected sales for this year and for the next three years. Deliver and pitch your topic in the best possible manner with this marketing strategy for real estate property real estate project yearly sales forecasts designs pdf. Use them to share invaluable insights on real estate project yearly sales forecasts and impress your audience. This template can be altered and modified as per your expectations. So, grab it now.
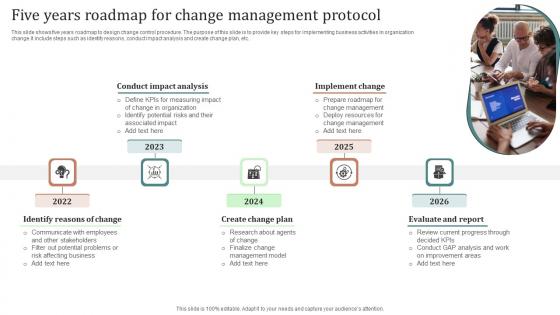
Five Years Roadmap For Change Management Protocol Ppt File Skills Pdf
This slide shows five years roadmap to design change control procedure. The purpose of this slide is to provide key steps for implementing business activities in organization change.It include steps such as identify reasons, conduct impact analysis and create change plan, etc. Pitch your topic with ease and precision using this Five Years Roadmap For Change Management Protocol Ppt File Skills Pdf. This layout presents information on Conduct Impact Analysis, Implement Change, Create Change Plan. It is also available for immediate download and adjustment. So, changes can be made in the color, design, graphics or any other component to create a unique layout. This slide shows five years roadmap to design change control procedure. The purpose of this slide is to provide key steps for implementing business activities in organization change.It include steps such as identify reasons, conduct impact analysis and create change plan, etc.
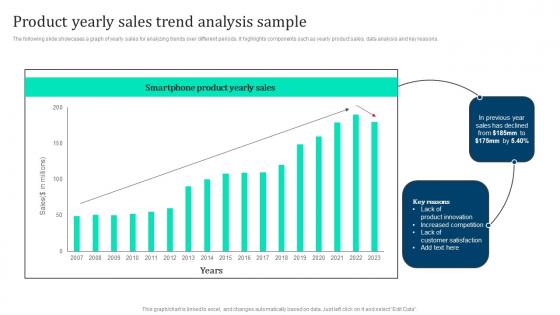
Product Yearly Sales Trend Analysis Marketing Intelligence Guide Data Gathering Introduction Pdf
The following slide showcases a graph of yearly sales for analyzing trends over different periods. It highlights components such as yearly product sales, data analysis and key reasons. Create an editable Product Yearly Sales Trend Analysis Marketing Intelligence Guide Data Gathering Introduction Pdf that communicates your idea and engages your audience. Whether you are presenting a business or an educational presentation, pre designed presentation templates help save time. Product Yearly Sales Trend Analysis Marketing Intelligence Guide Data Gathering Introduction Pdf is highly customizable and very easy to edit, covering many different styles from creative to business presentations. Slidegeeks has creative team members who have crafted amazing templates. So, go and get them without any delay. The following slide showcases a graph of yearly sales for analyzing trends over different periods. It highlights components such as yearly product sales, data analysis and key reasons.
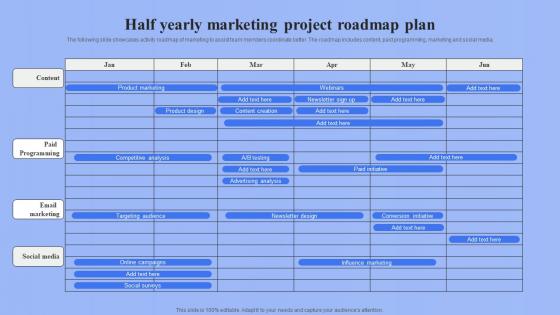
Half Yearly Marketing Project Roadmap Plan Ppt Slides Background Designs pdf
The following slide showcases activity roadmap of marketing to assist team members coordinate better. The roadmap includes content, paid programming, marketing and social media. Pitch your topic with ease and precision using this Half Yearly Marketing Project Roadmap Plan Ppt Slides Background Designs pdf. This layout presents information on Content, Paid Programming, Marketing. It is also available for immediate download and adjustment. So, changes can be made in the color, design, graphics or any other component to create a unique layout. The following slide showcases activity roadmap of marketing to assist team members coordinate better. The roadmap includes content, paid programming, marketing and social media.
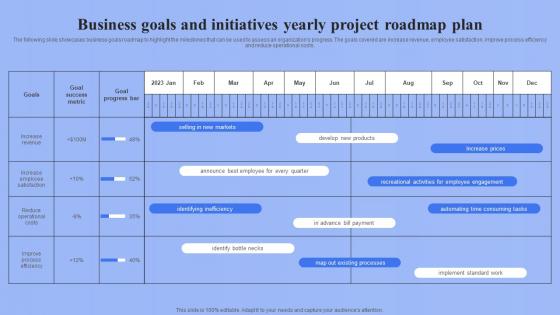
Business Goals And Initiatives Yearly Project Roadmap Plan Ppt Slides Infographics pdf
The following slide showcases business goals roadmap to highlight the milestones that can be used to assess an organizations progress. The goals covered are increase revenue, employee satisfaction, improve process efficiency and reduce operational costs. Pitch your topic with ease and precision using this Business Goals And Initiatives Yearly Project Roadmap Plan Ppt Slides Infographics pdf. This layout presents information on Employee Satisfaction, Improve Process, Efficiency And Reduce. It is also available for immediate download and adjustment. So, changes can be made in the color, design, graphics or any other component to create a unique layout. The following slide showcases business goals roadmap to highlight the milestones that can be used to assess an organizations progress. The goals covered are increase revenue, employee satisfaction, improve process efficiency and reduce operational costs.
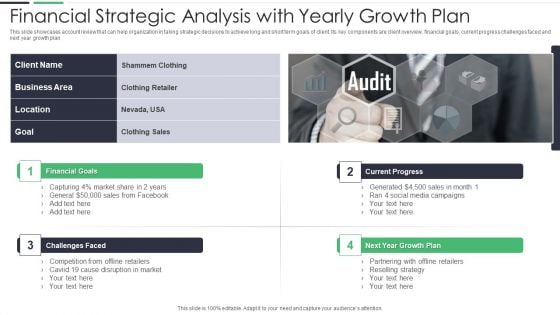
Financial Strategic Analysis With Yearly Growth Plan Ppt PowerPoint Presentation Gallery Rules PDF
This slide showcases account review that can help organization in taking strategic decisions to achieve long and short term goals of client. Its key components are client overview, financial goals, current progress challenges faced and next year growth plan. Presenting financial strategic analysis with yearly growth plan ppt powerpoint presentation gallery rules pdf to dispense important information. This template comprises four stages. It also presents valuable insights into the topics including current progress, next year growth plan, financial goals, challenges faced. This is a completely customizable PowerPoint theme that can be put to use immediately. So, download it and address the topic impactfully.
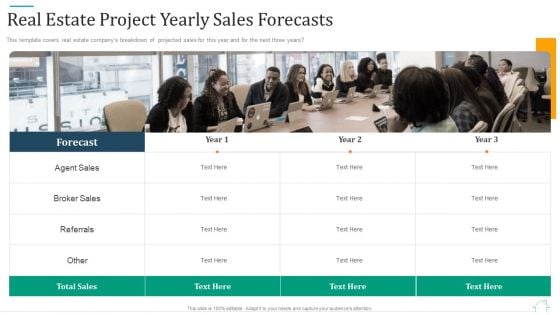
Promotional Strategy For Real Estate Project Real Estate Project Yearly Sales Forecasts Guidelines PDF
This template covers real estate companys breakdown of projected sales for this year and for the next three years. This is a promotional strategy for real estate project real estate project yearly sales forecasts guidelines pdf template with various stages. Focus and dispense information on one stages using this creative set, that comes with editable features. It contains large content boxes to add your information on topics like real estate project yearly sales forecasts. You can also showcase facts, figures, and other relevant content using this PPT layout. Grab it now.
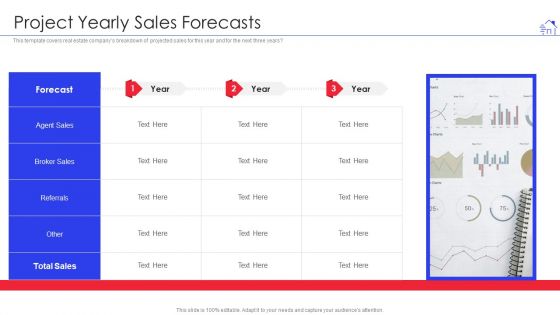
Promotional Strategies For Property Development Firm Project Yearly Sales Forecasts Mockup PDF
This template covers real estate companys breakdown of projected sales for this year and for the next three years. sThis is a promotional strategies for property development firm project yearly sales forecasts mockup pdf template with various stages. Focus and dispense information on one stages using this creative set, that comes with editable features. It contains large content boxes to add your information on topics like project yearly sales forecasts. You can also showcase facts, figures, and other relevant content using this PPT layout. Grab it now.
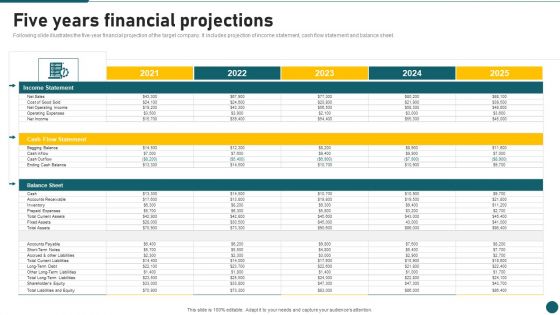
Due Diligence In Amalgamation And Acquisition Five Years Financial Projections Portrait PDF
Following slide illustrates the five year financial projection of the target company. It includes projection of income statement, cash flow statement and balance sheet. Deliver and pitch your topic in the best possible manner with this Due Diligence In Amalgamation And Acquisition Five Years Financial Projections Portrait PDF. Use them to share invaluable insights on Income Statement, Cash Flow Statement, Income Statement and impress your audience. This template can be altered and modified as per your expectations. So, grab it now.
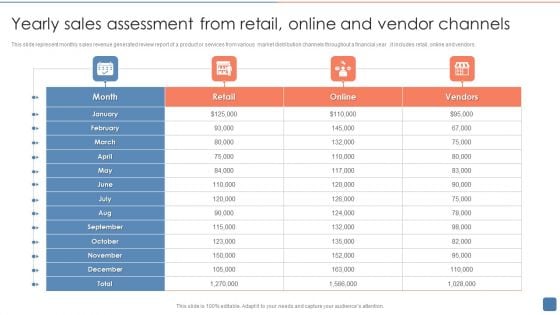
Yearly Sales Assessment From Retail Online And Vendor Channels Summary PDF
This slide represent monthly sales revenue generated review report of a product or services from various market distribution channels throughout a financial year .it includes retail, online and vendors. Pitch your topic with ease and precision using this Yearly Sales Assessment From Retail Online And Vendor Channels Summary PDF. This layout presents information on Retail, Yearly Sales Assessment, Online And Vendor Channels. It is also available for immediate download and adjustment. So, changes can be made in the color, design, graphics or any other component to create a unique layout.
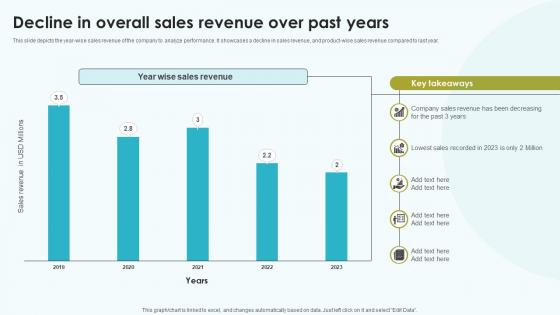
Elevating Sales Networks Decline In Overall Sales Revenue Over Past Years SA SS V
This slide depicts the year-wise sales revenue of the company to analyze performance. It showcases a decline in sales revenue, and product-wise sales revenue compared to last year. Slidegeeks is here to make your presentations a breeze with Elevating Sales Networks Decline In Overall Sales Revenue Over Past Years SA SS V With our easy-to-use and customizable templates, you can focus on delivering your ideas rather than worrying about formatting. With a variety of designs to choose from, you are sure to find one that suits your needs. And with animations and unique photos, illustrations, and fonts, you can make your presentation pop. So whether you are giving a sales pitch or presenting to the board, make sure to check out Slidegeeks first This slide depicts the year-wise sales revenue of the company to analyze performance. It showcases a decline in sales revenue, and product-wise sales revenue compared to last year.
5 Years Employee Performance Comparative Analysis Chart Icon Ppt Portfolio Objects PDF
Presenting 5 Years Employee Performance Comparative Analysis Chart Icon Ppt Portfolio Objects PDF to dispense important information. This template comprises three stages. It also presents valuable insights into the topics including 5 Years, Employee Performance, Comparative Analysis, Chart Icon. This is a completely customizable PowerPoint theme that can be put to use immediately. So, download it and address the topic impactfully.
5 Years Revenue Comparative Analysis Chart Icon Ppt Inspiration Diagrams PDF
Presenting 5 Years Revenue Comparative Analysis Chart Icon Ppt Inspiration Diagrams PDF to dispense important information. This template comprises three stages. It also presents valuable insights into the topics including 5 Years, Revenue Comparative, Analysis Chart, Icon. This is a completely customizable PowerPoint theme that can be put to use immediately. So, download it and address the topic impactfully.
5 Years Mutual Funds Performance Comparative Analysis Chart Icon Ppt Show Gridlines PDF
Persuade your audience using this 5 Years Mutual Funds Performance Comparative Analysis Chart Icon Ppt Show Gridlines PDF. This PPT design covers three stages, thus making it a great tool to use. It also caters to a variety of topics including 5 Years, Mutual Funds, Performance Comparative, Analysis, Chart Icon. Download this PPT design now to present a convincing pitch that not only emphasizes the topic but also showcases your presentation skills.
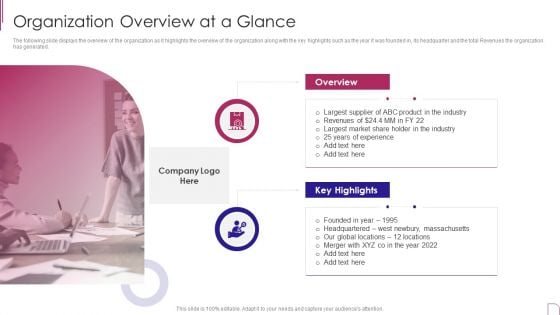
Yearly Product Performance Assessment Repor Organization Overview At A Glance Themes PDF
The following slide displays the overview of the organization as it highlights the overview of the organization along with the key highlights such as the year it was founded in, its headquarter and the total Revenues the organization has generated.This is a Yearly Product Performance Assessment Repor Organization Overview At A Glance Themes PDF template with various stages. Focus and dispense information on one stage using this creative set, that comes with editable features. It contains large content boxes to add your information on topics like Key Highlights, Overview, Headquartered You can also showcase facts, figures, and other relevant content using this PPT layout. Grab it now.
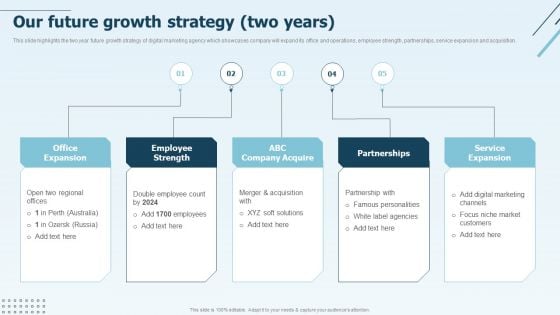
Digital Marketing Company Profile Our Future Growth Strategy Two Years Template PDF
This slide highlights the two year future growth strategy of digital marketing agency which showcases company will expand its office and operations, employee strength, partnerships, service expansion and acquisition.This is a Digital Marketing Company Profile Our Future Growth Strategy Two Years Template PDF template with various stages. Focus and dispense information on five stages using this creative set, that comes with editable features. It contains large content boxes to add your information on topics like Service Expansion, Partnerships Employee, Strength. You can also showcase facts, figures, and other relevant content using this PPT layout. Grab it now.

Website Marketing Enterprise Profile Our Future Growth Strategy Two Years Ppt PowerPoint Presentation Gallery Tips PDF
This slide highlights the two year future growth strategy of digital marketing agency which showcases company will expand its office and operations, employee strength, partnerships, service expansion and acquisition.This is a Website Marketing Enterprise Profile Our Future Growth Strategy Two Years Ppt PowerPoint Presentation Gallery Tips PDF template with various stages. Focus and dispense information on five stages using this creative set, that comes with editable features. It contains large content boxes to add your information on topics like Office Expansion, Employee Strength, Company Acquire. You can also showcase facts, figures, and other relevant content using this PPT layout. Grab it now.
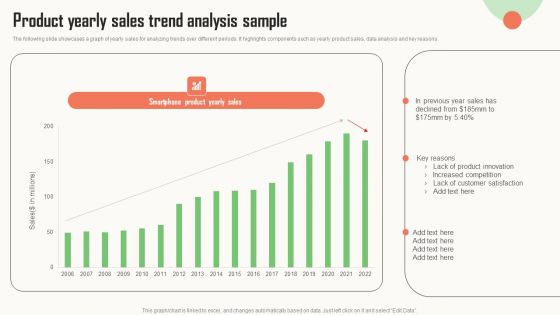
Strategic Market Insight Implementation Guide Product Yearly Sales Trend Analysis Sample Clipart PDF
The following slide showcases a graph of yearly sales for analyzing trends over different periods. It highlights components such as yearly product sales, data analysis and key reasons. Slidegeeks is one of the best resources for PowerPoint templates. You can download easily and regulate Strategic Market Insight Implementation Guide Product Yearly Sales Trend Analysis Sample Clipart PDF for your personal presentations from our wonderful collection. A few clicks is all it takes to discover and get the most relevant and appropriate templates. Use our Templates to add a unique zing and appeal to your presentation and meetings. All the slides are easy to edit and you can use them even for advertisement purposes.
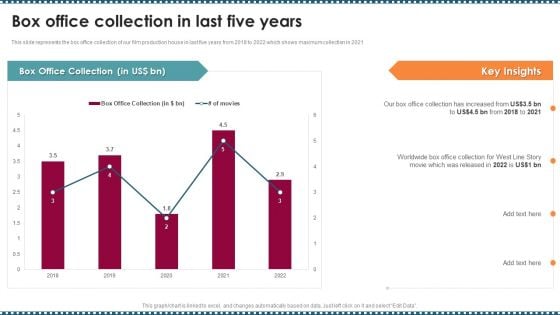
Feature Film Production Company Profile Box Office Collection In Last Five Years Rules PDF
This slide represents the box office collection of our film production house in last five years from 2018 to 2022 which shows maximum collection in 2021.Deliver and pitch your topic in the best possible manner with this Feature Film Production Company Profile Box Office Collection In Last Five Years Rules PDF Use them to share invaluable insights on Office Collection, Key Insights, Collection Increased and impress your audience. This template can be altered and modified as per your expectations. So, grab it now.
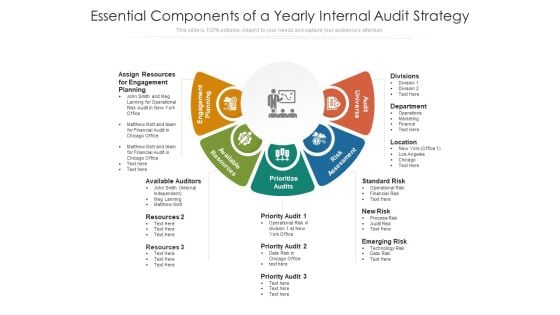
Essential Components Of A Yearly Internal Audit Strategy Ppt PowerPoint Presentation Infographics Graphic Tips PDF
Presenting essential components of a yearly internal audit strategy ppt powerpoint presentation infographics graphic tips pdf to dispense important information. This template comprises five stages. It also presents valuable insights into the topics including engagement planning, available resources, prioritize audits. This is a completely customizable PowerPoint theme that can be put to use immediately. So, download it and address the topic impactfully.
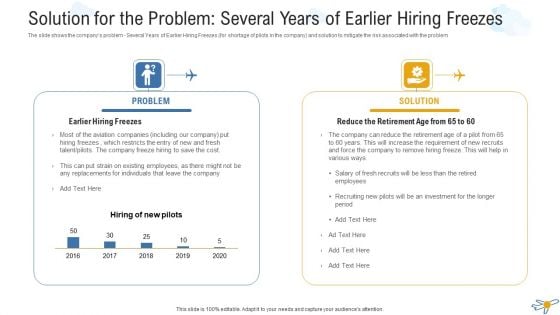
Solution For The Problem Several Years Of Earlier Hiring Freezes Information PDF
The slide shows the companys problem Several Years of Earlier Hiring Freezes for shortage of pilots in the company and solution to mitigate the risk associated with the problem. This is a solution for the problem several years of earlier hiring freezes information pdf template with various stages. Focus and dispense information on two stages using this creative set, that comes with editable features. It contains large content boxes to add your information on topics like problem, solution. You can also showcase facts, figures, and other relevant content using this PPT layout. Grab it now.

Dinner Party Invitation For Yearly Target Achievement Celebration Ppt PowerPoint Presentation Diagram Templates PDF
Pitch your topic with ease and precision using this dinner party invitation for yearly target achievement celebration ppt powerpoint presentation diagram templates pdf. This layout presents information on dinner party invitation for yearly target achievement celebration. It is also available for immediate download and adjustment. So, changes can be made in the color, design, graphics or any other component to create a unique layout.

Invitation Card For Yearly Kick Off Party Ppt PowerPoint Presentation File Picture PDF
Pitch your topic with ease and precision using this invitation card for yearly kick off party ppt powerpoint presentation file picture pdf. This layout presents information on invitation card for yearly kick off party. It is also available for immediate download and adjustment. So, changes can be made in the color, design, graphics or any other component to create a unique layout.
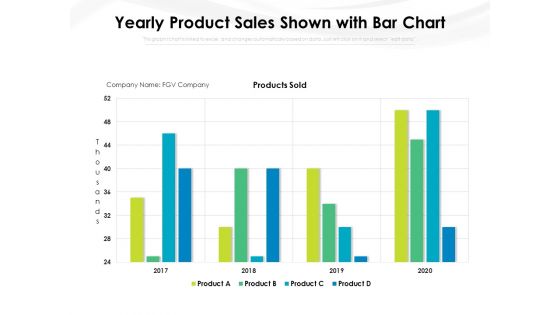
Yearly Product Sales Shown With Bar Chart Ppt PowerPoint Presentation File Gridlines PDF
Pitch your topic with ease and precision using this yearly product sales shown with bar chart ppt powerpoint presentation file gridlines pdf. This layout presents information on yearly product sales shown with bar chart. It is also available for immediate download and adjustment. So, changes can be made in the color, design, graphics or any other component to create a unique layout.

Yearly Advertising Cost For Various Platforms Ppt PowerPoint Presentation Gallery Objects PDF
Pitch your topic with ease and precision using this yearly advertising cost for various platforms ppt powerpoint presentation gallery objects pdf. This layout presents information on yearly advertising cost for various platforms. It is also available for immediate download and adjustment. So, changes can be made in the color, design, graphics or any other component to create a unique layout.
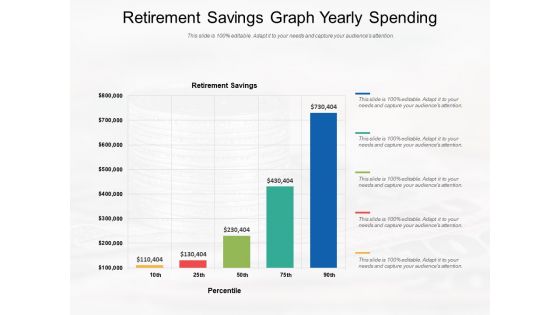
Retirement Savings Graph Yearly Spending Ppt PowerPoint Presentation File Example Topics PDF
Pitch your topic with ease and precision using this retirement savings graph yearly spending ppt powerpoint presentation file example topics pdf. This layout presents information on retirement savings graph yearly spending. It is also available for immediate download and adjustment. So, changes can be made in the color, design, graphics or any other component to create a unique layout.


 Continue with Email

 Home
Home


