Year To Year Comparison
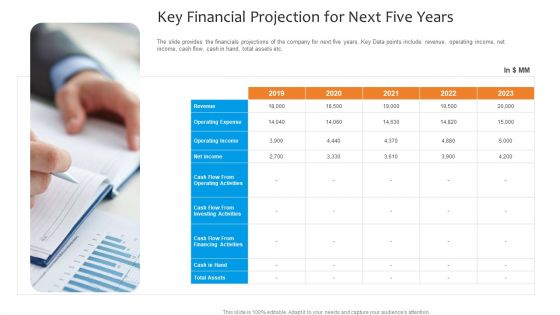
Funding Pitch To Raise Funds From PE Key Financial Projection For Next Five Years Background PDF
The slide provides the financials projections of the company for next five years. Key Data points include revenue, operating income, net income, cash flow, cash in hand, total assets etc. This is a funding pitch to raise funds from pe key financial projection for next five years background pdf template with various stages. Focus and dispense information on one stages using this creative set, that comes with editable features. It contains large content boxes to add your information on topics like financing, cash flow, revenue, operating expense, operating income. You can also showcase facts, figures, and other relevant content using this PPT layout. Grab it now.
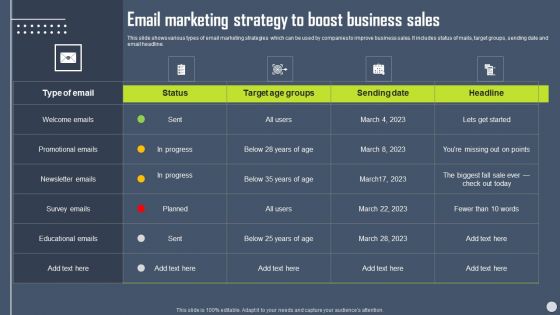
Boosting Yearly Business Revenue Email Marketing Strategy To Boost Business Sales Formats PDF
This slide shows various types of email marketing strategies which can be used by companies to improve business sales. It includes status of mails, target groups, sending date and email headline. Formulating a presentation can take up a lot of effort and time, so the content and message should always be the primary focus. The visuals of the PowerPoint can enhance the presenters message, so our Boosting Yearly Business Revenue Email Marketing Strategy To Boost Business Sales Formats PDF was created to help save time. Instead of worrying about the design, the presenter can concentrate on the message while our designers work on creating the ideal templates for whatever situation is needed. Slidegeeks has experts for everything from amazing designs to valuable content, we have put everything into Boosting Yearly Business Revenue Email Marketing Strategy To Boost Business Sales Formats PDF.
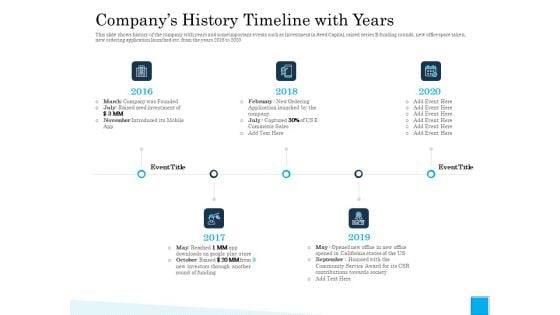
Insurance Organization Pitch Deck To Raise Money Companys History Timeline With Years Portrait PDF
This is a insurance organization pitch deck to raise money companys history timeline with years portrait pdf template with various stages. Focus and dispense information on five stages using this creative set, that comes with editable features. It contains large content boxes to add your information on topics like timeline, 2016 to 2020. You can also showcase facts, figures, and other relevant content using this PPT layout. Grab it now.
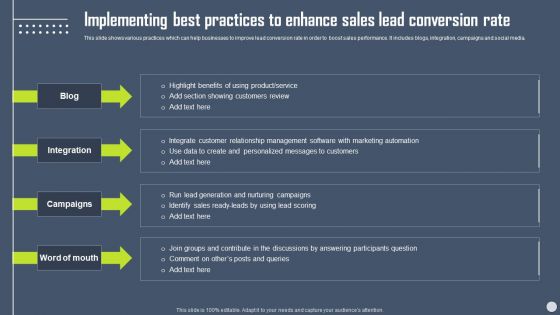
Boosting Yearly Business Revenue Implementing Best Practices To Enhance Sales Lead Themes PDF
This slide shows various practices which can help businesses to improve lead conversion rate in order to boost sales performance. It includes blogs, integration, campaigns and social media. This Boosting Yearly Business Revenue Implementing Best Practices To Enhance Sales Lead Themes PDF is perfect for any presentation, be it in front of clients or colleagues. It is a versatile and stylish solution for organizing your meetings. The Boosting Yearly Business Revenue Implementing Best Practices To Enhance Sales Lead Themes PDF features a modern design for your presentation meetings. The adjustable and customizable slides provide unlimited possibilities for acing up your presentation. Slidegeeks has done all the homework before launching the product for you. So, dont wait, grab the presentation templates today.
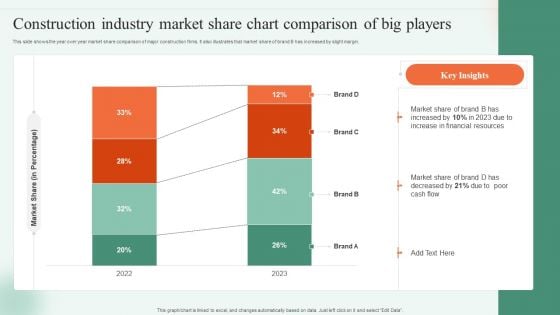
Construction Industry Market Share Chart Comparison Of Big Players Ppt Portfolio Shapes PDF
This slide shows the year over year market share comparison of major construction firms. It also illustrates that market share of brand B has increased by slight margin. Pitch your topic with ease and precision using this Construction Industry Market Share Chart Comparison Of Big Players Ppt Portfolio Shapes PDF. This layout presents information on Market Share Percentage, 2022 To 2023, Market Share. It is also available for immediate download and adjustment. So, changes can be made in the color, design, graphics or any other component to create a unique layout.
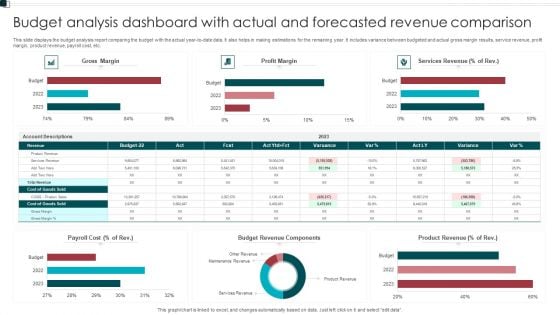
Budget Analysis Dashboard With Actual And Forecasted Revenue Comparison Structure PDF
This slide displays the budget analysis report comparing the budget with the actual year to date data. It also helps in making estimations for the remaining year. It includes variance between budgeted and actual gross margin results, service revenue, profit margin, product revenue, payroll cost, etc. Pitch your topic with ease and precision using this Budget Analysis Dashboard With Actual And Forecasted Revenue Comparison Structure PDF. This layout presents information on Payroll Cost, Budget Revenue Components, Product Revenue. It is also available for immediate download and adjustment. So, changes can be made in the color, design, graphics or any other component to create a unique layout.
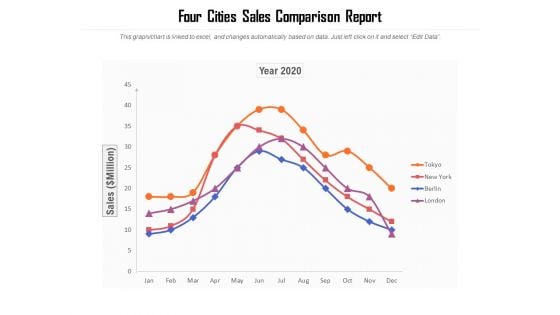
Four Cities Sales Comparison Report Ppt PowerPoint Presentation Pictures Mockup PDF
Pitch your topic with ease and precision using this four cities sales comparison report ppt powerpoint presentation pictures mockup pdf. This layout presents information on sales, year 2020. It is also available for immediate download and adjustment. So, changes can be made in the color, design, graphics or any other component to create a unique layout.
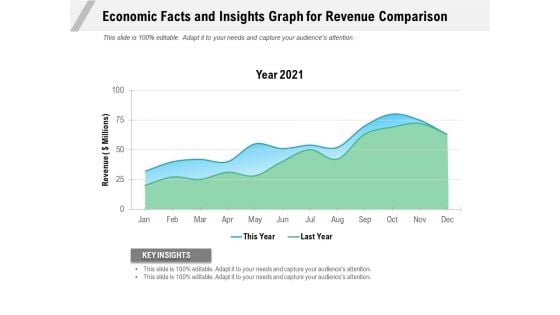
Economic Facts And Insights Graph For Revenue Comparison Ppt PowerPoint Presentation Gallery Portfolio PDF
Pitch your topic with ease and precision using this economic facts and insights graph for revenue comparison ppt powerpoint presentation gallery portfolio pdf. This layout presents information on year 2021, revenue, key insights. It is also available for immediate download and adjustment. So, changes can be made in the color, design, graphics or any other component to create a unique layout.

Company Introduction Childcare Service Comparison Platform Investor Funding Elevator Pitch Deck
This slide represents the overview of a company that provides an online marketplace that helps parents quickly find and compare childcare services nearby. It showcases industry, customer, headquarters, type, founded year and founders.Slidegeeks is one of the best resources for PowerPoint templates. You can download easily and regulate Company Introduction Childcare Service Comparison Platform Investor Funding Elevator Pitch Deck for your personal presentations from our wonderful collection. A few clicks is all it takes to discover and get the most relevant and appropriate templates. Use our Templates to add a unique zing and appeal to your presentation and meetings. All the slides are easy to edit and you can use them even for advertisement purposes. This slide represents the overview of a company that provides an online marketplace that helps parents quickly find and compare childcare services nearby. It showcases industry, customer, headquarters, type, founded year and founders.
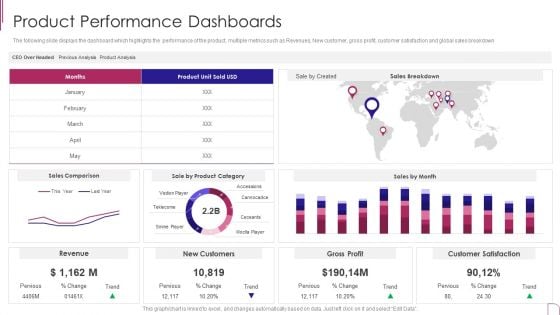
Yearly Product Performance Assessment Repor Product Performance Dashboards Designs PDF
The following slide displays the dashboard which highlights the performance of the product, multiple metrics such as Revenues, New customer, gross profit, customer satisfaction and global sales breakdown.Deliver and pitch your topic in the best possible manner with this Yearly Product Performance Assessment Repor Product Performance Dashboards Designs PDF Use them to share invaluable insights on Gross Profit, Customer Satisfaction, Sales Comparison and impress your audience. This template can be altered and modified as per your expectations. So, grab it now.
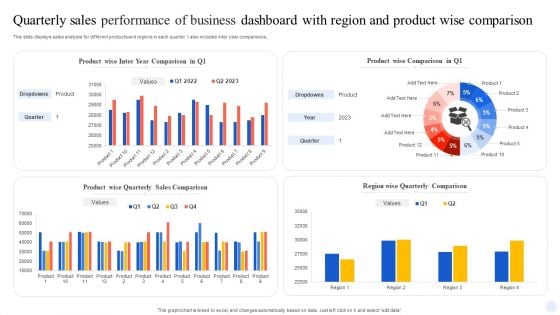
Quarterly Sales Performance Of Business Dashboard With Region And Product Wise Comparison Guidelines PDF
This slide displays sales analysis for different products and regions in each quarter. t also includes inter year comparisons. Pitch your topic with ease and precision using this Quarterly Sales Performance Of Business Dashboard With Region And Product Wise Comparison Guidelines PDF. This layout presents information on Product Wise Quarterly Sales, Comparison. It is also available for immediate download and adjustment. So, changes can be made in the color, design, graphics or any other component to create a unique layout.
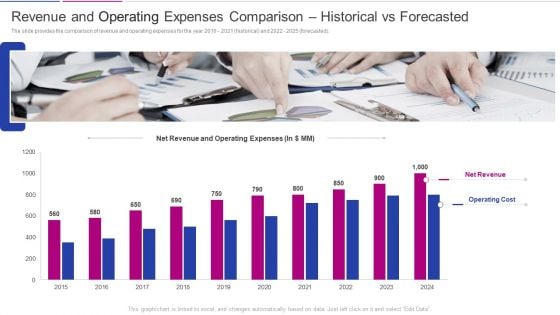
Fundraising From Corporate Investment Revenue And Operating Expenses Comparison Historical Pictures PDF
The slide provides the comparison of revenue and operating expenses for the year 2016 to 2021 historical and 2022 to 2025 forecasted. Deliver an awe inspiring pitch with this creative fundraising from corporate investment revenue and operating expenses comparison historical pictures pdf bundle. Topics like net revenue, operating cost can be discussed with this completely editable template. It is available for immediate download depending on the needs and requirements of the user.
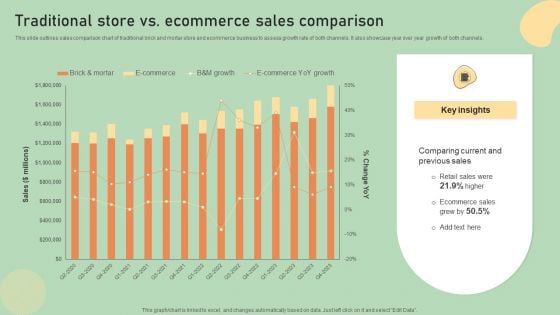
E Commerce Business Development Plan Traditional Store Vs Ecommerce Sales Comparison Guidelines PDF
This slide outlines sales comparison chart of traditional brick and mortar store and ecommerce business to assess growth rate of both channels. It also showcase year over year growth of both channels. Create an editable E Commerce Business Development Plan Traditional Store Vs Ecommerce Sales Comparison Guidelines PDF that communicates your idea and engages your audience. Whether you are presenting a business or an educational presentation, pre-designed presentation templates help save time. E Commerce Business Development Plan Traditional Store Vs Ecommerce Sales Comparison Guidelines PDF is highly customizable and very easy to edit, covering many different styles from creative to business presentations. Slidegeeks has creative team members who have crafted amazing templates. So, go and get them without any delay.
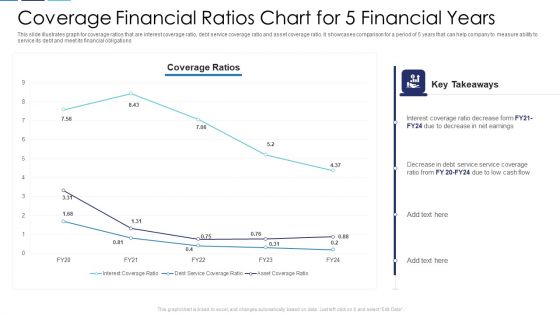
Coverage Financial Ratios Chart For 5 Financial Years Themes PDF
This slide illustrates graph for coverage ratios that are interest coverage ratio, debt service coverage ratio and asset coverage ratio. It showcases comparison for a period of 5 years that can help company to measure ability to service its debt and meet its financial obligations Showcasing this set of slides titled coverage financial ratios chart for 5 financial years themes pdf. The topics addressed in these templates are coverage financial ratios chart for 5 financial years. All the content presented in this PPT design is completely editable. Download it and make adjustments in color, background, font etc. as per your unique business setting.
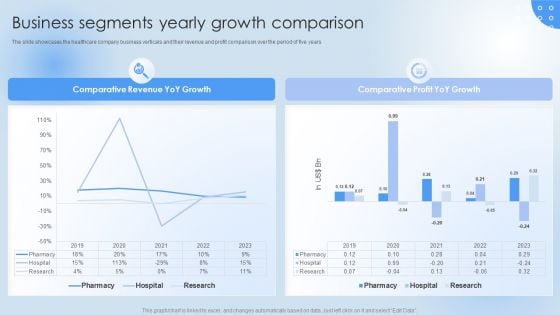
Pharmaceutical Company Financial Summary Business Segments Yearly Growth Guidelines PDF
The slide showcases the healthcare company business verticals and their revenue and profit comparison over the period of five years. The best PPT templates are a great way to save time, energy, and resources. Slidegeeks have 100 percent editable powerpoint slides making them incredibly versatile. With these quality presentation templates, you can create a captivating and memorable presentation by combining visually appealing slides and effectively communicating your message. Download Pharmaceutical Company Financial Summary Business Segments Yearly Growth Guidelines PDF from Slidegeeks and deliver a wonderful presentation.
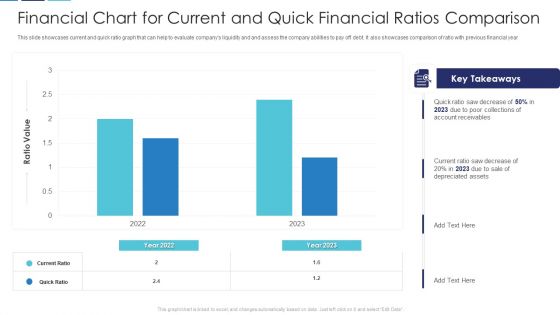
Financial Chart For Current And Quick Financial Ratios Comparison Brochure PDF
This slide showcases current and quick ratio graph that can help to evaluate companys liquidity and and assess the company abilities to pay off debt. It also showcases comparison of ratio with previous financial year Pitch your topic with ease and precision using this financial chart for current and quick financial ratios comparison brochure pdf. This layout presents information on financial chart for current and quick financial ratios comparison. It is also available for immediate download and adjustment. So, changes can be made in the color, design, graphics or any other component to create a unique layout.
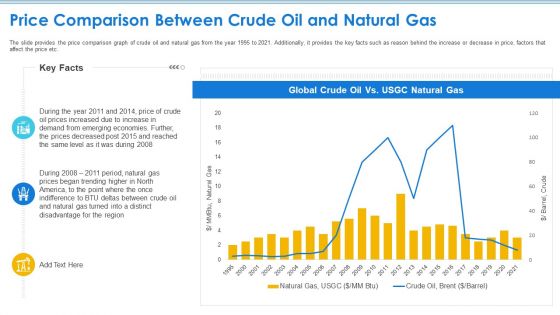
Case Competition Petroleum Sector Issues Price Comparison Between Crude Oil And Natural Gas Introduction PDF
The slide provides the price comparison graph of crude oil and natural gas from the year 1995 to 2021. Additionally, it provides the key facts such as reason behind the increase or decrease in price, factors that affect the price etc. Deliver an awe inspiring pitch with this creative case competition petroleum sector issues price comparison between crude oil and natural gas introduction pdf bundle. Topics like price comparison between crude oil and natural gas can be discussed with this completely editable template. It is available for immediate download depending on the needs and requirements of the user.
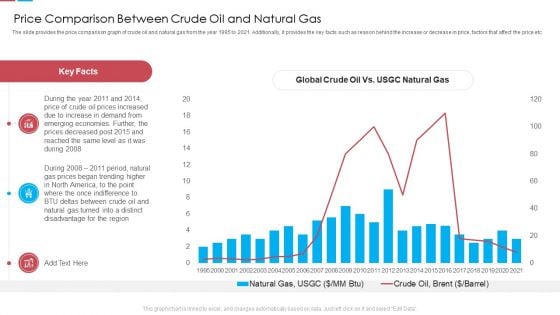
Price Comparison Between Crude Oil And Natural Gas Ppt Outline Background Image PDF
The slide provides the price comparison graph of crude oil and natural gas from the year 1995 to 2021. Additionally, it provides the key facts such as reason behind the increase or decrease in price, factors that affect the price etc. Deliver an awe inspiring pitch with this creative price comparison between crude oil and natural gas ppt outline background image pdf bundle. Topics like price comparison between crude oil and natural gas can be discussed with this completely editable template. It is available for immediate download depending on the needs and requirements of the user.
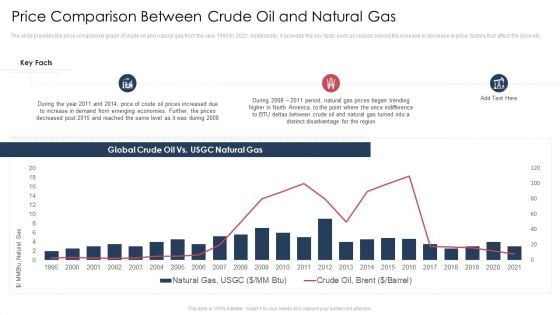
Price Comparison Between Crude Oil And Natural Gas Ppt Summary Smartart PDF
The slide provides the price comparison graph of crude oil and natural gas from the year 1995 to 2021. Additionally, it provides the key facts such as reason behind the increase or decrease in price, factors that affect the price etc.Deliver an awe-inspiring pitch with this creative price comparison between crude oil and natural gas ppt summary smartart pdf. bundle. Topics like global crude oil vs. usgc natural gas, 1995 to 2021 can be discussed with this completely editable template. It is available for immediate download depending on the needs and requirements of the user.
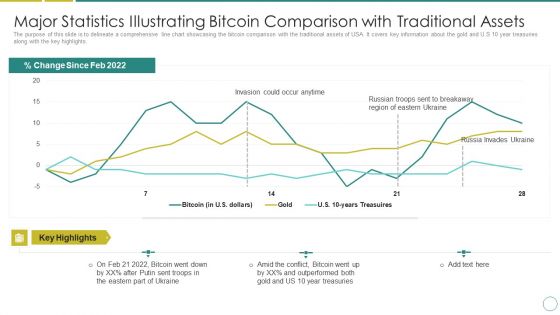
Russia Ukraine Major Statistics Illustrating Bitcoin Comparison With Traditional Assets Guidelines PDF
The purpose of this slide is to delineate a comprehensive line chart showcasing the bitcoin comparison with the traditional assets of USA. It covers key information about the gold and U.S 10 year treasuries along with the key highlights. Deliver an awe inspiring pitch with this creative russia ukraine major statistics illustrating bitcoin comparison with traditional assets guidelines pdf bundle. Topics like invasion could occur anytime, percent change since feb 2022 can be discussed with this completely editable template. It is available for immediate download depending on the needs and requirements of the user.
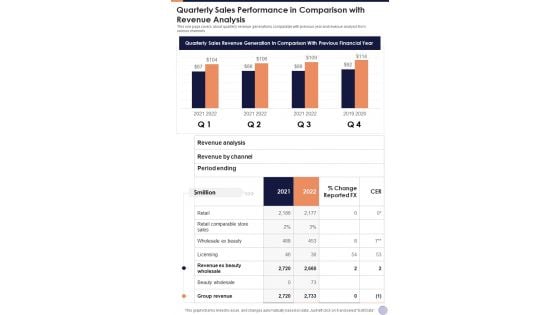
Quarterly Sales Performance In Comparison With Revenue Analysis One Pager Documents
This one page covers about quarterly revenue generations comparable with previous year and revenue analysis from various channels. Presenting you an exemplary Quarterly Sales Performance In Comparison With Revenue Analysis One Pager Documents. Our one-pager comprises all the must-have essentials of an inclusive document. You can edit it with ease, as its layout is completely editable. With such freedom, you can tweak its design and other elements to your requirements. Download this Quarterly Sales Performance In Comparison With Revenue Analysis One Pager Documents brilliant piece now.
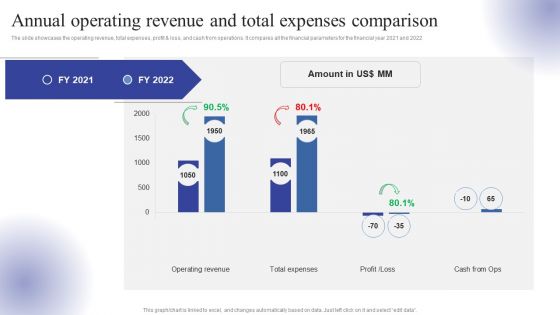
Annual Operating Revenue And Total Expenses Comparison Ppt Infographic Template Rules PDF
The slide showcases the operating revenue, total expenses, profit and loss, and cash from operations. It compares all the financial parameters for the financial year 2021 and 2022. Want to ace your presentation in front of a live audience Our Annual Operating Revenue And Total Expenses Comparison Ppt Infographic Template Rules PDF can help you do that by engaging all the users towards you.. Slidegeeks experts have put their efforts and expertise into creating these impeccable powerpoint presentations so that you can communicate your ideas clearly. Moreover, all the templates are customizable, and easy-to-edit and downloadable. Use these for both personal and commercial use.

Cloud Kitchen And Dine In Restaurant Sales Comparison Global Virtual Restaurant Infographics Pdf
The following slide highlights comparison of cloud kitchen and dine in restaurants based on gross food sales of previous years. It presents yearly sales growth of cloud kitchen and direct restaurant. Find highly impressive Cloud Kitchen And Dine In Restaurant Sales Comparison Global Virtual Restaurant Infographics Pdf on Slidegeeks to deliver a meaningful presentation. You can save an ample amount of time using these presentation templates. No need to worry to prepare everything from scratch because Slidegeeks experts have already done a huge research and work for you. You need to download Cloud Kitchen And Dine In Restaurant Sales Comparison Global Virtual Restaurant Infographics Pdf for your upcoming presentation. All the presentation templates are 100 percent editable and you can change the color and personalize the content accordingly. Download now. The following slide highlights comparison of cloud kitchen and dine in restaurants based on gross food sales of previous years. It presents yearly sales growth of cloud kitchen and direct restaurant.
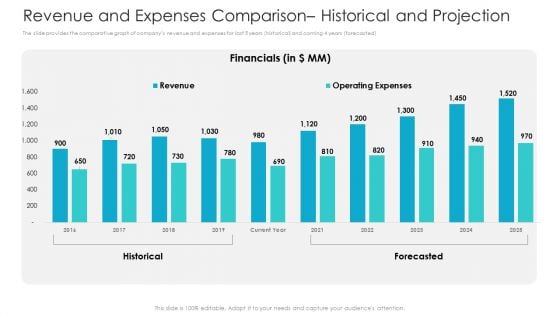
Private Equity Fundraising Pitch Deck Revenue And Expenses Comparison Historical And Projection Clipart PDF
The slide provides the comparative graph of companys revenue and expenses for last 5 years historical and coming 4 years forecasted. Deliver and pitch your topic in the best possible manner with this private equity fundraising pitch deck revenue and expenses comparison historical and projection clipart pdf. Use them to share invaluable insights on financials, revenue, operating expenses, 2016 to 2025 and impress your audience. This template can be altered and modified as per your expectations. So, grab it now.
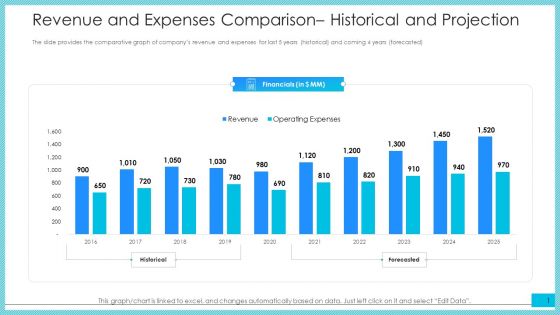
Revenue And Expenses Comparison Historical And Projection Ppt Summary Example Introduction PDF
The slide provides the comparative graph of companys revenue and expenses for last 5 years historical and coming 4 years forecasted.Deliver and pitch your topic in the best possible manner with this revenue and expenses comparison historical and projection ppt summary example introduction pdf. Use them to share invaluable insights on financials, 2016 to 2025, revenue, operating expenses and impress your audience. This template can be altered and modified as per your expectations. So, grab it now.
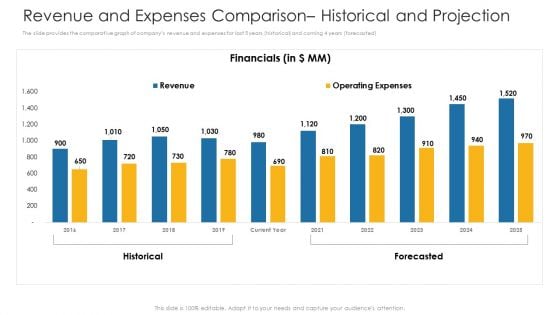
Revenue And Expenses Comparison Historical And Projection Ppt Show Slide Download PDF
The slide provides the comparative graph of companys revenue and expenses for last 5 years historical and coming 4 years forecasted.Deliver and pitch your topic in the best possible manner with this revenue and expenses comparison historical and projection ppt show slide download pdf. Use them to share invaluable insights on financials, 2016 to 2025, revenue, operating expenses and impress your audience. This template can be altered and modified as per your expectations. So, grab it now.
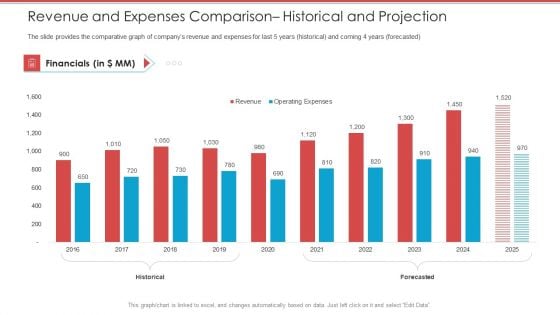
Cash Market Investor Deck Revenue And Expenses Comparison Historical And Projection Ppt Professional Information PDF
The slide provides the comparative graph of companys revenue and expenses for last 5 years historical and coming 4 years forecasted. Deliver and pitch your topic in the best possible manner with this cash market investor deck revenue and expenses comparison historical and projection ppt professional information pdf. Use them to share invaluable insights on financials, revenue, operating expenses, 2016 to 2025 and impress your audience. This template can be altered and modified as per your expectations. So, grab it now.
Revenue And Expenses Comparison Historical And Projection Ppt Icon Files PDF
The slide provides the comparative graph of companys revenue and expenses for last 5 years historical and coming 4 years forecasted.Deliver and pitch your topic in the best possible manner with this revenue and expenses comparison historical and projection ppt icon files pdf. Use them to share invaluable insights on financials, 2016 to 2025, revenue, operating expenses and impress your audience. This template can be altered and modified as per your expectations. So, grab it now.
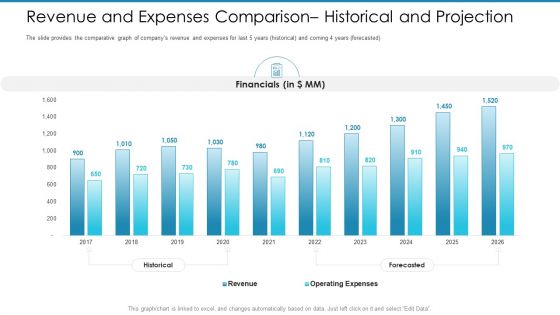
Post Initial Pubic Offering Market Pitch Deck Revenue And Expenses Comparison Historical And Projection Sample PDF
The slide provides the comparative graph of companys revenue and expenses for last 5 years historical and coming 4 years forecasted.Deliver an awe-inspiring pitch with this creative post initial pubic offering market pitch deck revenue and expenses comparison historical and projection sample pdf. bundle. Topics like financials, 2017 to 2026 can be discussed with this completely editable template. It is available for immediate download depending on the needs and requirements of the user.
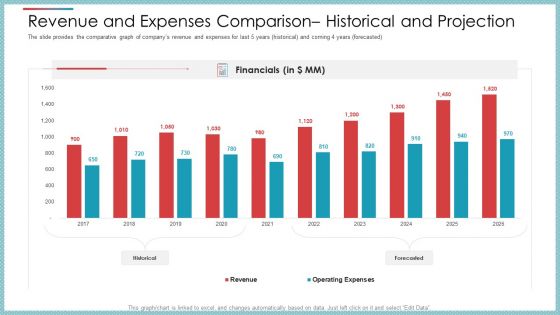
Revenue And Expenses Comparison Historical And Projection Ppt Styles Graphics Design PDF
The slide provides the comparative graph of companys revenue and expenses for last 5 years historical and coming 4 years forecasted.Deliver an awe-inspiring pitch with this creative revenue and expenses comparison historical and projection ppt styles graphics design pdf. bundle. Topics like financials, 2016 to 2025, revenue, operating expenses can be discussed with this completely editable template. It is available for immediate download depending on the needs and requirements of the user.
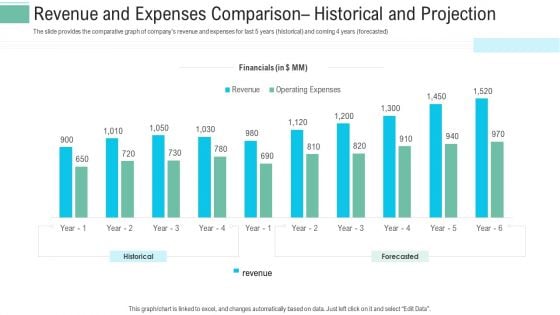
Revenue And Expenses Comparison Historical And Projection Ppt Layouts Grid PDF
The slide provides the comparative graph of companys revenue and expenses for last 5 years historical and coming 4 years forecasted. Deliver and pitch your topic in the best possible manner with this revenue and expenses comparison historical and projection ppt layouts grid pdf. Use them to share invaluable insights on financials, operating expenses, revenue and impress your audience. This template can be altered and modified as per your expectations. So, grab it now.
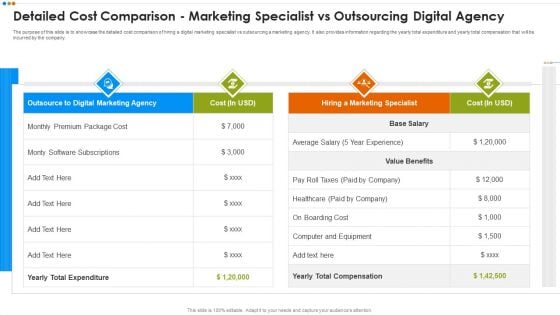
Quarterly Budget Analysis Of Business Organization Detailed Cost Comparison Marketing Ideas PDF
The purpose of this slide is to showcase the detailed cost comparison of hiring a digital marketing specialist vs outsourcing a marketing agency. It also provides information regarding the yearly total expenditure and yearly total compensation that will be incurred by the company.Deliver and pitch your topic in the best possible manner with this Quarterly Budget Analysis Of Business Organization Detailed Cost Comparison Marketing Ideas PDF Use them to share invaluable insights on Outsource To Digital, Marketing Specialist, Marketing Agency and impress your audience. This template can be altered and modified as per your expectations. So, grab it now.
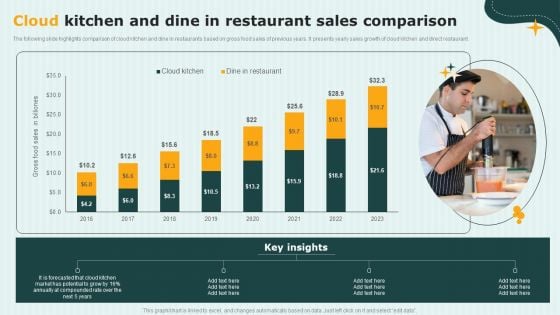
International Cloud Kitchen Industry Analysis Cloud Kitchen And Dine In Restaurant Sales Comparison Rules PDF
The following slide highlights comparison of cloud kitchen and dine in restaurants based on gross food sales of previous years. It presents yearly sales growth of cloud kitchen and direct restaurant. Want to ace your presentation in front of a live audience Our International Cloud Kitchen Industry Analysis Cloud Kitchen And Dine In Restaurant Sales Comparison Rules PDF can help you do that by engaging all the users towards you.. Slidegeeks experts have put their efforts and expertise into creating these impeccable powerpoint presentations so that you can communicate your ideas clearly. Moreover, all the templates are customizable, and easy-to-edit and downloadable. Use these for both personal and commercial use.
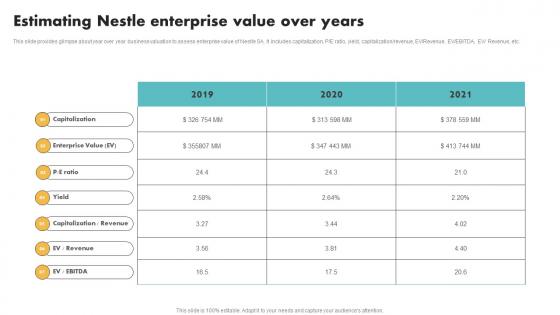
Estimating Nestle Enterprise Value Over Years Customer Segmentation Designs Pdf
This slide provides glimpse about year over year business valuation to assess enterprise value of Nestle SA. It includes capitalization, P E ratio, yield, capitalization revenue, EV Revenue, EV EBITDA, EV Revenue, etc. This Estimating Nestle Enterprise Value Over Years Customer Segmentation Designs Pdf is perfect for any presentation, be it in front of clients or colleagues. It is a versatile and stylish solution for organizing your meetings. The Estimating Nestle Enterprise Value Over Years Customer Segmentation Designs Pdf features a modern design for your presentation meetings. The adjustable and customizable slides provide unlimited possibilities for acing up your presentation. Slidegeeks has done all the homework before launching the product for you. So, do not wait, grab the presentation templates today This slide provides glimpse about year over year business valuation to assess enterprise value of Nestle SA. It includes capitalization, P E ratio, yield, capitalization revenue, EV Revenue, EV EBITDA, EV Revenue, etc.
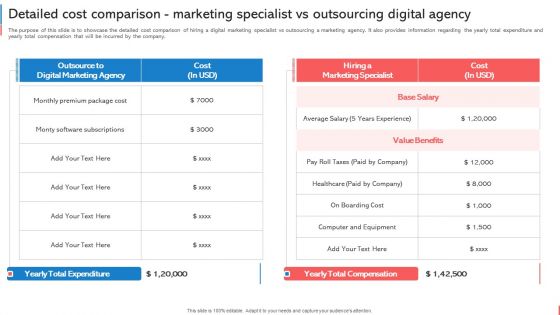
Company Budget Analysis Detailed Cost Comparison Marketing Specialist Vs Outsourcing Diagrams PDF
The purpose of this slide is to showcase the detailed cost comparison of hiring a digital marketing specialist vs outsourcing a marketing agency. It also provides information regarding the yearly total expenditure and yearly total compensation that will be incurred by the company. There are so many reasons you need a Company Budget Analysis Detailed Cost Comparison Marketing Specialist Vs Outsourcing Diagrams PDF. The first reason is you cant spend time making everything from scratch, Thus, Slidegeeks has made presentation templates for you too. You can easily download these templates from our website easily.

Yearly Sustainable Development Plan For Large Organization Portrait Pdf
This slide exhibits a sustainability action plan with targets for each year to create long term value for the firm. It includes targets such as energy efficient lighting, erasing plastic from supply chain, green energy at production facilities, etc. Pitch your topic with ease and precision using this Yearly Sustainable Development Plan For Large Organization Portrait Pdf. This layout presents information on Targets, Actions Taken, Responsibility. It is also available for immediate download and adjustment. So, changes can be made in the color, design, graphics or any other component to create a unique layout. This slide exhibits a sustainability action plan with targets for each year to create long term value for the firm. It includes targets such as energy efficient lighting, erasing plastic from supply chain, green energy at production facilities, etc.
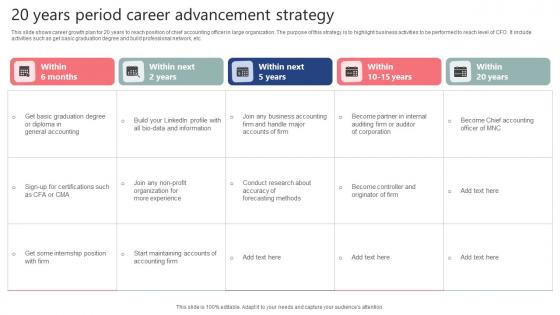
20 Years Period Career Advancement Strategy Information Pdf
This slide shows career growth plan for 20 years to reach position of chief accounting officer in large organization. The purpose of this strategy is to highlight business activities to be performed to reach level of CFO. It include activities such as get basic graduation degree and build professional network, etc. Pitch your topic with ease and precision using this 20 Years Period Career Advancement Strategy Information Pdf. This layout presents information on General Accounting, Organization, Originator Of Firm. It is also available for immediate download and adjustment. So, changes can be made in the color, design, graphics or any other component to create a unique layout. This slide shows career growth plan for 20 years to reach position of chief accounting officer in large organization. The purpose of this strategy is to highlight business activities to be performed to reach level of CFO. It include activities such as get basic graduation degree and build professional network, etc.
Icon For Revenue Projections Yearly Analysis Pictures Pdf
Pitch your topic with ease and precision using this Icon For Revenue Projections Yearly Analysis Pictures Pdf This layout presents information on Icon For Income Forecast, Yearly Analysis It is also available for immediate download and adjustment. So, changes can be made in the color, design, graphics or any other component to create a unique layout. Our Icon For Revenue Projections Yearly Analysis Pictures Pdf are topically designed to provide an attractive backdrop to any subject. Use them to look like a presentation pro.
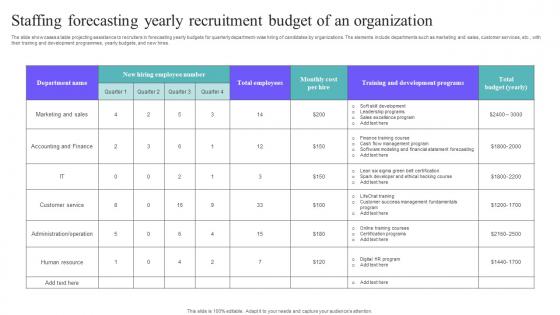
Staffing Forecasting Yearly Recruitment Budget Of An Organization Summary Pdf
The slide showcases a table projecting assistance to recruiters in forecasting yearly budgets for quarterly department wise hiring of candidates by organizations. The elements include departments such as marketing and sales, customer services, etc., with their training and development programmes, yearly budgets, and new hires. Pitch your topic with ease and precision using this Staffing Forecasting Yearly Recruitment Budget Of An Organization Summary Pdf. This layout presents information on Soft Skill Development, Leadership Programs, Sales Excellence Program. It is also available for immediate download and adjustment. So, changes can be made in the color, design, graphics or any other component to create a unique layout. The slide showcases a table projecting assistance to recruiters in forecasting yearly budgets for quarterly department wise hiring of candidates by organizations. The elements include departments such as marketing and sales, customer services, etc., with their training and development programmes, yearly budgets, and new hires.
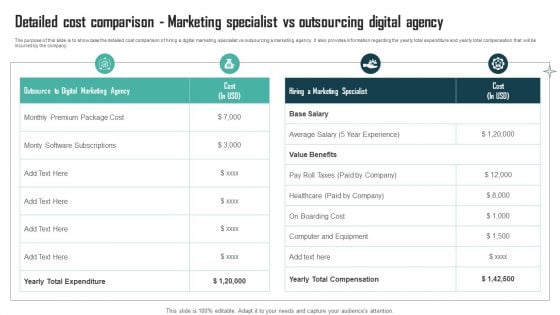
Expenses Management Plan Detailed Cost Comparison Marketing Specialist Vs Outsourcing Slides PDF
The purpose of this slide is to showcase the detailed cost comparison of hiring a digital marketing specialist vs outsourcing a marketing agency. It also provides information regarding the yearly total expenditure and yearly total compensation that will be incurred by the company. Do you have to make sure that everyone on your team knows about any specific topic I yes, then you should give Expenses Management Plan Detailed Cost Comparison Marketing Specialist Vs Outsourcing Slides PDF a try. Our experts have put a lot of knowledge and effort into creating this impeccable Expenses Management Plan Detailed Cost Comparison Marketing Specialist Vs Outsourcing Slides PDF. You can use this template for your upcoming presentations, as the slides are perfect to represent even the tiniest detail. You can download these templates from the Slidegeeks website and these are easy to edit. So grab these today.
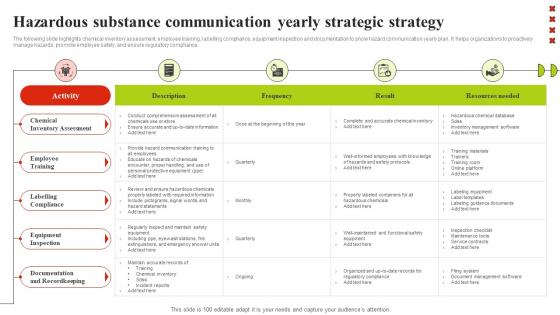
Hazardous Substance Communication Yearly Strategic Strategy Themes Pdf
The following slide highlights chemical inventory assessment, employee training, labelling compliance, equipment inspection and documentation to show hazard communication yearly plan. It helps organizations to proactively manage hazards, promote employee safety, and ensure regulatory compliance. Pitch your topic with ease and precision using this Hazardous Substance Communication Yearly Strategic Strategy Themes Pdf This layout presents information on Chemical Inventory Assessment, Employee Training It is also available for immediate download and adjustment. So, changes can be made in the color, design, graphics or any other component to create a unique layout. The following slide highlights chemical inventory assessment, employee training, labelling compliance, equipment inspection and documentation to show hazard communication yearly plan. It helps organizations to proactively manage hazards, promote employee safety, and ensure regulatory compliance.
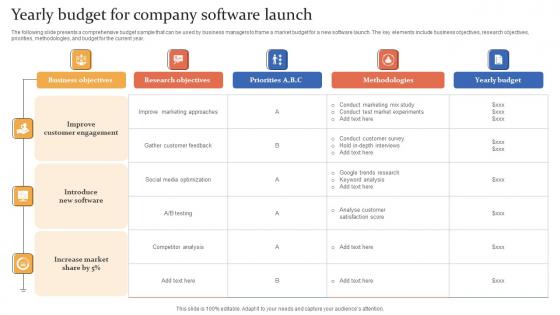
Yearly Budget For Company Software Launch Rules Pdf
The following slide presents a comprehensive budget sample that can be used by business managers to frame a market budget for a new software launch. The key elements include business objectives, research objectives, priorities, methodologies, and budget for the current year.Showcasing this set of slides titled Yearly Budget For Company Software Launch Rules Pdf The topics addressed in these templates are Customer Engagement, Introduce New Software, Increase Market All the content presented in this PPT design is completely editable. Download it and make adjustments in color, background, font etc. as per your unique business setting. The following slide presents a comprehensive budget sample that can be used by business managers to frame a market budget for a new software launch. The key elements include business objectives, research objectives, priorities, methodologies, and budget for the current year.
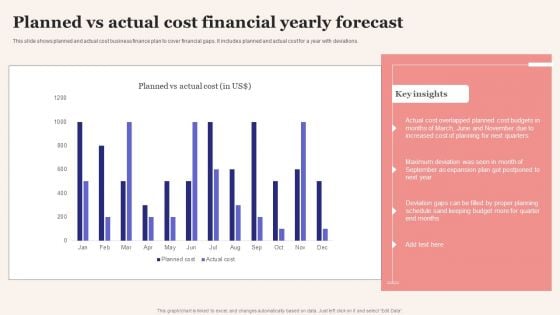
Planned Vs Actual Cost Financial Yearly Forecast Portrait PDF
This slide shows planned and actual cost business finance plan to cover financial gaps. It includes planned and actual cost for a year with deviations. Pitch your topic with ease and precision using this Planned Vs Actual Cost Financial Yearly Forecast Portrait PDF. This layout presents information on Planned Vs Actual Cost, Financial Yearly Forecast. It is also available for immediate download and adjustment. So, changes can be made in the color, design, graphics or any other component to create a unique layout.
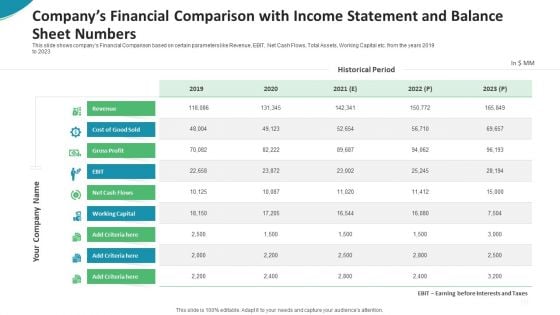
Companys Financial Comparison With Income Statement And Balance Sheet Numbers Mockup PDF
This slide shows companys Financial Comparison based on certain parameters like Revenue, EBIT, Net Cash Flows, Total Assets, Working Capital etc. from the years 2019 to 2023.Deliver an awe-inspiring pitch with this creative companys financial comparison with income statement and balance sheet numbers mockup pdf. bundle. Topics like revenue, gross profit, net cash flows, working capital can be discussed with this completely editable template. It is available for immediate download depending on the needs and requirements of the user.
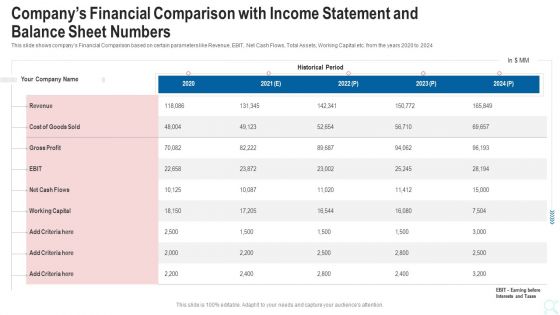
Companys Financial Comparison With Income Statement And Balance Sheet Numbers Formats PDF
This slide shows companys Financial Comparison based on certain parameters like Revenue, EBIT, Net Cash Flows, Total Assets, Working Capital etc. from the years 2020 to 2024 Deliver an awe inspiring pitch with this creative companys financial comparison with income statement and balance sheet numbers formats pdf bundle. Topics like cost of goods sold, working capital, cash flows can be discussed with this completely editable template. It is available for immediate download depending on the needs and requirements of the user.
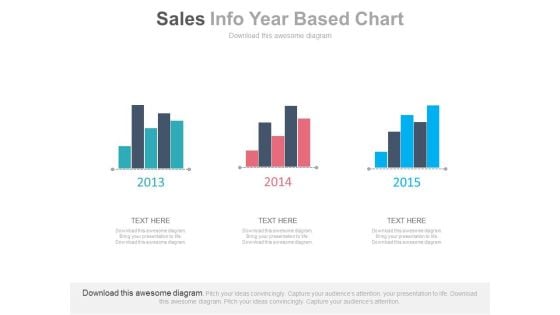
Three Years Sales Data Bar Graph Powerpoint Slides
This PowerPoint template has been designed with bar charts. This business slide may be used to display three years sales data for comparison. Present your views and ideas with this impressive design.
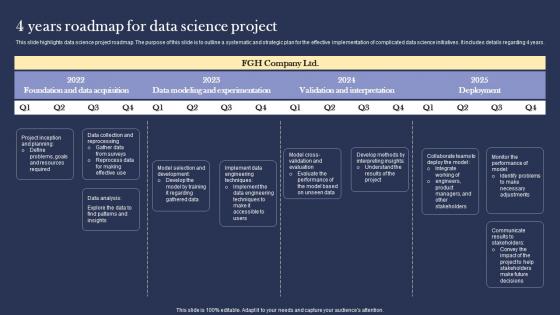
4 Years Roadmap For Data Science Project Structure pdf
This slide highlights data science project roadmap. The purpose of this slide is to outline a systematic and strategic plan for the effective implementation of complicated data science initiatives. It includes details regarding 4 years. Showcasing this set of slides titled 4 Years Roadmap For Data Science Project Structure pdf. The topics addressed in these templates are Project Inception, Data Collection, Data Analysis. All the content presented in this PPT design is completely editable. Download it and make adjustments in color, background, font etc. as per your unique business setting. This slide highlights data science project roadmap. The purpose of this slide is to outline a systematic and strategic plan for the effective implementation of complicated data science initiatives. It includes details regarding 4 years.

Detailed Cost Comparison Marketing Specialist Vs Outsourcing Digital Agency Structure PDF
The purpose of this slide is to showcase the detailed cost comparison of hiring a digital marketing specialist vs outsourcing a marketing agency. It also provides information regarding the yearly total expenditure and yearly total compensation that will be incurred by the company. Coming up with a presentation necessitates that the majority of the effort goes into the content and the message you intend to convey. The visuals of a PowerPoint presentation can only be effective if it supplements and supports the story that is being told. Keeping this in mind our experts created Detailed Cost Comparison Marketing Specialist Vs Outsourcing Digital Agency Structure PDF to reduce the time that goes into designing the presentation. This way, you can concentrate on the message while our designers take care of providing you with the right template for the situation.
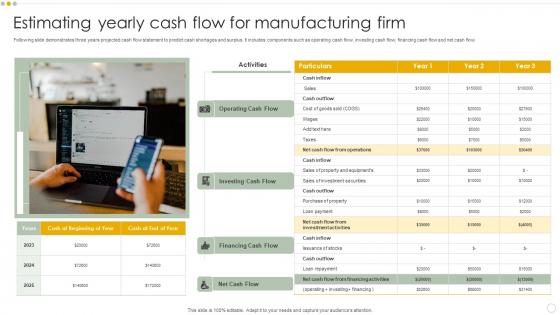
Estimating Yearly Cash Flow For Manufacturing Firm Background Pdf
Following slide demonstrates three years projected cash flow statement to predict cash shortages and surplus. It includes components such as operating cash flow, investing cash flow, financing cash flow and net cash flow. Showcasing this set of slides titled Estimating Yearly Cash Flow For Manufacturing Firm Background Pdf. The topics addressed in these templates are Estimating Yearly Cash Flow, Manufacturing Firm, Operating Cash Flow, Investing Cash Flow. All the content presented in this PPT design is completely editable. Download it and make adjustments in color, background, font etc. as per your unique business setting. Following slide demonstrates three years projected cash flow statement to predict cash shortages and surplus. It includes components such as operating cash flow, investing cash flow, financing cash flow and net cash flow.
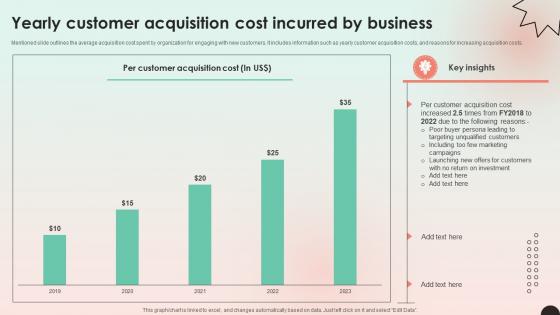
Web Consulting Business Yearly Customer Acquisition Cost Incurred By Business
Mentioned slide outlines the average acquisition cost spent by organization for engaging with new customers. It includes information such as yearly customer acquisition costs, and reasons for increasing acquisition costs. Are you searching for a Web Consulting Business Yearly Customer Acquisition Cost Incurred By Business that is uncluttered, straightforward, and original Its easy to edit, and you can change the colors to suit your personal or business branding. For a presentation that expresses how much effort you have put in, this template is ideal With all of its features, including tables, diagrams, statistics, and lists, its perfect for a business plan presentation. Make your ideas more appealing with these professional slides. Download Web Consulting Business Yearly Customer Acquisition Cost Incurred By Business from Slidegeeks today. Mentioned slide outlines the average acquisition cost spent by organization for engaging with new customers. It includes information such as yearly customer acquisition costs, and reasons for increasing acquisition costs.

Assessing Startup Funding Channels Companys Financial Comparison With Income Statement Elements PDF
This slide shows companys Financial Comparison based on certain parameters like revenue, EBIT, net cash flows, total assets, working capital etc. from the years 2020 to 2024 Slidegeeks is one of the best resources for PowerPoint templates. You can download easily and regulate Assessing Startup Funding Channels Companys Financial Comparison With Income Statement Elements PDF for your personal presentations from our wonderful collection. A few clicks is all it takes to discover and get the most relevant and appropriate templates. Use our Templates to add a unique zing and appeal to your presentation and meetings. All the slides are easy to edit and you can use them even for advertisement purposes.
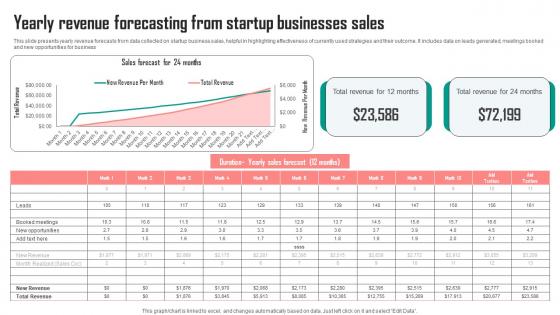
Yearly Revenue Forecasting From Startup Businesses Sales Graphics Pdf
This slide presents yearly revenue forecasts from data collected on startup business sales, helpful in highlighting effectiveness of currently used strategies and their outcome. It includes data on leads generated, meetings booked and new opportunities for business Pitch your topic with ease and precision using this Yearly Revenue Forecasting From Startup Businesses Sales Graphics Pdf. This layout presents information on Sales, Total Revenue, Months. It is also available for immediate download and adjustment. So, changes can be made in the color, design, graphics or any other component to create a unique layout. This slide presents yearly revenue forecasts from data collected on startup business sales, helpful in highlighting effectiveness of currently used strategies and their outcome. It includes data on leads generated, meetings booked and new opportunities for business
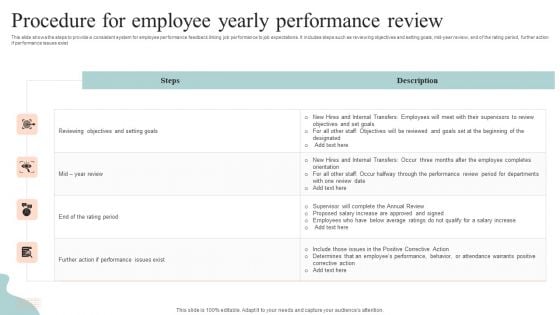
Procedure For Employee Yearly Performance Review Introduction PDF
This slide shows the steps to provide a consistent system for employee performance feedback linking job performance to job expectations. It includes steps such as reviewing objectives and setting goals, mid year review, end of the rating period, further action if performance issues exist. Pitch your topic with ease and precision using this Procedure For Employee Yearly Performance Review Introduction PDF. This layout presents information on Performance Review, Reviewing Objectives, Setting Goals. It is also available for immediate download and adjustment. So, changes can be made in the color, design, graphics or any other component to create a unique layout.

3 Years Ecommerce Brand Promotion Plan Timeline Slides PDF
This slide covers three year plan for ecommerce marketplace for promotion and sale of branded products. It includes user experience, promotion strategies, merchandising, infrastructure and testing. Pitch your topic with ease and precision using this 3 Years Ecommerce Brand Promotion Plan Timeline Slides PDF. This layout presents information on Infrastructure, Optimize Server Serialization, Database Improvements. It is also available for immediate download and adjustment. So, changes can be made in the color, design, graphics or any other component to create a unique layout.
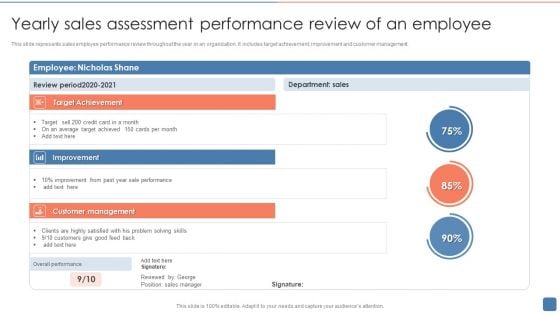
Yearly Sales Assessment Performance Review Of An Employee Professional PDF
This slide represents sales employee performance review throughout the year in an organization. It includes target achievement, improvement and customer management. Pitch your topic with ease and precision using this Yearly Sales Assessment Performance Review Of An Employee Professional PDF. This layout presents information on Improvement, Customer Management, Target Achievement. It is also available for immediate download and adjustment. So, changes can be made in the color, design, graphics or any other component to create a unique layout.
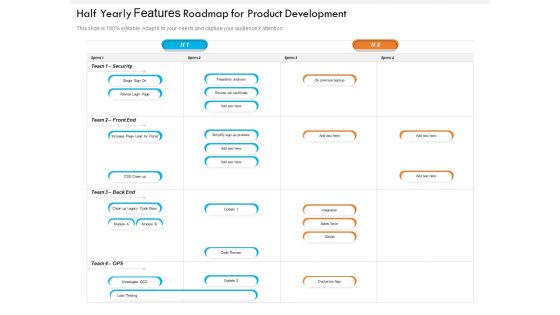
Half Yearly Features Roadmap For Product Development Diagrams
We present our half yearly features roadmap for product development diagrams. This PowerPoint layout is easy-to-edit so you can change the font size, font type, color, and shape conveniently. In addition to this, the PowerPoint layout is Google Slides compatible, so you can share it with your audience and give them access to edit it. Therefore, download and save this well-researched half yearly features roadmap for product development diagrams in different formats like PDF, PNG, and JPG to smoothly execute your business plan.

Gaming Application Feature Launch Five Years Roadmap Microsoft
We present our gaming application feature launch five years roadmap microsoft. This PowerPoint layout is easy-to-edit so you can change the font size, font type, color, and shape conveniently. In addition to this, the PowerPoint layout is Google Slides compatible, so you can share it with your audience and give them access to edit it. Therefore, download and save this well-researched gaming application feature launch five years roadmap microsoft in different formats like PDF, PNG, and JPG to smoothly execute your business plan.
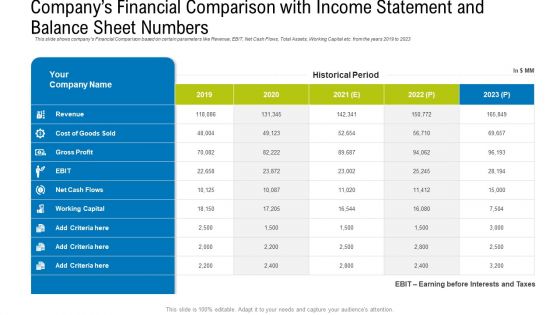
Companys Financial Comparison With Income Statement And Balance Sheet Numbers Aids PDF
This slide shows companys Financial Comparison based on certain parameters like Revenue, EBIT, Net Cash Flows, Total Assets, Working Capital etc. from the years 2019 to 2023.Deliver and pitch your topic in the best possible manner with this companys financial comparison with income statement and balance sheet numbers demonstration pdf. Use them to share invaluable insights on gross profit, cost of goods sold, revenue, 2019 to 2023 and impress your audience. This template can be altered and modified as per your expectations. So, grab it now.
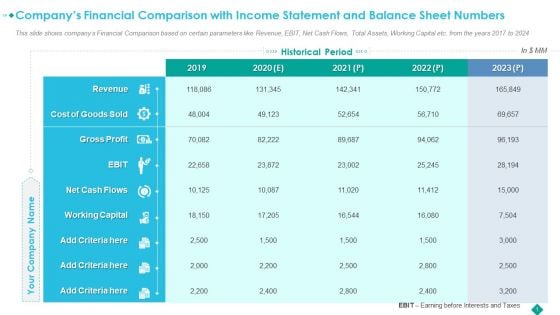
Companys Financial Comparison With Income Statement And Balance Sheet Numbers Brochure PDF
This slide shows companys Financial Comparison based on certain parameters like Revenue, EBIT, Net Cash Flows, Total Assets, Working Capital etc. from the years 2017 to 2024.Deliver and pitch your topic in the best possible manner with this companys financial comparison with income statement and balance sheet numbers brochure pdf. Use them to share invaluable insights on gross profit, revenue, cost of goods sold, 2019 to 2023 and impress your audience. This template can be altered and modified as per your expectations. So, grab it now.
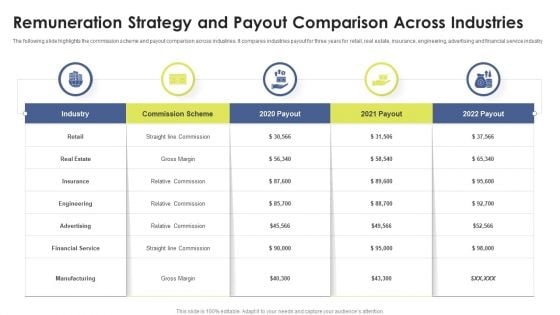
Remuneration Strategy And Payout Comparison Across Industries Ppt Layouts Example Topics PDF
The following slide highlights the commission scheme and payout comparison across industries. It compares industries payout for three years for retail, real estate, insurance, engineering, advertising and financial service industry. Persuade your audience using this Remuneration Strategy And Payout Comparison Across Industries Ppt Layouts Example Topics PDF. This PPT design covers five stages, thus making it a great tool to use. It also caters to a variety of topics including Industry, Commission Scheme, 2020 Payout, 2021 Payout, 2022 Payout. Download this PPT design now to present a convincing pitch that not only emphasizes the topic but also showcases your presentation skills.


 Continue with Email

 Home
Home


