Budget Chart
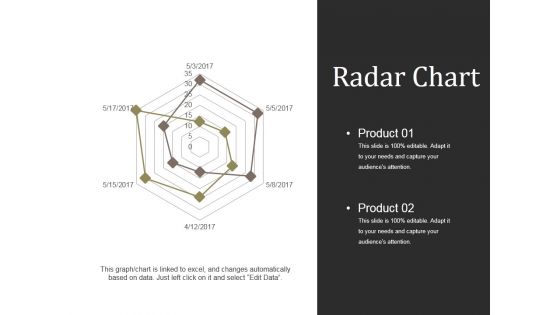
Radar Chart Ppt PowerPoint Presentation Model Picture
This is a radar chart ppt powerpoint presentation model picture. This is a six stage process. The stages in this process are product, finance marketing, business, management, analysis.
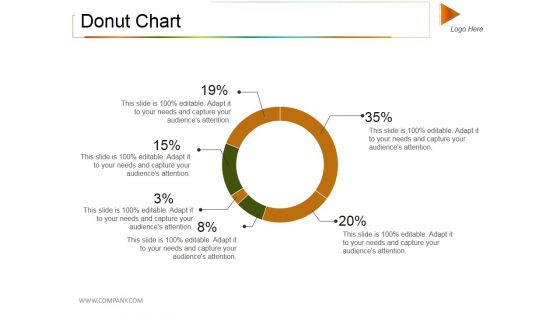
Donut Chart Ppt PowerPoint Presentation Model Rules
This is a donut chart ppt powerpoint presentation model rules. This is a six stage process. The stages in this process are donut, percentage, finance, business, marketing.
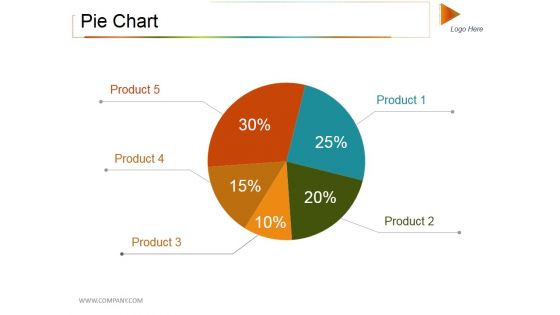
Pie Chart Ppt PowerPoint Presentation Styles Objects
This is a pie chart ppt powerpoint presentation styles objects. This is a five stage process. The stages in this process are pie, process, percentage, finance, business.
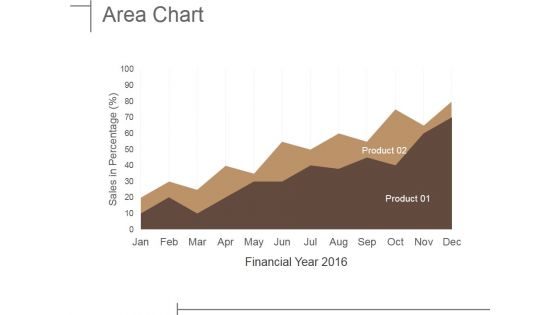
Area Chart Ppt PowerPoint Presentation Ideas Guide
This is a area chart ppt powerpoint presentation ideas guide. This is a two stage process. The stages in this process are growth, finance, success, business, marketing.
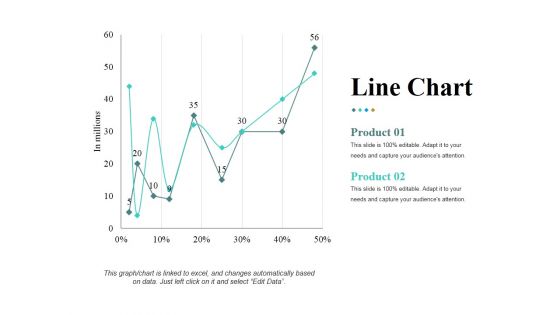
Line Chart Ppt PowerPoint Presentation Pictures Ideas
This is a line chart ppt powerpoint presentation pictures ideas. This is a two stage process. The stages in this process are in millions, percentage, finance, product, growth.
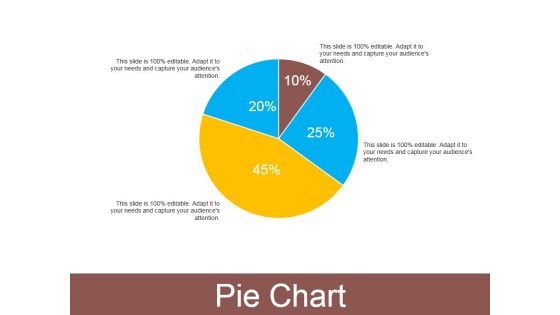
Pie Chart Ppt PowerPoint Presentation Outline Smartart
This is a pie chart ppt powerpoint presentation outline smartart. This is a four stage process. The stages in this process are pie, process, percentage, finance, business.
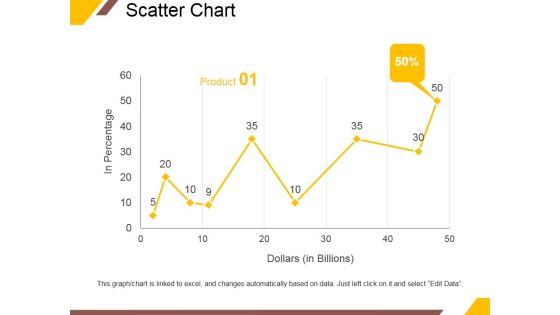
Scatter Chart Ppt PowerPoint Presentation Gallery Vector
This is a scatter chart ppt powerpoint presentation gallery vector. This is a nine stage process. The stages in this process are in percentage, dollars, product, percentage, finance.
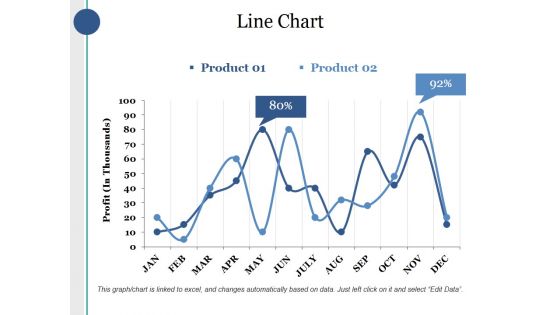
Line Chart Ppt PowerPoint Presentation Layouts Sample
This is a line chart ppt powerpoint presentation layouts sample. This is a two stage process. The stages in this process are product, profit, percentage, finance, business.
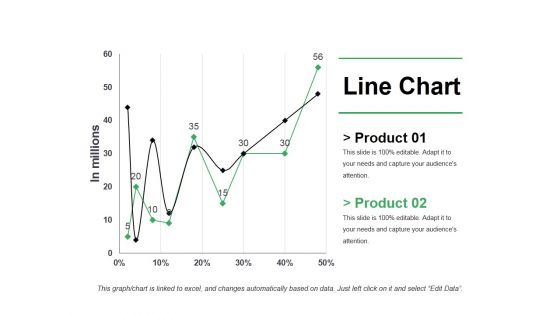
Line Chart Ppt PowerPoint Presentation Pictures Shapes
This is a line chart ppt powerpoint presentation pictures shapes. This is a two stage process. The stages in this process are business, marketing, strategy, finance, growth.
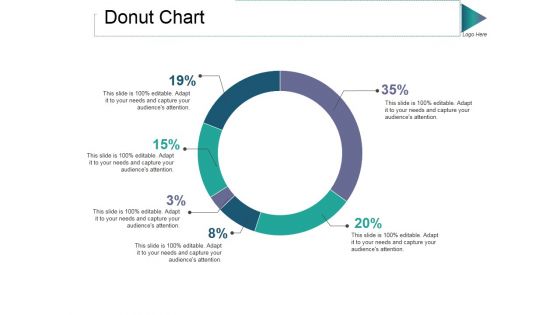
Donut Chart Ppt PowerPoint Presentation Gallery Guide
This is a donut chart ppt powerpoint presentation gallery guide. This is a six stage process. The stages in this process are percentage, finance, donut, business, process.
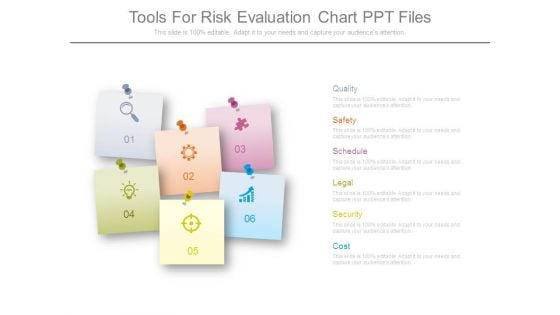
Tools For Risk Evaluation Chart Ppt Files
This is a tools for risk evaluation chart ppt files. This is a six stage process. The stages in this process are quality, safety, schedule, legal, security, cost.
Stock Chart Ppt PowerPoint Presentation Inspiration Icon
This is a stock chart ppt powerpoint presentation inspiration icon. This is a two stage process. The stages in this process are high, volume, low, product, close.
Stock Chart Ppt PowerPoint Presentation Icon Format
This is a stock chart ppt powerpoint presentation icon format. This is a two stage process. The stages in this process are product, close, high, volume, low.
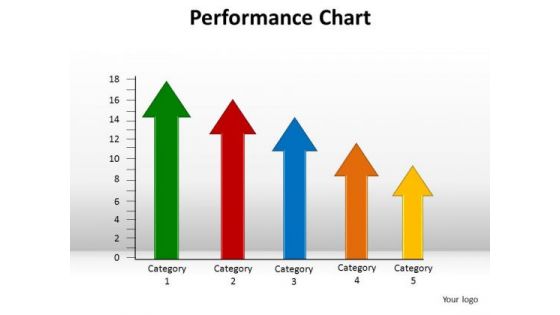
PowerPoint Layouts Graphic Performance Chart Ppt Design
PowerPoint Layouts Graphic Performance Chart PPT Design-Explore the various directions and layers existing in your in your plans and processes. Unravel the desired and essential elements of your overall strategy. Explain the relevance of the different layers and stages and directions in getting down to your core competence, ability and desired result. Step on it with our PowerPoint Layouts Graphic Performance Chart Ppt Design. Escalate the process with our PowerPoint Layouts Graphic Performance Chart Ppt Design.

Value Production Flow Chart Presentation Powerpoint
This is a value production flow chart presentation powerpoint. This is a three stage process. The stages in this process are value production, cost, revenue, profit.

Column Chart Ppt PowerPoint Presentation Ideas Inspiration
This is a column chart ppt powerpoint presentation ideas inspiration. This is a five stage process. The stages in this process are graph, year, business, marketing, product.
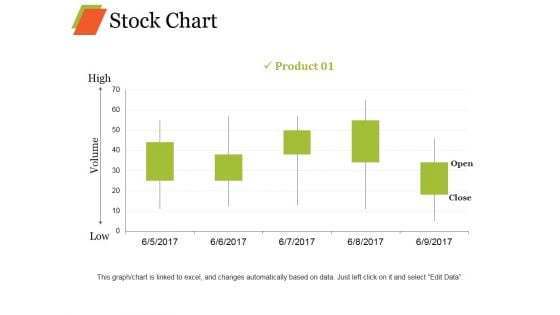
Stock Chart Ppt PowerPoint Presentation Professional Objects
This is a stock chart ppt powerpoint presentation professional objects. This is a five stage process. The stages in this process are product, high, volume, low, open, close.
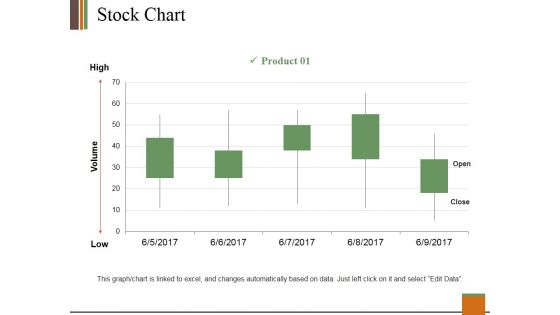
Stock Chart Ppt PowerPoint Presentation Slides Clipart
This is a stock chart ppt powerpoint presentation slides clipart. This is a one stage process. The stages in this process are product, high, volume, low, open, close.
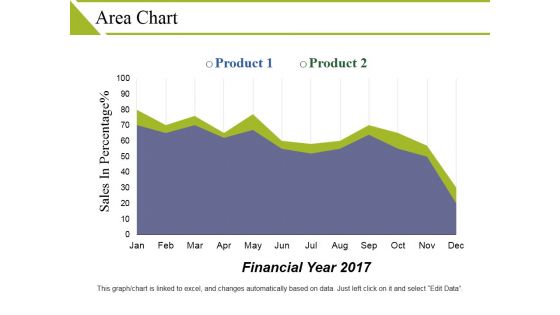
Area Chart Ppt PowerPoint Presentation Outline Objects
This is a area chart ppt powerpoint presentation outline objects. This is a two stage process. The stages in this process are product, sales in percentage, financial year.
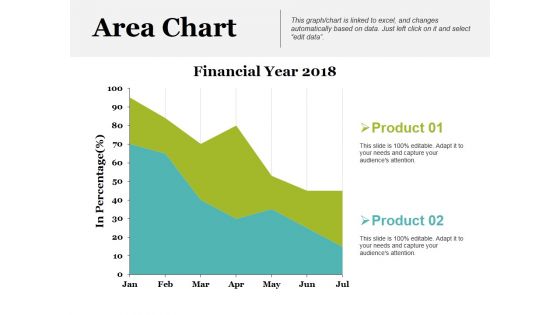
Area Chart Ppt PowerPoint Presentation Show Backgrounds
This is a area chart ppt powerpoint presentation show backgrounds. This is a two stage process. The stages in this process are financial year, product, in percentage.
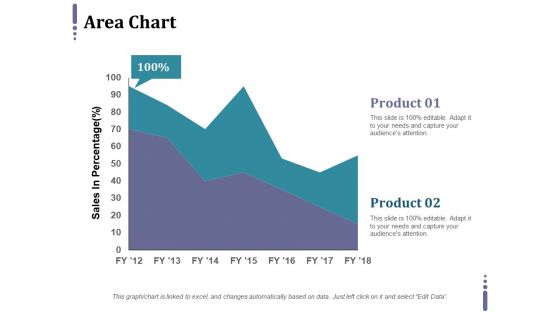
Area Chart Ppt PowerPoint Presentation Professional Grid
This is a area chart ppt powerpoint presentation professional grid. This is a two stage process. The stages in this process are product, sales in percentage, business.
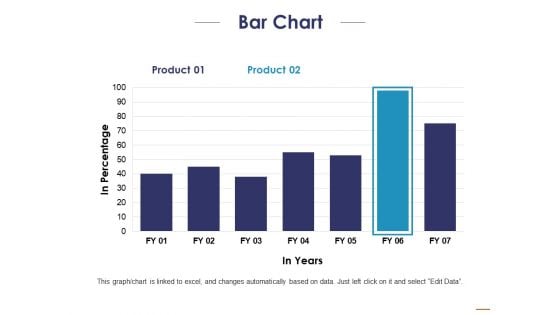
Bar Chart Ppt PowerPoint Presentation Portfolio Inspiration
This is a bar chart ppt powerpoint presentation portfolio inspiration. This is a two stage process. The stages in this process are product, in percentage, in years.

Stock Chart Ppt PowerPoint Presentation Layouts Outfit
This is a stock chart ppt powerpoint presentation layouts outfit. This is a two stage process. The stages in this process are close, high, volume, low, open.
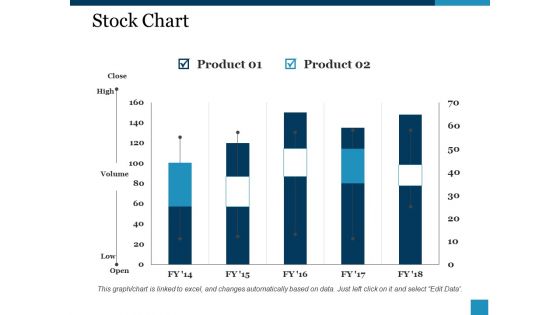
Stock Chart Ppt PowerPoint Presentation Guide
This is a stock chart ppt powerpoint presentation guide. This is a two stage process. The stages in this process are product, close, high, volume, low.
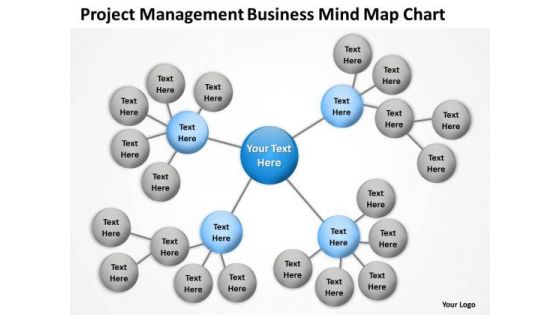
Timeline Project Management Business Mind Map Chart
You have all the ingredients to create the taste of sucess. Garnish your recipe with our Timeline Project Management Business Mind Map Chart and enhance its flavour. Our Timeline Project Management Business Mind Map Chart are created by innovative young minds. Gauranteed to fit presentations of all kinds.
Stock Chart Ppt PowerPoint Presentation Icon Microsoft
This is a stock chart ppt powerpoint presentation icon microsoft. This is a five stage process. The stages in this process are product, high, volume, low.
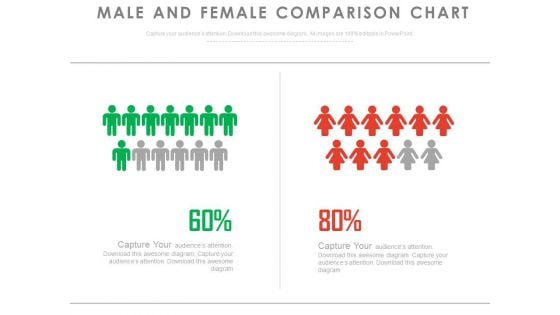
Male Female Ratio Compare Chart Powerpoint Slides
This PPT slide displays compare chart of male and female population ratio. This PowerPoint template can be customized as per requirements of business education or any other theme.
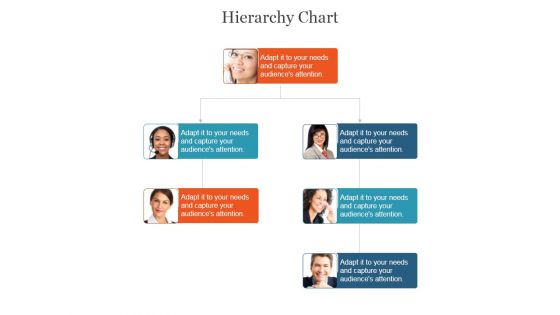
Hierarchy Chart Ppt PowerPoint Presentation Sample
This is a hierarchy chart ppt powerpoint presentation sample. This is a three stage process. The stages in this process are business, marketing, management, strategy, planning.
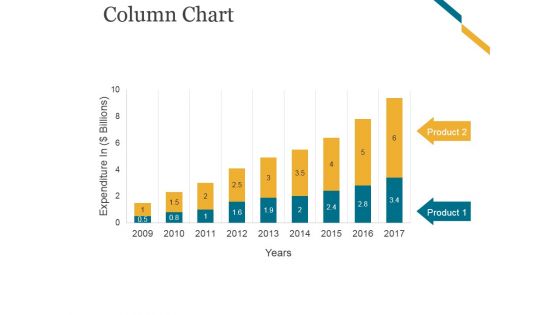
Column Chart Ppt PowerPoint Presentation Graphics
This is a column chart ppt powerpoint presentation graphics. This is a nine stage process. The stages in this process are business, marketing, growth, timeline, planning.
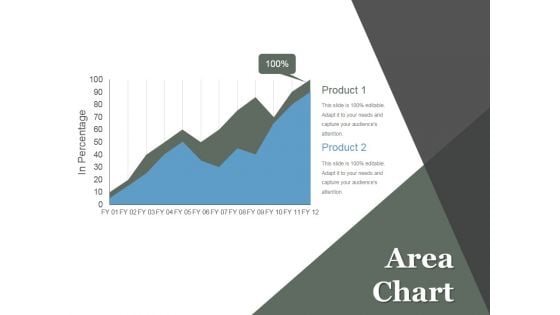
Area Chart Ppt PowerPoint Presentation Example File
This is a area chart ppt powerpoint presentation example file. This is a two stage process. The stages in this process are business, marketing, growth, planning, management.
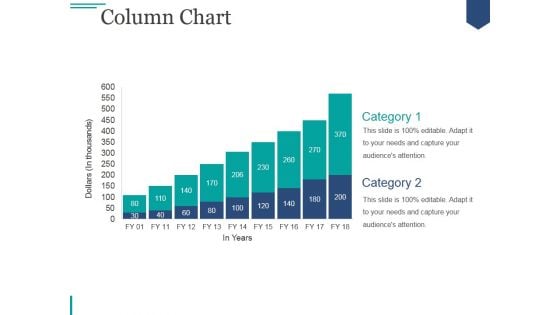
Column Chart Ppt PowerPoint Presentation Visuals
This is a column chart ppt powerpoint presentation visuals. This is a two stage process. The stages in this process are business, marketing, growth, strategy, planning.
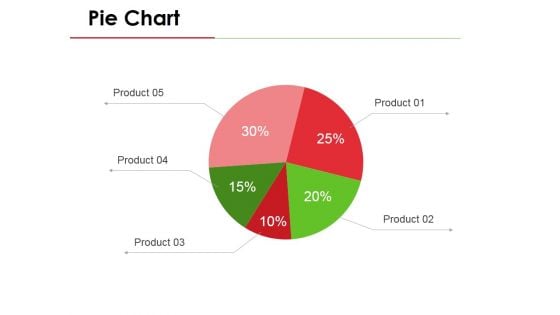
Pie Chart Ppt PowerPoint Presentation Ideas Mockup
This is a pie chart ppt powerpoint presentation ideas mockup. This is a five stage process. The stages in this process are business, marketing, process, planning, strategy.
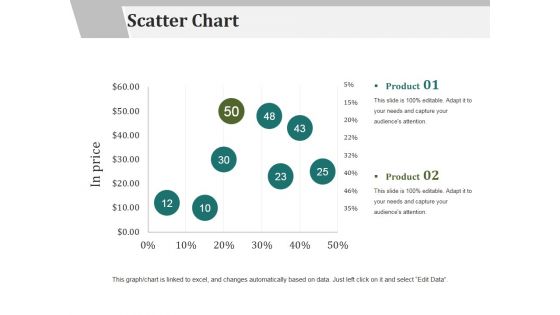
Scatter Chart Ppt PowerPoint Presentation Gallery Layout
This is a scatter chart ppt powerpoint presentation gallery layout. This is a two stage process. The stages in this process are financial, marketing, management, strategy, planning.
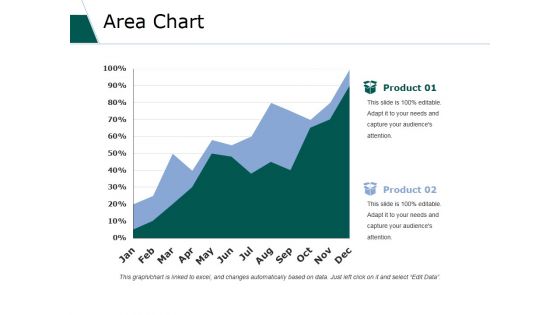
Area Chart Ppt PowerPoint Presentation Outline Microsoft
This is a area chart ppt powerpoint presentation outline microsoft. This is a two stage process. The stages in this process are business, marketing, strategy, planning, growth.
Area Chart Ppt PowerPoint Presentation Icon Good
This is a area chart ppt powerpoint presentation icon good. This is a two stage process. The stages in this process are business, marketing, growth, planning, strategy.
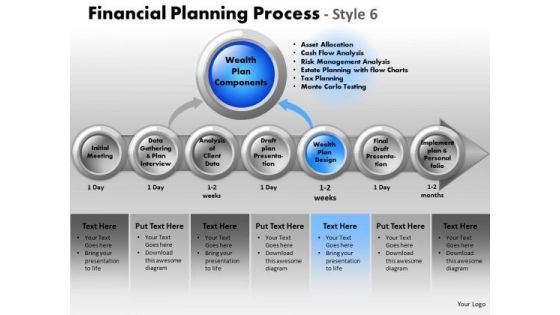
PowerPoint Backgrounds Chart Financial Planning Ppt Layout
PowerPoint Backgrounds Chart Financial Planning PPT Layout-These high quality powerpoint pre-designed slides and powerpoint templates have been carefully created by our professional team to help you impress your audience. All slides have been created and are 100% editable in powerpoint. Each and every property of any graphic - color, size, orientation, shading, outline etc. can be modified to help you build an effective powerpoint presentation. Any text can be entered at any point in the powerpoint template or slide. Simply DOWNLOAD, TYPE and PRESENT! You will find our PowerPoint Backgrounds Chart Financial Planning Ppt Layout are cut out for it. Designed to draw in audience appreciation.

Win Loss Analysis Chart Powerpoint Presentation Templates
This is a win loss analysis chart powerpoint presentation templates. This is a two stage process. The stages in this process are business, management, marketing, sales, funnel.
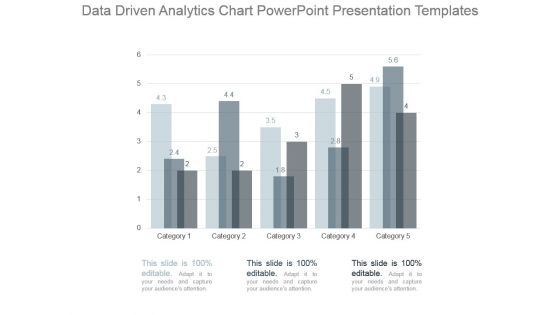
Data Driven Analytics Chart Powerpoint Presentation Templates
This is a data driven analytics chart powerpoint presentation templates. This is a five stage process. The stages in this process are category.
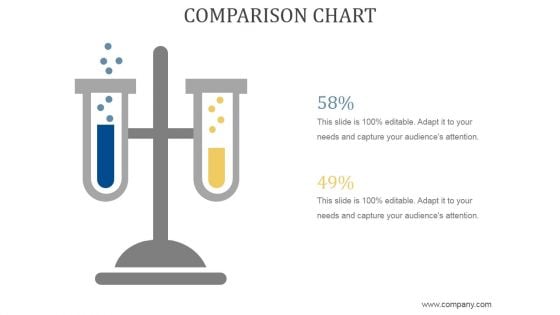
Comparison Chart Ppt PowerPoint Presentation Show
This is a comparison chart ppt powerpoint presentation show. This is a two stage process. The stages in this process are business, strategy, marketing, analysis, growth strategy, compare.
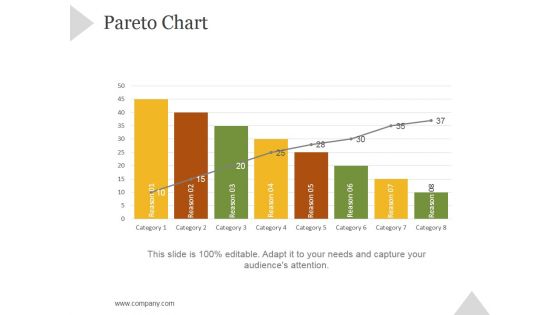
Pareto Chart Ppt PowerPoint Presentation Shapes
This is a pareto chart ppt powerpoint presentation shapes. This is a eight stage process. The stages in this process are business, strategy, marketing, success, growth strategy.
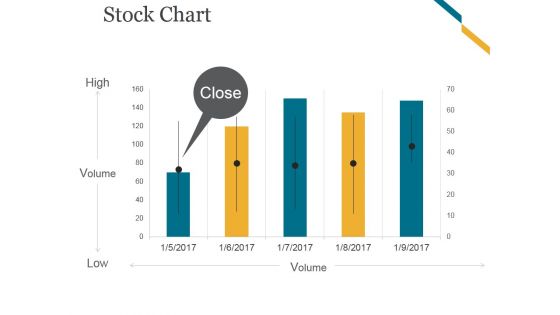
Stock Chart Ppt PowerPoint Presentation Infographics
This is a stock chart ppt powerpoint presentation infographics. This is a five stage process. The stages in this process are high, volume, low.
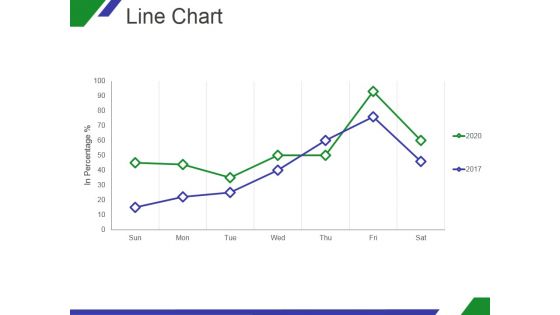
Line Chart Ppt PowerPoint Presentation Shapes
This is a line chart ppt powerpoint presentation shapes. This is a two stage process. The stages in this process are growth, in percentage, sun, mon, tue, wed.
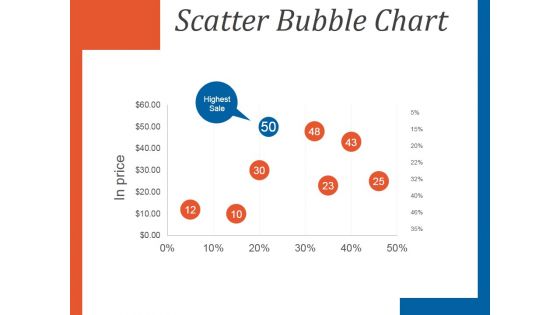
Scatter Bubble Chart Ppt PowerPoint Presentation Slides
This is a scatter bubble chart ppt powerpoint presentation slides. This is a eight stage process. The stages in this process are in price, highest sale, business, management.
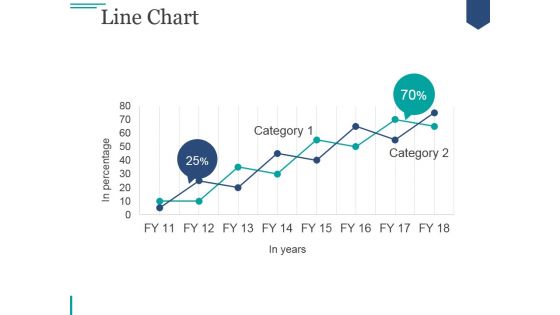
Line Chart Ppt PowerPoint Presentation Tips
This is a line chart ppt powerpoint presentation tips. This is a two stage process. The stages in this process are business, marketing, strategy, success, growth.

Stock Chart Ppt PowerPoint Presentation Topics
This is a stock chart ppt powerpoint presentation topics. This is a five stage process. The stages in this process are high, volume, low, volume.
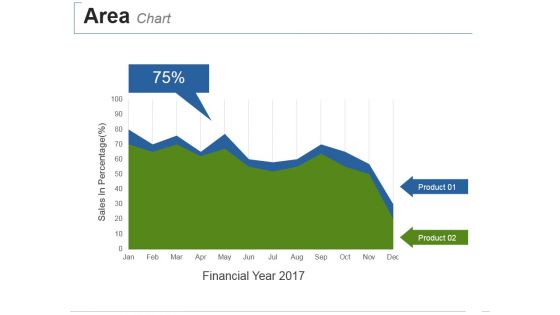
Area Chart Ppt PowerPoint Presentation Summary Deck
This is a area chart ppt powerpoint presentation summary deck. This is a two stage process. The stages in this process are sales in percentage, financial year.
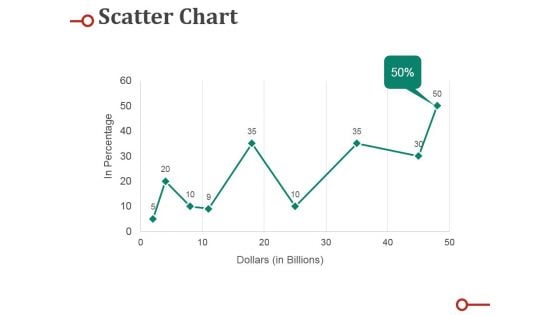
Scatter Chart Ppt PowerPoint Presentation Professional Deck
This is a scatter chart ppt powerpoint presentation professional deck. This is a nine stage process. The stages in this process are percentage, business, marketing, graph, line.
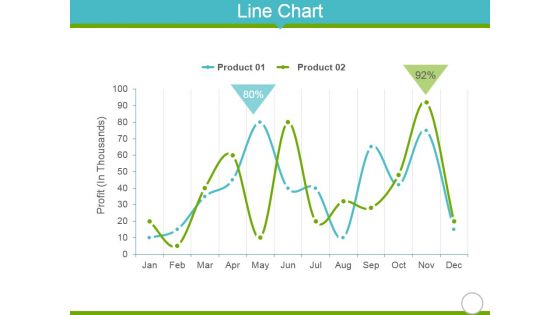
Line Chart Ppt Powerpoint Presentation Portfolio Clipart
This is a line chart ppt powerpoint presentation portfolio clipart. This is a two stage process. The stages in this process are jan, feb, mar, apr, may, jun.
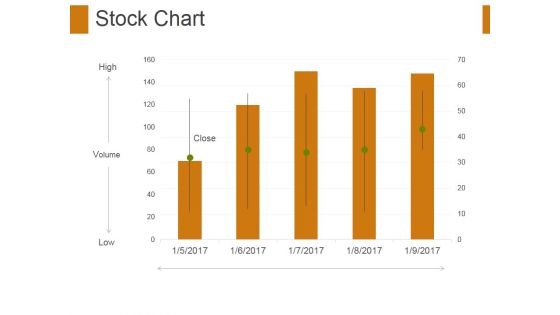
Stock Chart Ppt PowerPoint Presentation Gallery Files
This is a stock chart ppt powerpoint presentation gallery files. This is a five stage process. The stages in this process are high, volume, low, close.
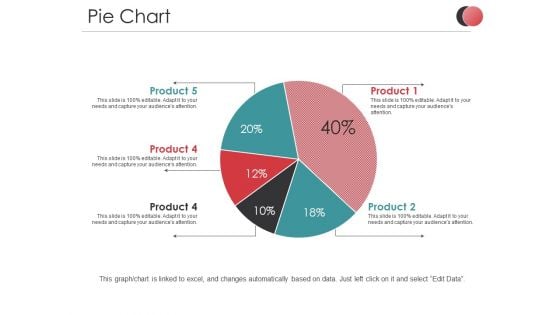
Pie Chart Ppt PowerPoint Presentation Slides Files
This is a pie chart ppt powerpoint presentation slides files. This is a five stage process. The stages in this process are product, percentage, business, marketing, process.
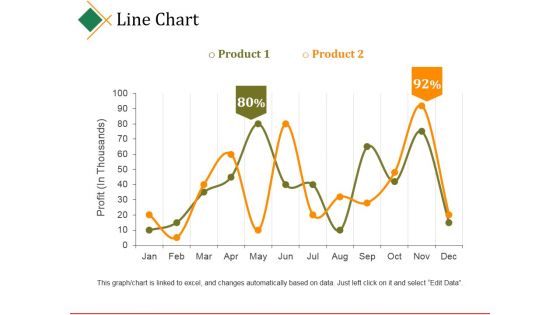
Line Chart Ppt PowerPoint Presentation Portfolio Shapes
This is a line chart ppt powerpoint presentation portfolio shapes. This is a two stage process. The stages in this process are profit, product, business, marketing, graph.
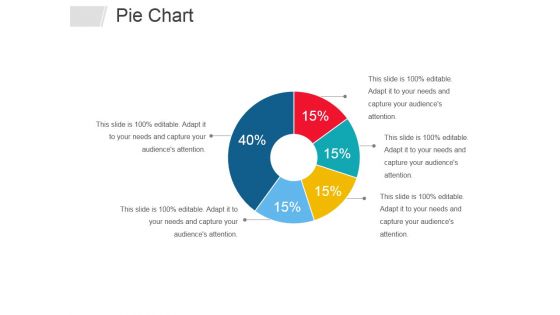
Pie Chart Ppt PowerPoint Presentation Infographics Templates
This is a pie chart ppt powerpoint presentation infographics templates. This is a five stage process. The stages in this process are business, percentage, management, process.
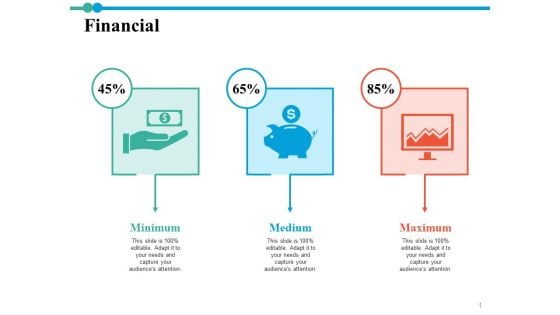
Financial Chart Ppt PowerPoint Presentation Outline Show
This is a financial chart ppt powerpoint presentation outline show. This is three stage process. The stages in this process are financial, minimum, medium, maximum.
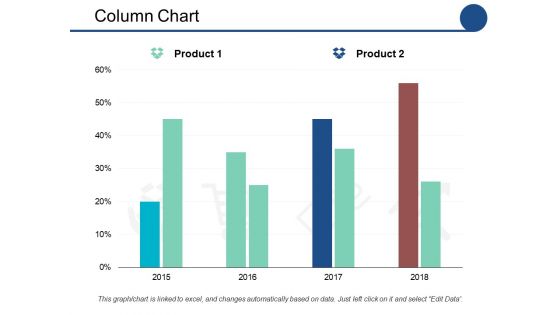
Column Chart Ppt PowerPoint Presentation Show Outfit
This is a column chart ppt powerpoint presentation show outfit. This is a two stage process. The stages in this process are product, percentage, marketing.
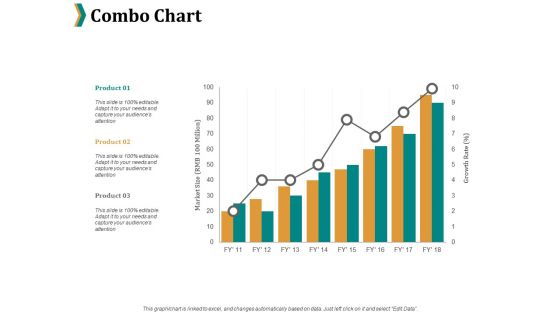
Combo Chart Ppt PowerPoint Presentation File Example
This is a combo chart ppt powerpoint presentation file example. This is a three stage process. The stages in this process are product, percentage, marketing, business, management.
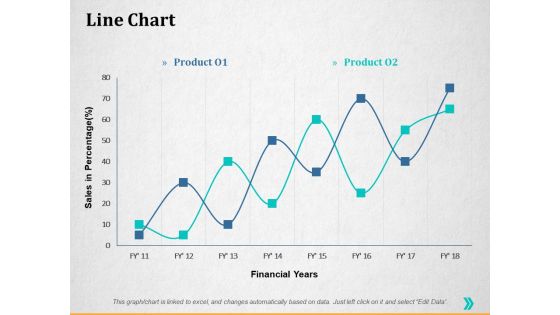
Line Chart Ppt PowerPoint Presentation Summary Guidelines
This is a line chart ppt powerpoint presentation summary guidelines. This is a two stage process. The stages in this process are percentage, product, business, management, marketing.
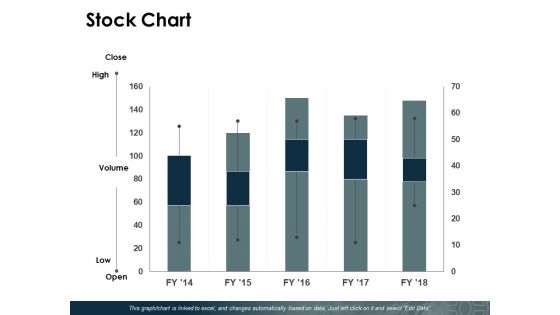
Stock Chart Ppt PowerPoint Presentation Show Pictures
This is a stock chart ppt powerpoint presentation show pictures. This is a five stage process. The stages in this process are product, percentage, management, marketing.

Pie Chart Ppt PowerPoint Presentation Model Smartart
This is a pie chart ppt powerpoint presentation model smartart. This is a five stage process. The stages in this process are management, marketing, business, percentage, product.
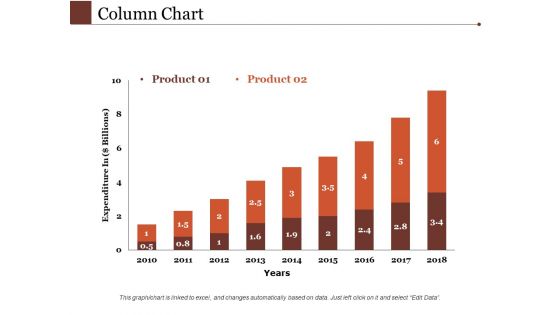
Column Chart Ppt PowerPoint Presentation Gallery Templates
This is a column chart ppt powerpoint presentation gallery templates. This is a two stage process. The stages in this process are management, marketing, business, percentage.
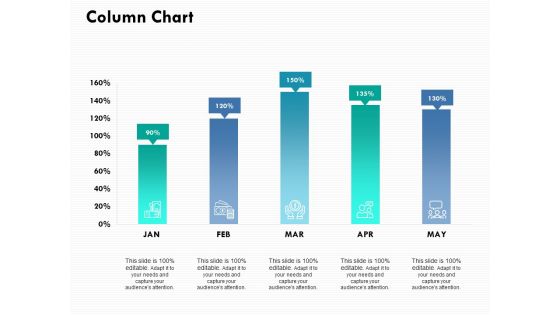
Column Chart Ppt PowerPoint Presentation Ideas Example
This is a column chart ppt powerpoint presentation ideas example. This is a five stage process. The stages in this process are percentage, product, management, marketing.


 Continue with Email

 Home
Home


