Budget Chart
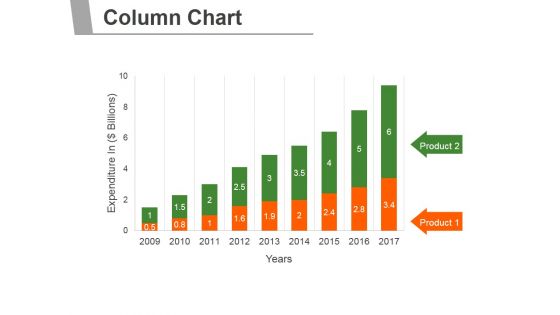
Column Chart Ppt PowerPoint Presentation Introduction
This is a column chart ppt powerpoint presentation introduction. This is a nine stage process. The stages in this process are business, marketing, management, growth, timeline.
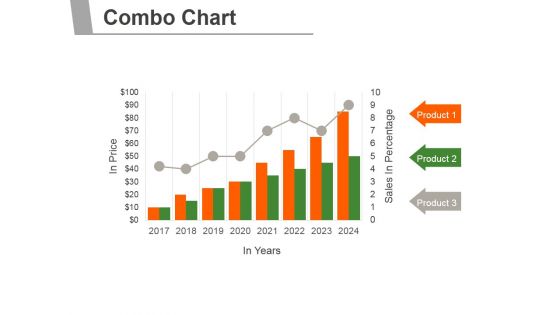
Combo Chart Ppt PowerPoint Presentation Inspiration
This is a combo chart ppt powerpoint presentation inspiration. This is a eight stage process. The stages in this process are business, marketing, management, growth, timeline.
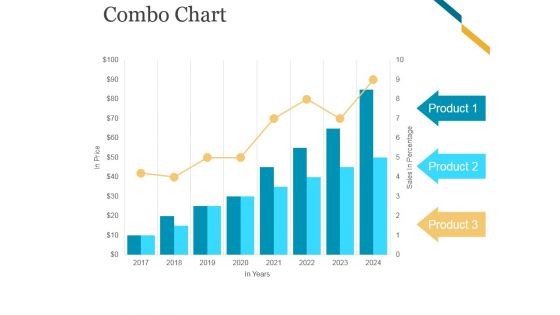
Combo Chart Ppt PowerPoint Presentation Files
This is a combo chart ppt powerpoint presentation files. This is a eight stage process. The stages in this process are business, marketing, growth, timeline, graph.
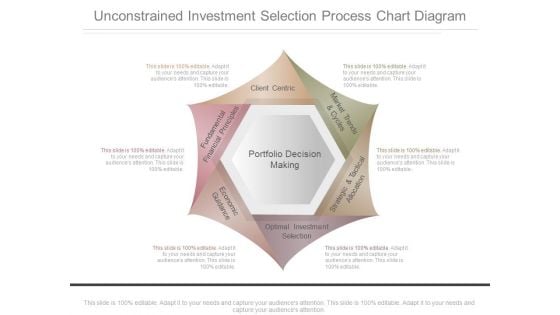
Unconstrained Investment Selection Process Chart Diagram
This is a unconstrained investment selection process chart diagram. This is a six stage process. The stages in this process are portfolio decision making, fundamental financial principles, client centric, economic guidance, optimal investment selection, strategic and tactical, allocation, market trends and cycles.
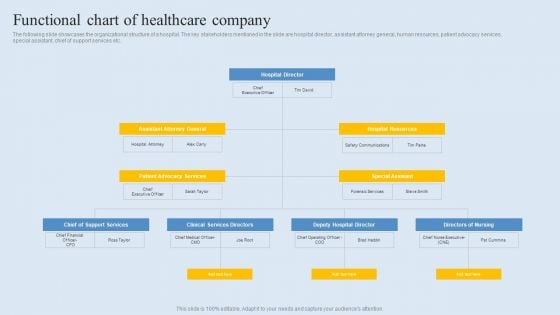
Functional Chart Of Healthcare Company Ideas PDF
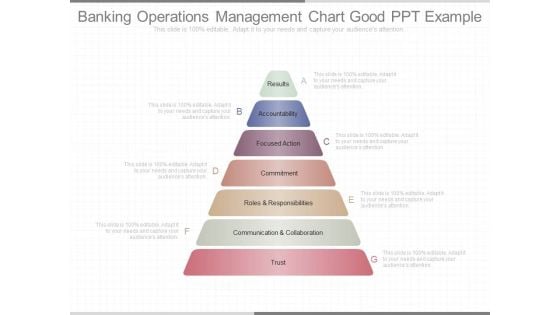
Banking Operations Management Chart Good Ppt Example
This is a banking operations management chart good ppt example. This is a seven stage process. The stages in this process are results, accountability, focused action, commitment, roles and responsibilities, communication and collaboration, trust.
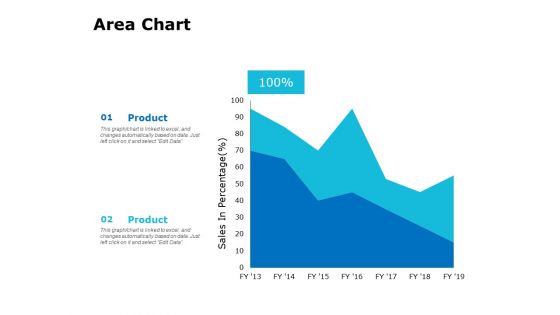
Area Chart Ppt PowerPoint Presentation Layouts Slide
Presenting this set of slides with name area chart ppt powerpoint presentation layouts slide. The topics discussed in these slide is area chart. This is a completely editable PowerPoint presentation and is available for immediate download. Download now and impress your audience.
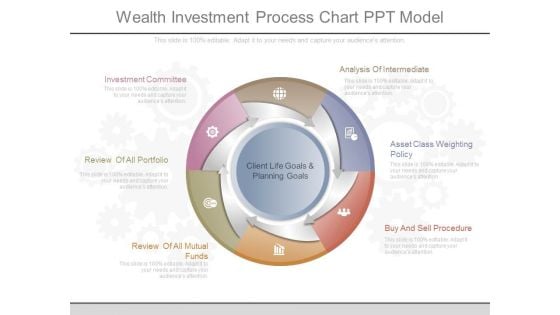
Wealth Investment Process Chart Ppt Model
This is a wealth investment process chart ppt model. This is a six stage process. The stages in this process are investment committee, review of all portfolio, review of all mutual funds, client life goals and planning goals, analysis of intermediate, asset class weighting policy, buy and sell procedure.
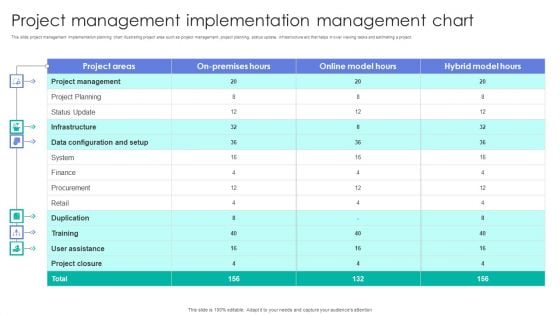
Project Management Implementation Management Chart Microsoft PDF
This slide project management implementation planning chart illustrating project area such as project management, project planning, status update, infrastructure etc that helps in over viewing tasks and estimating a project. Showcasing this set of slides titled Project Management Implementation Management Chart Microsoft PDF. The topics addressed in these templates are Retail, Finance, System. All the content presented in this PPT design is completely editable. Download it and make adjustments in color, background, font etc. as per your unique business setting.
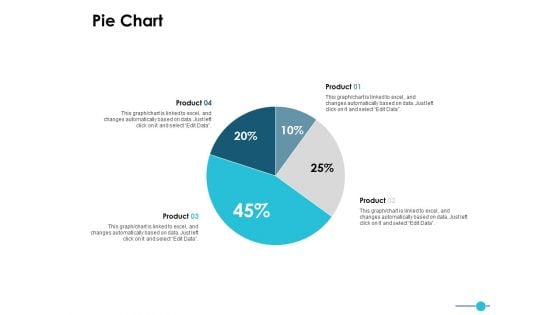
Pie Chart Finance Ppt PowerPoint Presentation Deck
This is a pie chart finance ppt powerpoint presentation deck. The topics discussed in this diagram are marketing, business, management, planning, strategy This is a completely editable PowerPoint presentation, and is available for immediate download.
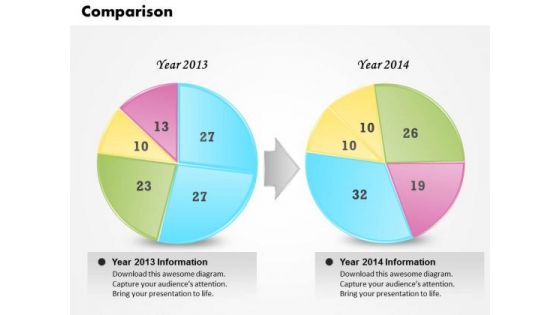
Business Framework PowerPoint Chart Variations PowerPoint Presentation
This image slide displays comparison chart template. This innovative image slide has been designed with pie charts to represent yearly progress. This image slide is 100% editable. You may change color, size and orientation of any icon to your liking. This image slide may be used in school, business and social presentations. Make your presentations interesting using this image slide.
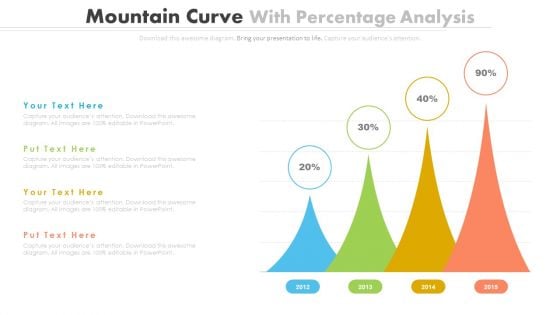
Percentage Data Growth Chart Powerpoint Slides
This PowerPoint template has been designed with percentage data growth chart. Download this PPT chart to depict financial ratio analysis. This PowerPoint slide is of great help in the business sector to make realistic presentations and provides effective way of presenting your newer thoughts.
Data Maturity Assessment Chart Icon Demonstration PDF
Persuade your audience using this Data Maturity Assessment Chart Icon Demonstration PDF. This PPT design covers three stages, thus making it a great tool to use. It also caters to a variety of topics including Data Maturity, Assessment Chart Icon. Download this PPT design now to present a convincing pitch that not only emphasizes the topic but also showcases your presentation skills.
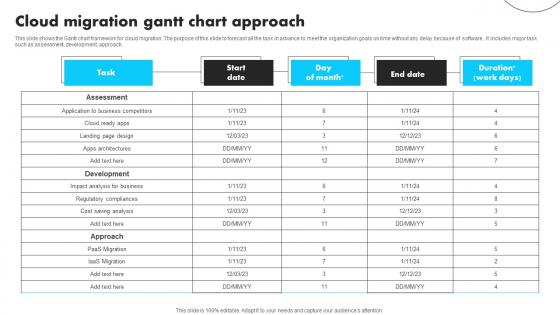
Cloud Migration Gantt Chart Approach Graphics Pdf
This slide shows the Gantt chart framework for cloud migration. The purpose of this slide to forecast all the task in advance to meet the organization goals on time without any delay because of software . It includes major task such as assessment, development, approach. Showcasing this set of slides titled Cloud Migration Gantt Chart Approach Graphics Pdf The topics addressed in these templates are Assessment, Development, Approach All the content presented in this PPT design is completely editable. Download it and make adjustments in color, background, font etc. as per your unique business setting. This slide shows the Gantt chart framework for cloud migration. The purpose of this slide to forecast all the task in advance to meet the organization goals on time without any delay because of software . It includes major task such as assessment, development, approach.

Ppt Linear Chart 7 Stages5 PowerPoint Templates
PPT linear chart 7 stages5 PowerPoint Templates-Use this 3d Arrow PPT slide to show the sequence of events in a story or describe the steps to be taken in a process. This image has been conceived to enable you to emphatically communicate your ideas in Counsel teams with our Ppt Linear Chart 7 Stages5 PowerPoint Templates. Download without worries with our money back guaranteee.
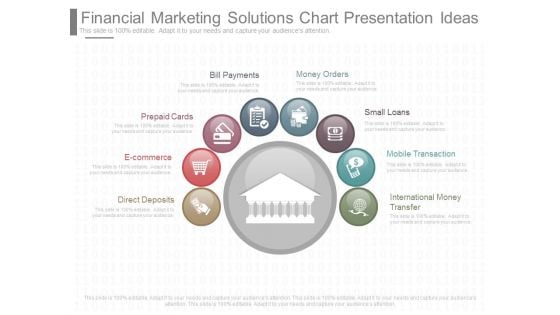
Financial Marketing Solutions Chart Presentation Ideas
This is a financial marketing solutions chart presentation ideas. This is a eight stage process. The stages in this process are direct deposits, e commerce, prepaid cards, bill payments, money orders, small loans, mobile transaction, international money transfer.
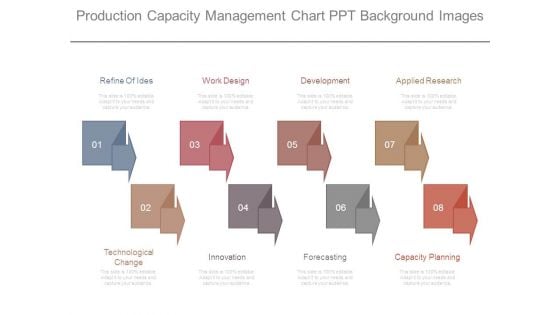
Production Capacity Management Chart Ppt Background Images
This is a production capacity management chart ppt background images. This is a eight stage process. The stages in this process are refine of ides, work design, development, applied research, technological change, innovation, forecasting, capacity planning.
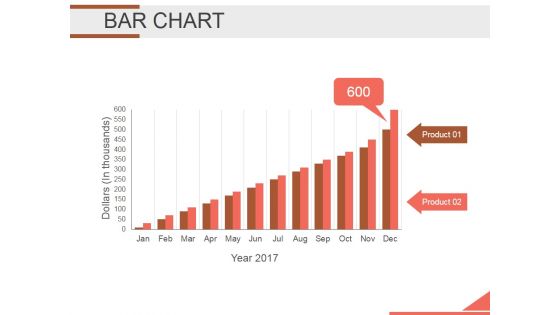
Bar Chart Ppt PowerPoint Presentation Background Designs
This is a bar chart ppt powerpoint presentation background designs. This is a twelve stage process. The stages in this process are bar graph, finance, marketing, strategy, analysis, investment.
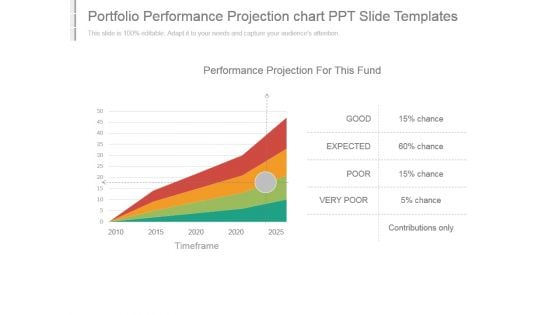
Portfolio Performance Projection Chart Ppt Slide Templates
This is a portfolio performance projection chart ppt slide templates. This is a four stage process. The stages in this process are performance projection for this fund, good, expected, poor, very poor, contributions only, timeframe.
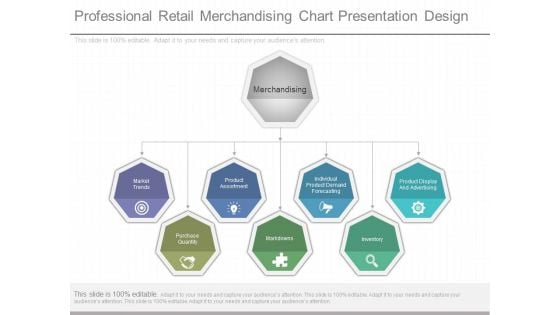
Professional Retail Merchandising Chart Presentation Design
This is a professional retail merchandising chart presentation design. This is a seven stage process. The stages in this process are market trends, product assortment, individual product demand forecasting, product display and advertising, inventory, markdowns, purchase quantity, merchandising.
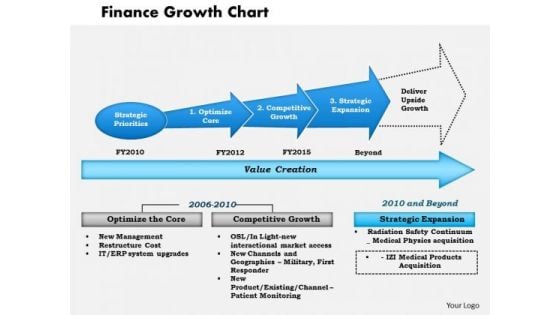
Business Framework Finance Growth Chart PowerPoint Presentation
This business framework PPT diagram has been crafted with graphic of linear arrow diagram. This PPT diagram contains the linear flow chart. This PPT diagram may be used for business strategy and finance transformation.
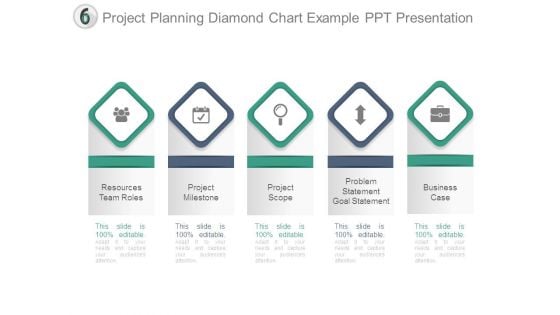
Project Planning Diamond Chart Example Ppt Presentation
This is a project planning diamond chart example ppt presentation. This is a five stage process. The stages in this process are resources team roles, project milestone, project scope, problem statement goal statement, business case.
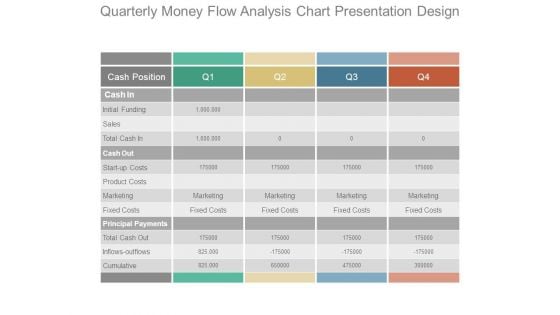
Quarterly Money Flow Analysis Chart Presentation Design
This is a quarterly money flow analysis chart presentation design. This is a four stage process. The stages in this process are cash position, cash in, initial funding, sales, total cash in, cash out, start up costs, product costs, marketing, fixed costs, principal payments, total cash out, inflows outflows, cumulative.
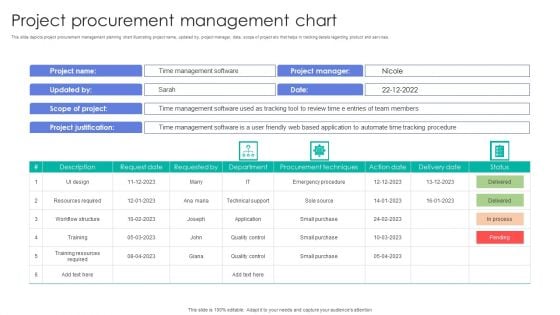
Project Procurement Management Chart Elements PDF
This slide depicts project procurement management planning chart illustrating project name, updated by, project manager, date, scope of project etc that helps in tracking details regarding product and services. Showcasing this set of slides titled Project Procurement Management Chart Elements PDF. The topics addressed in these templates are Design, Resources Required, Quality Control. All the content presented in this PPT design is completely editable. Download it and make adjustments in color, background, font etc. as per your unique business setting.
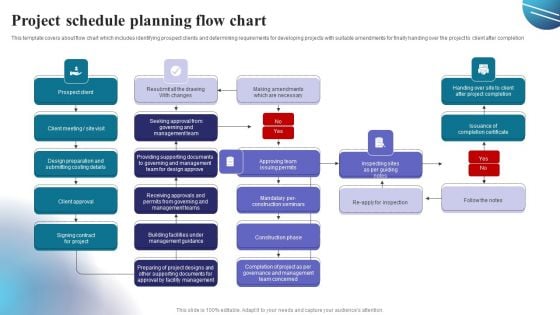
Project Schedule Planning Flow Chart Themes PDF
This template covers about flow chart which includes identifying prospect clients and determining requirements for developing projects with suitable amendments for finally handing over the project to client after completion. Showcasing this set of slides titled Project Schedule Planning Flow Chart Themes PDF. The topics addressed in these templates are Design, Management, Team. All the content presented in this PPT design is completely editable. Download it and make adjustments in color, background, font etc. as per your unique business setting.
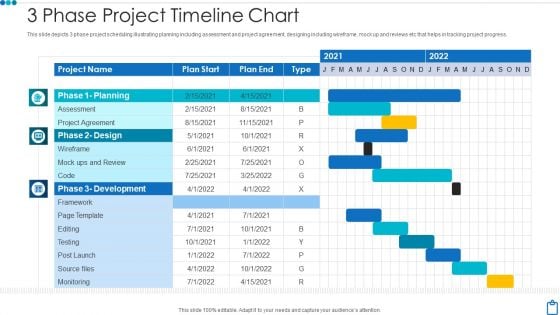
3 Phase Project Timeline Chart Diagrams PDF
This slide depicts 3 phase project scheduling illustrating planning including assessment and project agreement, designing including wireframe, mock up and reviews etc that helps in tracking project progress. Showcasing this set of slides titled 3 phase project timeline chart diagrams pdf. The topics addressed in these templates are 3 phase project timeline chart. All the content presented in this PPT design is completely editable. Download it and make adjustments in color, background, font etc. as per your unique business setting.
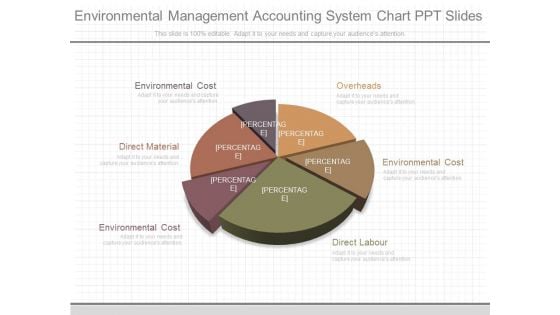
Environmental Management Accounting System Chart Ppt Slides
This is a environmental management accounting system chart ppt slides. This is a six stage process. The stages in this process are overheads, environmental cost, direct labour, environmental cost, direct material, environmental cost.
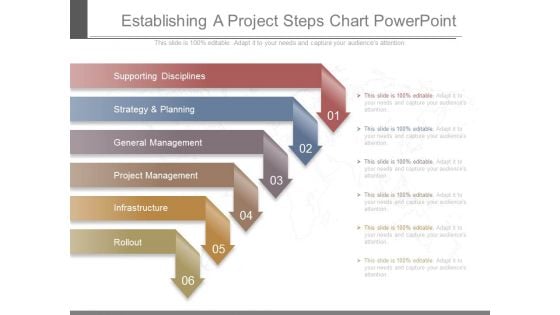
Establishing A Project Steps Chart Powerpoint
This is a establishing a project steps chart powerpoint. This is a six stage process. The stages in this process are supporting disciplines, strategy and planning, general management, project management, infrastructure, rollout.
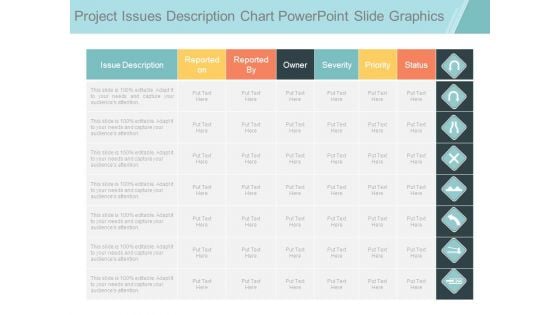
Project Issues Description Chart Powerpoint Slide Graphics
This is a project issues description chart powerpoint slide graphics. This is a seven stage process. The stages in this process are issue description, reported on, reported by, owner, severity, priority, status.

Project Issues Infogarphic Chart Ppt Examples Slides
This is a project issues infogarphic chart ppt examples slides. This is a seven stage process. The stages in this process are issue description, reported on, reported by, owner, severity, priority, status.
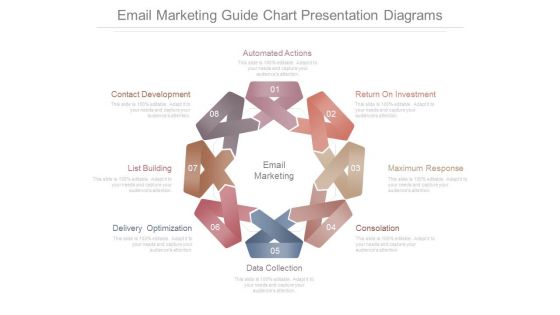
Email Marketing Guide Chart Presentation Diagrams
This is a email marketing guide chart presentation diagrams. This is a eight stage process. The stages in this process are automated actions, return on investment, maximum response, consolation, data collection, delivery optimization, list building, contact development, email marketing.
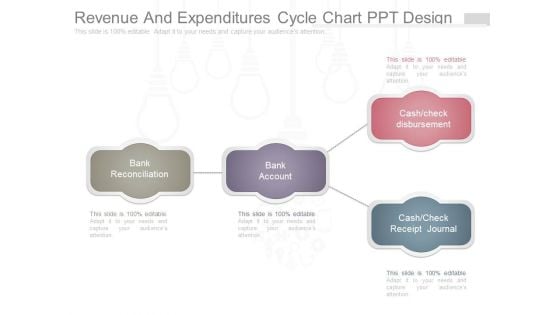
Revenue And Expenditures Cycle Chart Ppt Design
This is a revenue and expenditures cycle chart ppt design. This is a four stage process. The stages in this process are cash check disbursement, cash check receipt journal, bank account, bank reconciliation.
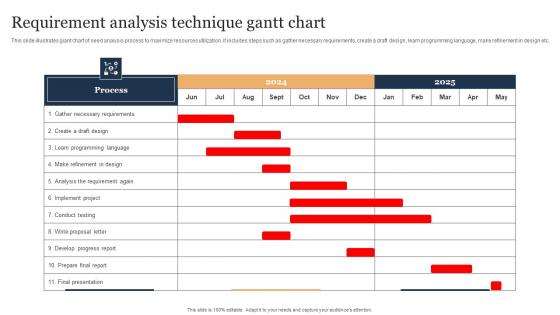
Requirement Analysis Technique Gantt Chart Guidelines Pdf
This slide illustrates giant chart of need analysis process to maximize resources utilization. It includes steps such as gather necessary requirements, create a draft design, learn programming language, make refinement in design etc. Pitch your topic with ease and precision using this Requirement Analysis Technique Gantt Chart Guidelines Pdf. This layout presents information on Requirement Analysis Technique, Resources Utilization, Learn Programming Language. It is also available for immediate download and adjustment. So, changes can be made in the color, design, graphics or any other component to create a unique layout. This slide illustrates giant chart of need analysis process to maximize resources utilization. It includes steps such as gather necessary requirements, create a draft design, learn programming language, make refinement in design etc.
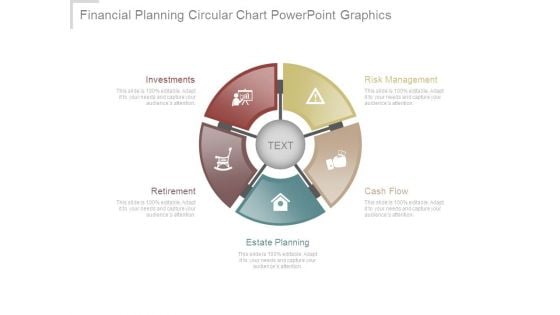
Financial Planning Circular Chart Powerpoint Graphics
This is a financial planning circular chart powerpoint graphics. This is a five stage process. The stages in this process are risk management, cash flow, estate planning, retirement, investments.
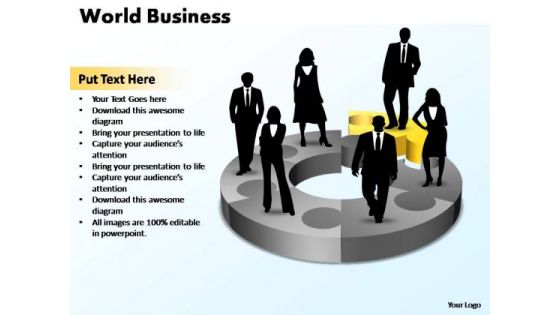
PowerPoint Template Chart World Business Ppt Slides
This diagram make your audience understand, essential elements of your overall strategy of business deal. Conceive plans with our PowerPoint Template Chart World Business Ppt Slides. Download without worries with our money back guaranteee.
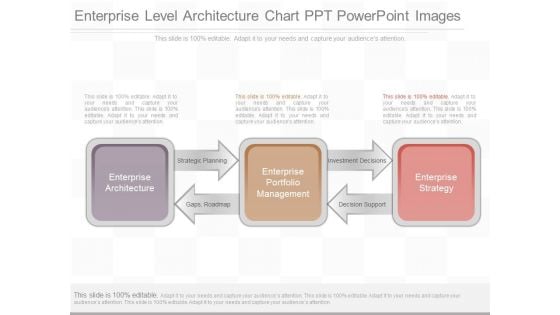
Enterprise Level Architecture Chart Ppt Powerpoint Images
This is a enterprise level architecture chart ppt powerpoint images. This is a three stage process. The stages in this process are enterprise architecture, strategic planning, gaps, roadmap, enterprise portfolio management, investment decisions, decision support, enterprise strategy.
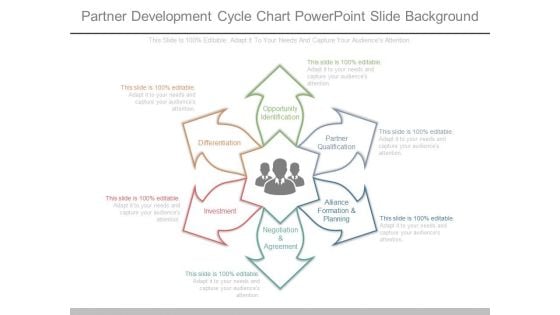
Partner Development Cycle Chart Powerpoint Slide Background
This is a partner development cycle chart powerpoint slide background. This is a six stage process. The stages in this process are opportunity identification, partner qualification, alliance formation and planning, negotiation and agreement, investment, differentiation.
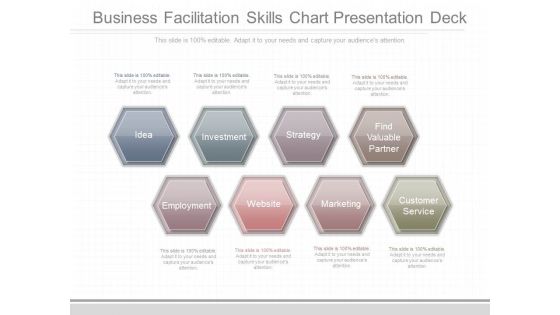
Business Facilitation Skills Chart Presentation Deck
This is a business facilitation skills chart presentation deck. This is a eight stage process. The stages in this process are idea, investment, strategy, find valuable partner, employment, website, marketing, customer service.
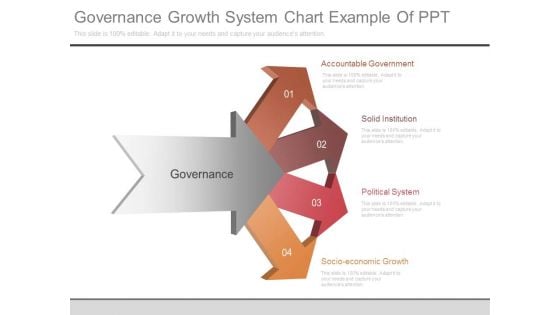
Governance Growth System Chart Example Of Ppt
This is a governance growth system chart example of ppt. This is a four stage process. The stages in this process are accountable government, solid institution, political system, socio economic growth, governance.
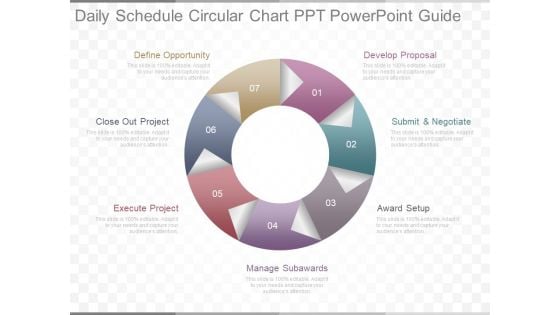
Daily Schedule Circular Chart Ppt Powerpoint Guide
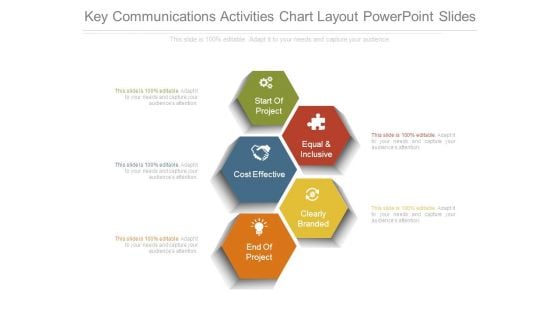
Key Communications Activities Chart Layout Powerpoint Slides
This is a key communications activities chart layout powerpoint slides. This is a five stage process. The stages in this process are start of project, cost effective, equal and inclusive, clearly branded, end of project.
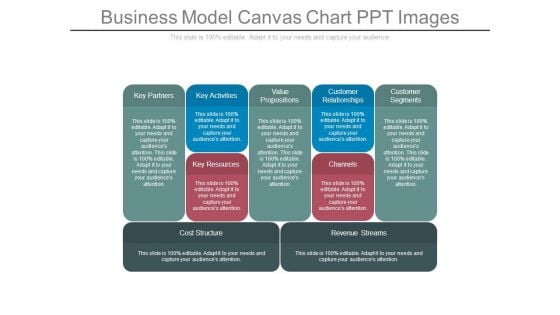
Business Model Canvas Chart Ppt Images
This is a business model canvas chart ppt images. This is a five stage process. The stages in this process are key partners, key activities, value propositions, customer relationships, customer segments, key resources, channels, cost structure, revenue streams.
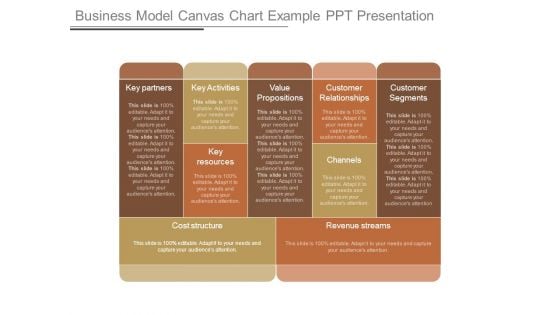
Business Model Canvas Chart Example Ppt Presentation
This is a business model canvas chart example ppt presentation. This is a five stage process. The stages in this process are key partners, key activities, value propositions, customer relationships, customer segments, key resources, channels, cost structure, revenue streams.
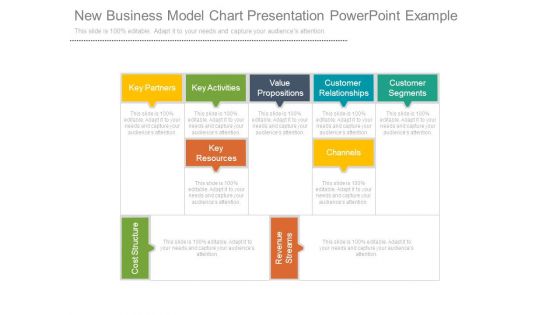
New Business Model Chart Presentation Powerpoint Example
This is a new business model chart presentation powerpoint example. This is a five stage process. The stages in this process are key partners, key activities, value propositions, customer, relationships, customer segments, key resources, channels, cost structure, revenue streams.
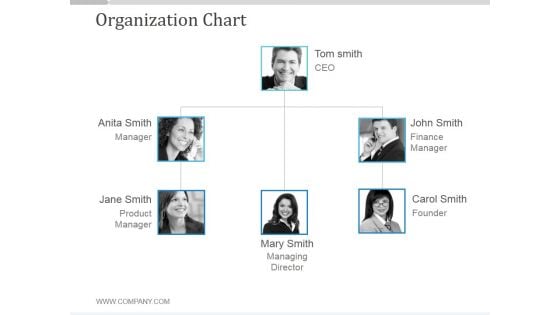
Organization Chart Ppt PowerPoint Presentation Backgrounds
This is a organization chart ppt powerpoint presentation backgrounds. This is a three stage process. The stages in this process are tom smith ceo, john smith finance manager, john smith finance manager, john smit finance manager.
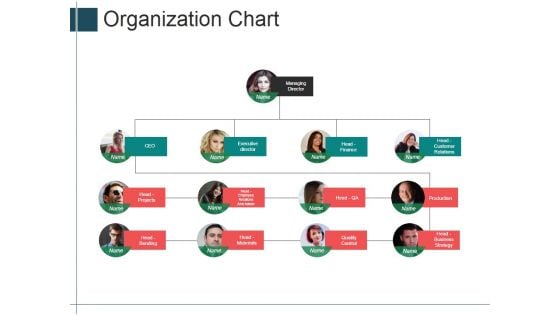
Organization Chart Ppt PowerPoint Presentation Portfolio Shapes
This is a organization chart ppt powerpoint presentation portfolio shapes. This is a four stage process. The stages in this process are managing director, executive director, head finance, head projects.
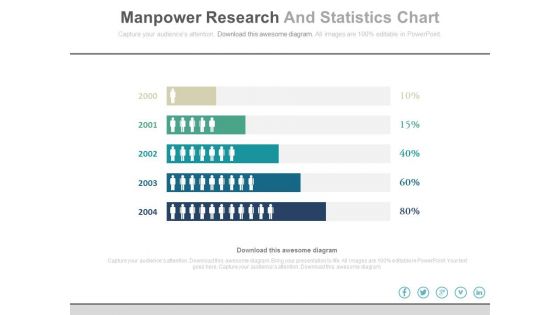
Manpower Research And Statistics Chart Powerpoint Slides
This PowerPoint template has been designed with yearly statistical chart with men icons. This PPT slide may be used for manpower research. Download this slide to build unique presentation.
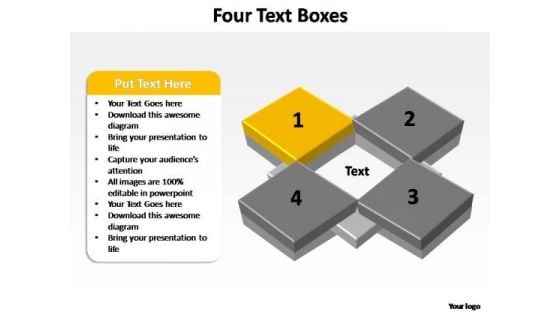
PowerPoint Design Chart Four Concepts Ppt Layouts
PowerPoint Design Chart Four Concepts PPT Layouts-The graphic is a symbol of growth and success. Display your ideas and highlight their ability to accelerate the growth of your company and you. Impress upon the audience how your strategy will carry all to the top of the corporate heap. Communicate goals with our PowerPoint Design Chart Four Concepts Ppt Layouts. Download without worries with our money back guaranteee.
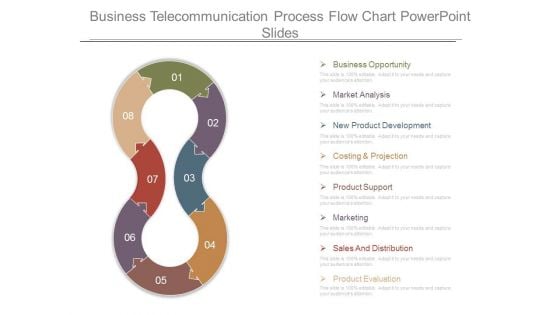
Business Telecommunication Process Flow Chart Powerpoint Slides
This is a business telecommunication process flow chart powerpoint slides. This is a eight stage process. The stages in this process are business opportunity, market analysis, new product development, costing and projection, product support, marketing, sales and distribution, product evaluation.
Bar Chart Ppt PowerPoint Presentation Icon Demonstration
This is a bar chart ppt powerpoint presentation icon demonstration. This is a seven stage process. The stages in this process are product, sales in percentage, financial year, graph.
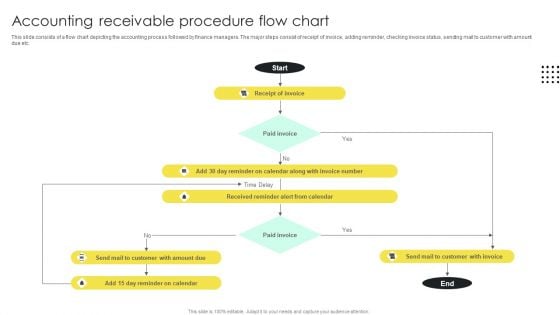
Accounting Receivable Procedure Flow Chart Inspiration PDF
This slide consists of a flow chart depicting the accounting process followed by finance managers. The major steps consist of receipt of invoice, adding reminder, checking invoice status, sending mail to customer with amount due etc. Showcasing this set of slides titled Accounting Receivable Procedure Flow Chart Inspiration PDF. The topics addressed in these templates are Invoice, Chart, Receivable. All the content presented in this PPT design is completely editable. Download it and make adjustments in color, background, font etc. as per your unique business setting.
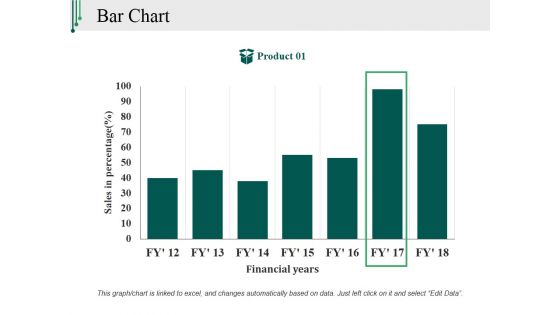
Bar Chart Ppt PowerPoint Presentation Outline Backgrounds
This is a bar chart ppt powerpoint presentation outline backgrounds. This is a one stage process. The stages in this process are sales in percentage, financial years, product, bar graph, finance.
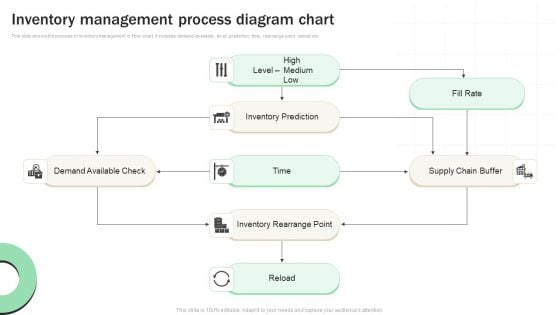
Inventory Management Process Diagram Chart Infographics PDF
This slide shows the process of inventory management in flow chart. It includes demand available, level, prediction, time, rearrange point, reload etc. Pitch your topic with ease and precision using this Inventory Management Process Diagram Chart Infographics PDF. This layout presents information on Demand Available Check, Inventory Rearrange Point, Supply Chain Buffer. It is also available for immediate download and adjustment. So, changes can be made in the color, design, graphics or any other component to create a unique layout.
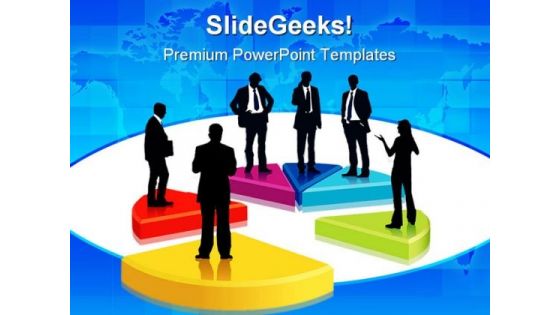
Pie Chart People PowerPoint Template 0810
Businesspeople are standing on a large broken graph conceptual business illustration. Our Pie Chart People PowerPoint Template 0810 have more than what meets the eye. They contain additional dimensions.
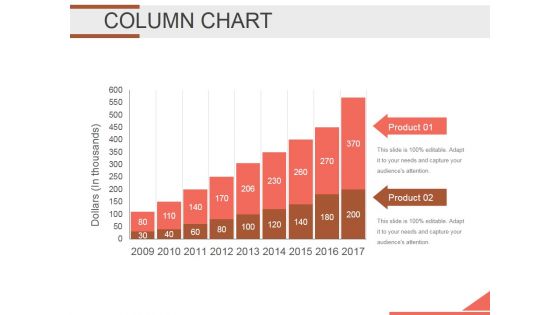
Column Chart Ppt PowerPoint Presentation Background Designs
This is a column chart ppt powerpoint presentation background designs. This is a two stage process. The stages in this process are bar graph, finance, marketing, strategy, analysis, business.
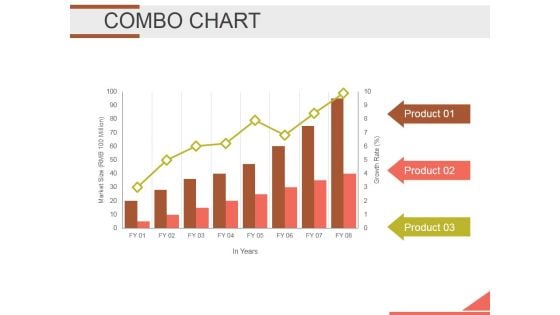
Combo Chart Ppt PowerPoint Presentation Infographics Infographics
This is a combo chart ppt powerpoint presentation infographics infographics. This is a three stage process. The stages in this process are bar graph, growth, finance, marketing, strategy, business.
Tracking Sales Performance Chart Ppt Example
This is a tracking sales performance chart ppt example. This is a eight stage process. The stages in this process are efficiency, effectiveness, profits, cost per sale, roi, profit sale, convert to sale, cost contact, conversion, contacts.
Bar Chart Ppt PowerPoint Presentation Portfolio Icons
This is a bar chart ppt powerpoint presentation portfolio icons. This is a seven stage process. The stages in this process are in years, in percentage, finance, business marketing.
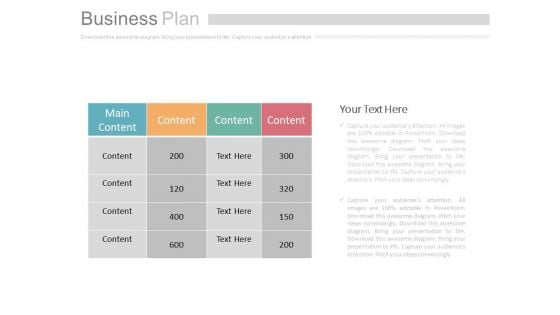
Table Chart For Business Plan Powerpoint Slides
Table chart has been used to design this power point template. This diagram may be used to display business plan. Download this template to leave permanent impression on your audience.
Area Chart Ppt PowerPoint Presentation Gallery Icons
This is a area chart ppt powerpoint presentation gallery icons. This is a two stage process. The stages in this process are financial year, sales in percentage, product, finance, graph.


 Continue with Email

 Home
Home


