Budget Chart
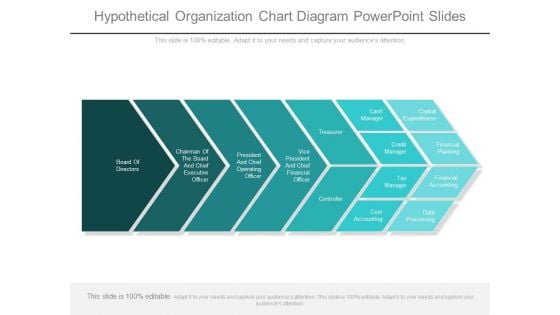
Hypothetical Organization Chart Diagram Powerpoint Slides
This is a hypothetical organization chart diagram powerpoint slides. This is a seven stage process. The stages in this process are board of directors, chairman of the board and chief executive officer, president and chief operating officer, vice president and chief financial officer, treasurer, controller, cash manager, capital expenditures, credit manager, financial planning, tax manager, financial accounting, cost accounting, data processing.

Business Exercise Flow Chart Powerpoint Presentation Examples
This is a business exercise flow chart powerpoint presentation examples. This is a six stage process. The stages in this process are talent management, planning for the future, leadership, recruitment and selection, information systems finance energy, pay and benefits, labor relations, training and development, time people talent knowledge.
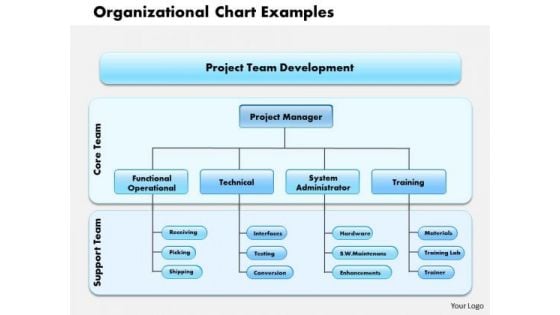
Business Framework Organizational Chart Examples PowerPoint Presentation
This image slide has been designed to display organizational charts. Use this image slide, in your presentations to depict business management. This image slide will enhance the quality of your presentations and will provide professional appearance to your presentations.
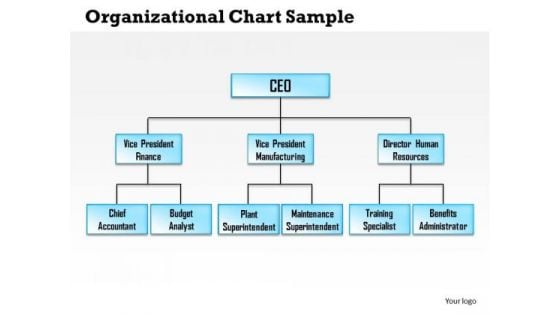
Business Framework Organizational Chart Sample PowerPoint Presentation
This image slide has been designed to display organizational flow chart. Use this image slide, in your presentations to depict higher post management in business. This image slide will enhance the quality of your presentations.
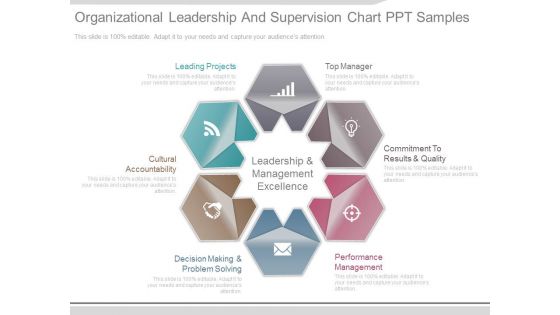
Organizational Leadership And Supervision Chart Ppt Samples
This is a organizational leadership and supervision chart ppt samples. This is a six stage process. The stages in this process are leading projects, top manager, commitment to results and quality, performance management, decision making and problem solving, cultural accountability, leadership and management excellence.
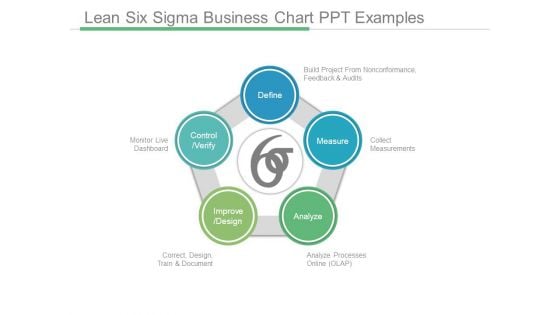
Lean Six Sigma Business Chart Ppt Examples
This is a lean six sigma business chart ppt examples. This is a five stage process. The stages in this process are define build project from nonconformance feedback and audits, measure collect measurements, analyze processes online olap, improve design correct design train and document, control verify monitor live dashboard.
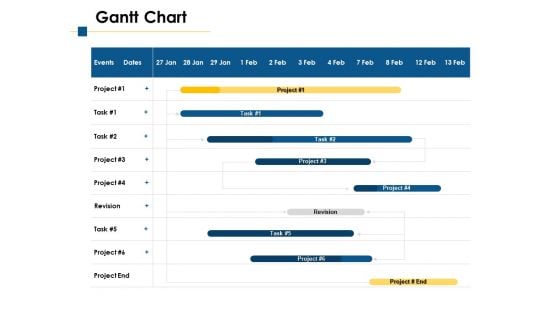
Gantt Chart Ppt PowerPoint Presentation File Skills
Presenting this set of slides with name gantt chart ppt powerpoint presentation file skills. The topics discussed in these slides are revision, project, event. This is a completely editable PowerPoint presentation and is available for immediate download. Download now and impress your audience.
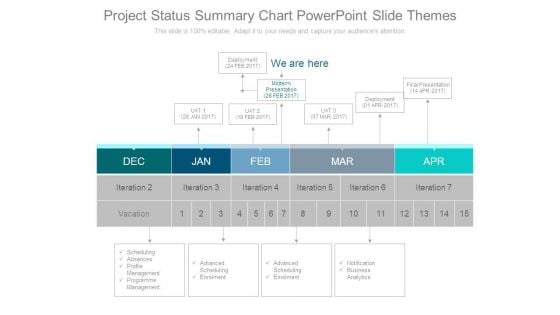
Project Status Summary Chart Powerpoint Slide Themes
This is a project status summary chart powerpoint slide themes. This is a five stage process. The stages in this process are deployment 24 feb 2017, we are here, midterm presentation 28 feb 2017, uat 1 28 jan 2017, uat 2 18 feb 2017, uat 3 07 mar 2017, deployment 01 apr 2017, final presentation 14 apr 2017, dec, jan, feb, mar, apr, iteration, scheduling absences profile management programme management, vacation, advanced scheduling enrolment, advanced scheduling enrolment, notification business analytics.
Project Tracking Gantt Chart Summary PDF
The following slide showcases the progress status of project tracking activities to achieve deliverables. It constitutes of weekly progress status of each project to assess the pending tasks. Showcasing this set of slides titled Project Tracking Gantt Chart Summary PDF. The topics addressed in these templates are Determine, Project, Review Design. All the content presented in this PPT design is completely editable. Download it and make adjustments in color, background, font etc. as per your unique business setting.
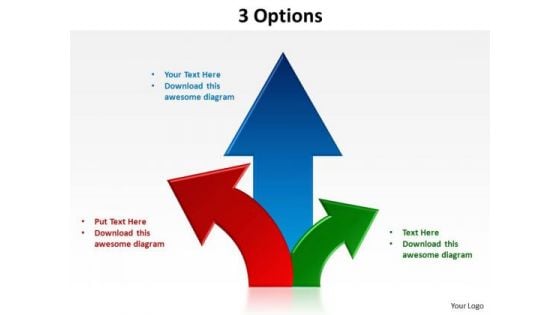
PowerPoint Designs Chart Options Ppt Themes
PowerPoint Designs Chart Options PPT Themes-Explore the various directions and layers existing in your in your plans and processes. Unravel the desired and essential elements of your overall strategy. Explain the relevance of the different layers and stages and directions in getting down to your core competence, ability and desired result.-These amazing PowerPoint pre-designed slides and PowerPoint templates have been carefully created by our team of experts to help you impress your audience. Our stunning collection of Powerpoint slides are 100% editable and can easily fit in any PowerPoint presentations. By using these animations and graphics in PowerPoint and you can easily make professional presentations. Any text can be entered at any point in the PowerPoint template or slide. Just DOWNLOAD our awesome PowerPoint templates and you are ready to go. Figure out the finances with our PowerPoint Designs Chart Options Ppt Themes. They help you get the calculations correct.
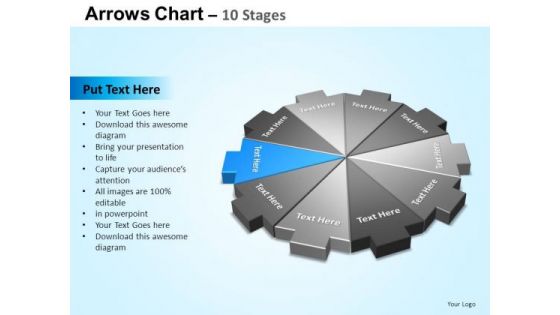
PowerPoint Layout Image Arrows Chart Ppt Design
PowerPoint_Layout_Image_Arrows_Chart_PPT_Design Business Power Points-Explore the various directions and layers existing in your in your plans and processes. Unravel the desired and essential elements of your overall strategy. Explain the relevance of the different layers and stages and directions in getting down to your core competence, ability and desired result.-These amazing PowerPoint pre-designed slides and PowerPoint templates have been carefully created by our team of experts to help you impress your audience. Our stunning collection of Powerpoint slides are 100% editable and can easily fit in any PowerPoint presentations. By using these animations and graphics in PowerPoint and you can easily make professional presentations. Any text can be entered at any point in the PowerPoint template or slide. Just DOWNLOAD our awesome PowerPoint templates and you are ready to go. Compel your team with our PowerPoint Layout Image Arrows Chart Ppt Design. Download without worries with our money back guaranteee.
Quality Management Flow Chart Diagram Powerpoint Images
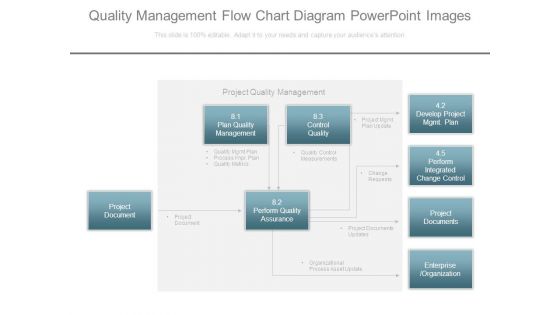
This is a quality management flow chart diagram powerpoint images. This is a four stage process. The stages in this process are project document, project quality management, plan quality management, control quality, perform quality assurance, develop project mgmt. plan, perform integrated, change control, project documents, enterprise, organization, quality mgmt plan, process impr plan, quality metrics, quality control measurements, project mgmt plan update, project document, change requests, project documents updates, organizational process asset update.
Benefit Realization Management And Chart Information PDF
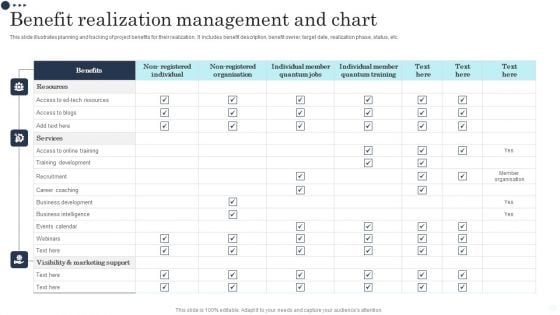
This slide illustrates planning and tracking of project benefits for their realization. It includes benefit description, benefit owner, target date, realization phase, status, etc. Showcasing this set of slides titled Benefit Realization Management And Chart Information PDF. The topics addressed in these templates are Resources, Services, Visibility Marketing Support. All the content presented in this PPT design is completely editable. Download it and make adjustments in color, background, font etc. as per your unique business setting.
PowerPoint Template Chart Growing Towards Ppt Backgrounds
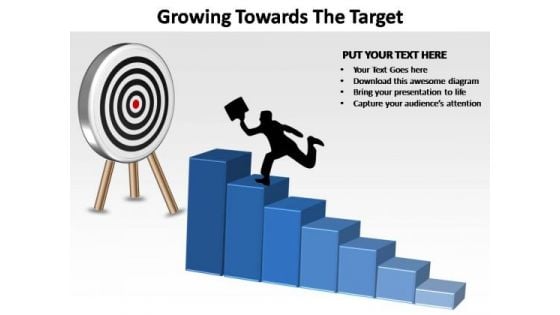
PowerPoint Template Chart Growing Towards PPT Backgrounds-The graphic is a symbol of growth and success. Display your ideas and highlight their ability to accelerate the growth of your company and you. Impress upon the audience how your strategy will carry all to the top of the corporate heap.-These amazing PowerPoint pre-designed slides and PowerPoint templates have been carefully created by our team of experts to help you impress your audience. Our stunning collection of Powerpoint slides are 100% editable and can easily fit in any PowerPoint presentations. By using these animations and graphics in PowerPoint and you can easily make professional presentations. Any text can be entered at any point in the PowerPoint template or slide. Just DOWNLOAD our awesome PowerPoint templates and you are ready to go. Beget approval with our PowerPoint Template Chart Growing Towards Ppt Backgrounds. The audience will find your plans exceedingly good.
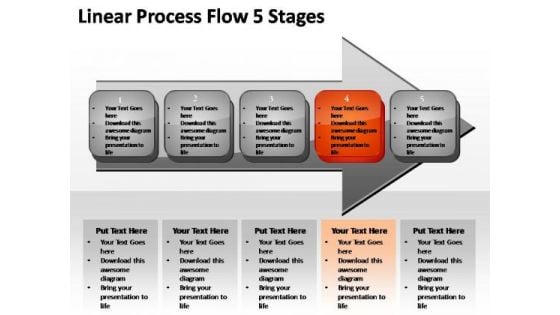
PowerPoint Template Chart Linear Process Ppt Slides
PowerPoint Template Chart Linear Process PPT Slides Business Power Points-Explore the various directions and layers existing in your in your plans and processes. Unravel the desired and essential elements of your overall strategy. Explain the relevance of the different layers and stages and directions in getting down to your core competence, ability and desired result.-These amazing PowerPoint pre-designed slides and PowerPoint templates have been carefully created by our team of experts to help you impress your audience. Our stunning collection of Powerpoint slides are 100% editable and can easily fit in any PowerPoint presentations. By using these animations and graphics in PowerPoint and you can easily make professional presentations. Any text can be entered at any point in the PowerPoint template or slide. Just DOWNLOAD our awesome PowerPoint templates and you are ready to go. Our PowerPoint Template Chart Linear Process Ppt Slides will be your alter ego. They will exemplify your thoughts.
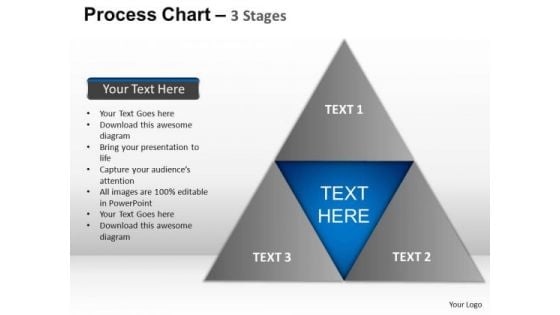
PowerPoint Slides Teamwork Process Chart Ppt Designs
PowerPoint Slides Teamwork Process Chart PPT Designs Business Power Points-Pyramids are truly wonders of the world. Thus a wonderful graphic to impress your audience with your business/professional ideas that are broad based but funnel or narrow down to specific groups, issues or goals. Reach the peak with this graphic.-These amazing PowerPoint pre-designed slides and PowerPoint templates have been carefully created by our team of experts to help you impress your audience. Our stunning collection of Powerpoint slides are 100% editable and can easily fit in any PowerPoint presentations. By using these animations and graphics in PowerPoint and you can easily make professional presentations. Any text can be entered at any point in the PowerPoint template or slide. Just DOWNLOAD our awesome PowerPoint templates and you are ready to go. Exploit our PowerPoint Slides Teamwork Process Chart Ppt Designs with your ideas. Extract every inch of space on them.
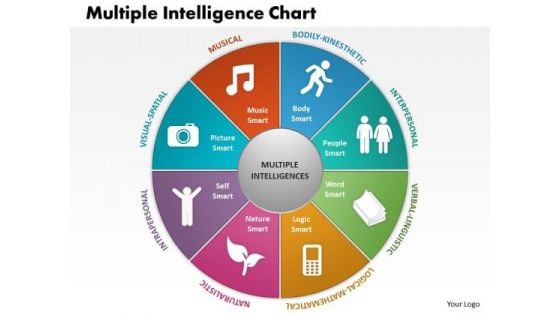
Business Framework Multiple Intelligence Chart PowerPoint Presentation
This business framework power point template has been designed with graphic of multiple intelligence chart. This kind of charts are used for testing and assessment process of any business. Add this template in your presentation and show creative ideas graphically.
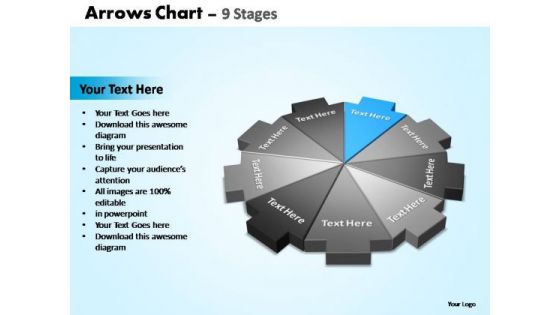
PowerPoint Process Sales Arrows Chart Ppt Themes
PowerPoint Process Sales Arrows Chart PPT Themes-Explore the various directions and layers existing in your in your plans and processes. Unravel the desired and essential elements of your overall strategy. Explain the relevance of the different layers and stages and directions in getting down to your core competence, ability and desired result.-These amazing PowerPoint pre-designed slides and PowerPoint templates have been carefully created by our team of experts to help you impress your audience. Our stunning collection of Powerpoint slides are 100% editable and can easily fit in any PowerPoint presentations. By using these animations and graphics in PowerPoint and you can easily make professional presentations. Any text can be entered at any point in the PowerPoint template or slide. Just DOWNLOAD our awesome PowerPoint templates and you are ready to go. Champion causes with our PowerPoint Process Sales Arrows Chart Ppt Themes. Download without worries with our money back guaranteee.
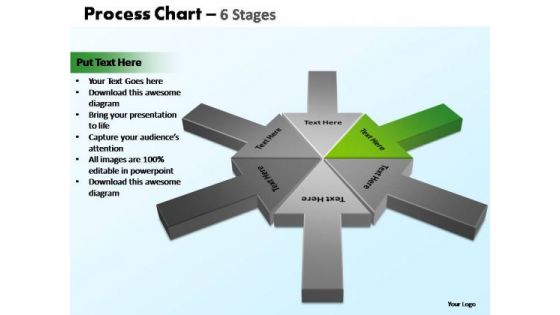
PowerPoint Slides Diagram Process Chart Ppt Design
PowerPoint Slides Diagram Process Chart PPT Design-The Circle of Life - a concept emmbedded in our minds and hence easy to comprehend. Life and Business is made up of processes comprising stages that flow from one to another. An excellent graphic to attract the attention of and understanding by your audience to improve earnings.-These amazing PowerPoint pre-designed slides and PowerPoint templates have been carefully created by our team of experts to help you impress your audience. Our stunning collection of Powerpoint slides are 100% editable and can easily fit in any PowerPoint presentations. By using these animations and graphics in PowerPoint and you can easily make professional presentations. Any text can be entered at any point in the PowerPoint template or slide. Just DOWNLOAD our awesome PowerPoint templates and you are ready to go. Streamline your presentation with our PowerPoint Slides Diagram Process Chart Ppt Design. Download without worries with our money back guaranteee.
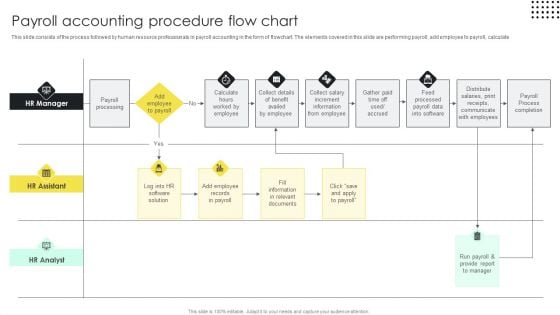
Payroll Accounting Procedure Flow Chart Ideas PDF
This slide consists of the process followed by human resource professionals in payroll accounting in the form of flowchart. The elements covered in this slide are performing payroll, add employee to payroll, calculate Pitch your topic with ease and precision using this Payroll Accounting Procedure Flow Chart Ideas PDF. This layout presents information on Payroll Processing, Assistant, Analyst. It is also available for immediate download and adjustment. So, changes can be made in the color, design, graphics or any other component to create a unique layout.
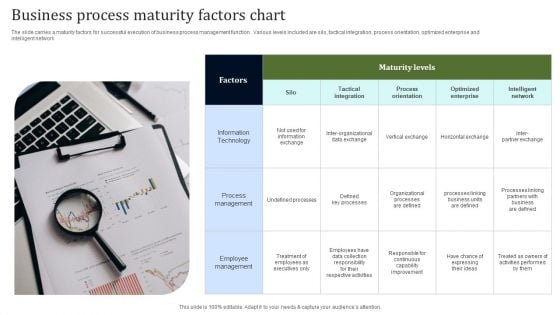
Business Process Maturity Factors Chart Information PDF
The slide carries a maturity factors for successful execution of business process management function . Various levels included are silo, tactical integration, process orientation, optimized enterprise and intelligent network. Persuade your audience using this Business Process Maturity Factors Chart Information PDF. This PPT design covers one stages, thus making it a great tool to use. It also caters to a variety of topics including Information Technology, Process Management, Employee Management. Download this PPT design now to present a convincing pitch that not only emphasizes the topic but also showcases your presentation skills.
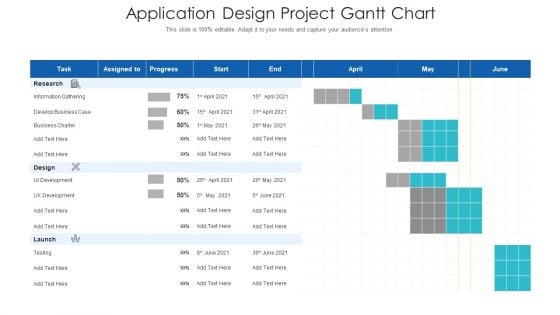
Application Design Project Gantt Chart Diagrams PDF
Your complex projects can be managed and organized simultaneously using this detailed application design project gantt chart diagrams pdf template. Track the milestones, tasks, phases, activities, and subtasks to get an updated visual of your project. Share your planning horizon and release plan with this well crafted presentation template. This exemplary template can be used to plot various dependencies to distinguish the tasks in the pipeline and their impact on the schedules and deadlines of the project. Apart from this, you can also share this visual presentation with your team members and stakeholders. It a resourceful tool that can be incorporated into your business structure. Therefore, download and edit it conveniently to add the data and statistics as per your requirement.
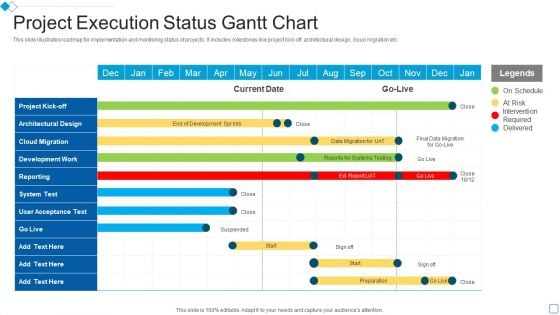
Project Execution Status Gantt Chart Slides PDF
This slide illustrates roadmap for implementation and monitoring status of projects. It includes milestones like project kick off, architectural design, cloud migration etc.Your complex projects can be managed and organized simultaneously using this detailed Project Execution Status Gantt Chart Slides PDF template. Track the milestones, tasks, phases, activities, and subtasks to get an updated visual of your project. Share your planning horizon and release plan with this well crafted presentation template. This exemplary template can be used to plot various dependencies to distinguish the tasks in the pipeline and their impact on the schedules and deadlines of the project. Apart from this, you can also share this visual presentation with your team members and stakeholders. It a resourceful tool that can be incorporated into your business structure. Therefore, download and edit it conveniently to add the data and statistics as per your requirement
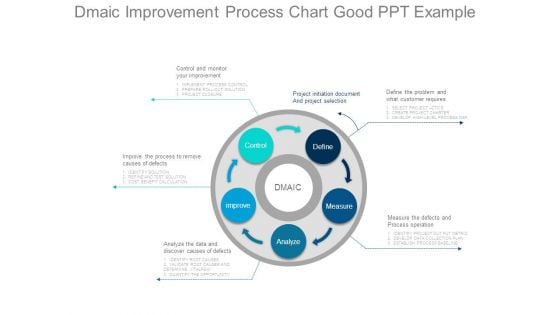
Dmaic Improvement Process Chart Good Ppt Example
This is a dmaic improvement process chart good ppt example. This is a five stage process. The stages in this process are dmaic, control, improve, analyze, measure, define, control and monitor your improvement, project initiation document and project selection, define the problem and what customer requires, improve the process to remove causes of defects, analyze the data and discover causes of defects, measure the defects and process operation, implement process control, prepare roll out solution, project closure, select project ctos, create project charter, develop high level process map, identify solution, refine and test solution, cost benefit calculation, identify root causes, validate root causes and determine vitalfew, quantify the opportunity, identify project out put metric, develop data collection plan, establish process baseline.
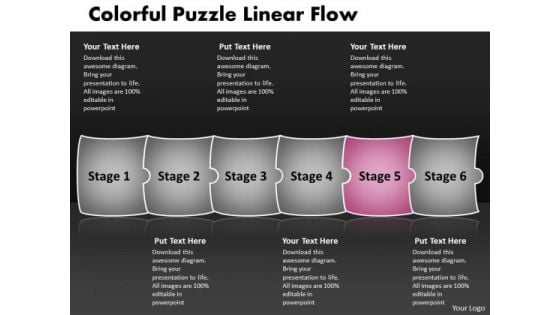
Colorful Puzzle Linear Flow Chart PowerPoint Slides
We present our colorful puzzle linear flow chart PowerPoint Slides.Use our Success PowerPoint Templates because,These slides are the triggers of our growth. Use our Puzzles or Jigsaws PowerPoint Templates because,our template will illustrate what you want to say. Use our Shapes PowerPoint Templates because,you should go for Gold and not just silver. Use our Business PowerPoint Templates because,The NASA Space programme took mankind to the moon and so much more. Like them you too can look far beyond normal boundaries. Show them that in your mind the sky is certainly not the limit Use our Metaphors-Visual Concepts PowerPoint Templates because,You can gain the success to desired levels in one go.Use these PowerPoint slides for presentations relating to Assembly, complete, concept, copy, finish, finished, fit, idea, interlock, jigsaw, match, metaphor, mystery, outline, patience, picture, piece, play, playing, point, pointing, problem, puzzle, quiz, skill, solution, solved, space, struggle, success, support, teamwork. The prominent colors used in the PowerPoint template are Pink, Gray, Black Execute plans with our Colorful Puzzle Linear Flow Chart PowerPoint Slides. Download without worries with our money back guaranteee.
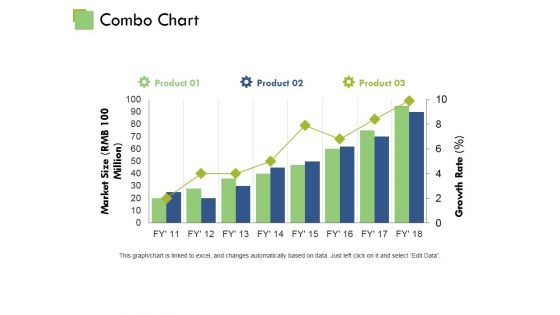
Combo Chart Ppt PowerPoint Presentation Gallery Mockup
This is a clustered column ppt powerpoint presentation portfolio good. This is a three stage process. The stages in this process are business, marketing, strategy, finance, planning.
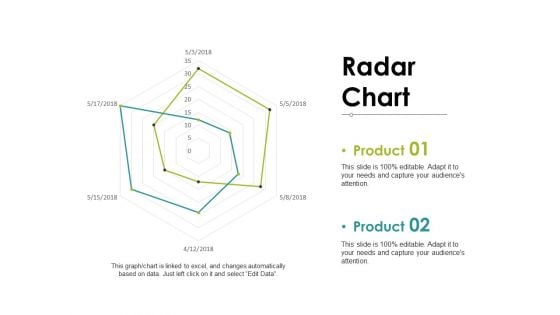
Radar Chart Ppt PowerPoint Presentation Ideas Mockup
This is a stacked column ppt powerpoint presentation pictures layouts. This is a two stage process. The stages in this process are business, marketing, planning, finance, strategy.
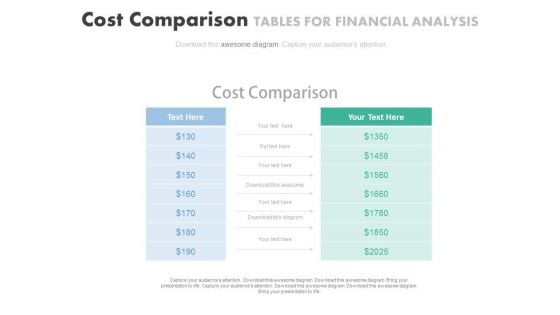
Cost Comparison Table Chart Powerpoint Slides
Our above PPT slide displays cost comparison table chart. This diagram may be used to display cost comparison and financial analysis. Download this PowerPoint template to leave permanent impression on your audience.
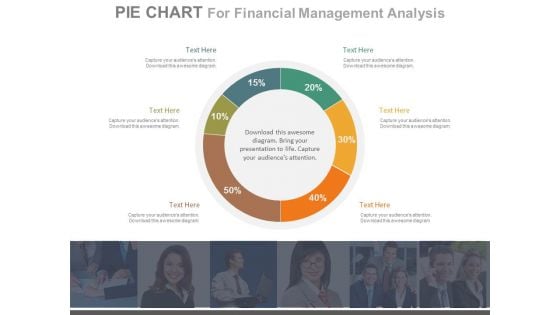
Pie Chart For Customer Analysis Powerpoint Slides
This PowerPoint template has been designed with percentage ratio pie chart. This PPT slide can be used to display customer analysis. You can download finance PowerPoint template to prepare awesome presentations.
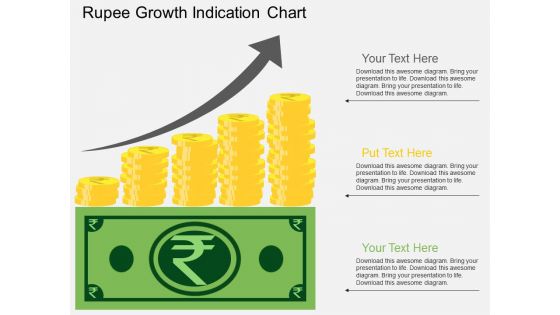
Rupee Growth Indication Chart Powerpoint Template
This business diagram displays rupee growth chart. This business diagram has been designed to implement strategic plan. Use this diagram to depict financial planning process in your presentations.
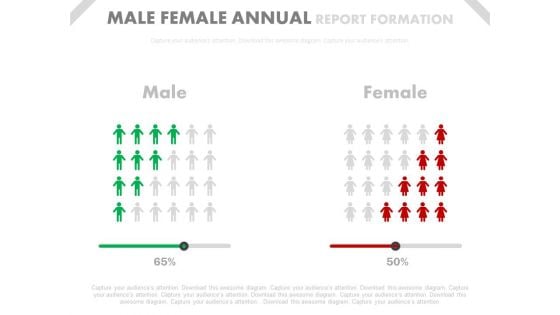
Male Female Ratio Comparison Chart Powerpoint Slides
This PowerPoint template has been designed with graphics of comparison chart. You may download this PPT slide to depict male female ratio comparison chart. Add this slide to your presentation and impress your superiors.
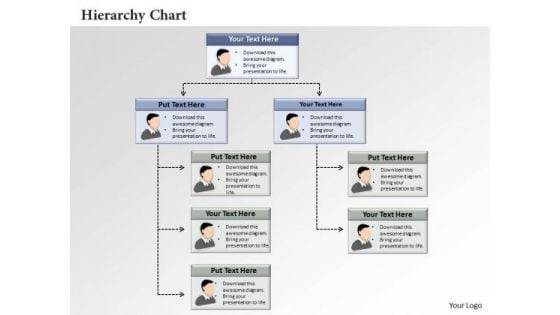
Business Framework Hierarchy Chart PowerPoint Presentation
This image slide has been designed to display hierarchy chart. This image slide has been designed with textboxes with icon flow chart. This image slide may be used displays the concept of organizational management in your presentation. Use this image slide to enhance the quality of your presentations.
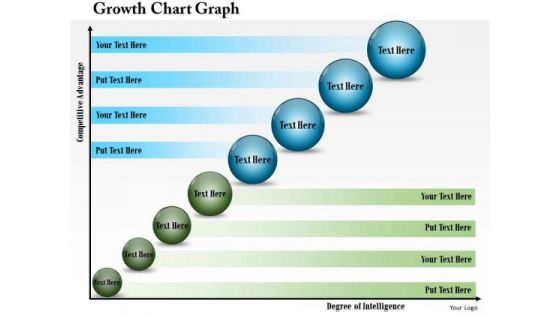
Business Diagram Growth Chart Graph Presentation Template
This business diagram has been designed x-y graph of competitive advantage and degree of intelligence. This diagram depicts the business growth chart. Give professional appearance to your presentations using this business slide.
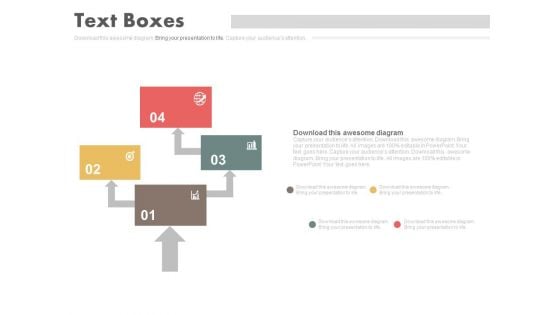
Four Steps Arrow Chart Design Powerpoint Slides
This PowerPoint template has been designed with four steps arrow chart. This PPT slide can be used to prepare presentations for marketing reports and also for financial data analysis. You can download finance PowerPoint template to prepare awesome presentations.
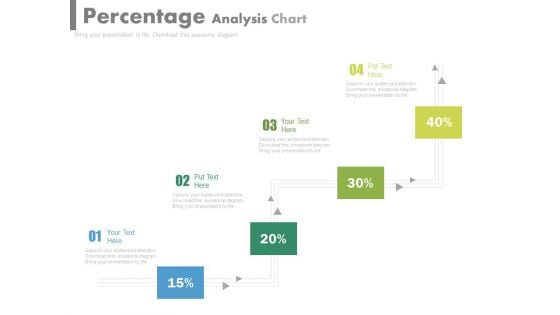
Pipeline Percentage Analysis Chart Powerpoint Slides
This PowerPoint template has been designed with pipeline percentage analysis chart. This PPT slide can be used to display business strategy plan. You can download finance PowerPoint template to prepare awesome presentations.
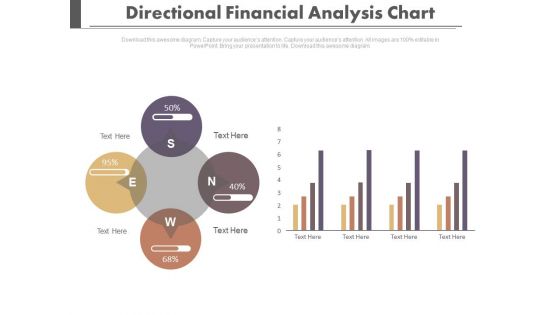
Four Directions Circular Analysis Chart Powerpoint Slides
Our professionally designed business diagram is as an effective tool for communicating business strategy. It contains four directional circular charts. Above slide is also suitable to display financial planning and strategy.
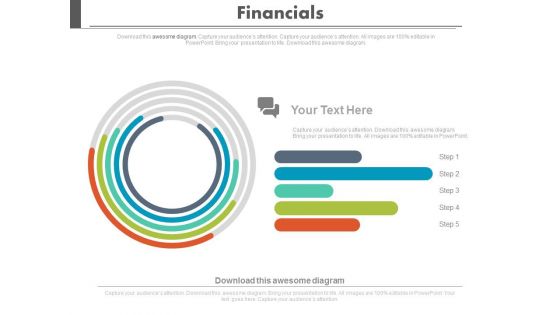
Financial Growth Analysis Circular Chart Powerpoint Slides
Visually support your presentation with our above template containing graphics of circular chart. This diagram slide helps to display financial growth analysis. Etch your views in the brains of your audience with this diagram slide.
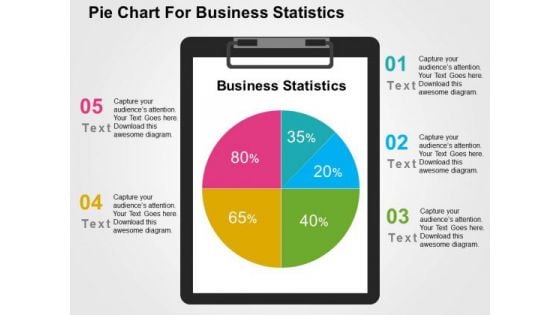
Pie Chart For Business Statistics PowerPoint Template
Visually support your presentation with our above template showing pie chart. This slide has been professionally designed to present business statistics. This template offers an excellent background to build impressive presentation.
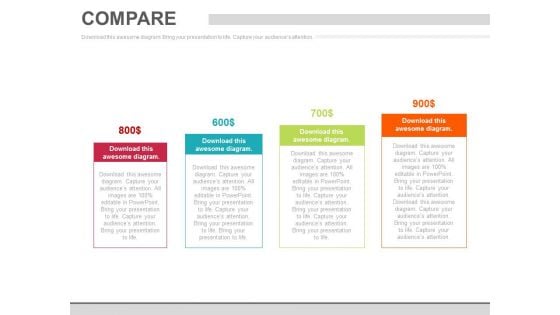
Four Steps Pricing Option Chart Powerpoint Slides
This PowerPoint template has been designed with dollar value pricing table chart. This PPT slide may be used for sample marketing proposal. Download this slide to build unique presentation.
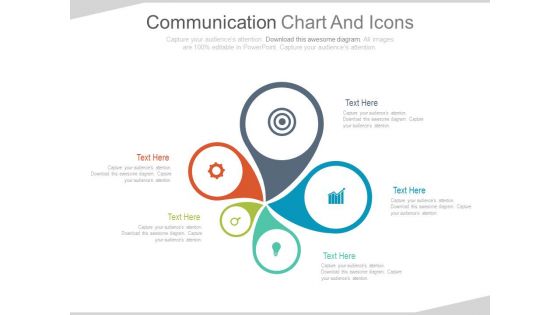
Infographic Chart For Marketing Information Powerpoint Slides
This PowerPoint template contains circular infographic chart. You may download this PPT slide to display marketing information in visual manner. You can easily customize this template to make it more unique as per your need.

Business Employee Profile Growth Chart Powerpoint Slides
This PowerPoint template has been designed with graphics of business man with growth chart. This PowerPoint slide is an excellent tool to showcase employee growth and performance. Make impressive presentation using this slide.
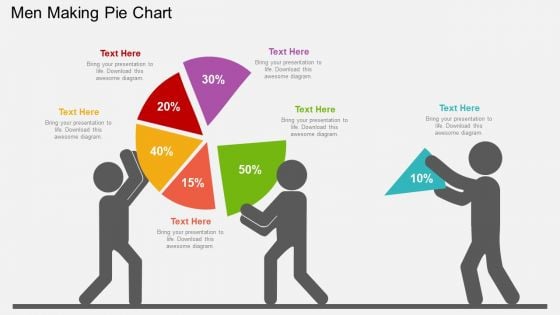
Men Making Pie Chart Powerpoint Templates
Our professionally designed business diagram is as an effective tool for communicating ideas and planning. It contains graphics of business man making pie chart. Design management function in strategic planning with this diagram slide. It will amplify the strength of your logic.
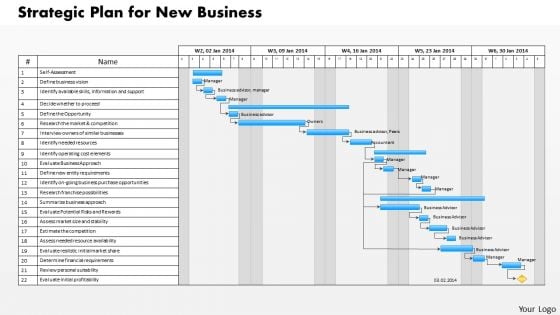
Business Framework Project Management Chart PowerPoint Presentation
This diagram displays purchase funnel template. This diagram may be used to depict research and analyzing market in your presentations. This diagram will make your presentations interesting.
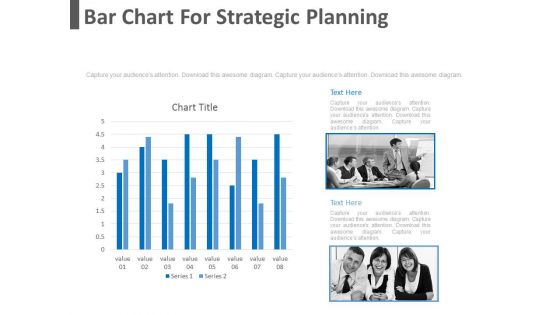
Bar Chart For Strategic Planning Powerpoint Slides
This PowerPoint template has been designed with bar graph with two teams. This diagram is useful to exhibit strategic planning. This diagram slide can be used to make impressive presentations.
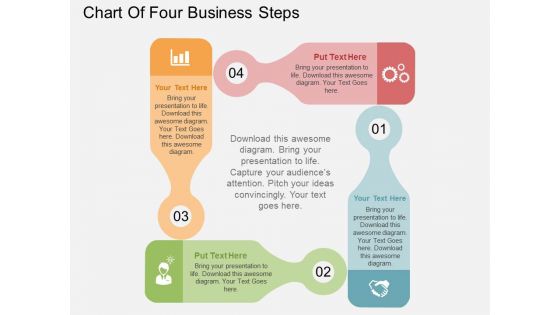
Chart Of Four Business Steps Powerpoint Templates
This business diagram displays flow of four business steps. This editable slide is suitable to present growth management. Use this diagram for business and finance related topics and display complete data analysis in your presentation.
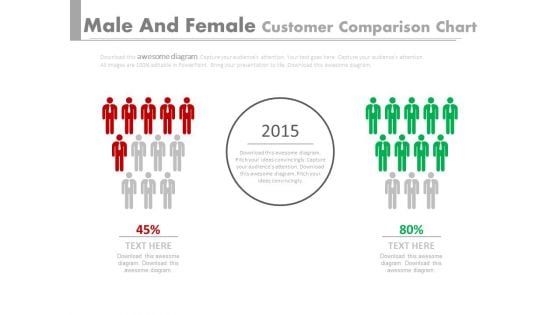
Red Green Teams Comparison Chart Powerpoint Slides
This PPT slide displays graphics of two red and green teams. Use this PPT design to display comparison of teams performances. This PowerPoint template can be customized as per requirements of business education or any other theme.
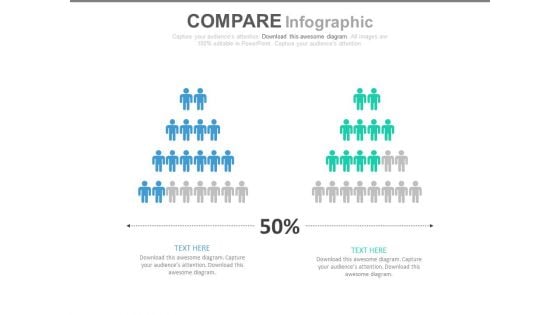
Two Teams Performance Analysis Chart Powerpoint Slides
This PowerPoint template has been designed with icons of two teams with percentage values. Download this PPT slide to depict team?s performance analysis. Deliver amazing presentations to mesmerize your audience by using this PPT slide design.
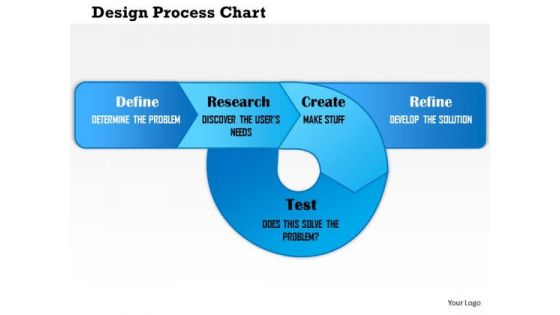
Business Framework Design Process Chart PowerPoint Presentation
This image slide displays business framework for design process. This image slide may be used in your presentations to depict new product marketing. You may change color, size and orientation of any icon to your liking. Create professional presentations using this image slide.
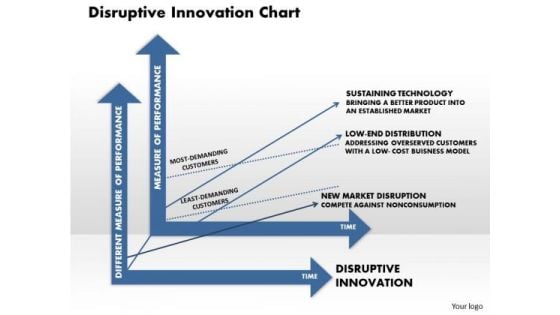
Business Framework Disruptive Innovation Chart PowerPoint Presentation
This image slide displays business framework for diminishing marginal returns. This image slide may be used in your presentations to depict analysis in marketing and business. You may change color, size and orientation of any icon to your liking. Create wonderful presentations using this image slide.
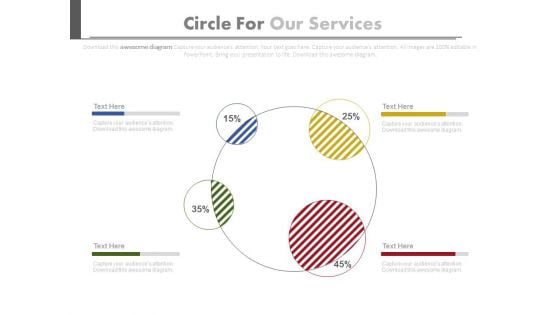
Circle Chart For Value Analysis Powerpoint Slides
This PowerPoint template has been designed for business presentations and corporate slides. The PowerPoint template has a high quality design. You can download this PowerPoint slide for corporate presentations or annual meeting and business plans.
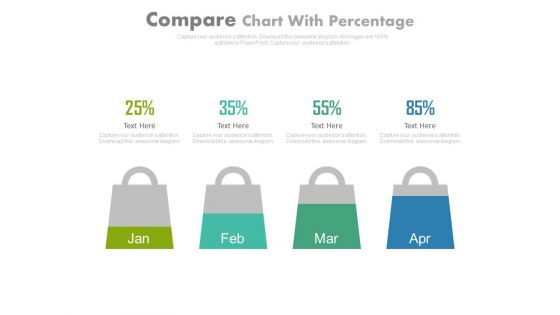
Four Months Sales Statistics Chart Powerpoint Slides
This PowerPoint template has been designed with four shopping bags with percentage values. Download this PPT slide to display four months sales statistics. Add this slide to your presentation and impress your superiors.
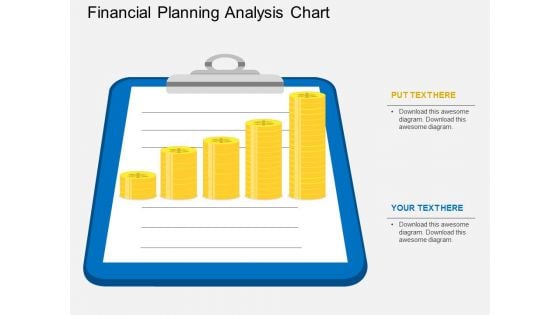
Financial Planning Analysis Chart Powerpoint Template
This PowerPoint slide contains graphics of note pad with gold coins. This professional slide may be used to display financial planning, report and analysis. Adjust the above diagram in your business presentations to give professional impact.
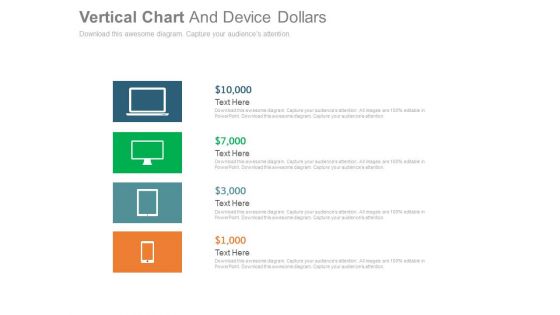
Computer Development And Generation Chart Powerpoint Slides
This PPT slide displays graphics of computer devices. Use this PPT design to display technology development and generation. This PowerPoint template can be customized as per requirements of business education or any other theme.
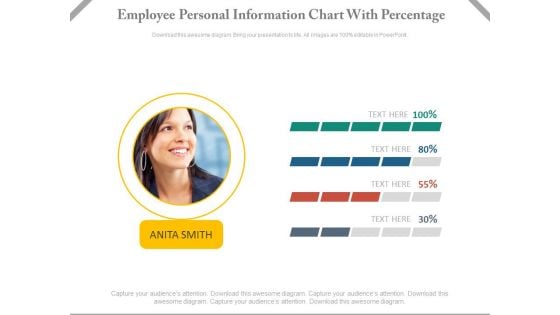
Employee Performance Information Chart Powerpoint Slides
This dashboard template contains employee picture with percentage slides. This dashboard PowerPoint template conveys employees performance in a visual manner. Download this PPT slide for quick decision-making.

Three Text Tags Compare Chart Powerpoint Slides
This PowerPoint template has been designed with text tags and percentage data. You may download this PPT slide to display data comparison and analysis. Add this slide to your presentation and impress your superiors.

Digital Advertisement Spend Trend Chart By Industries Elements PDF
This slide depicts expenditure trends for digital advertising by top industries. It includes retail, automotive, financial services, telecom, consumer products, travel, healthcare, media, entertainment, etc. Showcasing this set of slides titled Digital Advertisement Spend Trend Chart By Industries Elements PDF. The topics addressed in these templates are Retail Sector, Total Budget, Chart By Industries. All the content presented in this PPT design is completely editable. Download it and make adjustments in color, background, font etc. as per your unique business setting.
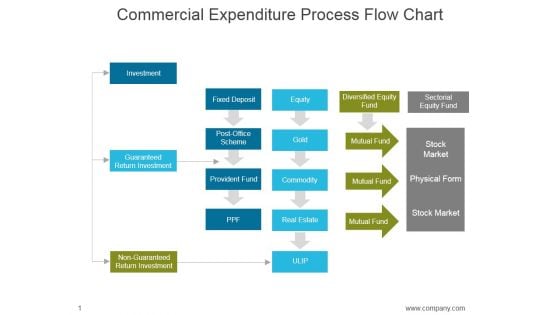
Commercial Expenditure Process Flow Chart Ppt PowerPoint Presentation Microsoft
This is a commercial expenditure process flow chart ppt powerpoint presentation microsoft. This is a four stage process. The stages in this process are investment, guaranteed return investment, non guaranteed return investment, fixed deposit, equity, diversified equity fund, sectorial equity fund, gold.
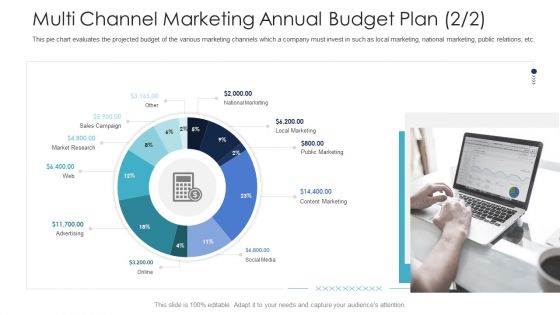
B2C Marketing Initiatives Strategies For Business Multi Channel Marketing Annual Budget Plan Social Media Ppt Layouts Background PDF
This pie chart evaluates the projected budget of the various marketing channels which a company must invest in such as local marketing, national marketing, public relations, etc. Deliver an awe inspiring pitch with this creative B2C marketing initiatives strategies for business multi channel marketing annual budget plan social media ppt layouts background pdf bundle. Topics like sales campaign, market research, content marketing can be discussed with this completely editable template. It is available for immediate download depending on the needs and requirements of the user.
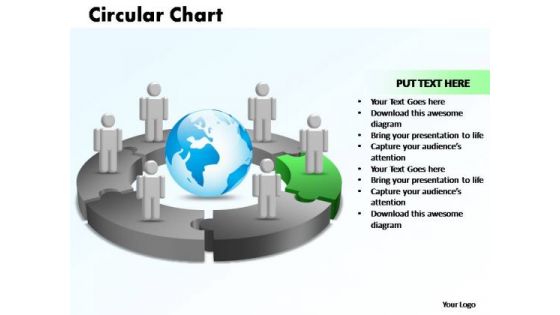
PowerPoint Themes Circular Chart With Globe Ppt Theme
PowerPoint Themes Circular Chart With Globe PPT Theme-The Circle of Life - a concept emmbedded in our minds and hence easy to comprehend. Life and Business is made up of processes comprising stages that flow from one to another. An excellent graphic to attract the attention of and understanding by your audience to improve earnings.-PowerPoint Themes Circular Chart With Globe PPT Theme Beat the budget with our PowerPoint Themes Circular Chart With Globe Ppt Theme. Have enough to spare in the end.
Usa Map Chart Americana PowerPoint Presentation Slides Cc
Microsoft PowerPoint Slides and Backgrounds with of a multicolored bar chart sitting on top of a transparent extruded map of the united states on a medium gray reflective surface Beat the budget with our Usa Map Chart Americana PowerPoint Presentation Slides Cc. Have enough to spare in the end.


 Continue with Email

 Home
Home


