Business Analytics Dashboard Diagram
Facebook Analytics Pixel Marketing Plan Dashboard Professional PDF
This slide exhibits dashboard which offers free point of view for optimization and in-depth analysis of visitors. This template helps in tracking social media and campaigns performance. It involves information related to revenue, age factor, etc. Showcasing this set of slides titled Facebook Analytics Pixel Marketing Plan Dashboard Professional PDF Graphics. The topics addressed in these templates are People Metrics, Lifetime Value, Purchases Repeated. All the content presented in this PPT design is completely editable. Download it and make adjustments in color, background, font etc. as per your unique business setting.
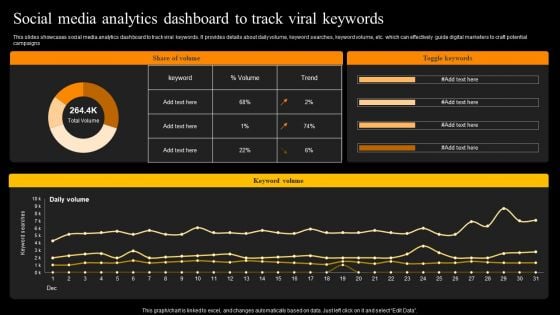
Social Media Analytics Dashboard To Track Viral Keywords Structure PDF
This slides showcases social media analytics dashboard to track viral keywords. It provides details about daily volume, keyword searches, keyword volume, etc. which can effectively guide digital marketers to craft potential campaigns. Slidegeeks is one of the best resources for PowerPoint templates. You can download easily and regulate Social Media Analytics Dashboard To Track Viral Keywords Structure PDF for your personal presentations from our wonderful collection. A few clicks is all it takes to discover and get the most relevant and appropriate templates. Use our Templates to add a unique zing and appeal to your presentation and meetings. All the slides are easy to edit and you can use them even for advertisement purposes.
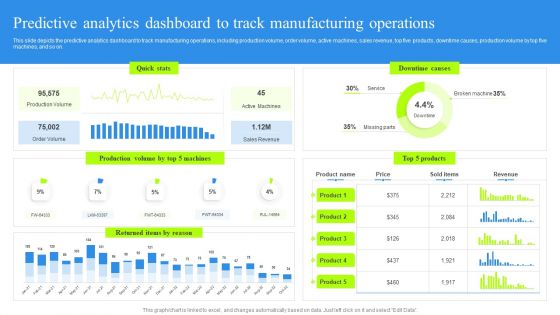
Predictive Analytics Dashboard To Track Manufacturing Operations Rules PDF
This slide depicts the predictive analytics dashboard to track manufacturing operations, including production volume, order volume, active machines, sales revenue, top five products, downtime causes, production volume by top five machines, and so on. Present like a pro with Predictive Analytics Dashboard To Track Manufacturing Operations Rules PDF Create beautiful presentations together with your team, using our easy-to-use presentation slides. Share your ideas in real-time and make changes on the fly by downloading our templates. So whether you are in the office, on the go, or in a remote location, you can stay in sync with your team and present your ideas with confidence. With Slidegeeks presentation got a whole lot easier. Grab these presentations today.
Icon Of Change Implementation Management Process Analytics Dashboard Information PDF
Persuade your audience using this icon of change implementation management process analytics dashboard information pdf. This PPT design covers four stages, thus making it a great tool to use. It also caters to a variety of topics including icon of change implementation management process analytics dashboard. Download this PPT design now to present a convincing pitch that not only emphasizes the topic but also showcases your presentation skills.
Motor Insurance Analytics Statistics And Dashboard Icon Template PDF
Persuade your audience using this Motor Insurance Analytics Statistics And Dashboard Icon Template PDF. This PPT design covers three stages, thus making it a great tool to use. It also caters to a variety of topics including Motor Insurance Analytics, Statistics And Dashboard Icon. Download this PPT design now to present a convincing pitch that not only emphasizes the topic but also showcases your presentation skills.
Youtube Video Marketing Analytics Dashboard Ppt Icon Portrait PDF
This slide covers dashboard illustrating performance of ad campaigns on YouTube. It includes elements such as total gained subscribers, likes, dislikes, daily active users, views, campaign performance, traffic sources by views, etc. Pitch your topic with ease and precision using this Youtube Video Marketing Analytics Dashboard Ppt Icon Portrait PDF. This layout presents information on Average Vies, Per Week, Campaigns, Traffic Sources. It is also available for immediate download and adjustment. So, changes can be made in the color, design, graphics or any other component to create a unique layout.
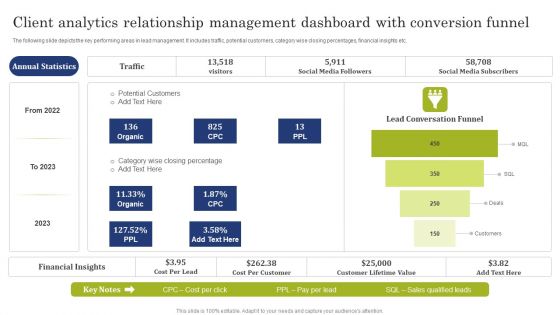
Client Analytics Relationship Management Dashboard With Conversion Funnel Demonstration PDF
The following slide depicts the key performing areas in lead management. It includes traffic, potential customers, category wise closing percentages, financial insights etc. Pitch your topic with ease and precision using this Client Analytics Relationship Management Dashboard With Conversion Funnel Demonstration PDF. This layout presents information on Potential Customers, Social Media Followers, Social Media Subscribers. It is also available for immediate download and adjustment. So, changes can be made in the color, design, graphics or any other component to create a unique layout.
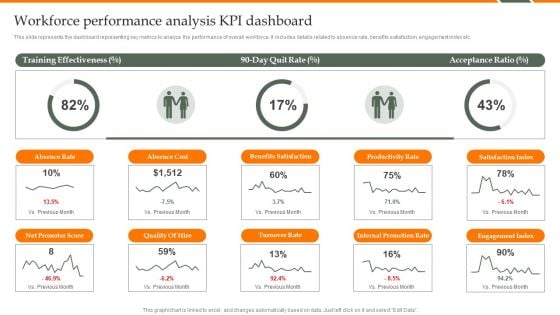
Human Resource Analytics Workforce Performance Analysis KPI Dashboard Structure PDF
This slide represents the dashboard representing key metrics to analyze the performance of overall workforce. It includes details related to absence rate, benefits satisfaction, engagement index etc. Find a pre-designed and impeccable Human Resource Analytics Workforce Performance Analysis KPI Dashboard Structure PDF. The templates can ace your presentation without additional effort. You can download these easy-to-edit presentation templates to make your presentation stand out from others. So, what are you waiting for Download the template from Slidegeeks today and give a unique touch to your presentation.
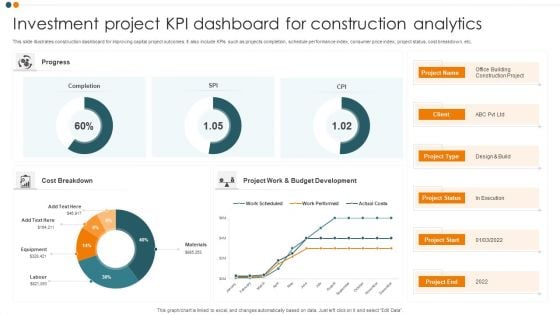
Investment Project KPI Dashboard For Construction Analytics Background PDF
This slide illustrates construction dashboard for improving capital project outcomes. It also include KPIs such as projects completion, schedule performance index, consumer price index, project status, cost breakdown, etc. Pitch your topic with ease and precision using this Investment Project KPI Dashboard For Construction Analytics Background PDF. This layout presents information on Cost Breakdown, Completion, Progress. It is also available for immediate download and adjustment. So, changes can be made in the color, design, graphics or any other component to create a unique layout.
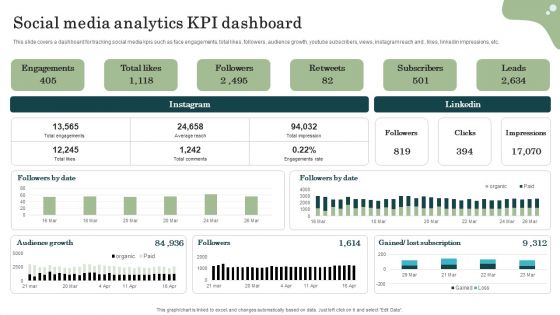
Marketing Success Metrics Social Media Analytics KPI Dashboard Elements PDF
This slide covers a dashboard for tracking social media kpis such as face engagements, total likes, followers, audience growth, youtube subscribers, views, instagram reach and , likes, linkedin impressions, etc. Find a pre-designed and impeccable Marketing Success Metrics Social Media Analytics KPI Dashboard Elements PDF. The templates can ace your presentation without additional effort. You can download these easy-to-edit presentation templates to make your presentation stand out from others. So, what are you waiting for Download the template from Slidegeeks today and give a unique touch to your presentation.

Information Technology Security Team Analytics Dashboard With KPI Themes PDF
This slide elaborates about the number of incidents that have taken place in cyber security and the malware types with per incident. It also includes the number of open and resolved ticked. Showcasing this set of slides titled Information Technology Security Team Analytics Dashboard With KPI Themes PDF. The topics addressed in these templates are Open Incidents, Resolved Incidents, Open Tickets, Resolved Tickets. All the content presented in this PPT design is completely editable. Download it and make adjustments in color, background, font etc. as per your unique business setting.
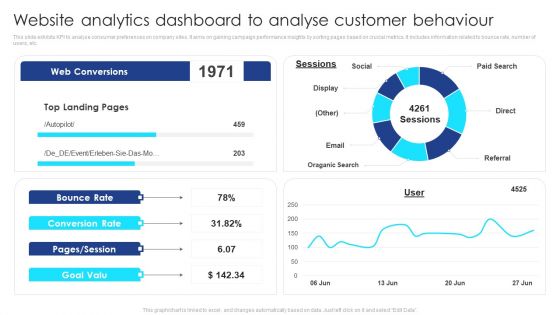
Website Analytics Dashboard To Analyse Customer Behaviour Themes PDF
This slide exhibits KPI to analyse consumer preferences on company sites. It aims on gaining campaign performance insights by sorting pages based on crucial metrics. It includes information related to bounce rate, number of users, etc. Showcasing this set of slides titled Website Analytics Dashboard To Analyse Customer Behaviour Themes PDF. The topics addressed in these templates are Social, Paid Search, Referral, Email, Oraganic Search. All the content presented in this PPT design is completely editable. Download it and make adjustments in color, background, font etc. as per your unique business setting.
Insurance Analytics Enrollment Around The World Dashboard Icons PDF
This slide illustrates total insurance enrollment of all insurance corporations. It includes monthly enrollment charts, enrollments in 2021, enrollment by scheme, enrollment levels, worldwide enrollments, enrollment age wise etc. Showcasing this set of slides titled Insurance Analytics Enrollment Around The World Dashboard Icons PDF. The topics addressed in these templates are Enrollments Levels, Enrollments Worldwide, Enrollments Age Wise. All the content presented in this PPT design is completely editable. Download it and make adjustments in color, background, font etc. as per your unique business setting.
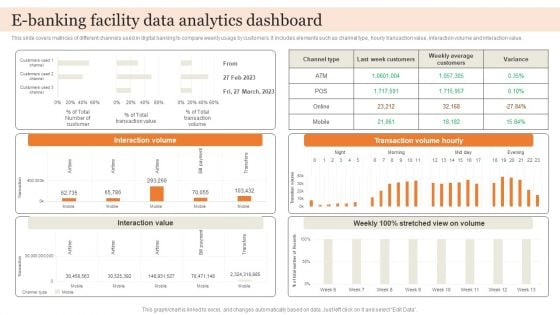
E Banking Facility Data Analytics Dashboard Brochure PDF
This slide covers matrices of different channels used in digital banking to compare weekly usage by customers. It includes elements such as channel type, hourly transaction value, interaction volume and interaction value. Showcasing this set of slides titled E Banking Facility Data Analytics Dashboard Brochure PDF. The topics addressed in these templates are Interaction Value, Transaction Volume Hourly, Interaction Volume. All the content presented in this PPT design is completely editable. Download it and make adjustments in color, background, font etc. as per your unique business setting.
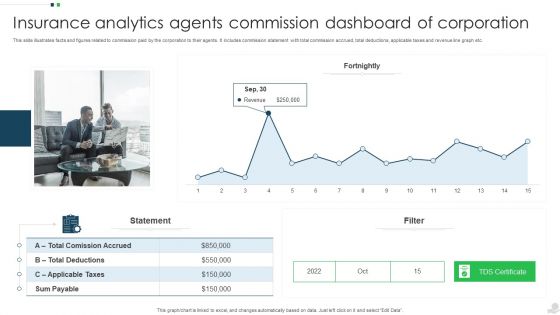
Insurance Analytics Agents Commission Dashboard Of Corporation Introduction PDF
This slide illustrates facts and figures related to commission paid by the corporation to their agents. It includes commission statement with total commission accrued, total deductions, applicable taxes and revenue line graph etc. Pitch your topic with ease and precision using this Insurance Analytics Agents Commission Dashboard Of Corporation Introduction PDF. This layout presents information on Applicable Taxes, Sum Payable, Revenue. It is also available for immediate download and adjustment. So, changes can be made in the color, design, graphics or any other component to create a unique layout.

Home Insurance Analytics Statistics With Settlement Time Dashboard Ideas PDF
This slide illustrates home insurance facts and figures of the organization. It includes monthly claim volume, claim status, average notification time, acknowledged time, decision time etc. Pitch your topic with ease and precision using this Home Insurance Analytics Statistics With Settlement Time Dashboard Ideas PDF. This layout presents information on Average Acknowledged Time, Average Decision Time, Average Lead Time. It is also available for immediate download and adjustment. So, changes can be made in the color, design, graphics or any other component to create a unique layout.
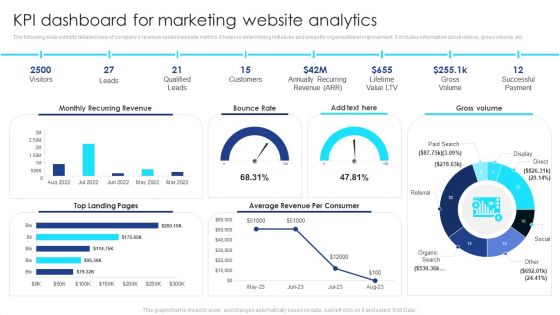
KPI Dashboard For Marketing Website Analytics Summary PDF
The following slide exhibits detailed view of companys revenue-related website metrics. It helps in determining initiatives and areas for organisational improvement. It includes information about visitors, gross volume, etc. Pitch your topic with ease and precision using this KPI Dashboard For Marketing Website Analytics Summary PDF. This layout presents information on Visitors, Leads, Qualified Leads, Customers, Gross Volume, Successful Payment. It is also available for immediate download and adjustment. So, changes can be made in the color, design, graphics or any other component to create a unique layout.
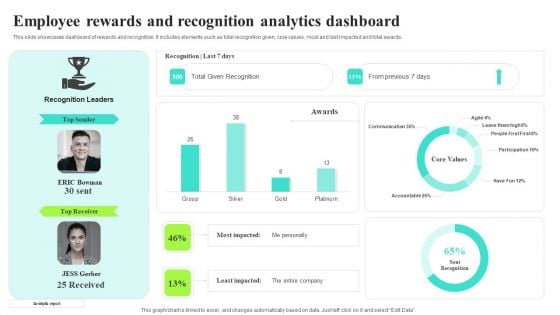
Employee Rewards And Recognition Analytics Dashboard Rules PDF
This slide showcases dashboard of rewards and recognition. It includes elements such as total recognition given, core values, most and last impacted and total awards. Are you in need of a template that can accommodate all of your creative concepts This one is crafted professionally and can be altered to fit any style. Use it with Google Slides or PowerPoint. Include striking photographs, symbols, depictions, and other visuals. Fill, move around, or remove text boxes as desired. Test out color palettes and font mixtures. Edit and save your work, or work with colleagues. Download Employee Rewards And Recognition Analytics Dashboard Rules PDF and observe how to make your presentation outstanding. Give an impeccable presentation to your group and make your presentation unforgettable.

Complete Guide To Launch Website Analytics Dashboard To Track Performance
This Complete Guide To Launch Website Analytics Dashboard To Track Performance is perfect for any presentation, be it in front of clients or colleagues. It is a versatile and stylish solution for organizing your meetings. The Complete Guide To Launch Website Analytics Dashboard To Track Performance features a modern design for your presentation meetings. The adjustable and customizable slides provide unlimited possibilities for acing up your presentation. Slidegeeks has done all the homework before launching the product for you. So, do not wait, grab the presentation templates today Our Complete Guide To Launch Website Analytics Dashboard To Track Performance are topically designed to provide an attractive backdrop to any subject. Use them to look like a presentation pro.
KPI Dashboard Tracking Major Promotional Analytics Future Trends Rules Pdf
This slide covers the dashboard for analysing paid search metrics such as ad cost, clicks, impressions, click through rate, cost per conversion, conversion rate, cost per click, etc. The KPI Dashboard Tracking Major Promotional Analytics Future Trends Rules Pdf is a compilation of the most recent design trends as a series of slides. It is suitable for any subject or industry presentation, containing attractive visuals and photo spots for businesses to clearly express their messages. This template contains a variety of slides for the user to input data, such as structures to contrast two elements, bullet points, and slides for written information. Slidegeeks is prepared to create an impression. This slide covers the dashboard for analysing paid search metrics such as ad cost, clicks, impressions, click through rate, cost per conversion, conversion rate, cost per click, etc.
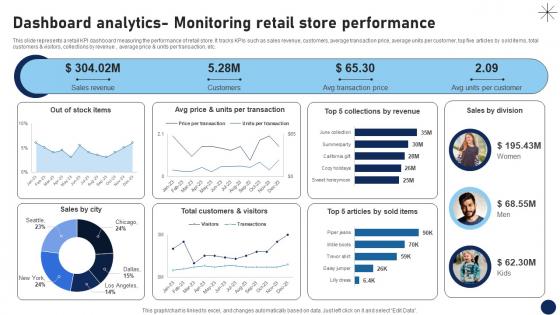
Dashboard Analytics Monitoring Retail Store Performance DT SS V
This slide represents a retail KPI dashboard measuring the performance of retail store. It tracks KPIs such as sales revenue, customers, average transaction price, average units per customer, top five articles by sold items, total customers and visitors, collections by revenue , average price and units per transaction, etc.Are you in need of a template that can accommodate all of your creative concepts This one is crafted professionally and can be altered to fit any style. Use it with Google Slides or PowerPoint. Include striking photographs, symbols, depictions, and other visuals. Fill, move around, or remove text boxes as desired. Test out color palettes and font mixtures. Edit and save your work, or work with colleagues. Download Dashboard Analytics Monitoring Retail Store Performance DT SS V and observe how to make your presentation outstanding. Give an impeccable presentation to your group and make your presentation unforgettable. This slide represents a retail KPI dashboard measuring the performance of retail store. It tracks KPIs such as sales revenue, customers, average transaction price, average units per customer, top five articles by sold items, total customers and visitors, collections by revenue , average price and units per transaction, etc.
Online Marketing Analytics To Enhance Business Growth Dashboard For Tracking Business Blog Kpis Template PDF
This slide covers the dashboard for analyzing blogging KPIs such as performance, published posts, views, new blog subscribers, top blog posts by pageviews, top blog posts by CTR, etc. Slidegeeks is one of the best resources for PowerPoint templates. You can download easily and regulate Online Marketing Analytics To Enhance Business Growth Dashboard For Tracking Business Blog Kpis Template PDF for your personal presentations from our wonderful collection. A few clicks is all it takes to discover and get the most relevant and appropriate templates. Use our Templates to add a unique zing and appeal to your presentation and meetings. All the slides are easy to edit and you can use them even for advertisement purposes.
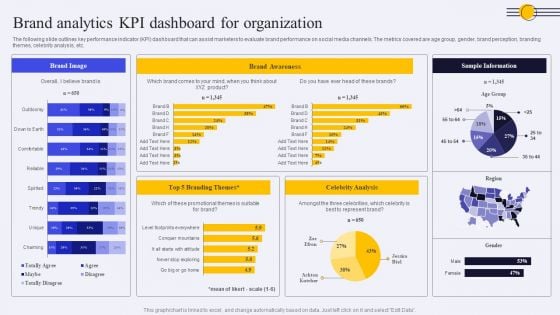
Brand Analytics KPI Dashboard For Organization Ppt PowerPoint Presentation Diagram PDF
The following slide outlines key performance indicator KPI dashboard that can assist marketers to evaluate brand performance on social media channels. The metrics covered are age group, gender, brand perception, branding themes, celebrity analysis, etc. Take your projects to the next level with our ultimate collection of Brand Analytics KPI Dashboard For Organization Ppt PowerPoint Presentation Diagram PDF. Slidegeeks has designed a range of layouts that are perfect for representing task or activity duration, keeping track of all your deadlines at a glance. Tailor these designs to your exact needs and give them a truly corporate look with your own brand colors they will make your projects stand out from the rest.

Prescriptive Analytics Software Tool Rapidminer Data Analytics SS V
This slide provides overview of RapidMiner as a prescriptive analytics tool to help businesses evaluate its usability. It covers details of RapidMiner regarding description, features and pricing plans.Are you searching for a Prescriptive Analytics Software Tool Rapidminer Data Analytics SS V that is uncluttered, straightforward, and original Its easy to edit, and you can change the colors to suit your personal or business branding. For a presentation that expresses how much effort you have put in, this template is ideal With all of its features, including tables, diagrams, statistics, and lists, its perfect for a business plan presentation. Make your ideas more appealing with these professional slides. Download Prescriptive Analytics Software Tool Rapidminer Data Analytics SS V from Slidegeeks today. This slide provides overview of RapidMiner as a prescriptive analytics tool to help businesses evaluate its usability. It covers details of RapidMiner regarding description, features and pricing plans.
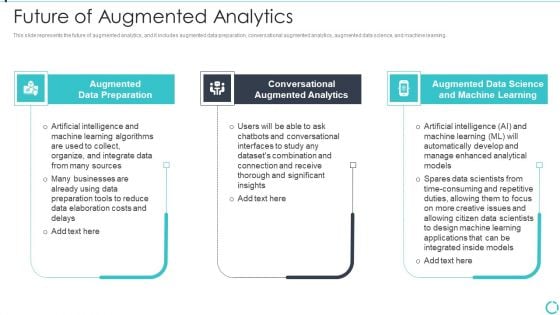
Augmented Analytics Implementation IT Future Of Augmented Analytics Brochure PDF
This slide represents the future of augmented analytics, and it includes augmented data preparation, conversational augmented analytics, augmented data science, and machine learning. Presenting Augmented Analytics Implementation IT Future Of Augmented Analytics Brochure PDF to provide visual cues and insights. Share and navigate important information on three stages that need your due attention. This template can be used to pitch topics like Augmented Data Preparation, Conversational Augmented Analytics, Augmented Data Science, Machine Learning. In addtion, this PPT design contains high resolution images, graphics, etc, that are easily editable and available for immediate download.

Prescriptive Analytics Software Tool Tableau Data Analytics SS V
This slide provides overview of Tableau as a data analytics tools providing data visualization features. It covers details of Tableau regarding description, features and pricing plans.Retrieve professionally designed Prescriptive Analytics Software Tool Tableau Data Analytics SS V to effectively convey your message and captivate your listeners. Save time by selecting pre-made slideshows that are appropriate for various topics, from business to educational purposes. These themes come in many different styles, from creative to corporate, and all of them are easily adjustable and can be edited quickly. Access them as PowerPoint templates or as Google Slides themes. You do not have to go on a hunt for the perfect presentation because Slidegeeks got you covered from everywhere. This slide provides overview of Tableau as a data analytics tools providing data visualization features. It covers details of Tableau regarding description, features and pricing plans.

Graph Illustrating Impact Of Prescriptive Analytics Data Analytics SS V
This slide showcases graph highlighting impact analysis of prescriptive analytics on businesses via use of major performance indicators. It provides information total revenue, inventory levels and labour costs with key insights.Take your projects to the next level with our ultimate collection of Graph Illustrating Impact Of Prescriptive Analytics Data Analytics SS V. Slidegeeks has designed a range of layouts that are perfect for representing task or activity duration, keeping track of all your deadlines at a glance. Tailor these designs to your exact needs and give them a truly corporate look with your own brand colors they will make your projects stand out from the rest This slide showcases graph highlighting impact analysis of prescriptive analytics on businesses via use of major performance indicators. It provides information total revenue, inventory levels and labour costs with key insights.
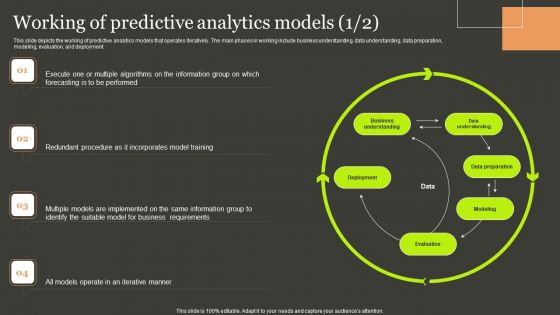
Predictive Analytics Methods Working Of Predictive Analytics Models Summary PDF
This slide depicts the working of predictive analytics models that operates iteratively. The main phases in working include business understanding, data understanding, data preparation, modeling, evaluation, and deployment. Find highly impressive Predictive Analytics Methods Working Of Predictive Analytics Models Summary PDF on Slidegeeks to deliver a meaningful presentation. You can save an ample amount of time using these presentation templates. No need to worry to prepare everything from scratch because Slidegeeks experts have already done a huge research and work for you. You need to download Predictive Analytics Methods Working Of Predictive Analytics Models Summary PDF for your upcoming presentation. All the presentation templates are 100 percent editable and you can change the color and personalize the content accordingly. Download now.
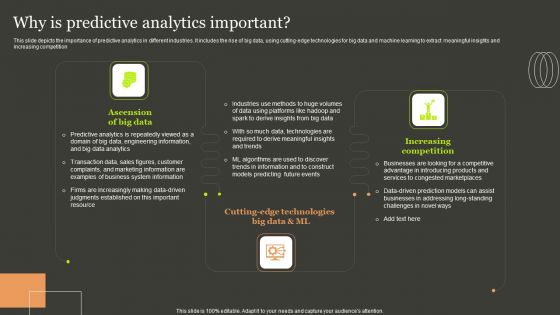
Predictive Analytics Methods Why Is Predictive Analytics Important Ideas PDF
This slide depicts the importance of predictive analytics in different industries. It includes the rise of big data, using cutting-edge technologies for big data and machine learning to extract meaningful insights and increasing competition. Whether you have daily or monthly meetings, a brilliant presentation is necessary. Predictive Analytics Methods Why Is Predictive Analytics Important Ideas PDF can be your best option for delivering a presentation. Represent everything in detail using Predictive Analytics Methods Why Is Predictive Analytics Important Ideas PDF and make yourself stand out in meetings. The template is versatile and follows a structure that will cater to your requirements. All the templates prepared by Slidegeeks are easy to download and edit. Our research experts have taken care of the corporate themes as well. So, give it a try and see the results.

Segmentation Of Global Prescriptive Analytics Market Data Analytics SS V
This slide provides an overview of market segmentation of prescriptive analytics at a global level. It covers segmentation analysis based on region, data type, component and deployment with key takeaways.Take your projects to the next level with our ultimate collection of Segmentation Of Global Prescriptive Analytics Market Data Analytics SS V. Slidegeeks has designed a range of layouts that are perfect for representing task or activity duration, keeping track of all your deadlines at a glance. Tailor these designs to your exact needs and give them a truly corporate look with your own brand colors they will make your projects stand out from the rest This slide provides an overview of market segmentation of prescriptive analytics at a global level. It covers segmentation analysis based on region, data type, component and deployment with key takeaways.
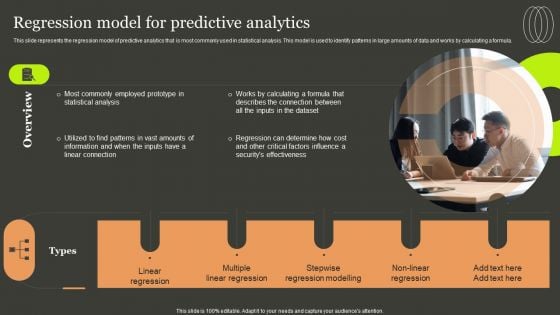
Predictive Analytics Methods Regression Model For Predictive Analytics Template PDF
This slide represents the regression model of predictive analytics that is most commonly used in statistical analysis. This model is used to identify patterns in large amounts of data and works by calculating a formula. Retrieve professionally designed Predictive Analytics Methods Regression Model For Predictive Analytics Template PDF to effectively convey your message and captivate your listeners. Save time by selecting pre made slideshows that are appropriate for various topics, from business to educational purposes. These themes come in many different styles, from creative to corporate, and all of them are easily adjustable and can be edited quickly. Access them as PowerPoint templates or as Google Slides themes. You do not have to go on a hunt for the perfect presentation because Slidegeeks got you covered from everywhere.
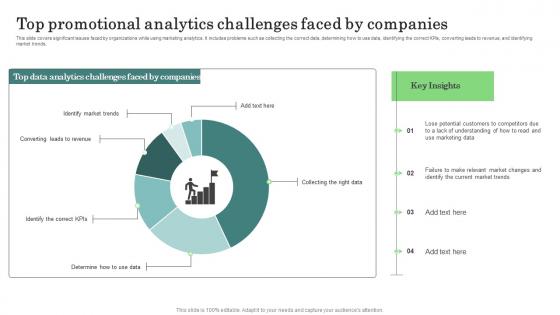
Major Promotional Analytics Future Trends Top Promotional Analytics Ideas Pdf
This slide covers significant issues faced by organizations while using marketing analytics. It includes problems such as collecting the correct data, determining how to use data, identifying the correct KPIs, converting leads to revenue, and identifying market trends. qSlidegeeks has constructed Major Promotional Analytics Future Trends Top Promotional Analytics Ideas Pdf after conducting extensive research and examination. These presentation templates are constantly being generated and modified based on user preferences and critiques from editors. Here, you will find the most attractive templates for a range of purposes while taking into account ratings and remarks from users regarding the content. This is an excellent jumping off point to explore our content and will give new users an insight into our top notch PowerPoint Templates. This slide covers significant issues faced by organizations while using marketing analytics. It includes problems such as collecting the correct data, determining how to use data, identifying the correct KPIs, converting leads to revenue, and identifying market trends.
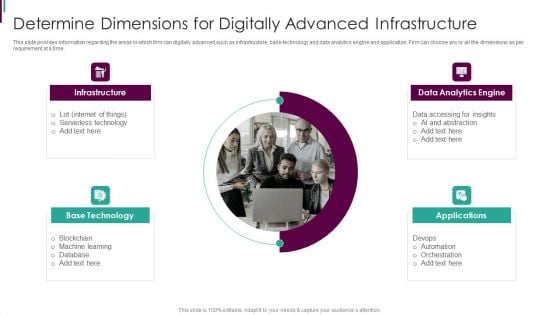
Developing Business Analytics Framework Determine Dimensions Diagrams PDF
This slide provides information regarding the areas in which firm can digitally advanced such as infrastructure, base technology and data analytics engine and application. Firm can choose any or all the dimensions as per requirement at a time. This is a Developing Business Analytics Framework Determine Dimensions Diagrams PDF template with various stages. Focus and dispense information on four stages using this creative set, that comes with editable features. It contains large content boxes to add your information on topics like Infrastructure, Analytics Engine, Base Technology You can also showcase facts, figures, and other relevant content using this PPT layout. Grab it now.
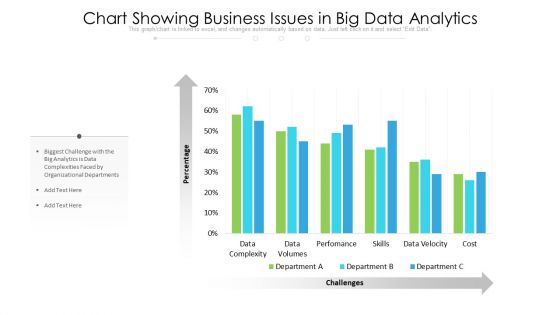
Chart Showing Business Issues In Big Data Analytics Diagrams PDF
Pitch your topic with ease and precision using this chart showing business issues in big data analytics diagrams pdf. This layout presents information on data complexity, data volumes, performance, skills. It is also available for immediate download and adjustment. So, changes can be made in the color, design, graphics or any other component to create a unique layout.
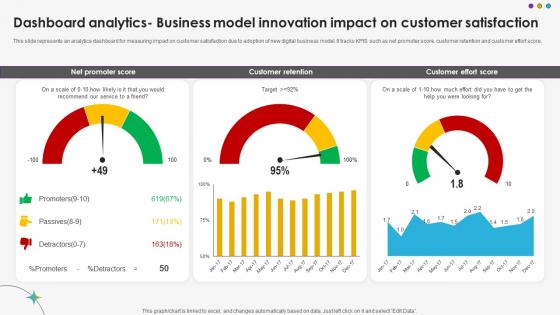
Dashboard Analytics Business Model Innovation Impact On Customer Satisfaction DT SS V
This slide represents an analytics dashboard for measuring impact on customer satisfaction due to adoption of new digital business model. It tracks KPIS such as net promoter score, customer retention and customer effort score.The Dashboard Analytics Business Model Innovation Impact On Customer Satisfaction DT SS V is a compilation of the most recent design trends as a series of slides. It is suitable for any subject or industry presentation, containing attractive visuals and photo spots for businesses to clearly express their messages. This template contains a variety of slides for the user to input data, such as structures to contrast two elements, bullet points, and slides for written information. Slidegeeks is prepared to create an impression. This slide represents an analytics dashboard for measuring impact on customer satisfaction due to adoption of new digital business model. It tracks KPIS such as net promoter score, customer retention and customer effort score.
Business Analytics Dashboard Vector Icon Ppt PowerPoint Presentation File Templates PDF
Presenting this set of slides with name business analytics dashboard vector icon ppt powerpoint presentation file templates pdf. This is a one stage process. The stages in this process is business analytics dashboard vector icon. This is a completely editable PowerPoint presentation and is available for immediate download. Download now and impress your audience.

Product Analytics Dashboard To Track Engagement Driving Business Success Integrating Product
This slide illustrates a dashboard to monitor customer engagement on company website by leveraging product analytics tools aimed at making necessary improvements. It covers insights regarding active monthly users, new users, total completed purchases, screen views, average duration of session, etc. There are so many reasons you need a Product Analytics Dashboard To Track Engagement Driving Business Success Integrating Product. The first reason is you can not spend time making everything from scratch, Thus, Slidegeeks has made presentation templates for you too. You can easily download these templates from our website easily. This slide illustrates a dashboard to monitor customer engagement on company website by leveraging product analytics tools aimed at making necessary improvements. It covers insights regarding active monthly users, new users, total completed purchases, screen views, average duration of session, etc.
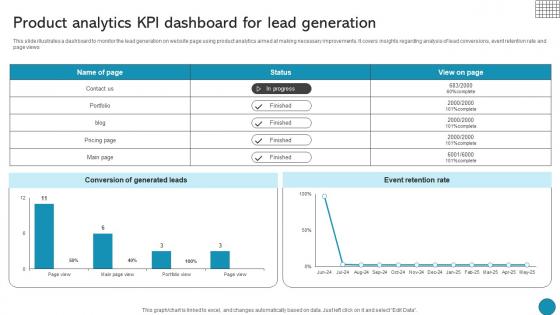
Product Analytics Kpi Dashboard For Lead Generation Driving Business Success Integrating Product
This slide illustrates a dashboard to monitor the lead generation on website page using product analytics aimed at making necessary improvements. It covers insights regarding analysis of lead conversions, event retention rate and page views Do you have to make sure that everyone on your team knows about any specific topic I yes, then you should give Product Analytics Kpi Dashboard For Lead Generation Driving Business Success Integrating Product a try. Our experts have put a lot of knowledge and effort into creating this impeccable Product Analytics Kpi Dashboard For Lead Generation Driving Business Success Integrating Product. You can use this template for your upcoming presentations, as the slides are perfect to represent even the tiniest detail. You can download these templates from the Slidegeeks website and these are easy to edit. So grab these today This slide illustrates a dashboard to monitor the lead generation on website page using product analytics aimed at making necessary improvements. It covers insights regarding analysis of lead conversions, event retention rate and page views
Developing Business Analytics Framework Tracking Intelligence Infrastructure Activities Dashboard Brochure PDF
This slide portrays information regarding tracking essential activities in intelligence infrastructure dashboard in terms of IT operations, security, business analytics, internet of things, etc. Deliver an awe inspiring pitch with this creative Developing Business Analytics Framework Tracking Intelligence Infrastructure Activities Dashboard Brochure PDF bundle. Topics like Application Delivery, Business Analytics, Internet Of Things can be discussed with this completely editable template. It is available for immediate download depending on the needs and requirements of the user.

Types Of Data Monitored In Product Analytics Product Analytics Implementation Data Analytics V
This slide outlines major categories of data tracked using product analytics aimed at improving performance to increase business revenue. It covers categories such as event tracking as well as properties Are you searching for a Types Of Data Monitored In Product Analytics Product Analytics Implementation Data Analytics V that is uncluttered, straightforward, and original Its easy to edit, and you can change the colors to suit your personal or business branding. For a presentation that expresses how much effort you have put in, this template is ideal With all of its features, including tables, diagrams, statistics, and lists, its perfect for a business plan presentation. Make your ideas more appealing with these professional slides. Download Types Of Data Monitored In Product Analytics Product Analytics Implementation Data Analytics V from Slidegeeks today. This slide outlines major categories of data tracked using product analytics aimed at improving performance to increase business revenue. It covers categories such as event tracking as well as properties
Dashboard Showing Business Analytics Vector Icon Ppt PowerPoint Presentation Model Templates PDF
Presenting dashboard showing business analytics vector icon ppt powerpoint presentation model templates pdf to dispense important information. This template comprises three stages. It also presents valuable insights into the topics including dashboard showing business analytics vector icon. This is a completely customizable PowerPoint theme that can be put to use immediately. So, download it and address the topic impactfully.
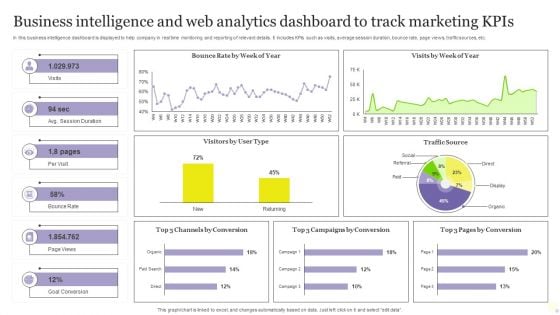
Business Intelligence And Web Analytics Dashboard To Track Marketing Kpis Inspiration PDF
In this business intelligence dashboard is displayed to help company in real time monitoring and reporting of relevant details. It includes KPIs such as visits, average session duration, bounce rate, page views, traffic sources, etc. Showcasing this set of slides titled Business Intelligence And Web Analytics Dashboard To Track Marketing Kpis Inspiration PDF. The topics addressed in these templates are Goal Conversion, Track Marketing Kpis, Web Analytics Dashboard. All the content presented in this PPT design is completely editable. Download it and make adjustments in color, background, font etc. as per your unique business setting.
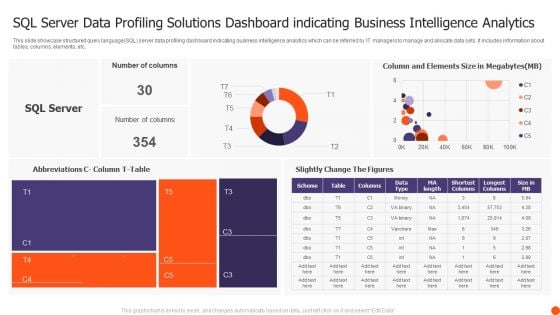
SQL Server Data Profiling Solutions Dashboard Indicating Business Intelligence Analytics Structure PDF
This slide showcase structured query language SQL server data profiling dashboard indicating business intelligence analytics which can be referred by IT managers to manage and allocate data sets. It includes information about tables, columns, elements, etc. Showcasing this set of slides titled SQL Server Data Profiling Solutions Dashboard Indicating Business Intelligence Analytics Structure PDF. The topics addressed in these templates are Number Columns, Slightly Change Figures, SQL Server. All the content presented in this PPT design is completely editable. Download it and make adjustments in color, background, font etc. as per your unique business setting.
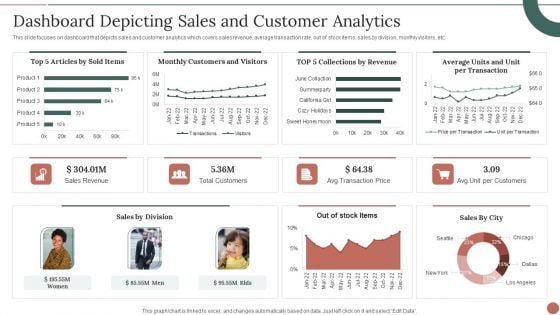
Retail Business Product Planning Procedure Dashboard Depicting Sales And Customer Analytics Themes PDF
This slide focuses on dashboard that depicts sales and customer analytics which covers sales revenue, average transaction rate, out of stock items, sales by division, monthly visitors, etc. Deliver and pitch your topic in the best possible manner with this Retail Business Product Planning Procedure Dashboard Depicting Sales And Customer Analytics Themes PDF. Use them to share invaluable insights on Sales Revenue, Total Customers, Sales By Division and impress your audience. This template can be altered and modified as per your expectations. So, grab it now.
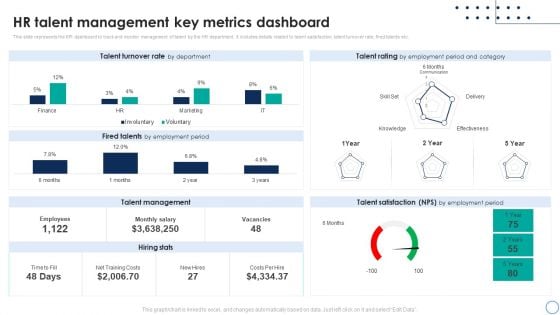
Business Analytics Application HR Talent Management Key Metrics Dashboard Rules PDF
This slide represents the KPI dashboard to track and monitor management of talent by the HR department. It includes details related to talent satisfaction, talent turnover rate, fired talents etc. This Business Analytics Application HR Talent Management Key Metrics Dashboard Rules PDF is perfect for any presentation, be it in front of clients or colleagues. It is a versatile and stylish solution for organizing your meetings. The Business Analytics Application HR Talent Management Key Metrics Dashboard Rules PDF features a modern design for your presentation meetings. The adjustable and customizable slides provide unlimited possibilities for acing up your presentation. Slidegeeks has done all the homework before launching the product for you. So, dont wait, grab the presentation templates today.
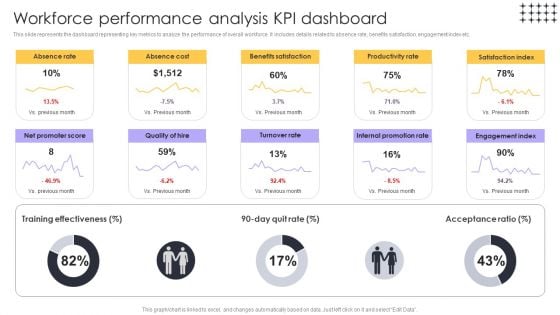
Tools For HR Business Analytics Workforce Performance Analysis KPI Dashboard Pictures PDF
This slide represents the dashboard representing key metrics to analyze the performance of overall workforce. It includes details related to absence rate, benefits satisfaction, engagement index etc. Here you can discover an assortment of the finest PowerPoint and Google Slides templates. With these templates, you can create presentations for a variety of purposes while simultaneously providing your audience with an eye-catching visual experience. Download Tools For HR Business Analytics Workforce Performance Analysis KPI Dashboard Pictures PDF to deliver an impeccable presentation. These templates will make your job of preparing presentations much quicker, yet still, maintain a high level of quality. Slidegeeks has experienced researchers who prepare these templates and write high-quality content for you. Later on, you can personalize the content by editing the Tools For HR Business Analytics Workforce Performance Analysis KPI Dashboard Pictures PDF.
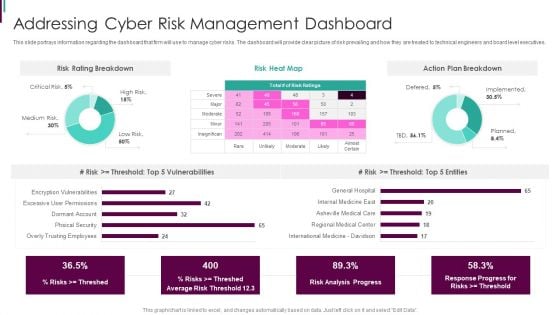
Developing Business Analytics Framework Addressing Cyber Risk Management Dashboard Graphics PDF
This slide portrays information regarding the dashboard that firm will use to manage cyber risks. The dashboard will provide clear picture of risk prevailing and how they are treated to technical engineers and board level executives.Deliver and pitch your topic in the best possible manner with this Developing Business Analytics Framework Addressing Cyber Risk Management Dashboard Graphics PDF Use them to share invaluable insights on Risk Breakdown, Action Breakdown, Vulnerabilities and impress your audience. This template can be altered and modified as per your expectations. So, grab it now.
business intelligence and analytics dashboard ppt powerpoint presentation icon example topics pdf
Presenting this set of slides with name business intelligence and analytics dashboard ppt powerpoint presentation icon example topics pdf. The topics discussed in these slides are geographic distribution of total revenue, top 5 product by total revenue, measuring running by total revenue, how close are we to tour planned total revenue. This is a completely editable PowerPoint presentation and is available for immediate download. Download now and impress your audience.
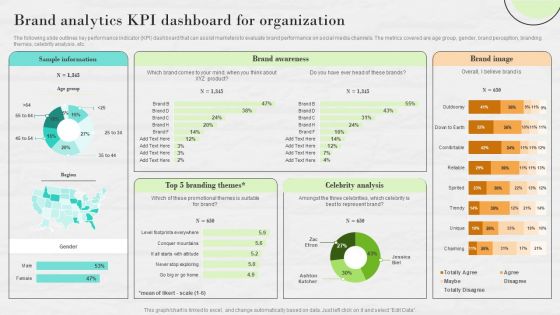
Market Research To Determine Business Opportunities Brand Analytics KPI Dashboard For Organization Inspiration PDF
The following slide outlines key performance indicator KPI dashboard that can assist marketers to evaluate brand performance on social media channels. The metrics covered are age group, gender, brand perception, branding themes, celebrity analysis, etc. There are so many reasons you need a Market Research To Determine Business Opportunities Brand Analytics KPI Dashboard For Organization Inspiration PDF. The first reason is you cannot spend time making everything from scratch, Thus, Slidegeeks has made presentation templates for you too. You can easily download these templates from our website easily.
Online Marketing Analytics To Enhance Business Growth Website Landing Page KPI Tracking Dashboard Sample PDF
This slide covers a dashboard for analyzing the metrics of the website landing page. It includes KPIs such as conversions, conversion rate, sessions, bounce rate, engagement sickness, etc. If your project calls for a presentation, then Slidegeeks is your go to partner because we have professionally designed, easy to edit templates that are perfect for any presentation. After downloading, you can easily edit Online Marketing Analytics To Enhance Business Growth Website Landing Page KPI Tracking Dashboard Sample PDF and make the changes accordingly. You can rearrange slides or fill them with different images. Check out all the handy templates
Online Marketing Analytics To Enhance Business Growth Kpi Dashboard For Tracking Email Marketing Mockup PDF
This slide covers the dashboard for analyzing email marketing metrics such as overall open rate, click-through rate, click to open ratio, unsubscribe rate, hard bounce rate, soft rate, monthly open rate, total monthly subscribers, etc. There are so many reasons you need a Online Marketing Analytics To Enhance Business Growth Kpi Dashboard For Tracking Email Marketing Mockup PDF. The first reason is you cannot spend time making everything from scratch, Thus, Slidegeeks has made presentation templates for you too. You can easily download these templates from our website easily.
Optimizing Marketing Analytics To Enhance Organizational Growth Dashboard For Tracking Business Designs PDF
This slide covers the dashboard for analyzing blogging KPIs such as performance, published posts, views, new blog subscribers, top blog posts by pageviews, top blog posts by CTR, etc. Do you know about Slidesgeeks Optimizing Marketing Analytics To Enhance Organizational Growth Dashboard For Tracking Business Designs PDF These are perfect for delivering any kind od presentation. Using it, create PowerPoint presentations that communicate your ideas and engage audiences. Save time and effort by using our pre designed presentation templates that are perfect for a wide range of topic. Our vast selection of designs covers a range of styles, from creative to business, and are all highly customizable and easy to edit. Download as a PowerPoint template or use them as Google Slides themes.

Product Analytics Training Plan For Employees Product Analytics Implementation Data Analytics V
This slide outlines training plan aimed at helping employees learn the basics of product analytics to streamline its usage in the business enterprises. It covers details on training module, mode of training, training time slots with trainer name.Whether you have daily or monthly meetings, a brilliant presentation is necessary. Product Analytics Training Plan For Employees Product Analytics Implementation Data Analytics V can be your best option for delivering a presentation. Represent everything in detail using Product Analytics Training Plan For Employees Product Analytics Implementation Data Analytics V and make yourself stand out in meetings. The template is versatile and follows a structure that will cater to your requirements. All the templates prepared by Slidegeeks are easy to download and edit. Our research experts have taken care of the corporate themes as well. So, give it a try and see the results. This slide outlines training plan aimed at helping employees learn the basics of product analytics to streamline its usage in the business enterprises. It covers details on training module, mode of training, training time slots with trainer name.

Implementation Timeline Of Product Analytics In Organisation Product Analytics Implementation Data Analytics V
This slide illustrates a weekly timeline of activities undertaken while implementing product analytics in businesses to streamline operations. It covers activities under four heads choose simple use case, implement data governance, democratize product analytics and build expe4rimentataion culture Retrieve professionally designed Implementation Timeline Of Product Analytics In Organisation Product Analytics Implementation Data Analytics V to effectively convey your message and captivate your listeners. Save time by selecting pre-made slideshows that are appropriate for various topics, from business to educational purposes. These themes come in many different styles, from creative to corporate, and all of them are easily adjustable and can be edited quickly. Access them as PowerPoint templates or as Google Slides themes. You do not have to go on a hunt for the perfect presentation because Slidegeeks got you covered from everywhere. This slide illustrates a weekly timeline of activities undertaken while implementing product analytics in businesses to streamline operations. It covers activities under four heads choose simple use case, implement data governance, democratize product analytics and build expe4rimentataion culture

Key Metrics Used To Track Product Analytics Product Analytics Implementation Data Analytics V
This slide outlines major metrics used by businesses to analyse product performance aimed at making necessary improvements. It covers key metrics such as engagement, retention, customer lifetime value, number of crashes and feature adoption rate with benefits Do you know about Slidesgeeks Key Metrics Used To Track Product Analytics Product Analytics Implementation Data Analytics V These are perfect for delivering any kind od presentation. Using it, create PowerPoint presentations that communicate your ideas and engage audiences. Save time and effort by using our pre-designed presentation templates that are perfect for a wide range of topic. Our vast selection of designs covers a range of styles, from creative to business, and are all highly customizable and easy to edit. Download as a PowerPoint template or use them as Google Slides themes. This slide outlines major metrics used by businesses to analyse product performance aimed at making necessary improvements. It covers key metrics such as engagement, retention, customer lifetime value, number of crashes and feature adoption rate with benefits

Agenda For Data Analytics Management Diagrams PDF
Presenting Agenda For Data Analytics Management Diagrams PDF to provide visual cues and insights. Share and navigate important information on five stages that need your due attention. This template can be used to pitch topics like Agenda. In addtion, this PPT design contains high resolution images, graphics, etc, that are easily editable and available for immediate download.
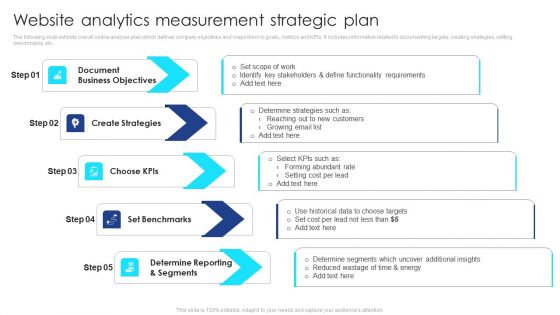
Website Analytics Measurement Strategic Plan Diagrams PDF
The following slide exhibits overall online analysis plan which defines company objectives and maps them to goals, metrics and KPIs. It includes information related to documenting targets, creating strategies, setting benchmarks, etc. Presenting Website Analytics Measurement Strategic Plan Diagrams PDF to dispense important information. This template comprises five stages. It also presents valuable insights into the topics including Document Business Objectives, Create Strategies, Choose Kpis, Set Benchmarks, Determine Reporting And Segments. This is a completely customizable PowerPoint theme that can be put to use immediately. So, download it and address the topic impactfully.
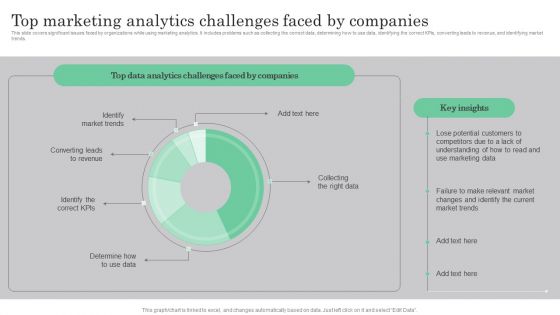
Online Marketing Analytics To Enhance Business Growth Top Marketing Analytics Challenges Introduction PDF
This slide covers significant issues faced by organizations while using marketing analytics. It includes problems such as collecting the correct data, determining how to use data, identifying the correct KPIs, converting leads to revenue, and identifying market trends. Do you have an important presentation coming up Are you looking for something that will make your presentation stand out from the rest Look no further than Online Marketing Analytics To Enhance Business Growth Top Marketing Analytics Challenges Introduction PDF. With our professional designs, you can trust that your presentation will pop and make delivering it a smooth process. And with Slidegeeks, you can trust that your presentation will be unique and memorable. So why wait Grab Online Marketing Analytics To Enhance Business Growth Top Marketing Analytics Challenges Introduction PDF today and make your presentation stand out from the rest.
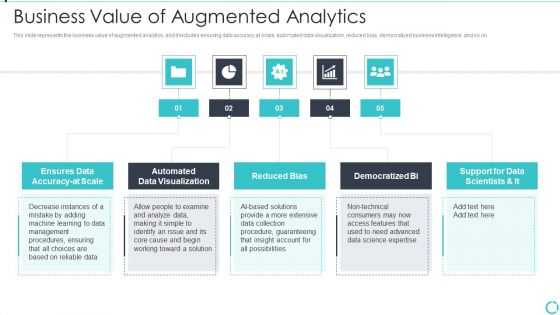
Augmented Analytics Implementation IT Business Value Of Augmented Analytics Slides PDF
This slide represents the business value of augmented analytics, and it includes ensuring data accuracy at scale, automated data visualization, reduced bias, democratized business intelligence, and so on. This is a Augmented Analytics Implementation IT Business Value Of Augmented Analytics Slides PDF template with various stages. Focus and dispense information on five stages using this creative set, that comes with editable features. It contains large content boxes to add your information on topics like Ensures Data Accuracy At Scale, Automated Data Visualization, Reduced Bias, Democratized Bi, Support For Data Scientists And IT. You can also showcase facts, figures, and other relevant content using this PPT layout. Grab it now.
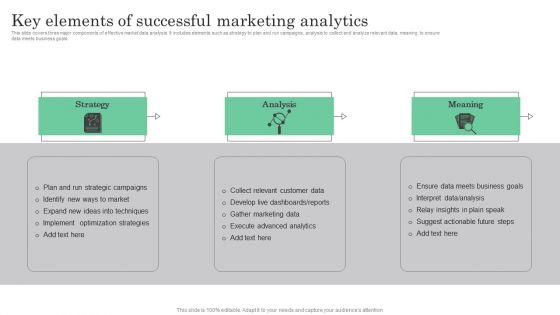
Online Marketing Analytics To Enhance Business Growth Key Elements Of Successful Marketing Analytics Demonstration PDF
This slide covers three major components of effective market data analysis. It includes elements such as strategy to plan and run campaigns, analysis to collect and analyze relevant data, meaning to ensure data meets business goals. Whether you have daily or monthly meetings, a brilliant presentation is necessary. Online Marketing Analytics To Enhance Business Growth Key Elements Of Successful Marketing Analytics Demonstration PDF can be your best option for delivering a presentation. Represent everything in detail using Online Marketing Analytics To Enhance Business Growth Key Elements Of Successful Marketing Analytics Demonstration PDF and make yourself stand out in meetings. The template is versatile and follows a structure that will cater to your requirements. All the templates prepared by Slidegeeks are easy to download and edit. Our research experts have taken care of the corporate themes as well. So, give it a try and see the results.


 Continue with Email

 Home
Home


