Business Analytics Dashboard Diagram
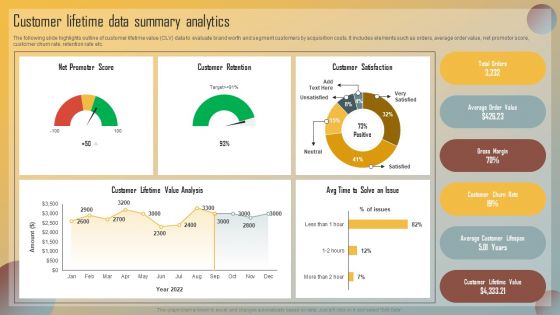
Guide For Marketing Analytics To Improve Decisions Customer Lifetime Data Summary Analytics Structure PDF
The following slide highlights outline of customer lifetime value CLV data to evaluate brand worth and segment customers by acquisition costs. It includes elements such as orders, average order value, net promotor score, customer churn rate, retention rate etc. Find a pre designed and impeccable Guide For Marketing Analytics To Improve Decisions Customer Lifetime Data Summary Analytics Structure PDF. The templates can ace your presentation without additional effort. You can download these easy to edit presentation templates to make your presentation stand out from others. So, what are you waiting for Download the template from Slidegeeks today and give a unique touch to your presentation.
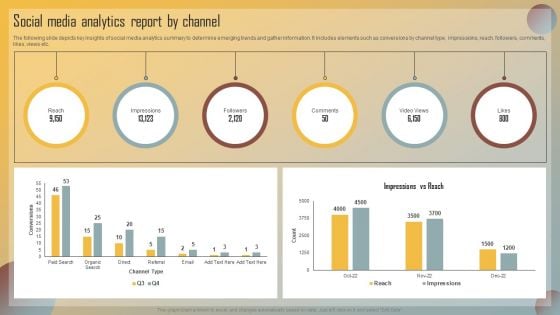
Guide For Marketing Analytics To Improve Decisions Social Media Analytics Report By Channel Themes PDF
The following slide depicts key insights of social media analytics summary to determine emerging trends and gather information. It includes elements such as conversions by channel type, impressions, reach, followers, comments, likes, views etc. Present like a pro with Guide For Marketing Analytics To Improve Decisions Social Media Analytics Report By Channel Themes PDF Create beautiful presentations together with your team, using our easy to use presentation slides. Share your ideas in real time and make changes on the fly by downloading our templates. So whether you are in the office, on the go, or in a remote location, you can stay in sync with your team and present your ideas with confidence. With Slidegeeks presentation got a whole lot easier. Grab these presentations today.
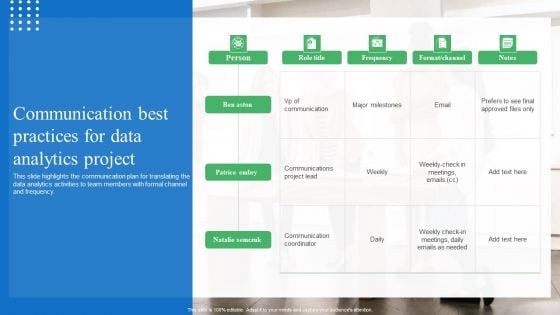
Toolkit For Data Science And Analytics Transition Communication Best Practices For Data Analytics Project Summary PDF
This slide highlights the communication plan for translating the data analytics activities to team members with formal channel and frequency. Do you know about Slidesgeeks Toolkit For Data Science And Analytics Transition Communication Best Practices For Data Analytics Project Summary PDF These are perfect for delivering any kind od presentation. Using it, create PowerPoint presentations that communicate your ideas and engage audiences. Save time and effort by using our pre designed presentation templates that are perfect for a wide range of topic. Our vast selection of designs covers a range of styles, from creative to business, and are all highly customizable and easy to edit. Download as a PowerPoint template or use them as Google Slides themes.
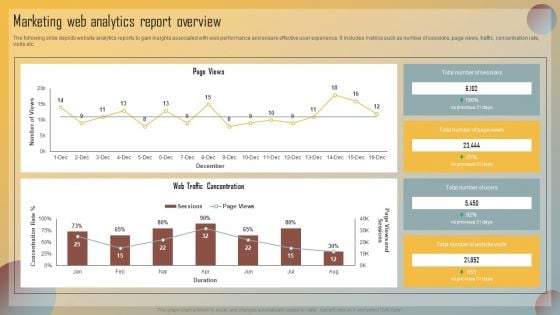
Guide For Marketing Analytics To Improve Decisions Marketing Web Analytics Report Overview Microsoft PDF
The following slide depicts website analytics reports to gain insights associated with web performance and ensure effective user experience. It includes metrics such as number of sessions, page views, traffic, concentration rate, visits etc. Want to ace your presentation in front of a live audience Our Guide For Marketing Analytics To Improve Decisions Marketing Web Analytics Report Overview Microsoft PDF can help you do that by engaging all the users towards you. Slidegeeks experts have put their efforts and expertise into creating these impeccable powerpoint presentations so that you can communicate your ideas clearly. Moreover, all the templates are customizable, and easy to edit and downloadable. Use these for both personal and commercial use.
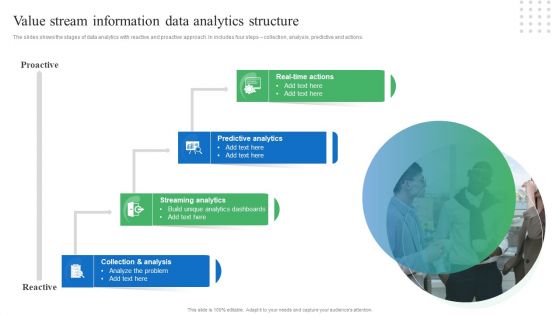
Toolkit For Data Science And Analytics Transition Value Stream Information Data Analytics Structure Sample PDF
The slides shows the stages of data analytics with reactive and proactive approach. In includes four steps collection, analysis, predictive and actions. Retrieve professionally designed Toolkit For Data Science And Analytics Transition Value Stream Information Data Analytics Structure Sample PDF to effectively convey your message and captivate your listeners. Save time by selecting pre made slideshows that are appropriate for various topics, from business to educational purposes. These themes come in many different styles, from creative to corporate, and all of them are easily adjustable and can be edited quickly. Access them as PowerPoint templates or as Google Slides themes. You do not have to go on a hunt for the perfect presentation because Slidegeeks got you covered from everywhere.

Toolkit For Data Science And Analytics Transition Data Analytics Value Stream Chain Pictures PDF
This slide illustrates the series of activities required for analyzing the data. It contains information such as data preparation, exploratory analysis, and predictive analytics etc. If you are looking for a format to display your unique thoughts, then the professionally designed Toolkit For Data Science And Analytics Transition Data Analytics Value Stream Chain Pictures PDF is the one for you. You can use it as a Google Slides template or a PowerPoint template. Incorporate impressive visuals, symbols, images, and other charts. Modify or reorganize the text boxes as you desire. Experiment with shade schemes and font pairings. Alter, share or cooperate with other people on your work. Download Toolkit For Data Science And Analytics Transition Data Analytics Value Stream Chain Pictures PDF and find out how to give a successful presentation. Present a perfect display to your team and make your presentation unforgettable.
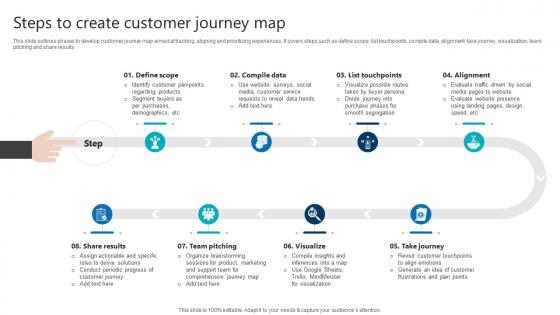
Steps To Create Customer Journey Map Product Analytics Implementation Data Analytics V
This slide outlines phases to develop customer journey map aimed at tracking, aligning and prioritizing experiences. It covers steps such as define scope, list touchpoints, compile data, alignment, take journey, visualization, team pitching and share results Welcome to our selection of the Steps To Create Customer Journey Map Product Analytics Implementation Data Analytics V. These are designed to help you showcase your creativity and bring your sphere to life. Planning and Innovation are essential for any business that is just starting out. This collection contains the designs that you need for your everyday presentations. All of our PowerPoints are 100 percent editable, so you can customize them to suit your needs. This multi-purpose template can be used in various situations. Grab these presentation templates today. This slide outlines phases to develop customer journey map aimed at tracking, aligning and prioritizing experiences. It covers steps such as define scope, list touchpoints, compile data, alignment, take journey, visualization, team pitching and share results
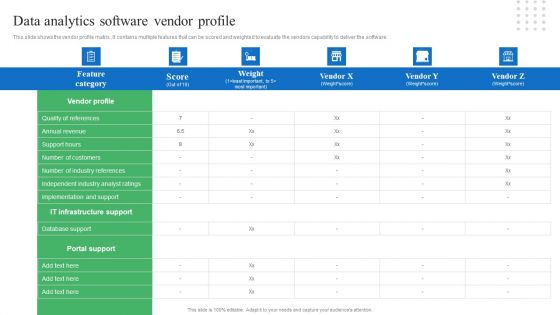
Toolkit For Data Science And Analytics Transition Data Analytics Software Vendor Profile Themes PDF
This slide shows the vendor profile matrix. It contains multiple features that can be scored and weighted to evaluate the vendors capability to deliver the software. Slidegeeks is here to make your presentations a breeze with Toolkit For Data Science And Analytics Transition Data Analytics Software Vendor Profile Themes PDF With our easy to use and customizable templates, you can focus on delivering your ideas rather than worrying about formatting. With a variety of designs to choose from, you are sure to find one that suits your needs. And with animations and unique photos, illustrations, and fonts, you can make your presentation pop. So whether you are giving a sales pitch or presenting to the board, make sure to check out Slidegeeks first.
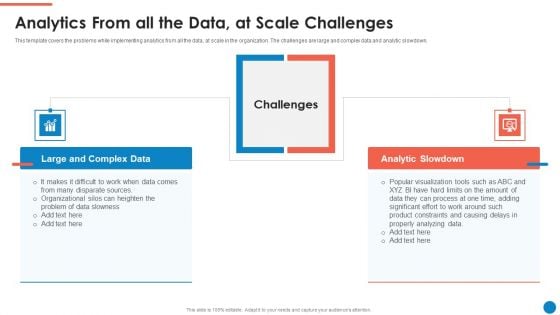
Data And Analytics Playbook Analytics From All The Data At Scale Challenges Summary PDF
This template covers the problems while implementing analytics from all the data, at scale in the organization. The challenges are large and complex data and analytic slowdown. This is a Data And Analytics Playbook Analytics From All The Data At Scale Challenges Summary PDF template with various stages. Focus and dispense information on two stages using this creative set, that comes with editable features. It contains large content boxes to add your information on topics like Large And Complex Data, Analytic Slowdown, Challenges, Data Slowness. You can also showcase facts, figures, and other relevant content using this PPT layout. Grab it now.
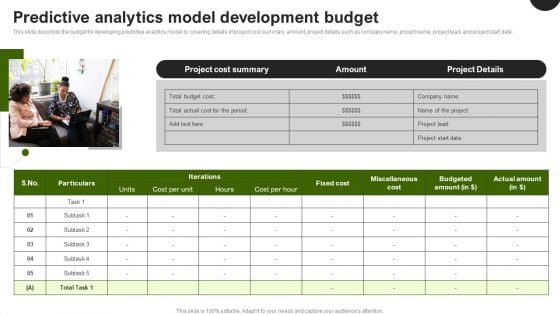
Predictive Analytics In The Age Of Big Data Predictive Analytics Model Development Budget Elements PDF
This slide describes the budget for developing predictive analytics model by covering details of project cost summary, amount, project details such as company name, project name, project lead, and project start date. Retrieve professionally designed Predictive Analytics In The Age Of Big Data Predictive Analytics Model Development Budget Elements PDF to effectively convey your message and captivate your listeners. Save time by selecting pre made slideshows that are appropriate for various topics, from business to educational purposes. These themes come in many different styles, from creative to corporate, and all of them are easily adjustable and can be edited quickly. Access them as PowerPoint templates or as Google Slides themes. You do not have to go on a hunt for the perfect presentation because Slidegeeks got you covered from everywhere.
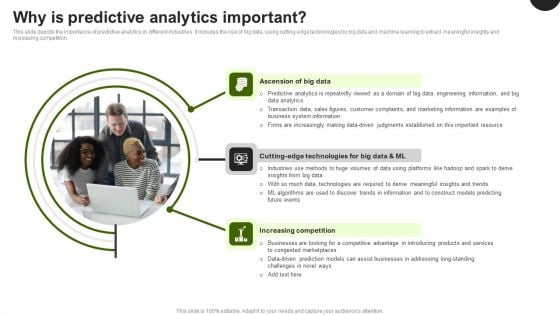
Predictive Analytics In The Age Of Big Data Why Is Predictive Analytics Important Clipart PDF
This slide depicts the importance of predictive analytics in different industries. It includes the rise of big data, using cutting-edge technologies for big data and machine learning to extract meaningful insights and increasing competition. Whether you have daily or monthly meetings, a brilliant presentation is necessary. Predictive Analytics In The Age Of Big Data Why Is Predictive Analytics Important Clipart PDF can be your best option for delivering a presentation. Represent everything in detail using Predictive Analytics In The Age Of Big Data Why Is Predictive Analytics Important Clipart PDF and make yourself stand out in meetings. The template is versatile and follows a structure that will cater to your requirements. All the templates prepared by Slidegeeks are easy to download and edit. Our research experts have taken care of the corporate themes as well. So, give it a try and see the results.
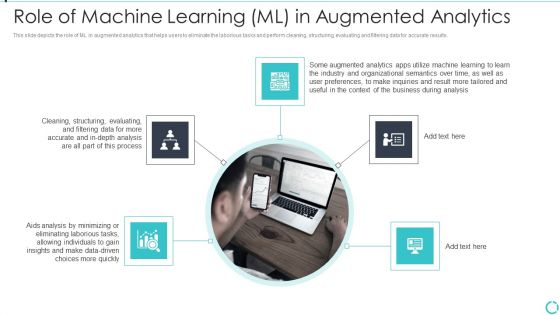
Augmented Analytics Implementation IT Role Of Machine Learning ML In Augmented Analytics Brochure PDF
This slide depicts the role of ML in augmented analytics that helps users to eliminate the laborious tasks and perform cleaning, structuring, evaluating and filtering data for accurate results. This is a Augmented Analytics Implementation IT Role Of Machine Learning ML In Augmented Analytics Brochure PDF template with various stages. Focus and dispense information on five stages using this creative set, that comes with editable features. It contains large content boxes to add your information on topics like Cleaning, Structuring, Evaluating, Business, Analysis. You can also showcase facts, figures, and other relevant content using this PPT layout. Grab it now.
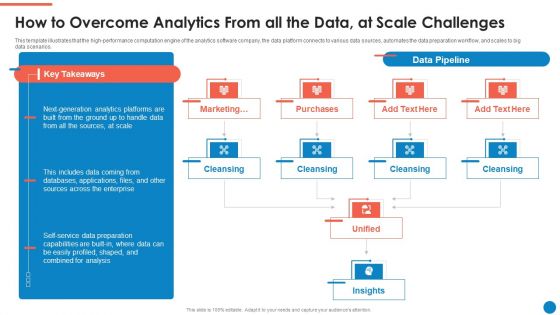
Data And Analytics Playbook How To Overcome Analytics From All The Data At Professional PDF
This template illustrates that the high-performance computation engine of the analytics software company, the data platform connects to various data sources, automates the data preparation workflow, and scales to big data scenarios. Presenting Data And Analytics Playbook How To Overcome Analytics From All The Data At Professional PDF to provide visual cues and insights. Share and navigate important information on ten stages that need your due attention. This template can be used to pitch topics like Marketing, Purchases, Cleansing, Insights, Unified. In addtion, this PPT design contains high resolution images, graphics, etc, that are easily editable and available for immediate download.
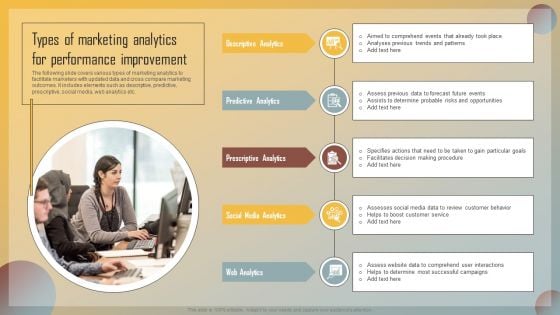
Guide For Marketing Analytics To Improve Decisions Types Of Marketing Analytics For Performance Improvement Demonstration PDF
The following slide covers various types of marketing analytics to facilitate marketers with updated data and cross compare marketing outcomes. It includes elements such as descriptive, predictive, prescriptive, social media, web analytics etc. Retrieve professionally designed Guide For Marketing Analytics To Improve Decisions Types Of Marketing Analytics For Performance Improvement Demonstration PDF to effectively convey your message and captivate your listeners. Save time by selecting pre made slideshows that are appropriate for various topics, from business to educational purposes. These themes come in many different styles, from creative to corporate, and all of them are easily adjustable and can be edited quickly. Access them as PowerPoint templates or as Google Slides themes. You do not have to go on a hunt for the perfect presentation because Slidegeeks got you covered from everywhere.
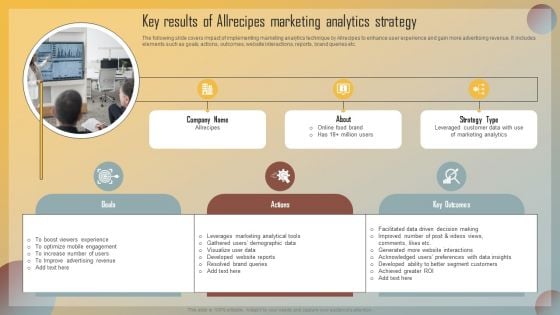
Guide For Marketing Analytics To Improve Decisions Key Results Of Allrecipes Marketing Analytics Strategy Themes PDF
The following slide covers impact of implementing marketing analytics technique by Allrecipes to enhance user experience and gain more advertising revenue. It includes elements such as goals, actions, outcomes, website interactions, reports, brand queries etc. Whether you have daily or monthly meetings, a brilliant presentation is necessary. Guide For Marketing Analytics To Improve Decisions Key Results Of Allrecipes Marketing Analytics Strategy Themes PDF can be your best option for delivering a presentation. Represent everything in detail using Guide For Marketing Analytics To Improve Decisions Key Results Of Allrecipes Marketing Analytics Strategy Themes PDF and make yourself stand out in meetings. The template is versatile and follows a structure that will cater to your requirements. All the templates prepared by Slidegeeks are easy to download and edit. Our research experts have taken care of the corporate themes as well. So, give it a try and see the results.
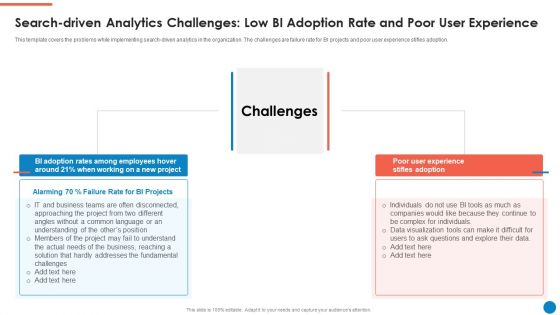
Data And Analytics Playbook Search Driven Analytics Challenges Low Bi Adoption Rate Brochure PDF
This template covers the problems while implementing search-driven analytics in the organization. The challenges are failure rate for BI projects and poor user experience stifles adoption. This is a Data And Analytics Playbook Search Driven Analytics Challenges Low Bi Adoption Rate Brochure PDF template with various stages. Focus and dispense information on two stages using this creative set, that comes with editable features. It contains large content boxes to add your information on topics like Challenges, Poor User Experience, Stifles Adoption, Employees, Project. You can also showcase facts, figures, and other relevant content using this PPT layout. Grab it now.
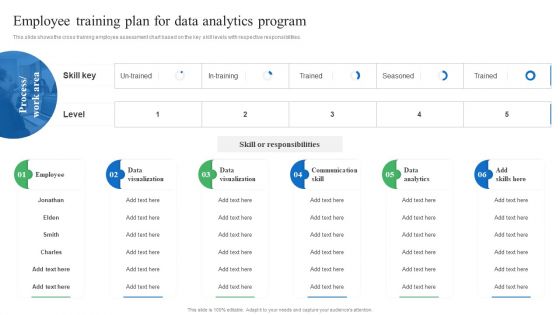
Toolkit For Data Science And Analytics Transition Employee Training Plan For Data Analytics Program Microsoft PDF
This slide shows the cross training employee assessment chart based on the key skill levels with respective responsibilities. Do you have an important presentation coming up Are you looking for something that will make your presentation stand out from the rest Look no further than Toolkit For Data Science And Analytics Transition Employee Training Plan For Data Analytics Program Microsoft PDF. With our professional designs, you can trust that your presentation will pop and make delivering it a smooth process. And with Slidegeeks, you can trust that your presentation will be unique and memorable. So why wait Grab Toolkit For Data Science And Analytics Transition Employee Training Plan For Data Analytics Program Microsoft PDF today and make your presentation stand out from the rest.
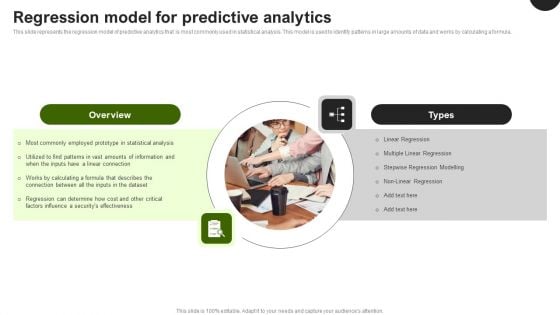
Predictive Analytics In The Age Of Big Data Regression Model For Predictive Analytics Elements PDF
This slide represents the regression model of predictive analytics that is most commonly used in statistical analysis. This model is used to identify patterns in large amounts of data and works by calculating a formula. Do you know about Slidesgeeks Predictive Analytics In The Age Of Big Data Regression Model For Predictive Analytics Elements PDF, These are perfect for delivering any kind od presentation. Using it, create PowerPoint presentations that communicate your ideas and engage audiences. Save time and effort by using our pre designed presentation templates that are perfect for a wide range of topic. Our vast selection of designs covers a range of styles, from creative to business, and are all highly customizable and easy to edit. Download as a PowerPoint template or use them as Google Slides themes.
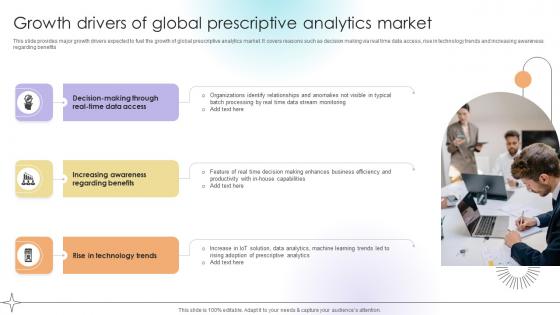
Growth Drivers Of Global Prescriptive Analytics Market Data Analytics SS V
This slide provides major growth drivers expected to fuel the growth of global prescriptive analytics market. It covers reasons such as decision making via real time data access, rise in technology trends and increasing awareness regarding benefits.Do you know about Slidesgeeks Growth Drivers Of Global Prescriptive Analytics Market Data Analytics SS V These are perfect for delivering any kind od presentation. Using it, create PowerPoint presentations that communicate your ideas and engage audiences. Save time and effort by using our pre-designed presentation templates that are perfect for a wide range of topic. Our vast selection of designs covers a range of styles, from creative to business, and are all highly customizable and easy to edit. Download as a PowerPoint template or use them as Google Slides themes. This slide provides major growth drivers expected to fuel the growth of global prescriptive analytics market. It covers reasons such as decision making via real time data access, rise in technology trends and increasing awareness regarding benefits.
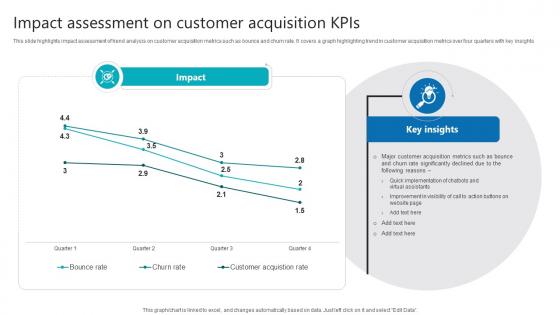
Impact Assessment On Customer Acquisition Kpis Product Analytics Implementation Data Analytics V
This slide highlights impact assessment of trend analysis on customer acquisition metrics such as bounce and churn rate. It covers a graph highlighting trend in customer acquisition metrics over four quarters with key insights The Impact Assessment On Customer Acquisition Kpis Product Analytics Implementation Data Analytics V is a compilation of the most recent design trends as a series of slides. It is suitable for any subject or industry presentation, containing attractive visuals and photo spots for businesses to clearly express their messages. This template contains a variety of slides for the user to input data, such as structures to contrast two elements, bullet points, and slides for written information. Slidegeeks is prepared to create an impression. This slide highlights impact assessment of trend analysis on customer acquisition metrics such as bounce and churn rate. It covers a graph highlighting trend in customer acquisition metrics over four quarters with key insights
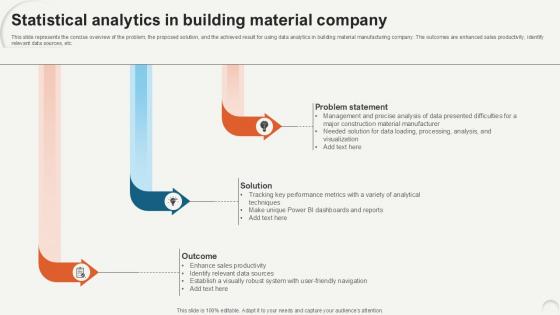
Statistical Analytics In Building Data Analytics For Informed Decision Ppt PowerPoint
This slide represents the concise overview of the problem, the proposed solution, and the achieved result for using data analytics in building material manufacturing company. The outcomes are enhanced sales productivity, identify relevant data sources, etc. Do you know about Slidesgeeks Statistical Analytics In Building Data Analytics For Informed Decision Ppt PowerPoint These are perfect for delivering any kind od presentation. Using it, create PowerPoint presentations that communicate your ideas and engage audiences. Save time and effort by using our pre-designed presentation templates that are perfect for a wide range of topic. Our vast selection of designs covers a range of styles, from creative to business, and are all highly customizable and easy to edit. Download as a PowerPoint template or use them as Google Slides themes. This slide represents the concise overview of the problem, the proposed solution, and the achieved result for using data analytics in building material manufacturing company. The outcomes are enhanced sales productivity, identify relevant data sources, etc.
Predictive Analytics Model Performance Tracking Predictive Analytics For Improved Portrait Pdf
This slide represents the predictive analytics model performance tracking dashboard, and it covers the details of total visitors, total buyers, total products added to the cart, filters by date and category, visitors to clients conversion rate, and so on. Here you can discover an assortment of the finest PowerPoint and Google Slides templates. With these templates, you can create presentations for a variety of purposes while simultaneously providing your audience with an eye-catching visual experience. Download Predictive Analytics Model Performance Tracking Predictive Analytics For Improved Portrait Pdf to deliver an impeccable presentation. These templates will make your job of preparing presentations much quicker, yet still, maintain a high level of quality. Slidegeeks has experienced researchers who prepare these templates and write high-quality content for you. Later on, you can personalize the content by editing the Predictive Analytics Model Performance Tracking Predictive Analytics For Improved Portrait Pdf. This slide represents the predictive analytics model performance tracking dashboard, and it covers the details of total visitors, total buyers, total products added to the cart, filters by date and category, visitors to clients conversion rate, and so on.
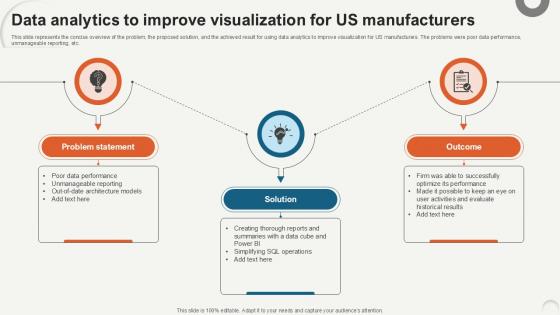
Data Analytics To Improve Visualization Data Analytics For Informed Decision Ppt PowerPoint
This slide represents the concise overview of the problem, the proposed solution, and the achieved result for using data analytics to improve visualization for US manufacturers. The problems were poor data performance, unmanageable reporting, etc. Whether you have daily or monthly meetings, a brilliant presentation is necessary. Data Analytics To Improve Visualization Data Analytics For Informed Decision Ppt PowerPoint can be your best option for delivering a presentation. Represent everything in detail using Data Analytics To Improve Visualization Data Analytics For Informed Decision Ppt PowerPoint and make yourself stand out in meetings. The template is versatile and follows a structure that will cater to your requirements. All the templates prepared by Slidegeeks are easy to download and edit. Our research experts have taken care of the corporate themes as well. So, give it a try and see the results. This slide represents the concise overview of the problem, the proposed solution, and the achieved result for using data analytics to improve visualization for US manufacturers. The problems were poor data performance, unmanageable reporting, etc.
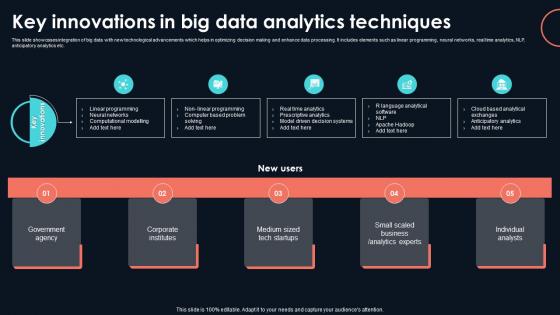
Key Innovations In Big Data Analytics Developing Strategic Insights Using Big Data Analytics SS V
This slide showcases integration of big data with new technological advancements which helps in optimizing decision making and enhance data processing. It includes elements such as linear programming, neural networks, real time analytics, NLP, anticipatory analytics etc. Whether you have daily or monthly meetings, a brilliant presentation is necessary. Key Innovations In Big Data Analytics Developing Strategic Insights Using Big Data Analytics SS V can be your best option for delivering a presentation. Represent everything in detail using Key Innovations In Big Data Analytics Developing Strategic Insights Using Big Data Analytics SS V and make yourself stand out in meetings. The template is versatile and follows a structure that will cater to your requirements. All the templates prepared by Slidegeeks are easy to download and edit. Our research experts have taken care of the corporate themes as well. So, give it a try and see the results. This slide showcases integration of big data with new technological advancements which helps in optimizing decision making and enhance data processing. It includes elements such as linear programming, neural networks, real time analytics, NLP, anticipatory analytics etc.
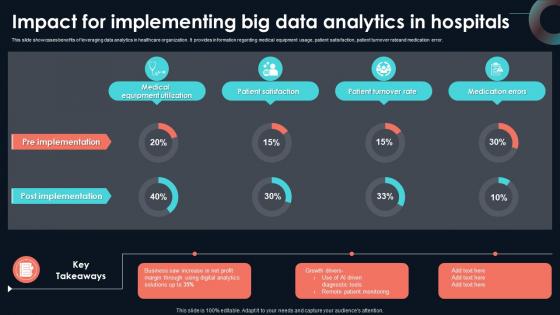
Impact For Implementing Big Data Analytics Developing Strategic Insights Using Big Data Analytics SS V
This slide showcases benefits of leveraging data analytics in healthcare organization. It provides information regarding medical equipment usage, patient satisfaction, patient turnover rateand medication error. Take your projects to the next level with our ultimate collection of Impact For Implementing Big Data Analytics Developing Strategic Insights Using Big Data Analytics SS V. Slidegeeks has designed a range of layouts that are perfect for representing task or activity duration, keeping track of all your deadlines at a glance. Tailor these designs to your exact needs and give them a truly corporate look with your own brand colors they will make your projects stand out from the rest This slide showcases benefits of leveraging data analytics in healthcare organization. It provides information regarding medical equipment usage, patient satisfaction, patient turnover rateand medication error.
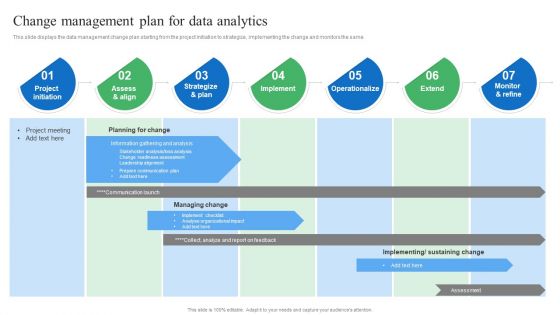
Toolkit For Data Science And Analytics Transition Change Management Plan For Data Analytics Structure PDF
This slide displays the data management change plan starting from the project initiation to strategize, implementing the change and monitors the same. Do you know about Slidesgeeks Toolkit For Data Science And Analytics Transition Change Management Plan For Data Analytics Structure PDF These are perfect for delivering any kind od presentation. Using it, create PowerPoint presentations that communicate your ideas and engage audiences. Save time and effort by using our pre designed presentation templates that are perfect for a wide range of topic. Our vast selection of designs covers a range of styles, from creative to business, and are all highly customizable and easy to edit. Download as a PowerPoint template or use them as Google Slides themes.

Predictive Analytics For Empowering Roadmap For Predictive Analytics Model Inspiration Pdf
This slide represents the roadmap for predictive analytics model development, including the steps to be performed in the process, such as highlighting and formulating a problem, data preparation, information exploration, transforming and choosing, making, validating, and so on. Do you know about Slidesgeeks Predictive Analytics For Empowering Roadmap For Predictive Analytics Model Inspiration Pdf These are perfect for delivering any kind od presentation. Using it, create PowerPoint presentations that communicate your ideas and engage audiences. Save time and effort by using our pre-designed presentation templates that are perfect for a wide range of topic. Our vast selection of designs covers a range of styles, from creative to business, and are all highly customizable and easy to edit. Download as a PowerPoint template or use them as Google Slides themes. This slide represents the roadmap for predictive analytics model development, including the steps to be performed in the process, such as highlighting and formulating a problem, data preparation, information exploration, transforming and choosing, making, validating, and so on.
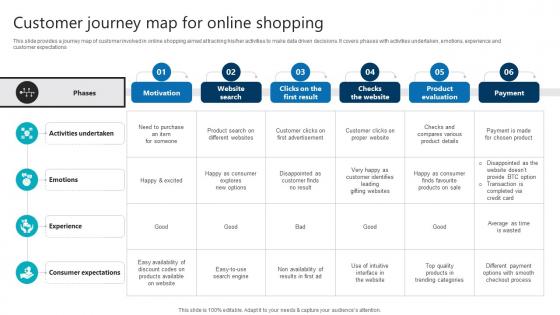
Customer Journey Map For Online Shopping Product Analytics Implementation Data Analytics V
This slide provides a journey map of customer involved in online shopping aimed at tracking his or her activities to make data driven decisions. It covers phases with activities undertaken, emotions, experience and customer expectations.Are you in need of a template that can accommodate all of your creative concepts This one is crafted professionally and can be altered to fit any style. Use it with Google Slides or PowerPoint. Include striking photographs, symbols, depictions, and other visuals. Fill, move around, or remove text boxes as desired. Test out color palettes and font mixtures. Edit and save your work, or work with colleagues. Download Customer Journey Map For Online Shopping Product Analytics Implementation Data Analytics V and observe how to make your presentation outstanding. Give an impeccable presentation to your group and make your presentation unforgettable. This slide provides a journey map of customer involved in online shopping aimed at tracking his or her activities to make data driven decisions. It covers phases with activities undertaken, emotions, experience and customer expectations.
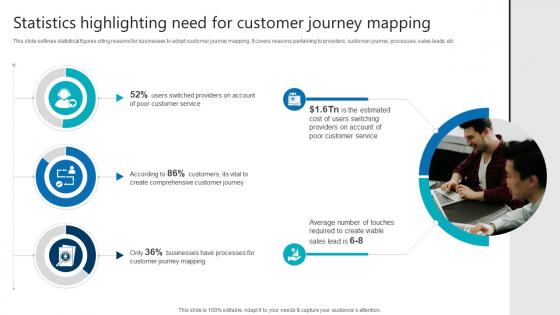
Statistics Highlighting Need For Customer Journey Mapping Product Analytics Implementation Data Analytics V
This slide outlines statistical figures citing reasons for businesses to adopt customer journey mapping. It covers reasons pertaining to providers, customer journey, processes, sales leads, etc Crafting an eye-catching presentation has never been more straightforward. Let your presentation shine with this tasteful yet straightforward Statistics Highlighting Need For Customer Journey Mapping Product Analytics Implementation Data Analytics V template. It offers a minimalistic and classy look that is great for making a statement. The colors have been employed intelligently to add a bit of playfulness while still remaining professional. Construct the ideal Statistics Highlighting Need For Customer Journey Mapping Product Analytics Implementation Data Analytics V that effortlessly grabs the attention of your audience Begin now and be certain to wow your customers This slide outlines statistical figures citing reasons for businesses to adopt customer journey mapping. It covers reasons pertaining to providers, customer journey, processes, sales leads, etc
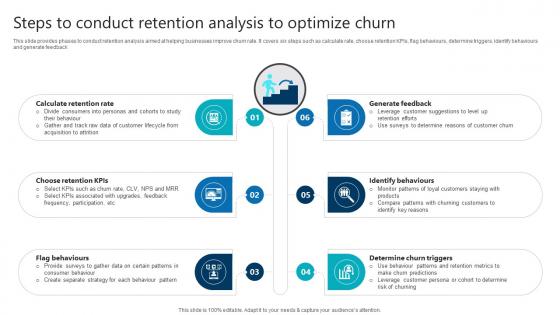
Steps To Conduct Retention Analysis To Optimize Churn Product Analytics Implementation Data Analytics V
This slide provides phases to conduct retention analysis aimed at helping businesses improve churn rate. It covers six steps such as calculate rate, choose retention KPIs, flag behaviours, determine triggers, identify behaviours and generate feedback This Steps To Conduct Retention Analysis To Optimize Churn Product Analytics Implementation Data Analytics V is perfect for any presentation, be it in front of clients or colleagues. It is a versatile and stylish solution for organizing your meetings. The Steps To Conduct Retention Analysis To Optimize Churn Product Analytics Implementation Data Analytics V features a modern design for your presentation meetings. The adjustable and customizable slides provide unlimited possibilities for acing up your presentation. Slidegeeks has done all the homework before launching the product for you. So, do not wait, grab the presentation templates today This slide provides phases to conduct retention analysis aimed at helping businesses improve churn rate. It covers six steps such as calculate rate, choose retention KPIs, flag behaviours, determine triggers, identify behaviours and generate feedback
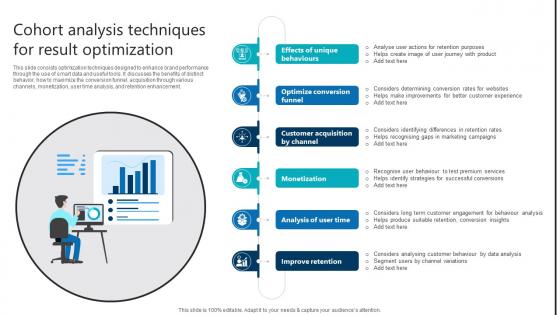
Cohort Analysis Techniques For Result Optimization Product Analytics Implementation Data Analytics V
This slide consists optimization techniques designed to enhance brand performance through the use of smart data and useful tools. It discusses the benefits of distinct behavior, how to maximize the conversion funnel, acquisition through various channels, monetization, user time analysis, and retention enhancement. Whether you have daily or monthly meetings, a brilliant presentation is necessary. Cohort Analysis Techniques For Result Optimization Product Analytics Implementation Data Analytics V can be your best option for delivering a presentation. Represent everything in detail using Cohort Analysis Techniques For Result Optimization Product Analytics Implementation Data Analytics V and make yourself stand out in meetings. The template is versatile and follows a structure that will cater to your requirements. All the templates prepared by Slidegeeks are easy to download and edit. Our research experts have taken care of the corporate themes as well. So, give it a try and see the results. This slide consists optimization techniques designed to enhance brand performance through the use of smart data and useful tools. It discusses the benefits of distinct behavior, how to maximize the conversion funnel, acquisition through various channels, monetization, user time analysis, and retention enhancement.
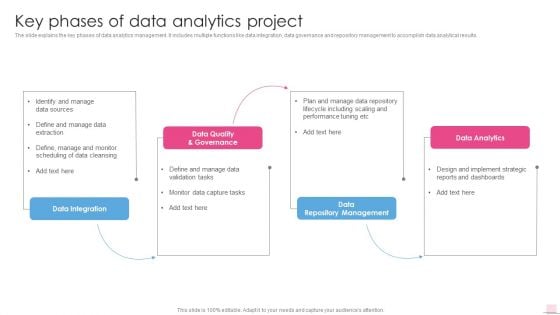
Key Phases Of Data Analytics Project Business Analysis Modification Toolkit Diagrams PDF
The slide explains the key phases of data analytics management. It includes multiple functions like data integration, data governance and repository management to accomplish data analytical results.Deliver and pitch your topic in the best possible manner with this Key Phases Of Data Analytics Project Business Analysis Modification Toolkit Diagrams PDF. Use them to share invaluable insights on Data Quality Governance, Performance Tuning, Including Scaling and impress your audience. This template can be altered and modified as per your expectations. So, grab it now.
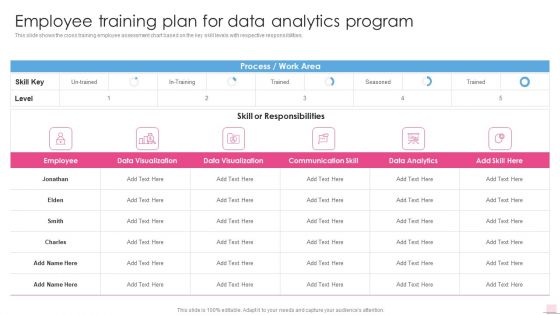
Employee Training Plan For Data Analytics Program Business Analysis Modification Toolkit Diagrams PDF
This slide shows the cross training employee assessment chart based on the key skill levels with respective responsibilities. Deliver an awe inspiring pitch with this creative Employee Training Plan For Data Analytics Program Business Analysis Modification Toolkit Diagrams PDF bundle. Topics like Data Visualization, Communication Skill, Data Analytics can be discussed with this completely editable template. It is available for immediate download depending on the needs and requirements of the user.
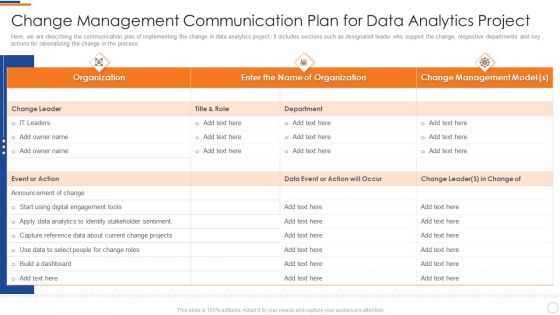
Business Intelligence And Big Data Analytics Change Management Communication Plan Diagrams PDF
Here, we are describing the communication plan of implementing the change in data analytics project. It includes sections such as designated leader who support the change, respective departments and key actions for rationalizing the change in the process. Deliver and pitch your topic in the best possible manner with this business intelligence and big data analytics change management communication plan diagrams pdf. Use them to share invaluable insights on change management model, organization, apply data analytics and impress your audience. This template can be altered and modified as per your expectations. So, grab it now.
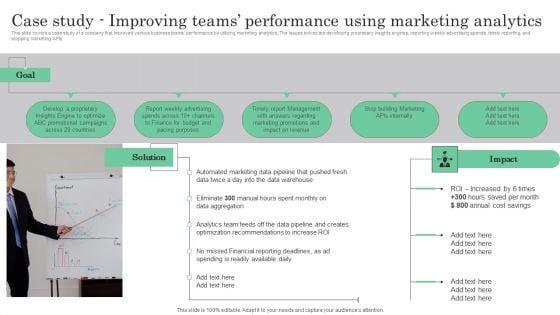
Online Marketing Analytics To Enhance Business Growth Case Study Improving Teams Performance Diagrams PDF
This slide covers a case study of a company that improved various business teams performance by utilizing marketing analytics. The issues solved are developing proprietary insights engines, reporting weekly advertising spends, timely reporting, and stopping marketing APIs. Do you have to make sure that everyone on your team knows about any specific topic I yes, then you should give Online Marketing Analytics To Enhance Business Growth Case Study Improving Teams Performance Diagrams PDF a try. Our experts have put a lot of knowledge and effort into creating this impeccable Online Marketing Analytics To Enhance Business Growth Case Study Improving Teams Performance Diagrams PDF. You can use this template for your upcoming presentations, as the slides are perfect to represent even the tiniest detail. You can download these templates from the Slidegeeks website and these are easy to edit. So grab these today.
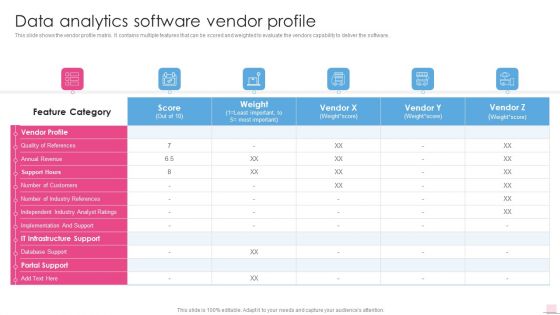
Data Analytics Software Vendor Profile Business Analysis Modification Toolkit Diagrams PDF
This slide shows the vendor profile matrix. It contains multiple features that can be scored and weighted to evaluate the vendors capability to deliver the software.Deliver an awe inspiring pitch with this creative Data Analytics Software Vendor Profile Business Analysis Modification Toolkit Diagrams PDF bundle. Topics like Independent Industry, Implementation Support, Infrastructure Support can be discussed with this completely editable template. It is available for immediate download depending on the needs and requirements of the user.
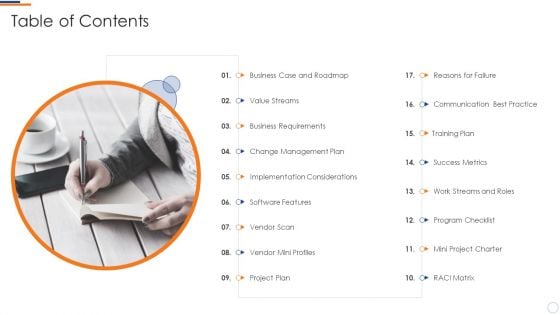
Business Intelligence And Big Data Analytics Transformation Toolkit Table Of Contents Diagrams PDF
This is a business intelligence and big data analytics transformation toolkit table of contents diagrams pdf template with various stages. Focus and dispense information on fiften stages using this creative set, that comes with editable features. It contains large content boxes to add your information on topics like business case and roadmap, value streams, software features, vendor scan, project plan. You can also showcase facts, figures, and other relevant content using this PPT layout. Grab it now.
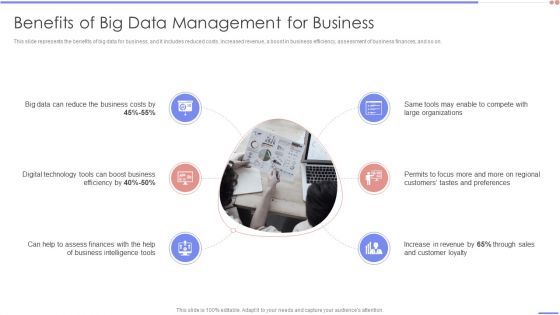
Data Analytics Management Benefits Of Big Data Management For Business Diagrams PDF
This slide represents the benefits of big data for business, and it includes reduced costs, increased revenue, a boost in business efficiency, assessment of business finances, and so on.Presenting Data Analytics Management Benefits Of Big Data Management For Business Diagrams PDF to provide visual cues and insights. Share and navigate important information on six stages that need your due attention. This template can be used to pitch topics like Digital Technology, Reduce Business, Large Organizations. In addtion, this PPT design contains high resolution images, graphics, etc, that are easily editable and available for immediate download.
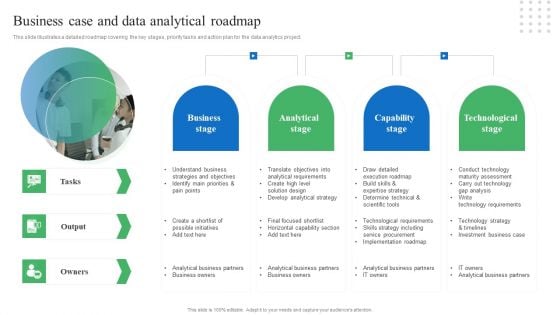
Toolkit For Data Science And Analytics Transition Business Case And Data Analytical Roadmap Professional PDF
This slide illustrates a detailed roadmap covering the key stages, priority tasks and action plan for the data analytics project. Do you know about Slidesgeeks Toolkit For Data Science And Analytics Transition Business Case And Data Analytical Roadmap Professional PDF These are perfect for delivering any kind od presentation. Using it, create PowerPoint presentations that communicate your ideas and engage audiences. Save time and effort by using our pre designed presentation templates that are perfect for a wide range of topic. Our vast selection of designs covers a range of styles, from creative to business, and are all highly customizable and easy to edit. Download as a PowerPoint template or use them as Google Slides themes.
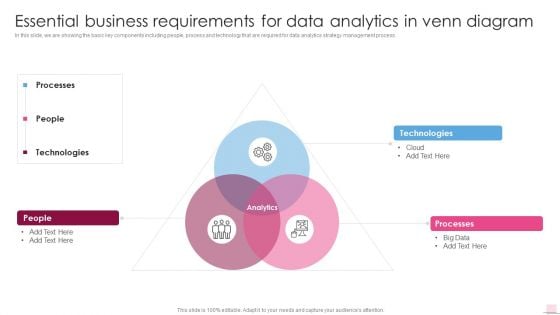
Essential Business Requirements For Data Analytics Business Analysis Modification Toolkit Topics PDF
In this slide, we are showing the basic key components including people, process and technology that are required for data analytics strategy management process.This is a Essential Business Requirements For Data Analytics Business Analysis Modification Toolkit Topics PDF template with various stages. Focus and dispense information on three stages using this creative set, that comes with editable features. It contains large content boxes to add your information on topics like Technologies, Processes, Technologies. You can also showcase facts, figures, and other relevant content using this PPT layout. Grab it now.
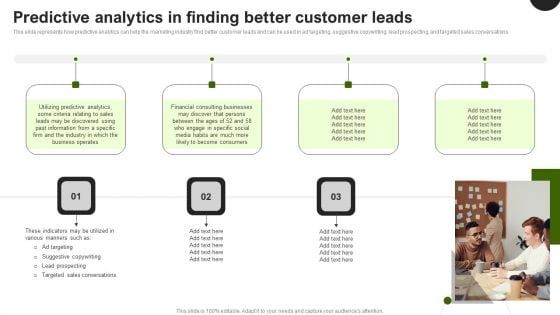
Predictive Analytics In The Age Of Big Data Predictive Analytics In Finding Better Customer Leads Diagrams PDF
This slide represents how predictive analytics can help the marketing industry find better customer leads and can be used in ad targeting, suggestive copywriting, lead prospecting, and targeted sales conversations. Welcome to our selection of the Predictive Analytics In The Age Of Big Data Predictive Analytics In Finding Better Customer Leads Diagrams PDF. These are designed to help you showcase your creativity and bring your sphere to life. Planning and Innovation are essential for any business that is just starting out. This collection contains the designs that you need for your everyday presentations. All of our PowerPoints are 100 percent editable, so you can customize them to suit your needs. This multi purpose template can be used in various situations. Grab these presentation templates today.
Business To Business Digital Google Analytics For All Web Tracking Elements PDF
This template covers tools to measure marketing analytics such as google analytics for all web tracking, google data studio to build real-time reporting dashboards and google data studio reports. Do you have an important presentation coming up Are you looking for something that will make your presentation stand out from the rest Look no further than Business To Business Digital Google Analytics For All Web Tracking Elements PDF. With our professional designs, you can trust that your presentation will pop and make delivering it a smooth process. And with Slidegeeks, you can trust that your presentation will be unique and memorable. So why wait Grab Business To Business Digital Google Analytics For All Web Tracking Elements PDF today and make your presentation stand out from the rest.
Reshaping Business In Digital How Big Data Analytics Is Transforming The Business Icons PDF
This slide covers the impact of analytics on different departments in the business especially in R and D, sales and marketing, supply chain management, etc. Deliver an awe inspiring pitch with this creative Reshaping Business In Digital How Big Data Analytics Is Transforming The Business Icons PDF bundle. Topics like Sales And Marketing, Workplace Management, Moderate Change can be discussed with this completely editable template. It is available for immediate download depending on the needs and requirements of the user.
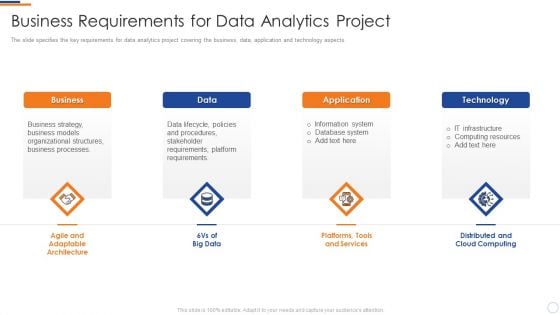
Business Intelligence And Big Business Requirements For Data Analytics Project Themes PDF
The slide specifies the key requirements for data analytics project covering the business, data, application and technology aspects. Presenting business intelligence and big business requirements for data analytics project themes pdf to provide visual cues and insights. Share and navigate important information on four stages that need your due attention. This template can be used to pitch topics like business, data, application, technology. In addtion, this PPT design contains high resolution images, graphics, etc, that are easily editable and available for immediate download.
Tools For HR Business Analytics Application Of Business Intelligence In HR Operations Icons PDF
This slide represents the various ways in which business intelligence is applied in human resource operations. It includes application of business intelligence in HR department for aggregating data, data visualization and data analysis. Create an editable Tools For HR Business Analytics Application Of Business Intelligence In HR Operations Icons PDF that communicates your idea and engages your audience. Whether youre presenting a business or an educational presentation, pre-designed presentation templates help save time. Tools For HR Business Analytics Application Of Business Intelligence In HR Operations Icons PDF is highly customizable and very easy to edit, covering many different styles from creative to business presentations. Slidegeeks has creative team members who have crafted amazing templates. So, go and get them without any delay.
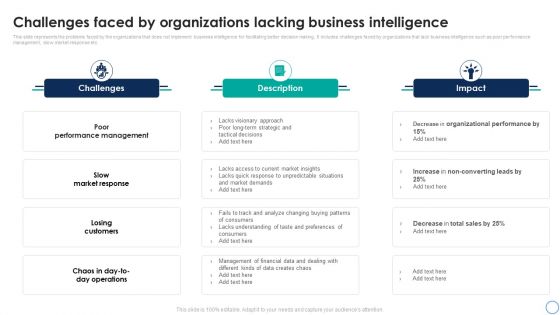
Business Analytics Application Challenges Faced By Organizations Lacking Business Infographics PDF
This slide represents the problems faced by the organizations that does not implement business intelligence for facilitating better decision making, It includes challenges faced by organizations that lack business intelligence such as poor performance management, slow market response etc. Whether you have daily or monthly meetings, a brilliant presentation is necessary. Business Analytics Application Challenges Faced By Organizations Lacking Business Infographics PDF can be your best option for delivering a presentation. Represent everything in detail using Business Analytics Application Challenges Faced By Organizations Lacking Business Infographics PDF and make yourself stand out in meetings. The template is versatile and follows a structure that will cater to your requirements. All the templates prepared by Slidegeeks are easy to download and edit. Our research experts have taken care of the corporate themes as well. So, give it a try and see the results.
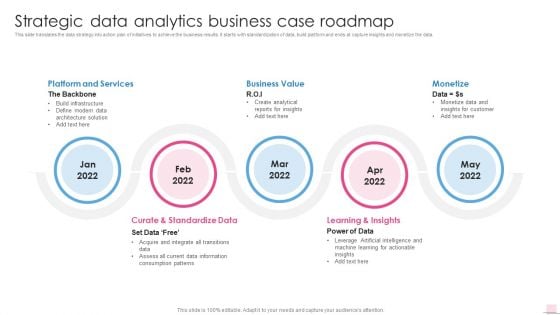
Strategic Data Analytics Business Case Roadmap Business Analysis Modification Toolkit Themes PDF
This slide translates the data strategy into action plan of initiatives to achieve the business results. It starts with standardization of data, build platform and ends at capture insights and monetize the data. This is a Strategic Data Analytics Business Case Roadmap Business Analysis Modification Toolkit Themes PDF template with various stages. Focus and dispense information on five stages using this creative set, that comes with editable features. It contains large content boxes to add your information on topics like Platform Services, Curate Standardize, Learning Insights. You can also showcase facts, figures, and other relevant content using this PPT layout. Grab it now.
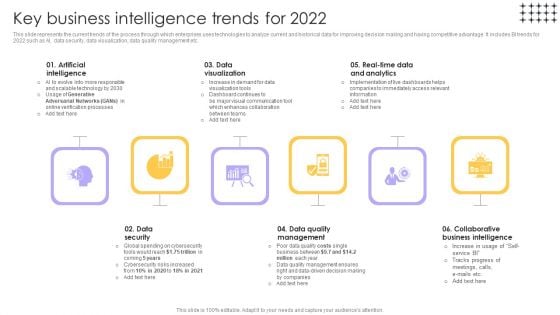
Tools For HR Business Analytics Key Business Intelligence Trends For 2022 Microsoft PDF
This slide represents the current trends of the process through which enterprises uses technologies to analyze current and historical data for improving decision making and having competitive advantage. It includes BI trends for 2022 such as AI, data security, data visualization, data quality management etc. Explore a selection of the finest Tools For HR Business Analytics Key Business Intelligence Trends For 2022 Microsoft PDF here. With a plethora of professionally designed and pre-made slide templates, you can quickly and easily find the right one for your upcoming presentation. You can use our Tools For HR Business Analytics Key Business Intelligence Trends For 2022 Microsoft PDF to effectively convey your message to a wider audience. Slidegeeks has done a lot of research before preparing these presentation templates. The content can be personalized and the slides are highly editable. Grab templates today from Slidegeeks.
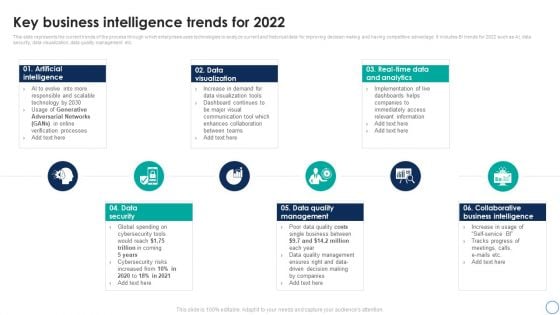
Business Analytics Application Key Business Intelligence Trends For 2022 Infographics PDF
This slide represents the current trends of the process through which enterprises uses technologies to analyze current and historical data for improving decision making and having competitive advantage. It includes BI trends for 2022 such as AI, data security, data visualization, data quality management etc. The best PPT templates are a great way to save time, energy, and resources. Slidegeeks have 100 percent editable powerpoint slides making them incredibly versatile. With these quality presentation templates, you can create a captivating and memorable presentation by combining visually appealing slides and effectively communicating your message. Download Business Analytics Application Key Business Intelligence Trends For 2022 Infographics PDF from Slidegeeks and deliver a wonderful presentation.
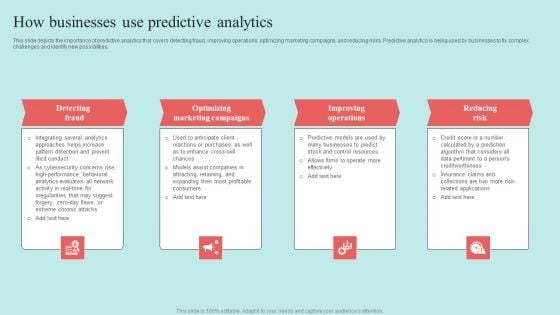
Predictive Data Model How Businesses Use Predictive Analytics Topics PDF
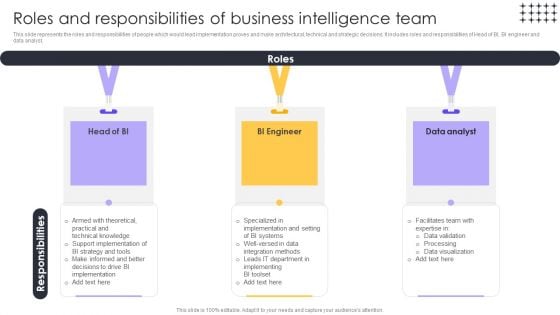
Tools For HR Business Analytics Roles And Responsibilities Of Business Intelligence Team Sample PDF
This slide represents the roles and responsibilities of people which would lead implementation proves and make architectural, technical and strategic decisions. It includes roles and responsibilities of Head of BI, BI engineer and data analyst. Retrieve professionally designed Tools For HR Business Analytics Roles And Responsibilities Of Business Intelligence Team Sample PDF to effectively convey your message and captivate your listeners. Save time by selecting pre-made slideshows that are appropriate for various topics, from business to educational purposes. These themes come in many different styles, from creative to corporate, and all of them are easily adjustable and can be edited quickly. Access them as PowerPoint templates or as Google Slides themes. You dont have to go on a hunt for the perfect presentation because Slidegeeks got you covered from everywhere.
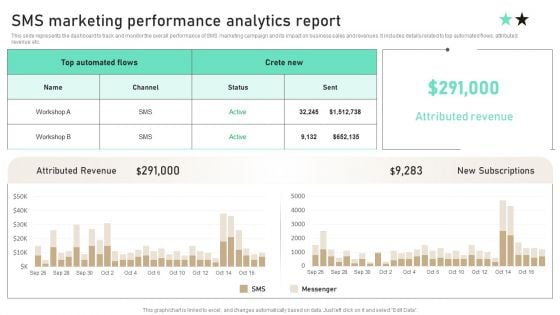
SMS Marketing Performance Analytics Report Ppt PowerPoint Presentation Diagram Templates PDF
This slide represents the dashboard to track and monitor the overall performance of SMS marketing campaign and its impact on business sales and revenues. It includes details related to top automated flows, attributed revenue etc. Slidegeeks is here to make your presentations a breeze with SMS Marketing Performance Analytics Report Ppt PowerPoint Presentation Diagram Templates PDF With our easy to use and customizable templates, you can focus on delivering your ideas rather than worrying about formatting. With a variety of designs to choose from, you are sure to find one that suits your needs. And with animations and unique photos, illustrations, and fonts, you can make your presentation pop. So whether you are giving a sales pitch or presenting to the board, make sure to check out Slidegeeks first.
Food Processing Industry Latest Insights Trends And Analytics KPI Dashboard For Tracking Supply Chain Costs Demonstration PDF
This slide represents the KPI dashboard to track the multiple cost associated with supply chain in food manufacturing industry. It includes information regarding cash to cash cycle in days, carry cost of inventory along with details of net sales. There are so many reasons you need a Food Processing Industry Latest Insights Trends And Analytics KPI Dashboard For Tracking Supply Chain Costs Demonstration PDF. The first reason is you can not spend time making everything from scratch, Thus, Slidegeeks has made presentation templates for you too. You can easily download these templates from our website easily.
Gym Health And Fitness Market Industry Report Analytics Dashboard For Gym Health And Fitness Clubs Ppt Icon Slideshow PDF
Presenting this set of slides with name gym health and fitness market industry report analytics dashboard for gym health and fitness clubs ppt icon slideshow pdf. This is a seven stage process. The stages in this process are attended special events, facebook fans, web hits, enrollment for gym, social media friends, twitter followers, emails collected on website. This is a completely editable PowerPoint presentation and is available for immediate download. Download now and impress your audience.
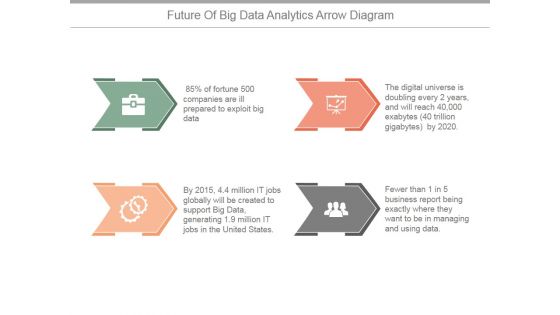
Future Of Big Data Analytics Arrow Diagram Ppt PowerPoint Presentation Summary
This is a future of big data analytics arrow diagram ppt powerpoint presentation summary. This is a four stage process. The stages in this process are big data, process, business, marketing, icons.
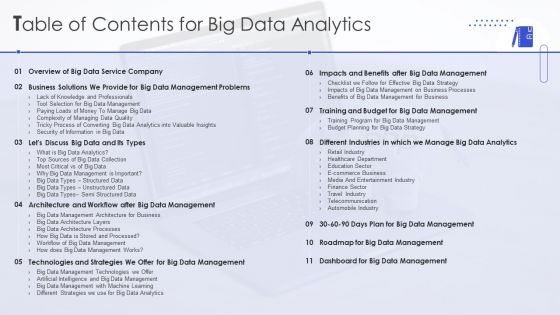
Table Of Contents For Big Data Analytics Ppt PowerPoint Presentation Diagram PDF
Deliver an awe inspiring pitch with this creative Table Of Contents For Big Data Analytics Ppt PowerPoint Presentation Diagram PDF bundle. Topics like Dashboard, Big Data Management, E Commerce Business can be discussed with this completely editable template. It is available for immediate download depending on the needs and requirements of the user.
Marketing Mix Diagram For Data Analytics For Accounts Receivable Ppt Icon Pictures PDF
Showcasing this set of slides titled marketing mix diagram for data analytics for accounts receivable ppt icon pictures pdf. The topics addressed in these templates are product, place, price, promotion. All the content presented in this PPT design is completely editable. Download it and make adjustments in color, background, font etc. as per your unique business setting.
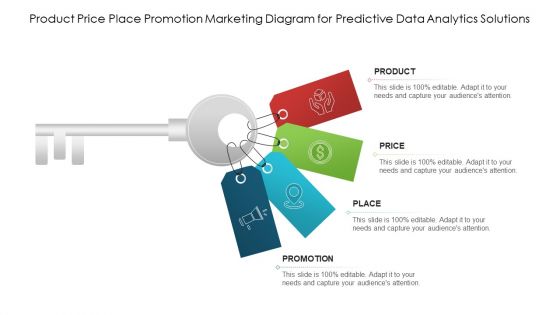
Product Price Place Promotion Marketing Diagram For Predictive Data Analytics Solutions Designs PDF
Presenting product price place promotion marketing diagram for predictive data analytics solutions designs pdf to dispense important information. This template comprises four stages. It also presents valuable insights into the topics including price, product, promotion. This is a completely customizable PowerPoint theme that can be put to use immediately. So, download it and address the topic impactfully.
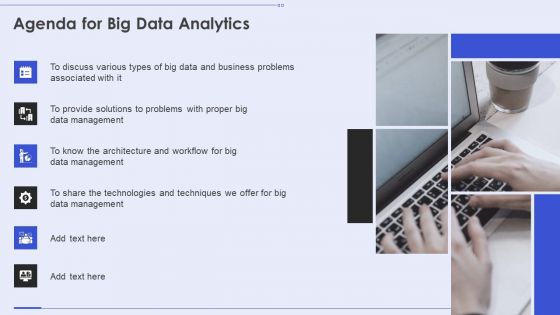
Agenda For Big Data Analytics Ppt PowerPoint Presentation Diagram Lists PDF
Presenting Agenda For Big Data Analytics Ppt PowerPoint Presentation Diagram Lists PDF to provide visual cues and insights. Share and navigate important information on six stages that need your due attention. This template can be used to pitch topics like Data Management, Technologies, Business. In addtion, this PPT design contains high resolution images, graphics, etc, that are easily editable and available for immediate download.
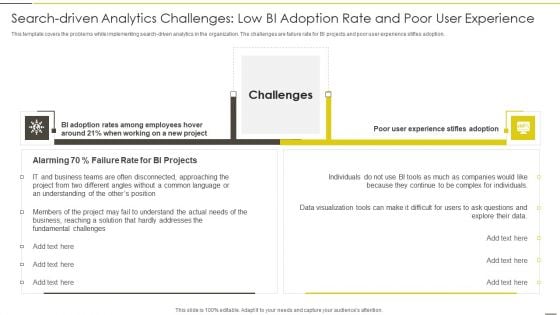
Administered Data And Analytic Quality Playbook Search Driven Analytics Challenges Low Diagrams PDF
This template covers the problems while implementing search-driven analytics in the organization. The challenges are failure rate for BI projects and poor user experience stifles adoption.Deliver an awe inspiring pitch with this creative Administered Data And Analytic Quality Playbook Search Driven Analytics Challenges Low Diagrams PDF bundle. Topics like Business Teams, Hardly Addresses, Fundamental Challenges can be discussed with this completely editable template. It is available for immediate download depending on the needs and requirements of the user.


 Continue with Email

 Home
Home


