Business Analytics Dashboard Diagram
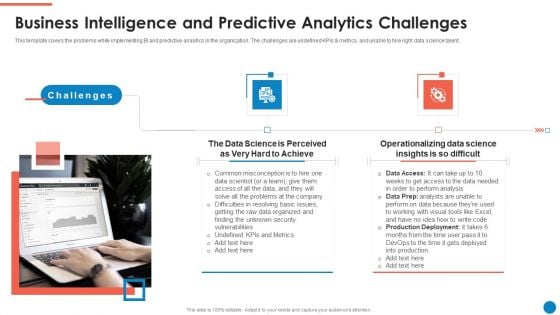
Data And Analytics Playbook Business Intelligence And Predictive Analytics Challenges Template PDF
This template covers the problems while implementing BI and predictive analytics in the organization. The challenges are undefined KPIs and metrics, and unable to hire right data science talent. Presenting Data And Analytics Playbook Business Intelligence And Predictive Analytics Challenges Template PDF to provide visual cues and insights. Share and navigate important information on two stages that need your due attention. This template can be used to pitch topics like Challenges, Data Science, Operationalizing Data Science. In addtion, this PPT design contains high resolution images, graphics, etc, that are easily editable and available for immediate download.
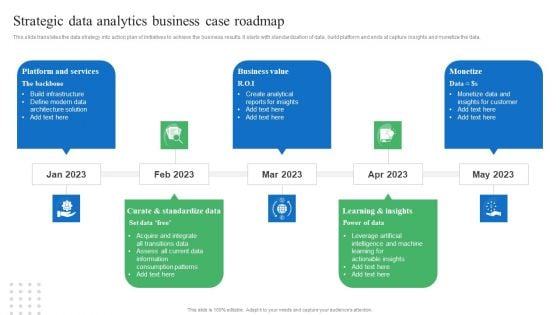
Toolkit For Data Science And Analytics Transition Strategic Data Analytics Business Case Roadmap Themes PDF
This slide translates the data strategy into action plan of initiatives to achieve the business results. It starts with standardization of data, build platform and ends at capture insights and monetize the data. Are you in need of a template that can accommodate all of your creative concepts This one is crafted professionally and can be altered to fit any style. Use it with Google Slides or PowerPoint. Include striking photographs, symbols, depictions, and other visuals. Fill, move around, or remove text boxes as desired. Test out color palettes and font mixtures. Edit and save your work, or work with colleagues. Download Toolkit For Data Science And Analytics Transition Strategic Data Analytics Business Case Roadmap Themes PDF and observe how to make your presentation outstanding. Give an impeccable presentation to your group and make your presentation unforgettable.
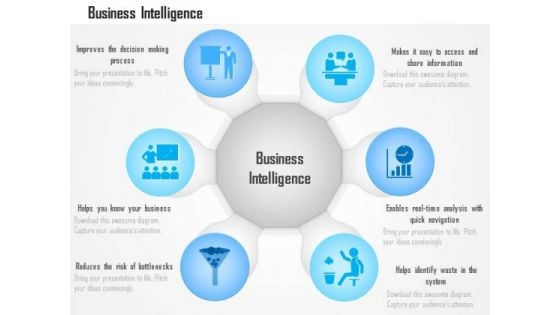
Business Diagram Benefits Advantages Of Business Intelligence Data Analytics Ppt Slide
This technology diagram has been designed with graphic of circular chart with various icons. This slide contains the concept of business intelligence data analytics. Explain advantages of business intelligence in any technical presentations with this quality diagram.
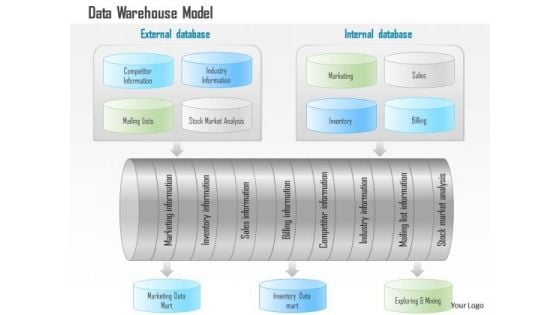
Business Diagram Data Warehouse Model With Analytics And Business Intelligence Ppt Slide
This technology diagram has been designed with graphic of data warehouse model. This model depicts concept of business intelligence and analysis. Download this editable slide build an exclusive presentation.
You Tube Advertising Campaign Performance Analytics Dashboard Ppt Icon Diagrams PDF
This slide represents dashboard showing analytics of performance of you tube marketing campaign. It includes data related to no. of visitors, qualified leads, customers and annual recurring revenue, lifetime value, gross volume etc generated through the campaign. Showcasing this set of slides titled You Tube Advertising Campaign Performance Analytics Dashboard Ppt Icon Diagrams PDF. The topics addressed in these templates are Monthly Recurring Revenue, Bounce Rate, Customer Churn Rate. All the content presented in this PPT design is completely editable. Download it and make adjustments in color, background, font etc. as per your unique business setting.
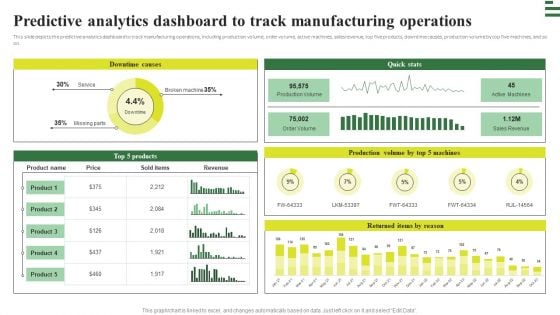
Transforming Manufacturing With Automation Predictive Analytics Dashboard To Track Diagrams PDF
This slide depicts the predictive analytics dashboard to track manufacturing operations, including production volume, order volume, active machines, sales revenue, top five products, downtime causes, production volume by top five machines, and so on. Get a simple yet stunning designed Transforming Manufacturing With Automation Predictive Analytics Dashboard To Track Diagrams PDF. It is the best one to establish the tone in your meetings. It is an excellent way to make your presentations highly effective. So, download this PPT today from Slidegeeks and see the positive impacts. Our easy to edit Transforming Manufacturing With Automation Predictive Analytics Dashboard To Track Diagrams PDF can be your go to option for all upcoming conferences and meetings. So, what are you waiting for Grab this template today.
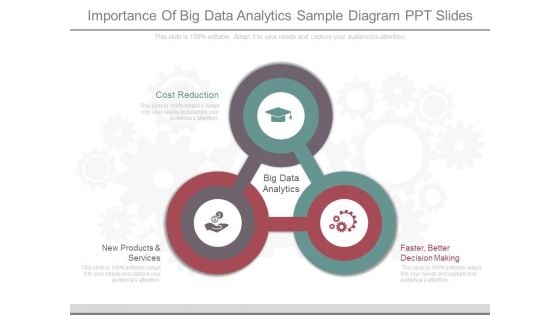
Importance Of Big Data Analytics Sample Diagram Ppt Slides
This is a importance of big data analytics sample diagram ppt slides. This is a three stage process. The stages in this process are cost reduction, big data analytics, new products and services, faster, better decision making.
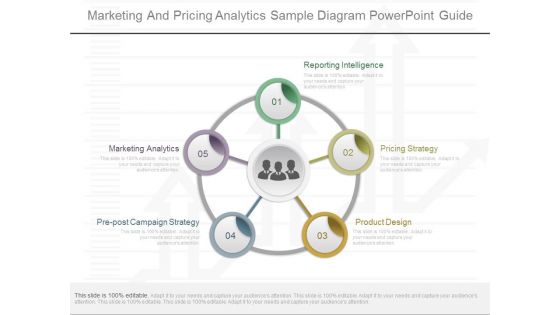
Marketing And Pricing Analytics Sample Diagram Powerpoint Guide
This is a marketing and pricing analytics sample diagram powerpoint guide. This is a five stage process. The stages in this process are reporting intelligence, pricing strategy, product design, pre post campaign strategy, marketing analytics.
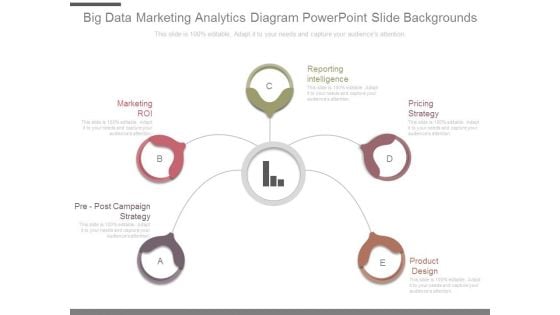
Big Data Marketing Analytics Diagram Powerpoint Slide Backgrounds
This is a big data marketing analytics diagram powerpoint slide backgrounds. This is a five stage process. The stages in this process are marketing roi, reporting intelligence, pricing strategy, product design, pre post campaign strategy.
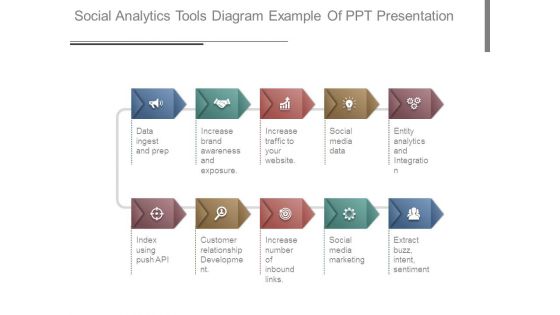
Social Analytics Tools Diagram Example Of Ppt Presentation
This is a social analytics tools diagram example of ppt presentation. This is a ten stage process. The stages in this process are data ingest and prep, increase brand awareness and exposure, increase traffic to your website, social media data, entity analytics and integration, index using push api, customer relationship development, increase number of inbound links, social media marketing, extract buzz, intent, sentiment.
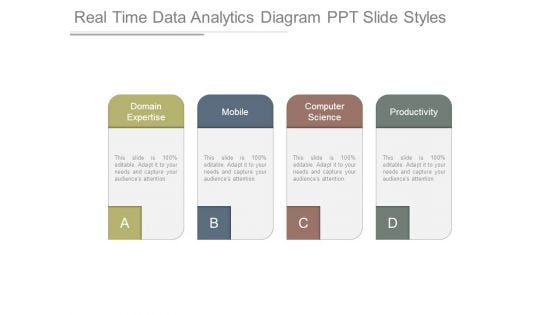
Real Time Data Analytics Diagram Ppt Slide Styles
This is a real time data analytics diagram ppt slide styles. This is a four stage process. The stages in this process are domain expertise, mobile, computer science, productivity.
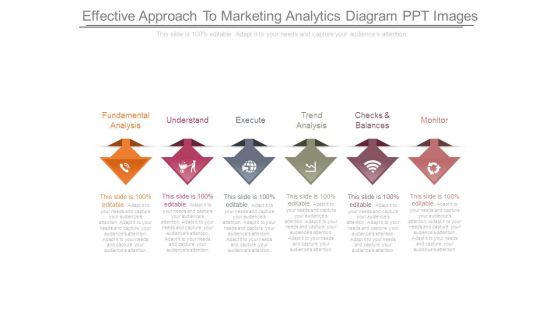
Effective Approach To Marketing Analytics Diagram Ppt Images
This is a effective approach to marketing analytics diagram ppt images. This is a six stage process. The stages in this process are fundamental analysis, understand, execute, trend analysis, checks and balances, monitor.
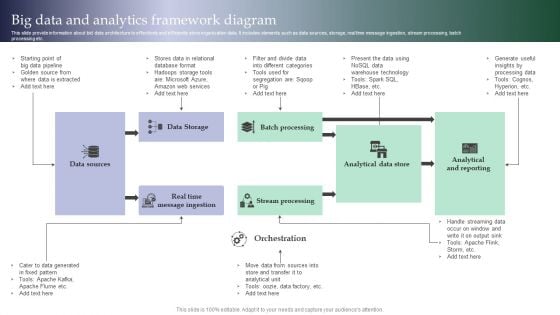
Big Data And Analytics Framework Diagram Introduction PDF
This slide provide information about bid data architecture to effectively and efficiently store organization data. It includes elements such as data sources, storage, real time message ingestion, stream processing, batch processing etc. Showcasing this set of slides titled Big Data And Analytics Framework Diagram Introduction PDF. The topics addressed in these templates are Data Sources, Data Storage, Batch Processing. All the content presented in this PPT design is completely editable. Download it and make adjustments in color, background, font etc. as per your unique business setting.
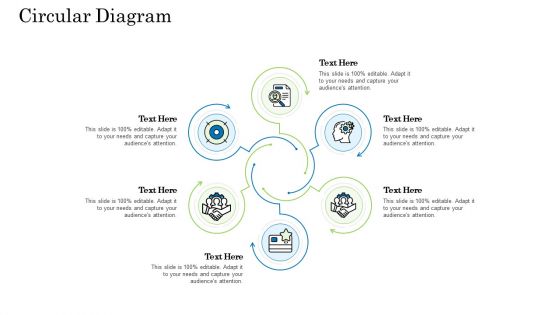
Customer Behavioral Data And Analytics Circular Diagram Download PDF
This is a customer behavioral data and analytics circular diagram download pdf template with various stages. Focus and dispense information on six stages using this creative set, that comes with editable features. It contains large content boxes to add your information on topics like circular diagram. You can also showcase facts, figures, and other relevant content using this PPT layout. Grab it now.
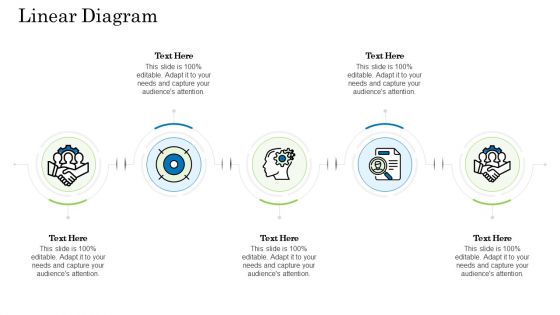
Customer Behavioral Data And Analytics Linear Diagram Microsoft PDF
This is a customer behavioral data and analytics linear diagram microsoft pdf template with various stages. Focus and dispense information on five stages using this creative set, that comes with editable features. It contains large content boxes to add your information on topics like linear diagram. You can also showcase facts, figures, and other relevant content using this PPT layout. Grab it now.
Business Analytics Application Employee Engagement Key Performance Metrics Icons PDF
This slide represents key metrics dashboard to analyze the engagement of employees in the organization. It includes details related to KPIs such as engagement score, response rate, net promoter score etc. Formulating a presentation can take up a lot of effort and time, so the content and message should always be the primary focus. The visuals of the PowerPoint can enhance the presenters message, so our Business Analytics Application Employee Engagement Key Performance Metrics Icons PDF was created to help save time. Instead of worrying about the design, the presenter can concentrate on the message while our designers work on creating the ideal templates for whatever situation is needed. Slidegeeks has experts for everything from amazing designs to valuable content, we have put everything into Business Analytics Application Employee Engagement Key Performance Metrics Icons PDF.
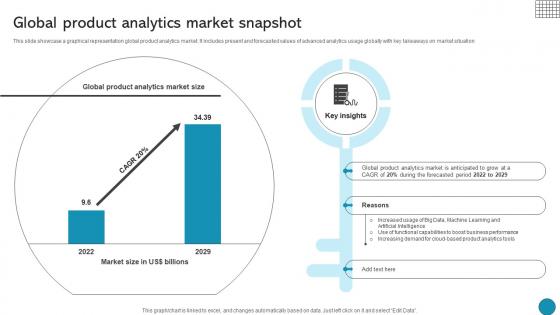
Global Product Analytics Market Snapshot Driving Business Success Integrating Product
This slide showcase a graphical representation global product analytics market. It includes present and forecasted values of advanced analytics usage globally with key takeaways on market situationThis modern and well-arranged Global Product Analytics Market Snapshot Driving Business Success Integrating Product provides lots of creative possibilities. It is very simple to customize and edit with the Powerpoint Software. Just drag and drop your pictures into the shapes. All facets of this template can be edited with Powerpoint, no extra software is necessary. Add your own material, put your images in the places assigned for them, adjust the colors, and then you can show your slides to the world, with an animated slide included. This slide showcase a graphical representation global product analytics market. It includes present and forecasted values of advanced analytics usage globally with key takeaways on market situation
Product Data Analytics Icon Showcasing Business Revenue Growth Structure Pdf
Showcasing this set of slides titled Product Data Analytics Icon Showcasing Business Revenue Growth Structure Pdf. The topics addressed in these templates are Product Data Analytics, Icon Showcasing Business, Revenue Growth. All the content presented in this PPT design is completely editable. Download it and make adjustments in color, background, font etc. as per your unique business setting. Our Product Data Analytics Icon Showcasing Business Revenue Growth Structure Pdf are topically designed to provide an attractive backdrop to any subject. Use them to look like a presentation pro.
Clock Icon Business Analytics Ppt PowerPoint Presentation Complete Deck
Presenting this set of slides with name clock icon business analytics ppt powerpoint presentation complete deck. The topics discussed in these slides are time, business, analytics, dashboard, location. This is a completely editable PowerPoint presentation and is available for immediate download. Download now and impress your audience.
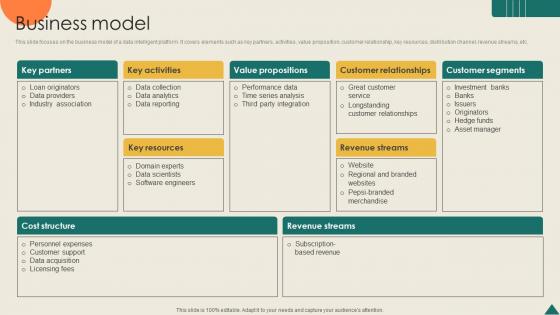
Business Model Financial Analytics Platform Investor Elevator Pitch Deck
This slide focuses on the business model of a data intelligent platform. It covers elements such as key partners, activities, value proposition, customer relationship, key resources, distribution channel, revenue streams, etc. Are you searching for a Business Model Financial Analytics Platform Investor Elevator Pitch Deck that is uncluttered, straightforward, and original Its easy to edit, and you can change the colors to suit your personal or business branding. For a presentation that expresses how much effort you have put in, this template is ideal With all of its features, including tables, diagrams, statistics, and lists, its perfect for a business plan presentation. Make your ideas more appealing with these professional slides. Download Business Model Financial Analytics Platform Investor Elevator Pitch Deck from Slidegeeks today. This slide focuses on the business model of a data intelligent platform. It covers elements such as key partners, activities, value proposition, customer relationship, key resources, distribution channel, revenue streams, etc.
Big Data Analytics Icon For Ecommerce Business Brochure PDF
Showcasing this set of slides titled Big Data Analytics Icon For Ecommerce Business Brochure PDF. The topics addressed in these templates are Big Data Analytics Icon, Ecommerce Business. All the content presented in this PPT design is completely editable. Download it and make adjustments in color, background, font etc. as per your unique business setting.
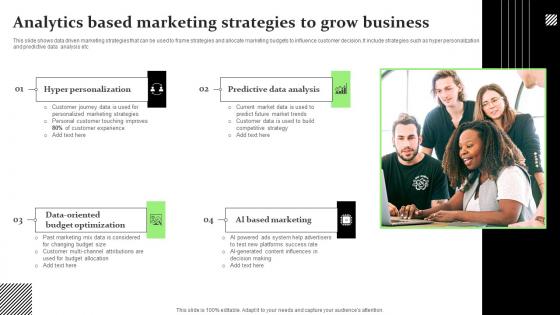
Analytics Based Marketing Strategies To Grow Business Themes Pdf
This slide shows data driven marketing strategies that can be used to frame strategies and allocate marketing budgets to influence customer decision. It include strategies such as hyper personalization and predictive data analysis etc.Showcasing this set of slides titled Analytics Based Marketing Strategies To Grow Business Themes Pdf The topics addressed in these templates are Hyper Personalization, Predictive Data Analysis, Budget Optimization All the content presented in this PPT design is completely editable. Download it and make adjustments in color, background, font etc. as per your unique business setting. This slide shows data driven marketing strategies that can be used to frame strategies and allocate marketing budgets to influence customer decision. It include strategies such as hyper personalization and predictive data analysis etc.
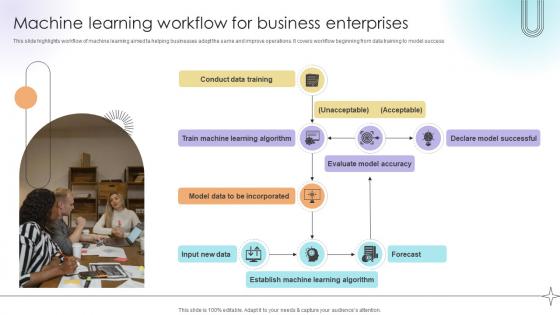
Machine Learning Workflow For Business Enterprises Data Analytics SS V
This slide highlights workflow of machine learning aimed ta helping businesses adopt the same and improve operations. It covers workflow beginning from data training to model success.If you are looking for a format to display your unique thoughts, then the professionally designed Machine Learning Workflow For Business Enterprises Data Analytics SS V is the one for you. You can use it as a Google Slides template or a PowerPoint template. Incorporate impressive visuals, symbols, images, and other charts. Modify or reorganize the text boxes as you desire. Experiment with shade schemes and font pairings. Alter, share or cooperate with other people on your work. Download Machine Learning Workflow For Business Enterprises Data Analytics SS V and find out how to give a successful presentation. Present a perfect display to your team and make your presentation unforgettable. This slide highlights workflow of machine learning aimed ta helping businesses adopt the same and improve operations. It covers workflow beginning from data training to model success.
Data Analytics For Business Operations Administration Icon Professional PDF
Presenting Data Analytics For Business Operations Administration Icon Professional PDF to dispense important information. This template comprises four stages. It also presents valuable insights into the topics including Business Operations Administration Icon, Data Analytics. This is a completely customizable PowerPoint theme that can be put to use immediately. So, download it and address the topic impactfully.
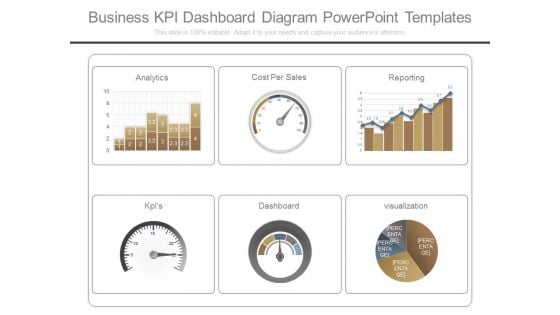
Business Kpi Dashboard Diagram Powerpoint Templates
This is a business kpi dashboard diagram powerpoint templates. This is a six stage process. The stages in this process are analytics, cost per sales, reporting, kpis, dashboard, visualization.
Business Analytics Report Vector Icon Ppt PowerPoint Presentation Layouts Introduction
Presenting this set of slides with name business analytics report vector icon ppt powerpoint presentation layouts introduction. This is a one stage process. The stages in this process are audit observation, business analytics, business performance. This is a completely editable PowerPoint presentation and is available for immediate download. Download now and impress your audience.
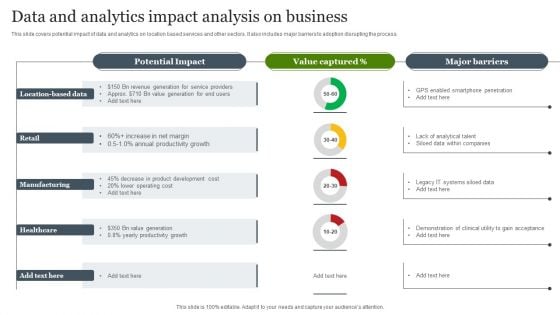
Data And Analytics Impact Analysis On Business Slides PDF
This slide covers potential impact of data and analytics on location based services and other sectors. It also includes major barriers to adoption disrupting the process. Pitch your topic with ease and precision using this Data And Analytics Impact Analysis On Business Slides PDF. This layout presents information on Retail, Manufacturing, Location Based Data. It is also available for immediate download and adjustment. So, changes can be made in the color, design, graphics or any other component to create a unique layout.
Human Resource Analytics Metrics For Business Startups Icons Pdf
This slide illustrates KPI for human resource department that help organization to analyze current workforce performance efficiency. It include key performance indicators such as turnover ratio, talent rating, training cost etc.Pitch your topic with ease and precision using this Human Resource Analytics Metrics For Business Startups Icons Pdf This layout presents information on Hiring Cost, Turnover Ratio, Talent Rating It is also available for immediate download and adjustment. So, changes can be made in the color, design, graphics or any other component to create a unique layout. This slide illustrates KPI for human resource department that help organization to analyze current workforce performance efficiency. It include key performance indicators such as turnover ratio, talent rating, training cost etc.
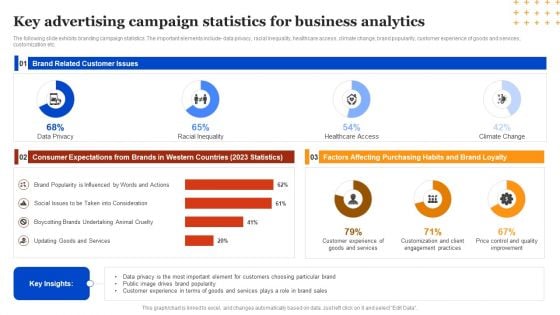
Key Advertising Campaign Statistics For Business Analytics Summary PDF
The following slide exhibits branding campaign statistics. The important elements include- data privacy, racial inequality, healthcare access, climate change, brand popularity, customer experience of goods and services, customization etc. Showcasing this set of slides titled Key Advertising Campaign Statistics For Business Analytics Summary PDF. The topics addressed in these templates are Key Insights, Analytics, Healthcare Access. All the content presented in this PPT design is completely editable. Download it and make adjustments in color, background, font etc. as per your unique business setting.
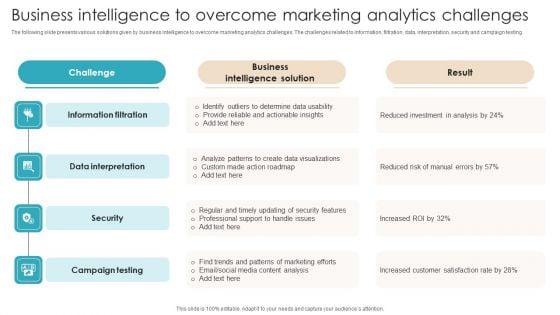
Business Intelligence To Overcome Marketing Analytics Challenges Mockup PDF
The following slide presents various solutions given by business intelligence to overcome marketing analytics challenges. The challenges related to information, filtration, data, interpretation, security and campaign testing. Presenting Business Intelligence To Overcome Marketing Analytics Challenges Mockup PDF to dispense important information. This template comprises four stages. It also presents valuable insights into the topics including Information Filtration, Data Interpretation, Security. This is a completely customizable PowerPoint theme that can be put to use immediately. So, download it and address the topic impactfully.
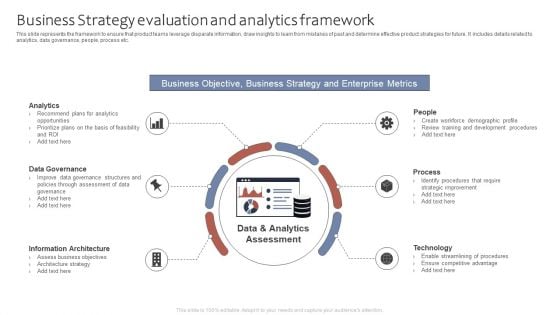
Business Strategy Evaluation And Analytics Framework Ppt Ideas Images PDF
This slide represents the framework to ensure that product teams leverage disparate information, draw insights to learn from mistakes of past and determine effective product strategies for future. It includes details related to analytics, data governance, people, process etc. Presenting Business Strategy Evaluation And Analytics Framework Ppt Ideas Images PDF to dispense important information. This template comprises six stages. It also presents valuable insights into the topics including Analytics, Data Governance, Information Architecture, People. This is a completely customizable PowerPoint theme that can be put to use immediately. So, download it and address the topic impactfully.
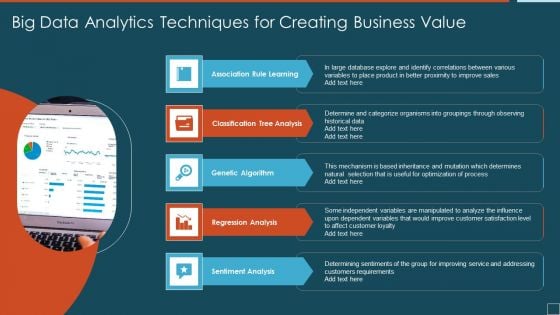
Big Data Analytics Techniques For Creating Business Value Sample PDF
Presenting big data analytics techniques for creating business value sample pdf to dispense important information. This template comprises five stages. It also presents valuable insights into the topics including association rule learning, classification tree analysis, genetic algorithm. This is a completely customizable PowerPoint theme that can be put to use immediately. So, download it and address the topic impactfully.
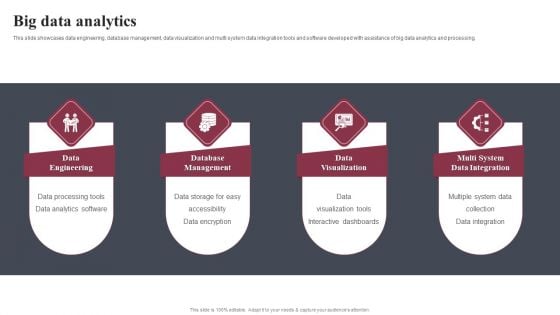
Business Software Development Company Profile Big Data Analytics Professional PDF
This slide showcases data engineering, database management, data visualization and multi system data integration tools and software developed with assistance of big data analytics and processing. Presenting Business Software Development Company Profile Big Data Analytics Professional PDF to provide visual cues and insights. Share and navigate important information on four stages that need your due attention. This template can be used to pitch topics like Data Engineering, Database Management, Data Visualization. In addtion, this PPT design contains high resolution images, graphics, etc, that are easily editable and available for immediate download.
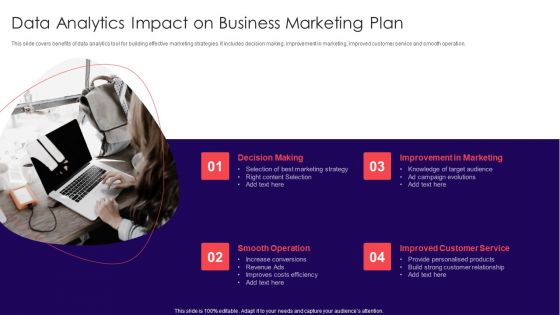
Data Analytics Impact On Business Marketing Plan Mockup PDF
This slide covers benefits of data analytics tool for building effective marketing strategies. It includes decision making, improvement in marketing, improved customer service and smooth operation. Presenting Data Analytics Impact On Business Marketing Plan Mockup PDF to dispense important information. This template comprises four stages. It also presents valuable insights into the topics including Decision Making, Improvement In Marketing, Improved Customer Service. This is a completely customizable PowerPoint theme that can be put to use immediately. So, download it and address the topic impactfully.
Data Requirements For Analytics Impact On Business Performance Icons PDF
This slide illustrates data requirement analysis impact before and after data collection on business performance. It also includes benefits such as business process improvement, understanding of customer likings and prompt decision making. Showcasing this set of slides titled data requirements for analytics impact on business performance icons pdf. The topics addressed in these templates are goals, business, process. All the content presented in this PPT design is completely editable. Download it and make adjustments in color, background, font etc. as per your unique business setting.
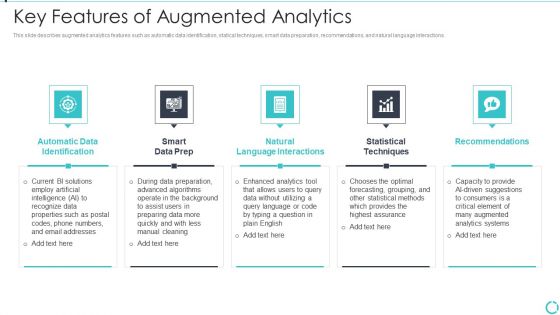
Augmented Analytics Implementation IT Key Features Of Augmented Analytics Diagrams PDF
This slide describes augmented analytics features such as automatic data identification, statical techniques, smart data preparation, recommendations, and natural language interactions. Presenting Augmented Analytics Implementation IT Key Features Of Augmented Analytics Diagrams PDF to provide visual cues and insights. Share and navigate important information on five stages that need your due attention. This template can be used to pitch topics like Automatic Data Identification, Smart Data Prep, Natur Interactions, Statistical Techniques, Recommendations. In addtion, this PPT design contains high resolution images, graphics, etc, that are easily editable and available for immediate download.
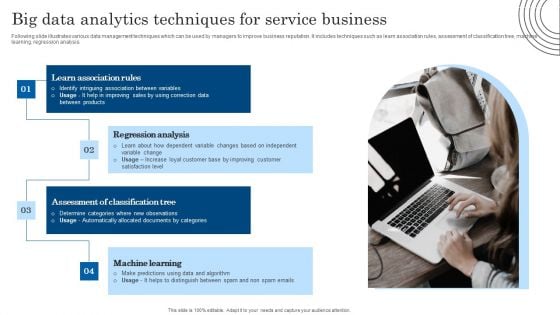
Big Data Analytics Techniques For Service Business Information PDF
Following slide illustrates various data management techniques which can be used by managers to improve business reputation. It includes techniques such as learn association rules, assessment of classification tree, machine learning, regression analysis. Presenting Big Data Analytics Techniques For Service Business Information PDF to dispense important information. This template comprises four stages. It also presents valuable insights into the topics including Regression Analysis, Learn Association Rules, Machine Learning. This is a completely customizable PowerPoint theme that can be put to use immediately. So, download it and address the topic impactfully.
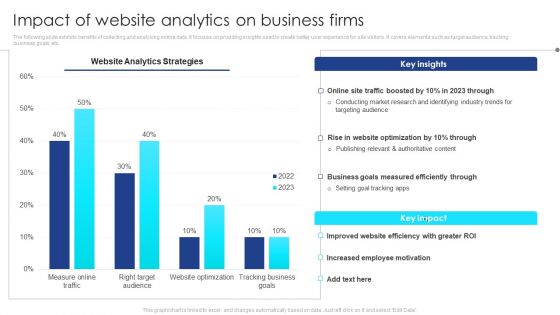
Impact Of Website Analytics On Business Firms Ideas PDF
The following slide exhibits benefits of collecting and analysing online data. It focuses on providing insights used to create better user experience for site visitors. It covers elements such as target audience, tracking business goals, etc. Showcasing this set of slides titled Impact Of Website Analytics On Business Firms Ideas PDF. The topics addressed in these templates are Business Goals, Employee Motivation, Website Efficiency, Website Optimization, Online Site Traffic. All the content presented in this PPT design is completely editable. Download it and make adjustments in color, background, font etc. as per your unique business setting.
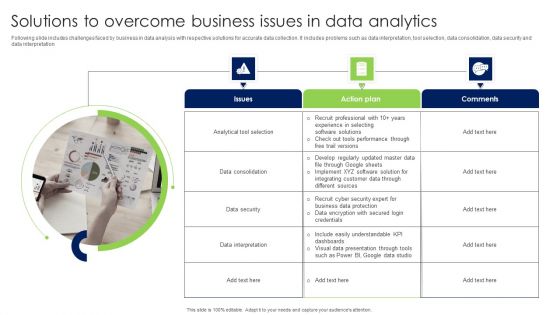
Solutions To Overcome Business Issues In Data Analytics Infographics PDF
Following slide includes challenges faced by business in data analysis with respective solutions for accurate data collection. It includes problems such as data interpretation, tool selection, data consolidation, data security and data interpretation Presenting Solutions To Overcome Business Issues In Data Analytics Infographics PDF to dispense important information. This template comprises Three stages. It also presents valuable insights into the topics including Issues, Action Plan, Comments. This is a completely customizable PowerPoint theme that can be put to use immediately. So, download it and address the topic impactfully.
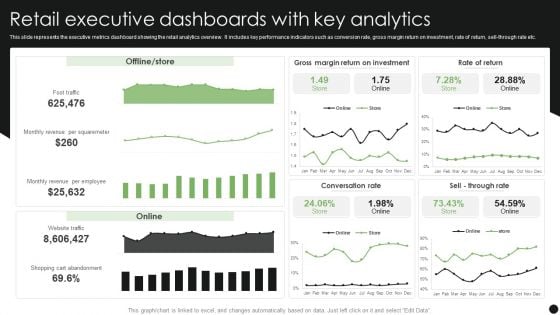
Retail Executive Dashboards With Key Analytics Guidelines PDF
Pitch your topic with ease and precision using this Retail Executive Dashboards With Key Analytics Guidelines PDF. This layout presents information on Retail Executive Dashboards, Key Analytics. It is also available for immediate download and adjustment. So, changes can be made in the color, design, graphics or any other component to create a unique layout.
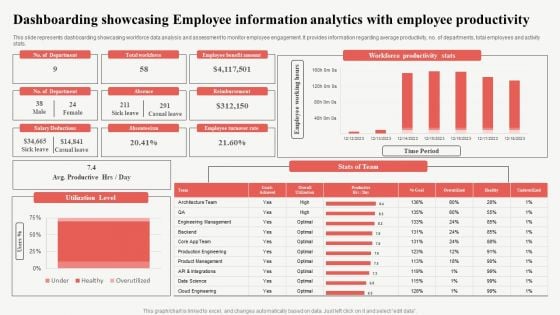
Dashboarding Showcasing Employee Information Analytics With Employee Productivity Slides PDF
This slide represents dashboarding showcasing workforce data analysis and assessment to monitor employee engagement. It provides information regarding average productivity, no. of departments, total employees and activity stats. Pitch your topic with ease and precision using this Dashboarding Showcasing Employee Information Analytics With Employee Productivity Slides PDF. This layout presents information on Reimbursement, Productive, Workforce Productivity Stats. It is also available for immediate download and adjustment. So, changes can be made in the color, design, graphics or any other component to create a unique layout.
Information Transformation Process Toolkit Essential Business Requirements For Data Analytics In Venn Diagram Icons PDF
In this slide, we are showing the basic key components including people, process and technology that are required for data analytics strategy management process. This is a Information Transformation Process Toolkit Essential Business Requirements For Data Analytics In Venn Diagram Icons PDF template with various stages. Focus and dispense information on three stages using this creative set, that comes with editable features. It contains large content boxes to add your information on topics like Analytics, Processes, Technologies. You can also showcase facts, figures, and other relevant content using this PPT layout. Grab it now.
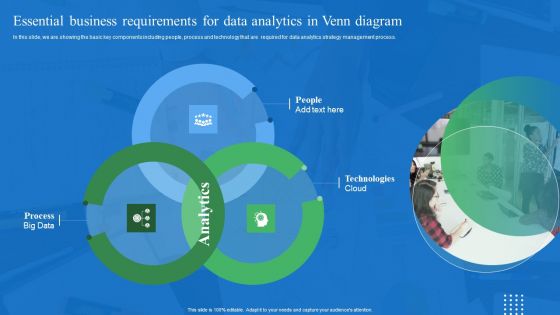
Essential Business Requirements For Data Analytics In Venn Diagram Introduction PDF
In this slide, we are showing the basic key components including people, process and technology that are required for data analytics strategy management process. Here you can discover an assortment of the finest PowerPoint and Google Slides templates. With these templates, you can create presentations for a variety of purposes while simultaneously providing your audience with an eye catching visual experience. Download Essential Business Requirements For Data Analytics In Venn Diagram Introduction PDF to deliver an impeccable presentation. These templates will make your job of preparing presentations much quicker, yet still, maintain a high level of quality. Slidegeeks has experienced researchers who prepare these templates and write high quality content for you. Later on, you can personalize the content by editing the Essential Business Requirements For Data Analytics In Venn Diagram Introduction PDF.
Business Diagram Technology Predictive Data Analytics Networking Social Icons Ppt Slide
This technology diagram slide has been designed with graphic of data icons. These icons may be used to displays the data analytics and social media networking. Use this PPT slide for networking and technology related presentations.

Business Diagram Big Data Icon Set Data Analytics Icon Set Cloud Computing Networking Funnel Ppt Sli
This PowerPoint template has been designed with multiple circles and icons inside. This slide depicts concepts of cloud storage and servers. This diagram also includes the topics of the cloud computing. Use this diagram for cloud and data technology related presentations.
Business Diagram Big Data Analytics Cloud Networking Storage Servers Computing Icon Set Ppt Slide
This PowerPoint template has been designed with multiple circles and icons inside. This slide depicts concepts of cloud storage and servers. This diagram also includes the topics of the cloud computing. Use this diagram for cloud and data technology related presentations.
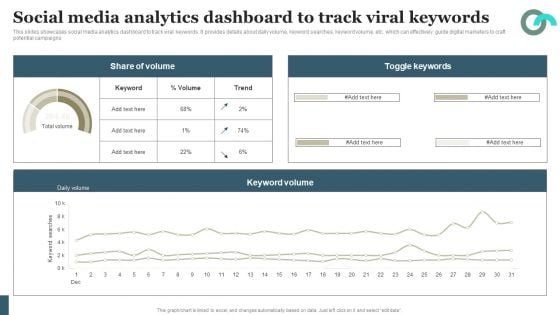
Viral Marketing Techniques To Increase Annual Business Sales Social Media Analytics Dashboard To Track Viral Demonstration PDF
This slides showcases social media analytics dashboard to track viral keywords. It provides details about daily volume, keyword searches, keyword volume, etc. which can effectively guide digital marketers to craft potential campaigns Slidegeeks is one of the best resources for PowerPoint templates. You can download easily and regulate Viral Marketing Techniques To Increase Annual Business Sales Social Media Analytics Dashboard To Track Viral Demonstration PDF for your personal presentations from our wonderful collection. A few clicks is all it takes to discover and get the most relevant and appropriate templates. Use our Templates to add a unique zing and appeal to your presentation and meetings. All the slides are easy to edit and you can use them even for advertisement purposes.
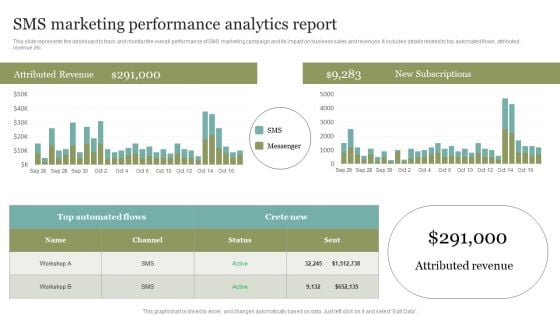
SMS Marketing Performance Analytics Report Summary PDF
This slide represents the dashboard to track and monitor the overall performance of SMS marketing campaign and its impact on business sales and revenues. It includes details related to top automated flows, attributed revenue etc. This SMS Marketing Performance Analytics Report Summary PDF from Slidegeeks makes it easy to present information on your topic with precision. It provides customization options, so you can make changes to the colors, design, graphics, or any other component to create a unique layout. It is also available for immediate download, so you can begin using it right away. Slidegeeks has done good research to ensure that you have everything you need to make your presentation stand out. Make a name out there for a brilliant performance.
Analytics Based Marketing Trends Icon Infographics Pdf
Showcasing this set of slides titled Analytics Based Marketing Trends Icon Infographics Pdf The topics addressed in these templates are Analytics Based, Marketing Trends Icon All the content presented in this PPT design is completely editable. Download it and make adjustments in color, background, font etc. as per your unique business setting. Our Analytics Based Marketing Trends Icon Infographics Pdf are topically designed to provide an attractive backdrop to any subject. Use them to look like a presentation pro.
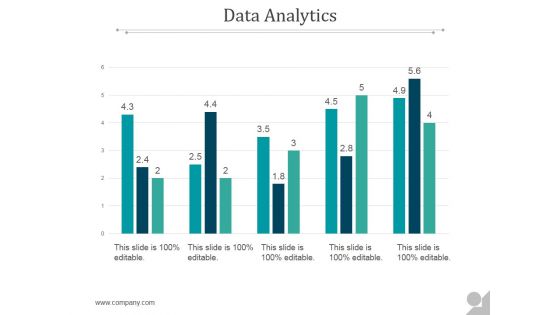
Data Analytics Ppt PowerPoint Presentation Themes
This is a data analytics ppt powerpoint presentation themes. This is a five stage process. The stages in this process are business, marketing, presentation, data analyst, management.
Expert Systems Advanced Analytics Techniques Icons PDF
Presenting expert systems advanced analytics techniques icons pdf to provide visual cues and insights. Share and navigate important information on three stages that need your due attention. This template can be used to pitch topics like business intelligence, clickstream, analytics, data mining, planning. In addtion, this PPT design contains high-resolution images, graphics, etc, that are easily editable and available for immediate download.
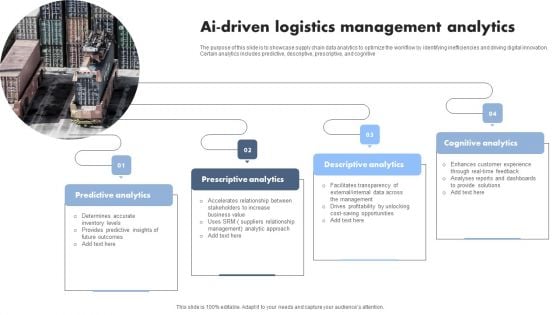
AI Driven Logistics Management Analytics Professional PDF
The purpose of this slide is to showcase supply chain data analytics to optimize the workflow by identifying inefficiencies and driving digital innovation. Certain analytics includes predictive, descriptive, prescriptive, and cognitive. Presenting AI Driven Logistics Management Analytics Professional PDF to dispense important information. This template comprises four stages. It also presents valuable insights into the topics including Predictive Analytics, Prescriptive Analytics, Descriptive Analytics. This is a completely customizable PowerPoint theme that can be put to use immediately. So, download it and address the topic impactfully.
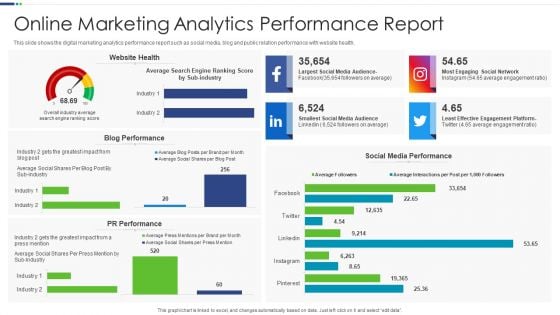
Online Marketing Analytics Performance Report Microsoft PDF
This slide shows the digital marketing analytics performance report such as social media, blog and public relation performance with website health.Pitch your topic with ease and precision using this Online Marketing Analytics Performance Report Microsoft PDF This layout presents information on Blog Performance, Media Performance, Effective Engagement It is also available for immediate download and adjustment. So, changes can be made in the color, design, graphics or any other component to create a unique layout.
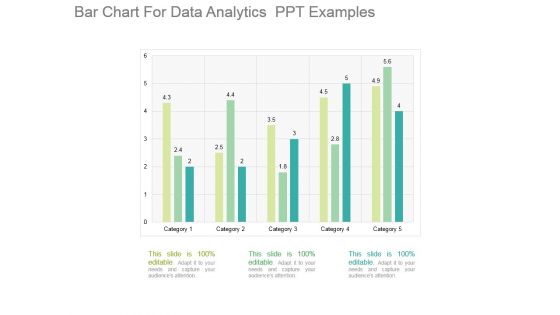
Bar Chart For Data Analytics Ppt Examples
This is a bar chart for data analytics ppt examples. This is a five stage process. The stages in this process are category.
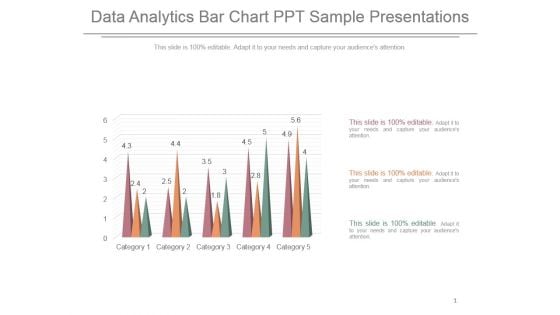
Data Analytics Bar Chart Ppt Sample Presentations
This is a data analytics bar chart ppt sample presentations. This is a five stage process. The stages in this process are category.
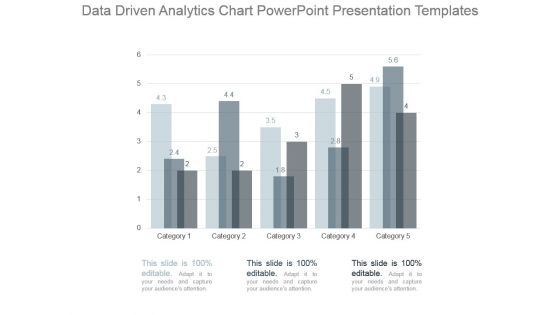
Data Driven Analytics Chart Powerpoint Presentation Templates
This is a data driven analytics chart powerpoint presentation templates. This is a five stage process. The stages in this process are category.
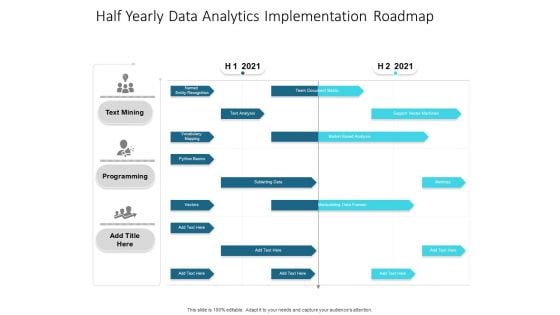
Half Yearly Data Analytics Implementation Roadmap Demonstration
We present our half yearly data analytics implementation roadmap demonstration. This PowerPoint layout is easy-to-edit so you can change the font size, font type, color, and shape conveniently. In addition to this, the PowerPoint layout is Google Slides compatible, so you can share it with your audience and give them access to edit it. Therefore, download and save this well-researched half yearly data analytics implementation roadmap demonstration in different formats like PDF, PNG, and JPG to smoothly execute your business plan.
Predictive Healthcare Data Analytics Icon Summary PDF
Presenting Predictive Healthcare Data Analytics Icon Summary PDF to dispense important information. This template comprises Three stages. It also presents valuable insights into the topics including Predictive Healthcare, Data Analytics Icon. This is a completely customizable PowerPoint theme that can be put to use immediately. So, download it and address the topic impactfully
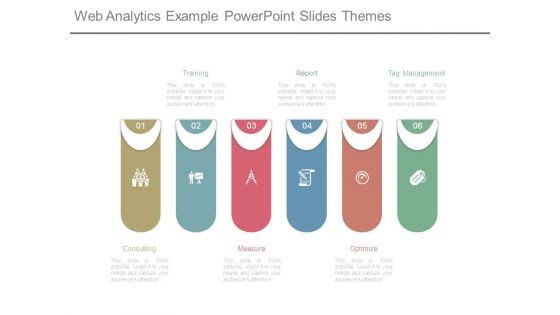
Web Analytics Example Powerpoint Slides Themes
This is a web analytics example powerpoint slides themes. This is a six stage process. The stages in this process are consulting, training, measure, report, optimize, tag management.
Analytics Based Marketing Operation Model Icons Pdf
This slide shows operating model for data driven marketing strategy to gather valuable insights and implement same for increasing profit margins. It include steps such as gathering valuable insights, data management and team establishment etc.Showcasing this set of slides titled Analytics Based Marketing Operation Model Icons Pdf The topics addressed in these templates are Gathering Valuable Insights, Systematic Data Management, Team Establishment All the content presented in this PPT design is completely editable. Download it and make adjustments in color, background, font etc. as per your unique business setting. This slide shows operating model for data driven marketing strategy to gather valuable insights and implement same for increasing profit margins. It include steps such as gathering valuable insights, data management and team establishment etc.


 Continue with Email

 Home
Home


