Business Analytics Dashboard Diagram
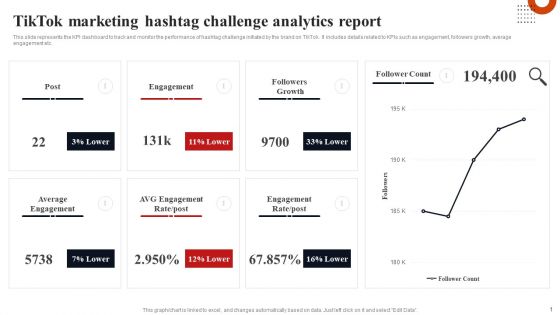
Tiktok Marketing Hashtag Challenge Analytics Report Diagrams PDF
This slide represents the KPI dashboard to track and monitor the performance of hashtag challenge initiated by the brand on TikTok. It includes details related to KPIs such as engagement, followers growth, average engagement etc. This modern and well arranged Tiktok Marketing Hashtag Challenge Analytics Report Diagrams PDF provides lots of creative possibilities. It is very simple to customize and edit with the Powerpoint Software. Just drag and drop your pictures into the shapes. All facets of this template can be edited with Powerpoint no extra software is necessary. Add your own material, put your images in the places assigned for them, adjust the colors, and then you can show your slides to the world, with an animated slide included.
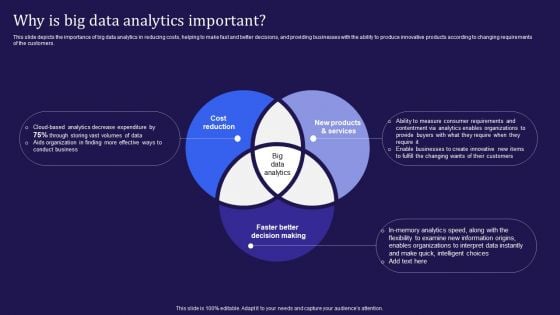
Big Data Analytics Lifecycle Why Is Big Data Analytics Important Ppt Summary Example Topics PDF
This slide depicts the importance of big data analytics in reducing costs, helping to make fast and better decisions, and providing businesses with the ability to produce innovative products according to changing requirements of the customers. Do you have an important presentation coming up Are you looking for something that will make your presentation stand out from the rest Look no further than Big Data Analytics Lifecycle Why Is Big Data Analytics Important Ppt Summary Example Topics PDF. With our professional designs, you can trust that your presentation will pop and make delivering it a smooth process. And with Slidegeeks, you can trust that your presentation will be unique and memorable. So why wait Grab Big Data Analytics Lifecycle Why Is Big Data Analytics Important Ppt Summary Example Topics PDF today and make your presentation stand out from the rest.
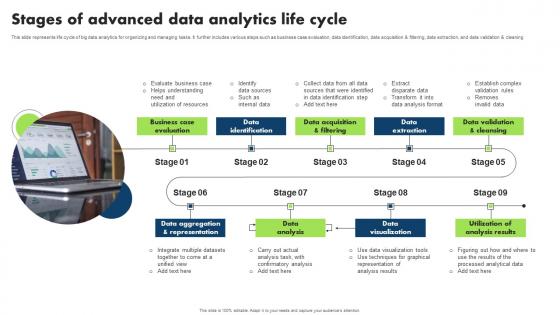
Stages Of Advanced Data Analytics Life Cycle Diagrams Pdf
This slide represents life cycle of big data analytics for organizing and managing tasks. It further includes various steps such as business case evaluation, data identification, data acquisition and filtering, data extraction, and data validation and cleaning Showcasing this set of slides titled Stages Of Advanced Data Analytics Life Cycle Diagrams Pdf. The topics addressed in these templates are Business Case Evaluation, Data Identification, Data Extraction. All the content presented in this PPT design is completely editable. Download it and make adjustments in color, background, font etc. as per your unique business setting. This slide represents life cycle of big data analytics for organizing and managing tasks. It further includes various steps such as business case evaluation, data identification, data acquisition and filtering, data extraction, and data validation and cleaning
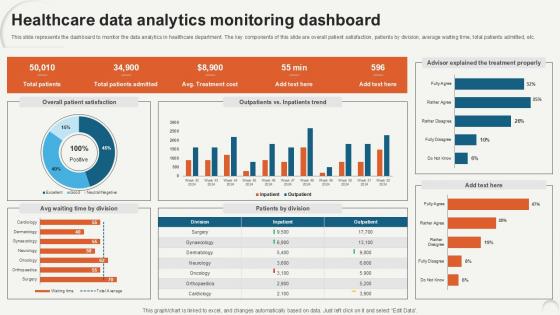
Healthcare Data Analytics Monitoring Data Analytics For Informed Decision Ppt PowerPoint
This slide represents the dashboard to monitor the data analytics in healthcare department. The key components of this slide are overall patient satisfaction, patients by division, average waiting time, total patients admitted, etc. Make sure to capture your audiences attention in your business displays with our gratis customizable Healthcare Data Analytics Monitoring Data Analytics For Informed Decision Ppt PowerPoint. These are great for business strategies, office conferences, capital raising or task suggestions. If you desire to acquire more customers for your tech business and ensure they stay satisfied, create your own sales presentation with these plain slides. This slide represents the dashboard to monitor the data analytics in healthcare department. The key components of this slide are overall patient satisfaction, patients by division, average waiting time, total patients admitted, etc.
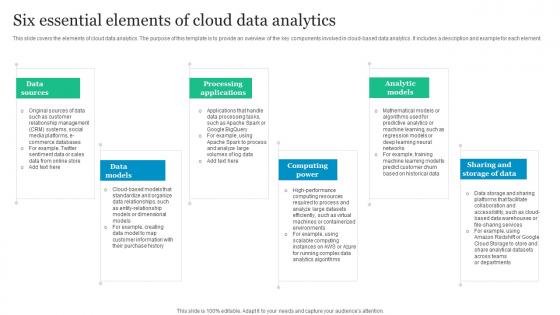
Six Essential Elements Of Cloud Data Analytics Diagrams Pdf
This slide covers the elements of cloud data analytics. The purpose of this template is to provide an overview of the key components involved in cloud based data analytics. It includes a description and example for each element. Showcasing this set of slides titled Six Essential Elements Of Cloud Data Analytics Diagrams Pdf. The topics addressed in these templates are Data Sources, Data Models, Processing Applications. All the content presented in this PPT design is completely editable. Download it and make adjustments in color, background, font etc. as per your unique business setting. This slide covers the elements of cloud data analytics. The purpose of this template is to provide an overview of the key components involved in cloud based data analytics. It includes a description and example for each element.
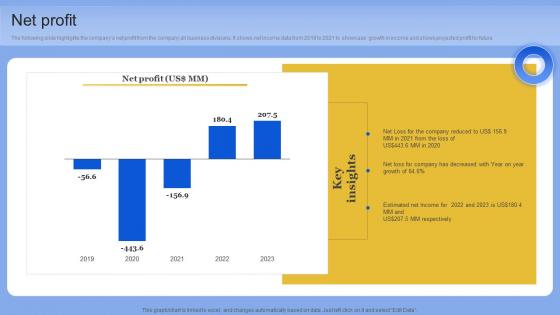
Net Profit Data Analytics Company Outline Diagrams PDF
The following slide highlights the companys net profit from the company all business divisions. It shows net income data from 2019 to 2021 to showcase growth in income and shows projected profit for future. Retrieve professionally designed Net Profit Data Analytics Company Outline Diagrams PDF to effectively convey your message and captivate your listeners. Save time by selecting pre-made slideshows that are appropriate for various topics, from business to educational purposes. These themes come in many different styles, from creative to corporate, and all of them are easily adjustable and can be edited quickly. Access them as PowerPoint templates or as Google Slides themes. You do not have to go on a hunt for the perfect presentation because Slidegeeks got you covered from everywhere. The following slide highlights the companys net profit from the company all business divisions. It shows net income data from 2019 to 2021 to showcase growth in income and shows projected profit for future
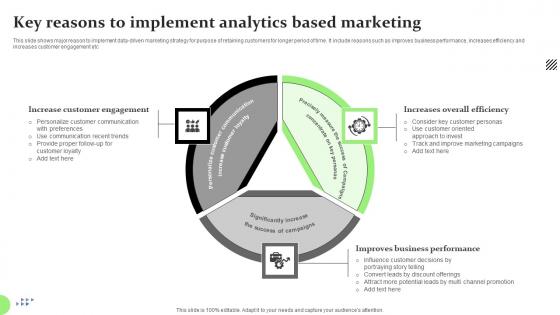
Key Reasons To Implement Analytics Based Marketing Diagrams Pdf
This slide shows major reason to implement data driven marketing strategy for purpose of retaining customers for longer period of time. It include reasons such as improves business performance, increases efficiency and increases customer engagement etc.Pitch your topic with ease and precision using this Key Reasons To Implement Analytics Based Marketing Diagrams Pdf This layout presents information on Increase Customer Engagement, Increases Overall Efficiency, Improves Business Performance It is also available for immediate download and adjustment. So, changes can be made in the color, design, graphics or any other component to create a unique layout. This slide shows major reason to implement data driven marketing strategy for purpose of retaining customers for longer period of time. It include reasons such as improves business performance, increases efficiency and increases customer engagement etc.
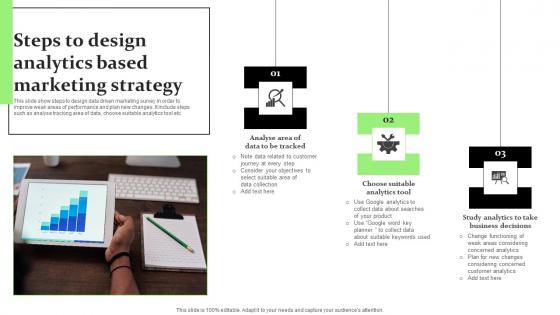
Steps To Design Analytics Based Marketing Strategy Diagrams Pdf
This slide show steps to design data driven marketing survey in order to improve weak areas of performance and plan new changes. It include steps such as analyse tracking area of data, choose suitable analytics tool etc.Pitch your topic with ease and precision using this Steps To Design Analytics Based Marketing Strategy Diagrams Pdf This layout presents information on Data Tracked, Analytics Tool, Business Decisions It is also available for immediate download and adjustment. So, changes can be made in the color, design, graphics or any other component to create a unique layout. This slide show steps to design data driven marketing survey in order to improve weak areas of performance and plan new changes. It include steps such as analyse tracking area of data, choose suitable analytics tool etc.
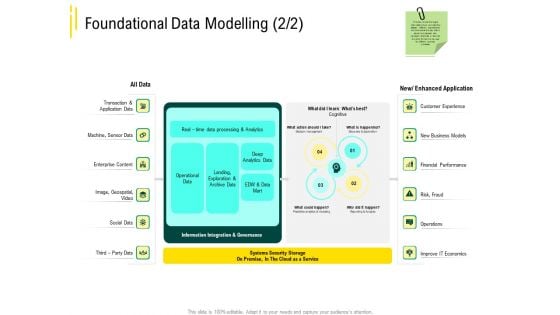
Expert Systems Foundational Data Modelling Analytics Diagrams PDF
Deliver an awe-inspiring pitch with this creative expert systems foundational data modelling analytics diagrams pdf bundle. Topics like socia, edw and data mart, operations, new business models, financial performance can be discussed with this completely editable template. It is available for immediate download depending on the needs and requirements of the user.
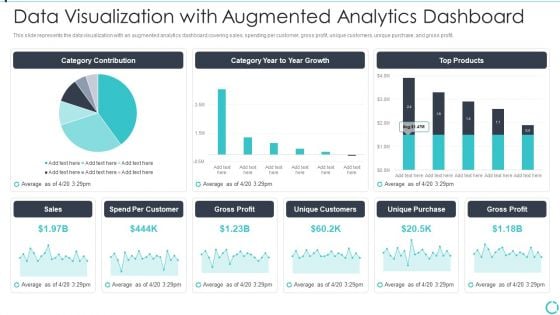
Augmented Analytics Implementation IT Data Visualization With Augmented Analytics Microsoft PDF
This slide represents the data visualization with an augmented analytics dashboard covering sales, spending per customer, gross profit, unique customers, unique purchase, and gross profit. Deliver an awe inspiring pitch with this creative Augmented Analytics Implementation IT Data Visualization With Augmented Analytics Microsoft PDF bundle. Topics like Category Contribution, Category Year To Year Growth, Top Products, Sales, Gross Profit can be discussed with this completely editable template. It is available for immediate download depending on the needs and requirements of the user.
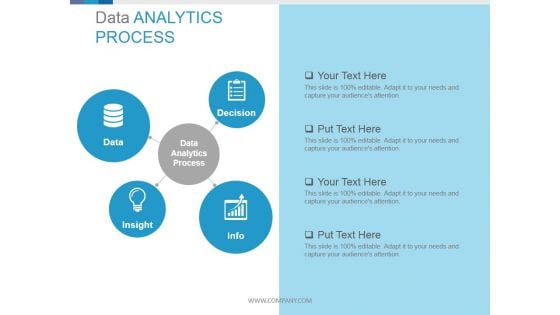
Data Analytics Process Circular Diagrams Ppt PowerPoint Presentation Guidelines
This is a data analytics process circular diagrams ppt powerpoint presentation guidelines. This is a four stage process. The stages in this process are data analytics process, data, decision, insight, info.
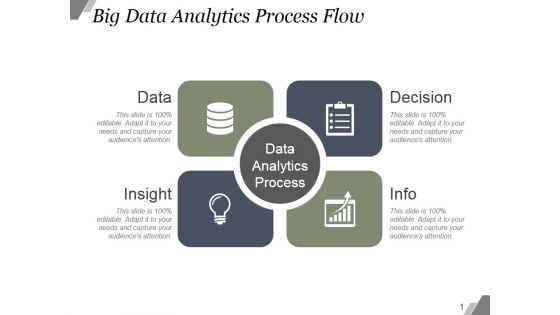
Big Data Analytics Process Flow Ppt PowerPoint Presentation Diagrams
This is a big data analytics process flow ppt powerpoint presentation diagrams. This is a four stage process. The stages in this process are data, decision, insight, info.
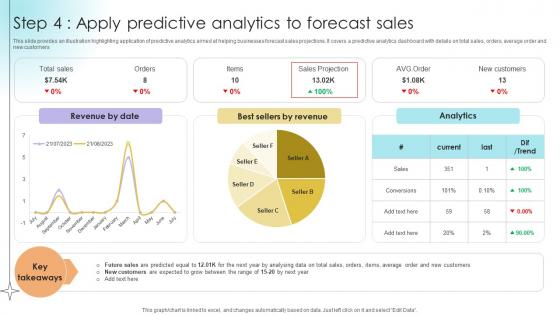
Step 4 Apply Predictive Analytics To Forecast Sales Data Analytics SS V
This slide provides an illustration highlighting application of predictive analytics aimed at helping businesses forecast sales projections. It covers a predictive analytics dashboard with details on total sales, orders, average order and new customers.Coming up with a presentation necessitates that the majority of the effort goes into the content and the message you intend to convey. The visuals of a PowerPoint presentation can only be effective if it supplements and supports the story that is being told. Keeping this in mind our experts created Step 4 Apply Predictive Analytics To Forecast Sales Data Analytics SS V to reduce the time that goes into designing the presentation. This way, you can concentrate on the message while our designers take care of providing you with the right template for the situation. This slide provides an illustration highlighting application of predictive analytics aimed at helping businesses forecast sales projections. It covers a predictive analytics dashboard with details on total sales, orders, average order and new customers.
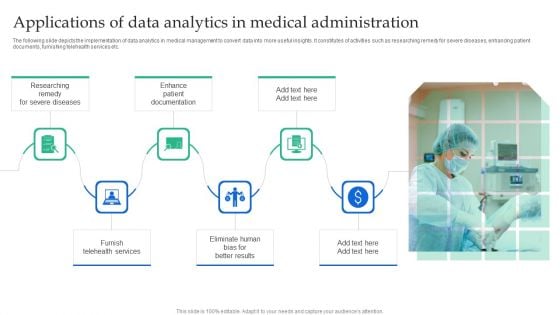
Applications Of Data Analytics In Medical Administration Diagrams PDF
The following slide depicts the implementation of data analytics in medical management to convert data into more useful insights. It constitutes of activities such as researching remedy for severe diseases, enhancing patient documents, furnishing telehealth services etc.Showcasing this set of slides titled Applications Of Data Analytics In Medical Administration Diagrams PDF. The topics addressed in these templates are Severe Diseases, Furnish Telehealth, Patient Documentation. All the content presented in this PPT design is completely editable. Download it and make adjustments in color, background, font etc. as per your unique business setting.
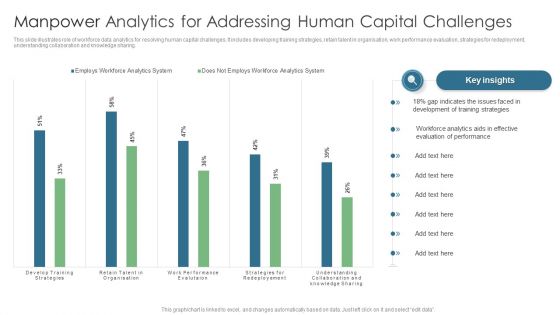
Manpower Analytics For Addressing Human Capital Challenges Diagrams PDF
This slide illustrates role of workforce data analytics for resolving human capital challenges. It includes developing training strategies, retain talent in organisation, work performance evaluation, strategies for redeployment, understanding collaboration and knowledge sharing. Showcasing this set of slides titled Manpower Analytics For Addressing Human Capital Challenges Diagrams PDF. The topics addressed in these templates are Gap Indicates, Training Strategies, Evaluation Performance. All the content presented in this PPT design is completely editable. Download it and make adjustments in color, background, font etc. as per your unique business setting.
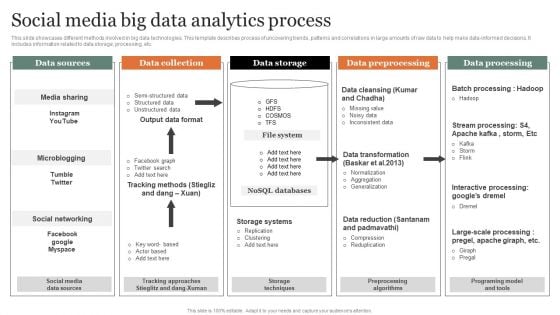
Social Media Big Data Analytics Process Diagrams PDF
This slide showcases different methods involved in big data technologies. This template describes process of uncovering trends, patterns and correlations in large amounts of raw data to help make data informed decisions. It includes information related to data storage, processing, etc. Showcasing this set of slides titled Social Media Big Data Analytics Process Diagrams PDF Microsoft. The topics addressed in these templates are Data Collection, Data Storage, Data Preprocessing. All the content presented in this PPT design is completely editable. Download it and make adjustments in color, background, font etc. as per your unique business setting.
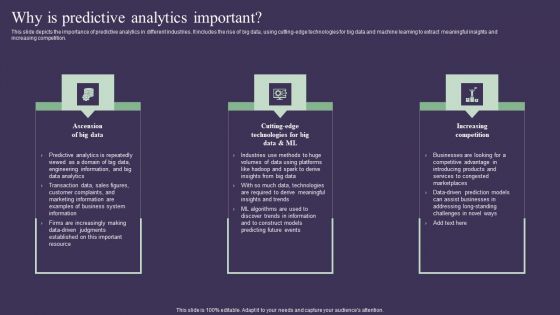
Projection Model Why Is Predictive Analytics Important Diagrams PDF
This slide depicts the importance of predictive analytics in different industries. It includes the rise of big data, using cutting-edge technologies for big data and machine learning to extract meaningful insights and increasing competition. Create an editable Projection Model Why Is Predictive Analytics Important Diagrams PDF that communicates your idea and engages your audience. Whether you are presenting a business or an educational presentation, pre-designed presentation templates help save time. Projection Model Why Is Predictive Analytics Important Diagrams PDF is highly customizable and very easy to edit, covering many different styles from creative to business presentations. Slidegeeks has creative team members who have crafted amazing templates. So, go and get them without any delay.
Data Analytics Plan For Digital Marketing Icon Diagrams PDF
Persuade your audience using this Data Analytics Plan For Digital Marketing Icon Diagrams PDF. This PPT design covers three stages, thus making it a great tool to use. It also caters to a variety of topics including Data Analytics Plan, Digital Marketing Icon. Download this PPT design now to present a convincing pitch that not only emphasizes the topic but also showcases your presentation skills.
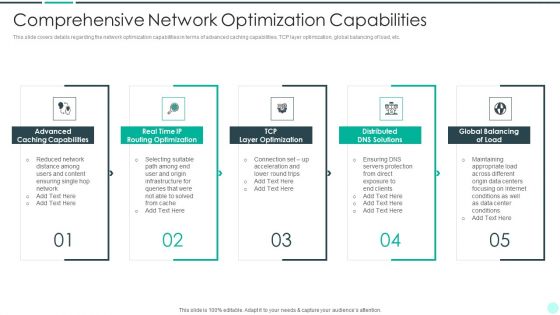
Executing Advance Data Analytics At Workspace Comprehensive Network Diagrams PDF
This slide helps in analyzing the performance of different executives representatives. It will help in tracking metrics such as cost per contact, percentage of tickets opened, etc. The staff performance will be assessed on various parameters such as cost, quality, productivity and service level. Deliver and pitch your topic in the best possible manner with this executing advance data analytics at workspace comprehensive network diagrams pdf. Use them to share invaluable insights on assessing staff performance on various parameters and impress your audience. This template can be altered and modified as per your expectations. So, grab it now.

Four Components Of Big Data And Analytics Framework Diagrams PDF
This slide illustrate four different components of data and analytics architecture that enable people and teams to store and analyze organizations data. It includes components such as data collection, transformation, data storage and analytics Persuade your audience using this Four Components Of Big Data And Analytics Framework Diagrams PDF. This PPT design covers four stages, thus making it a great tool to use. It also caters to a variety of topics including Data Collection, Transformation, Data Storage. Download this PPT design now to present a convincing pitch that not only emphasizes the topic but also showcases your presentation skills.
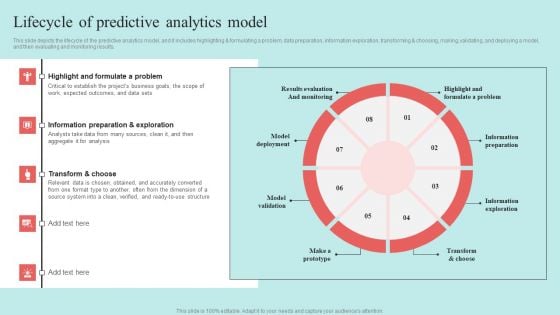
Predictive Data Model Lifecycle Of Predictive Analytics Model Diagrams PDF
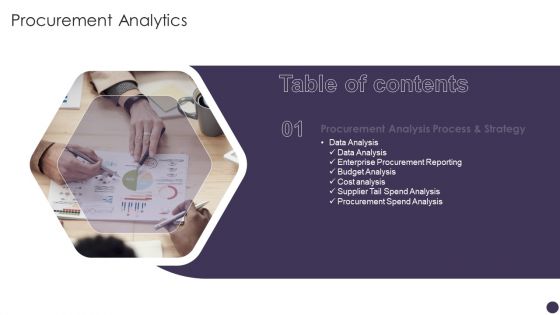
Table Of Contents Procurement Analytics Slide Diagrams PDF
Presenting Table Of Contents Procurement Analytics Slide Diagrams PDF to provide visual cues and insights. Share and navigate important information on one stage that need your due attention. This template can be used to pitch topics like Data Analysis, Enterprise Procurement, Budget Analysis. In addtion, this PPT design contains high resolution images, graphics, etc, that are easily editable and available for immediate download.
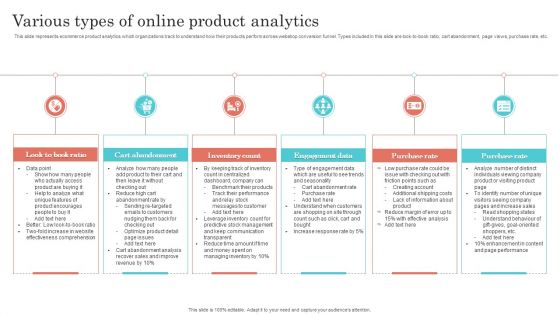
Various Types Of Online Product Analytics Diagrams PDF
This slide represents ecommerce product analytics which organizations track to understand how their products perform across webshop conversion funnel. Types included in this slide are look-to-book ratio, cart abandonment, page views, purchase rate, etc. Persuade your audience using this Various Types Of Online Product Analytics Diagrams PDF. This PPT design covers six stages, thus making it a great tool to use. It also caters to a variety of topics including Cart Abandonment, Inventory Count, Engagement Data. Download this PPT design now to present a convincing pitch that not only emphasizes the topic but also showcases your presentation skills.
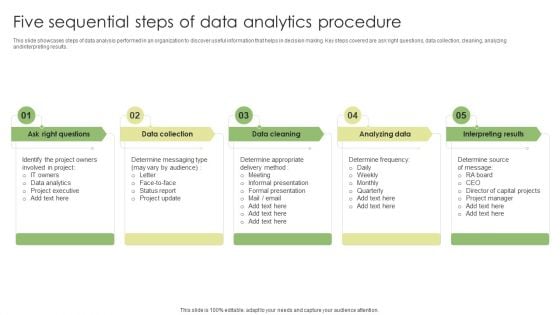
Five Sequential Steps Of Data Analytics Procedure Diagrams PDF
This slide showcases steps of data analysis performed in an organization to discover useful information that helps in decision making. Key steps covered are ask right questions, data collection, cleaning, analyzing and interpreting results. Persuade your audience using this Five Sequential Steps Of Data Analytics Procedure Diagrams PDF. This PPT design covers five stages, thus making it a great tool to use. It also caters to a variety of topics including Data Collection, Analyzing Data, Interpreting Results. Download this PPT design now to present a convincing pitch that not only emphasizes the topic but also showcases your presentation skills.
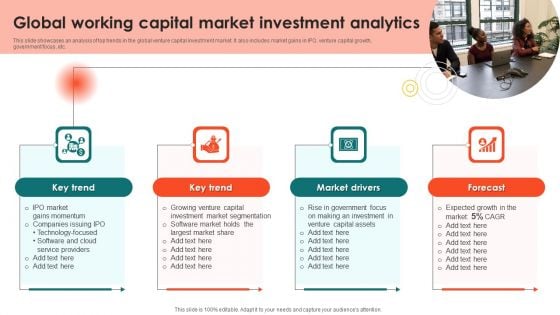
Global Working Capital Market Investment Analytics Diagrams PDF
This slide showcases an analysis of top trends in the global venture capital investment market. It also includes market gains in IPO, venture capital growth, government focus, etc. Presenting Global Working Capital Market Investment Analytics Diagrams PDF to dispense important information. This template comprises four stages. It also presents valuable insights into the topics including Key Trend, Key Trend, Market Drivers This is a completely customizable PowerPoint theme that can be put to use immediately. So, download it and address the topic impactfully.
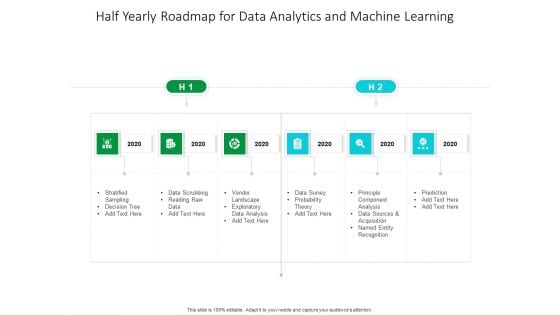
Half Yearly Roadmap For Data Analytics And Machine Learning Diagrams
Introducing our half yearly roadmap for data analytics and machine learning diagrams. This PPT presentation is Google Slides compatible, therefore, you can share it easily with the collaborators for measuring the progress. Also, the presentation is available in both standard screen and widescreen aspect ratios. So edit the template design by modifying the font size, font type, color, and shapes as per your requirements. As this PPT design is fully editable it can be presented in PDF, JPG and PNG formats.
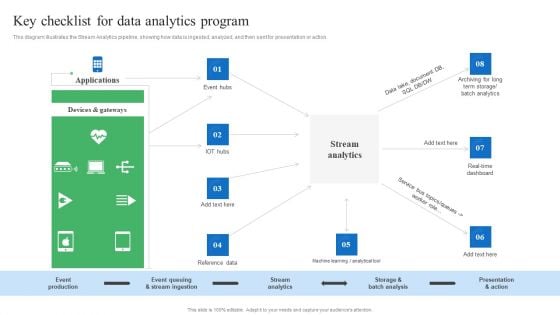
Toolkit For Data Science And Analytics Transition Key Checklist For Data Analytics Program Portrait PDF
This diagram illustrates the Stream Analytics pipeline, showing how data is ingested, analyzed, and then sent for presentation or action. Find highly impressive Toolkit For Data Science And Analytics Transition Key Checklist For Data Analytics Program Portrait PDF on Slidegeeks to deliver a meaningful presentation. You can save an ample amount of time using these presentation templates. No need to worry to prepare everything from scratch because Slidegeeks experts have already done a huge research and work for you. You need to download Toolkit For Data Science And Analytics Transition Key Checklist For Data Analytics Program Portrait PDF for your upcoming presentation. All the presentation templates are 100 percent editable and you can change the color and personalize the content accordingly. Download now.
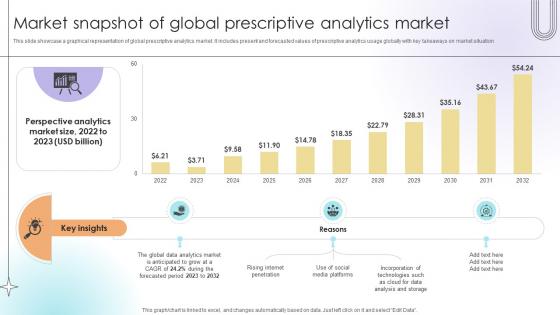
Market Snapshot Of Global Prescriptive Analytics Market Data Analytics SS V
This slide showcase a graphical representation of global prescriptive analytics market. It includes present and forecasted values of prescriptive analytics usage globally with key takeaways on market situation.Make sure to capture your audiences attention in your business displays with our gratis customizable Market Snapshot Of Global Prescriptive Analytics Market Data Analytics SS V. These are great for business strategies, office conferences, capital raising or task suggestions. If you desire to acquire more customers for your tech business and ensure they stay satisfied, create your own sales presentation with these plain slides. This slide showcase a graphical representation of global prescriptive analytics market. It includes present and forecasted values of prescriptive analytics usage globally with key takeaways on market situation.
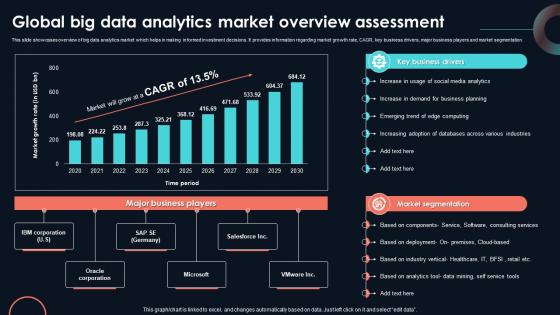
Global Big Data Analytics Market Developing Strategic Insights Using Big Data Analytics SS V
This slide showcases overview of big data analytics market which helps in making informed investment decisions. It provides information regarding market growth rate, CAGR, key business drivers, major business players and market segmentation. Slidegeeks has constructed Global Big Data Analytics Market Developing Strategic Insights Using Big Data Analytics SS V after conducting extensive research and examination. These presentation templates are constantly being generated and modified based on user preferences and critiques from editors. Here, you will find the most attractive templates for a range of purposes while taking into account ratings and remarks from users regarding the content. This is an excellent jumping-off point to explore our content and will give new users an insight into our top-notch PowerPoint Templates. This slide showcases overview of big data analytics market which helps in making informed investment decisions. It provides information regarding market growth rate, CAGR, key business drivers, major business players and market segmentation.
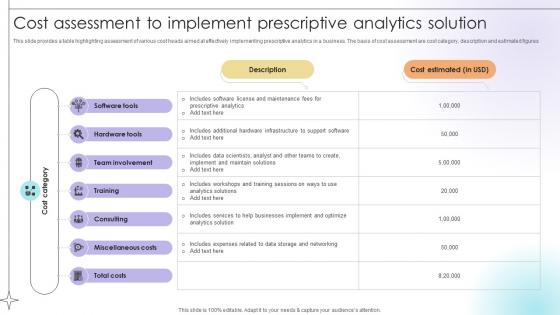
Cost Assessment To Implement Prescriptive Analytics Solution Data Analytics SS V
This slide provides a table highlighting assessment of various cost heads aimed at effectively implementing prescriptive analytics in a business. The basis of cost assessment are cost category, description and estimated figures.Retrieve professionally designed Cost Assessment To Implement Prescriptive Analytics Solution Data Analytics SS V to effectively convey your message and captivate your listeners. Save time by selecting pre-made slideshows that are appropriate for various topics, from business to educational purposes. These themes come in many different styles, from creative to corporate, and all of them are easily adjustable and can be edited quickly. Access them as PowerPoint templates or as Google Slides themes. You do not have to go on a hunt for the perfect presentation because Slidegeeks got you covered from everywhere. This slide provides a table highlighting assessment of various cost heads aimed at effectively implementing prescriptive analytics in a business. The basis of cost assessment are cost category, description and estimated figures.
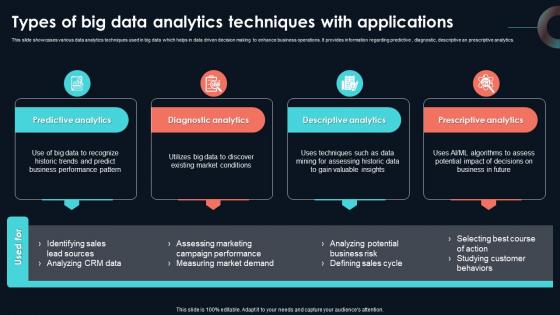
Types Of Big Data Analytics Techniques With Developing Strategic Insights Using Big Data Analytics SS V
This slide showcases various data analytics techniques used in big data which helps in data driven decision making to enhance business operations. It provides information regarding predictive , diagnostic, descriptive an prescriptive analytics. This slide showcases various data analytics techniques used in big data which helps in data driven decision making to enhance business operations. It provides information regarding predictive , diagnostic, descriptive an prescriptive analytics. Do you know about Slidesgeeks Types Of Big Data Analytics Techniques With Developing Strategic Insights Using Big Data Analytics SS V These are perfect for delivering any kind od presentation. Using it, create PowerPoint presentations that communicate your ideas and engage audiences. Save time and effort by using our pre-designed presentation templates that are perfect for a wide range of topic. Our vast selection of designs covers a range of styles, from creative to business, and are all highly customizable and easy to edit. Download as a PowerPoint template or use them as Google Slides themes. This slide showcases various data analytics techniques used in big data which helps in data driven decision making to enhance business operations. It provides information regarding predictive , diagnostic, descriptive an prescriptive analytics.
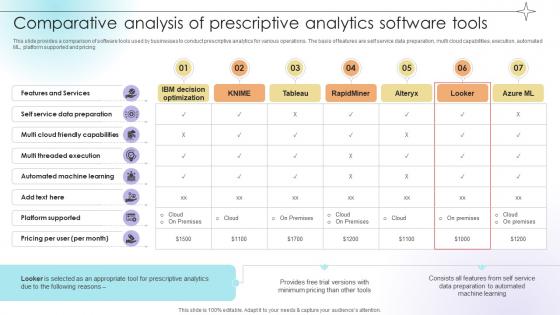
Comparative Analysis Of Prescriptive Analytics Software Tools Data Analytics SS V
This slide provides a comparison of software tools used by businesses to conduct prescriptive analytics for various operations. The basis of features are self service data preparation, multi cloud capabilities, execution, automated ML, platform supported and pricing.Are you searching for a Comparative Analysis Of Prescriptive Analytics Software Tools Data Analytics SS V that is uncluttered, straightforward, and original Its easy to edit, and you can change the colors to suit your personal or business branding. For a presentation that expresses how much effort you have put in, this template is ideal With all of its features, including tables, diagrams, statistics, and lists, its perfect for a business plan presentation. Make your ideas more appealing with these professional slides. Download Comparative Analysis Of Prescriptive Analytics Software Tools Data Analytics SS V from Slidegeeks today. This slide provides a comparison of software tools used by businesses to conduct prescriptive analytics for various operations. The basis of features are self service data preparation, multi cloud capabilities, execution, automated ML, platform supported and pricing.
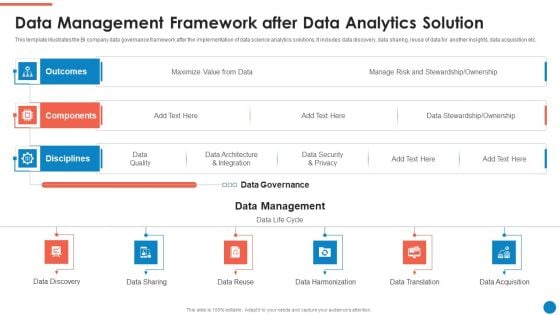
Data And Analytics Playbook Data Management Framework After Data Analytics Solution Designs PDF
This template illustrates the BI company data governance framework after the implementation of data science analytics solutions. It includes data discovery, data sharing, reuse of data for another insights, data acquisition etc. Deliver an awe inspiring pitch with this creative Data And Analytics Playbook Data Management Framework After Data Analytics Solution Designs PDF bundle. Topics like Outcomes, Components, Disciplines, Data Management, Data Governance can be discussed with this completely editable template. It is available for immediate download depending on the needs and requirements of the user.
Information Analytics And Ml Strategy Playbook How To Overcome Search Driven Analytics Barriers Icons PDF
This template depicts that intuitive search driven analytics gives users an easy way to ask questions, receive suggestions on what to query, and visualize their data. Deliver and pitch your topic in the best possible manner with this Information Analytics And Ml Strategy Playbook How To Overcome Search Driven Analytics Barriers Icons PDF. Use them to share invaluable insights on Analytics Systems, Revenue and impress your audience. This template can be altered and modified as per your expectations. So, grab it now.
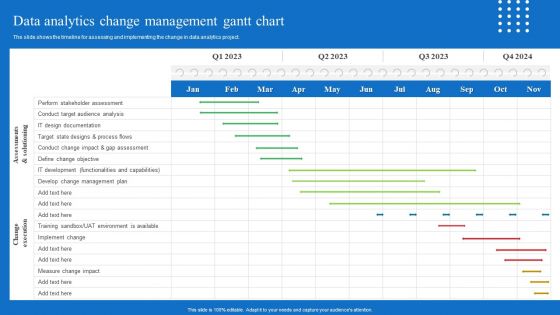
Toolkit For Data Science And Analytics Transition Data Analytics Change Management Gantt Chart Portrait PDF
The slide shows the timeline for assessing and implementing the change in data analytics project. Get a simple yet stunning designed Toolkit For Data Science And Analytics Transition Data Analytics Change Management Gantt Chart Portrait PDF It is the best one to establish the tone in your meetings. It is an excellent way to make your presentations highly effective. So, download this PPT today from Slidegeeks and see the positive impacts. Our easy to edit Toolkit For Data Science And Analytics Transition Data Analytics Change Management Gantt Chart Portrait PDF can be your go to option for all upcoming conferences and meetings. So, what are you waiting for Grab this template today.
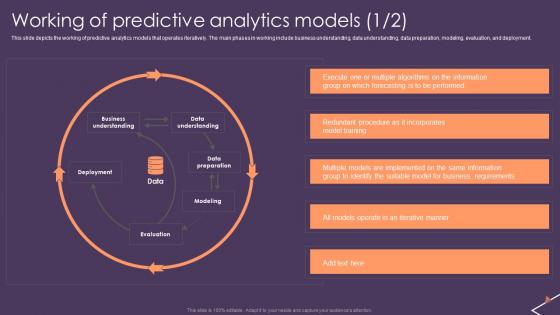
Working Of Predictive Analytics Models Predictive Analytics For Empowering Graphics Pdf
This slide depicts the working of predictive analytics models that operates iteratively. The main phases in working include business understanding, data understanding, data preparation, modeling, evaluation, and deployment. This Working Of Predictive Analytics Models Predictive Analytics For Empowering Graphics Pdf from Slidegeeks makes it easy to present information on your topic with precision. It provides customization options, so you can make changes to the colors, design, graphics, or any other component to create a unique layout. It is also available for immediate download, so you can begin using it right away. Slidegeeks has done good research to ensure that you have everything you need to make your presentation stand out. Make a name out there for a brilliant performance. This slide depicts the working of predictive analytics models that operates iteratively. The main phases in working include business understanding, data understanding, data preparation, modeling, evaluation, and deployment.
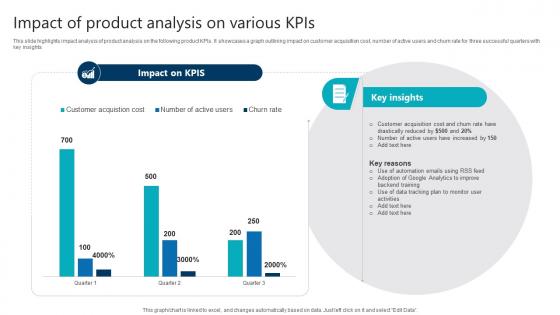
Impact Of Product Analysis On Various Kpis Product Analytics Implementation Data Analytics V
This slide highlights impact analysis of product analysis on the following product KPIs. It showcases a graph outlining impact on customer acquisition cost, number of active users and churn rate for three successful quarters with key insights Are you searching for a Impact Of Product Analysis On Various Kpis Product Analytics Implementation Data Analytics V that is uncluttered, straightforward, and original Its easy to edit, and you can change the colors to suit your personal or business branding. For a presentation that expresses how much effort you have put in, this template is ideal With all of its features, including tables, diagrams, statistics, and lists, its perfect for a business plan presentation. Make your ideas more appealing with these professional slides. Download Impact Of Product Analysis On Various Kpis Product Analytics Implementation Data Analytics V from Slidegeeks today. This slide highlights impact analysis of product analysis on the following product KPIs. It showcases a graph outlining impact on customer acquisition cost, number of active users and churn rate for three successful quarters with key insights
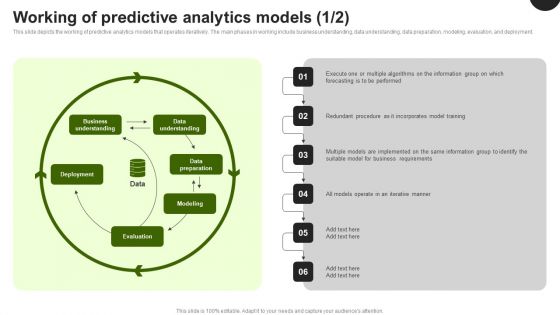
Predictive Analytics In The Age Of Big Data Working Of Predictive Analytics Models Introduction PDF
This slide depicts the working of predictive analytics models that operates iteratively. The main phases in working include business understanding, data understanding, data preparation, modeling, evaluation, and deployment. Find highly impressive Predictive Analytics In The Age Of Big Data Working Of Predictive Analytics Models Introduction PDF on Slidegeeks to deliver a meaningful presentation. You can save an ample amount of time using these presentation templates. No need to worry to prepare everything from scratch because Slidegeeks experts have already done a huge research and work for you. You need to download Predictive Analytics In The Age Of Big Data Working Of Predictive Analytics Models Introduction PDF for your upcoming presentation. All the presentation templates are 100 percent editable and you can change the color and personalize the content accordingly. Download now.
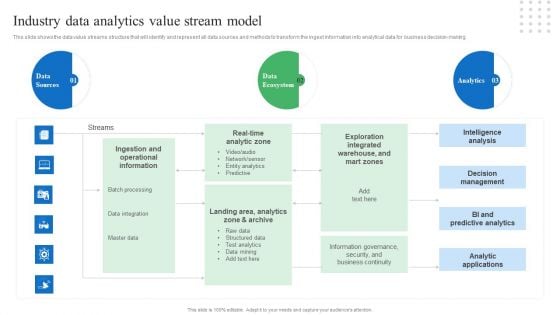
Toolkit For Data Science And Analytics Transition Industry Data Analytics Value Stream Model Brochure PDF
This slide shows the data value streams structure that will identify and represent all data sources and methods to transform the ingest information into analytical data for business decision-making. Whether you have daily or monthly meetings, a brilliant presentation is necessary. Toolkit For Data Science And Analytics Transition Industry Data Analytics Value Stream Model Brochure PDF can be your best option for delivering a presentation. Represent everything in detail using Toolkit For Data Science And Analytics Transition Industry Data Analytics Value Stream Model Brochure PDF and make yourself stand out in meetings. The template is versatile and follows a structure that will cater to your requirements. All the templates prepared by Slidegeeks are easy to download and edit. Our research experts have taken care of the corporate themes as well. So, give it a try and see the results.
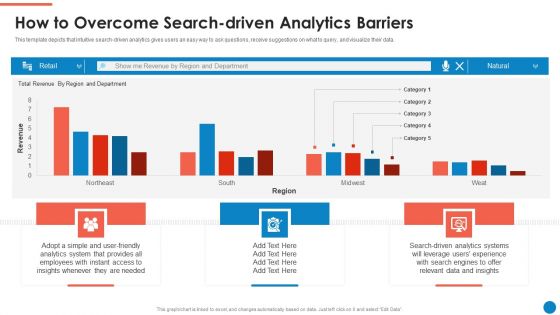
Data And Analytics Playbook How To Overcome Search Driven Analytics Barriers Template PDF
This template depicts that intuitive search-driven analytics gives users an easy way to ask questions, receive suggestions on what to query, and visualize their data. Deliver and pitch your topic in the best possible manner with this Data And Analytics Playbook How To Overcome Search Driven Analytics Barriers Template PDF. Use them to share invaluable insights on Total Revenue, Region And Department, Revenue and impress your audience. This template can be altered and modified as per your expectations. So, grab it now.
Toolkit For Data Science And Analytics Transition Venn Diagram Diagrams PDF
This Toolkit For Data Science And Analytics Transition Venn Diagram Diagrams PDF is perfect for any presentation, be it in front of clients or colleagues. It is a versatile and stylish solution for organizing your meetings. The Toolkit For Data Science And Analytics Transition Venn Diagram Diagrams PDF features a modern design for your presentation meetings. The adjustable and customizable slides provide unlimited possibilities for acing up your presentation. Slidegeeks has done all the homework before launching the product for you. So, do not wait, grab the presentation templates today.
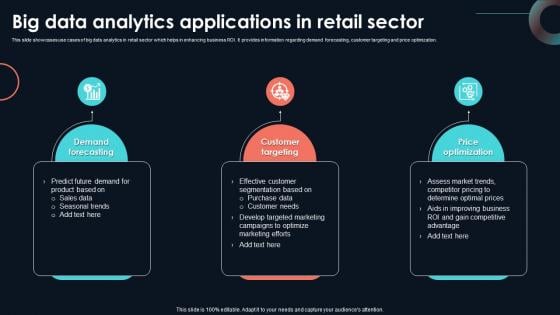
Big Data Analytics Applications In Retail Developing Strategic Insights Using Big Data Analytics SS V
This slide showcases use cases of big data analytics in retail sector which helps in enhancing business ROI. It provides information regarding demand forecasting, customer targeting and price optimization. Whether you have daily or monthly meetings, a brilliant presentation is necessary. Big Data Analytics Applications In Retail Developing Strategic Insights Using Big Data Analytics SS V can be your best option for delivering a presentation. Represent everything in detail using Big Data Analytics Applications In Retail Developing Strategic Insights Using Big Data Analytics SS V and make yourself stand out in meetings. The template is versatile and follows a structure that will cater to your requirements. All the templates prepared by Slidegeeks are easy to download and edit. Our research experts have taken care of the corporate themes as well. So, give it a try and see the results. This slide showcases use cases of big data analytics in retail sector which helps in enhancing business ROI. It provides information regarding demand forecasting, customer targeting and price optimization.
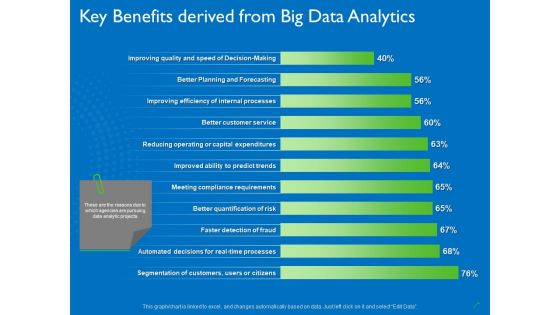
Transforming Big Data Analytics To Knowledge Key Benefits Derived From Big Data Analytics Introduction PDF
Deliver an awe inspiring pitch with this creative transforming big data analytics to knowledge key benefits derived from big data analytics introduction pdf bundle. Topics like service, processes, efficiency, planning, decision making can be discussed with this completely editable template. It is available for immediate download depending on the needs and requirements of the user.
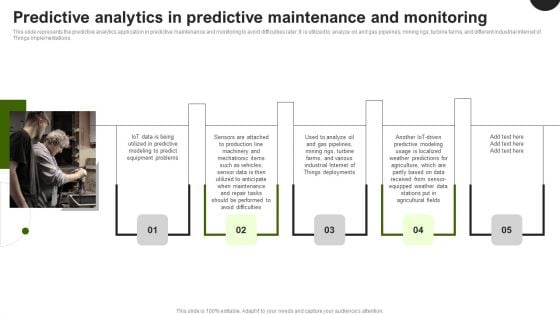
Predictive Analytics In The Age Of Big Data Predictive Analytics In Predictive Maintenance Graphics PDF
This slide represents the predictive analytics application in predictive maintenance and monitoring to avoid difficulties later. It is utilized to analyze oil and gas pipelines, mining rigs, turbine farms, and different industrial Internet of Things implementations. Are you searching for a Predictive Analytics In The Age Of Big Data Predictive Analytics In Predictive Maintenance Graphics PDF that is uncluttered, straightforward, and original Its easy to edit, and you can change the colors to suit your personal or business branding. For a presentation that expresses how much effort you have put in, this template is ideal. With all of its features, including tables, diagrams, statistics, and lists, its perfect for a business plan presentation. Make your ideas more appealing with these professional slides. Download Predictive Analytics In The Age Of Big Data Predictive Analytics In Predictive Maintenance Graphics PDF from Slidegeeks today.
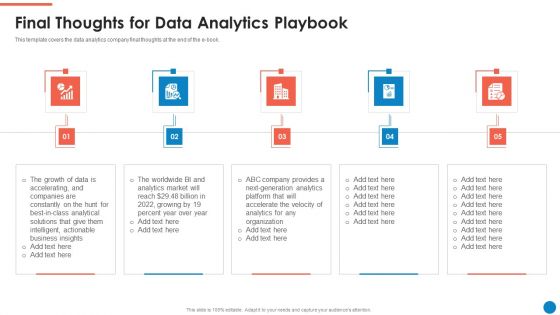
Data And Analytics Playbook Final Thoughts For Data Analytics Playbook Summary PDF
This template covers the data analytics company final thoughts at the end of the e-book. Presenting Data And Analytics Playbook Final Thoughts For Data Analytics Playbook Summary PDF to provide visual cues and insights. Share and navigate important information on five stages that need your due attention. This template can be used to pitch topics like Growth Data, Actionable Business Insights, Market. In addtion, this PPT design contains high resolution images, graphics, etc, that are easily editable and available for immediate download.
In Depth Implementation Guide For Healthcare Analytics Ppt Example Data Analytics CD V
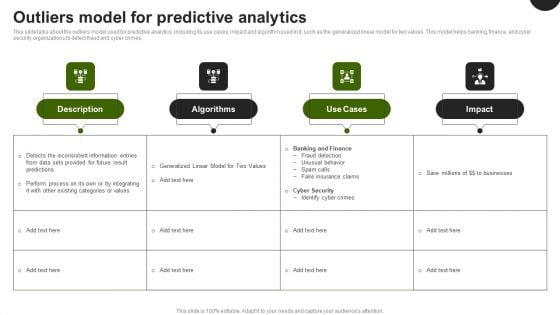
Predictive Analytics In The Age Of Big Data Outliers Model For Predictive Analytics Demonstration PDF
This slide talks about the outliers model used for predictive analytics, including its use cases, impact and algorithm used in it, such as the generalized linear model for two values. This model helps banking, finance, and cyber security organizations to detect fraud and cyber crimes. Whether you have daily or monthly meetings, a brilliant presentation is necessary. Predictive Analytics In The Age Of Big Data Outliers Model For Predictive Analytics Demonstration PDF can be your best option for delivering a presentation. Represent everything in detail using Predictive Analytics In The Age Of Big Data Outliers Model For Predictive Analytics Demonstration PDF and make yourself stand out in meetings. The template is versatile and follows a structure that will cater to your requirements. All the templates prepared by Slidegeeks are easy to download and edit. Our research experts have taken care of the corporate themes as well. So, give it a try and see the results.
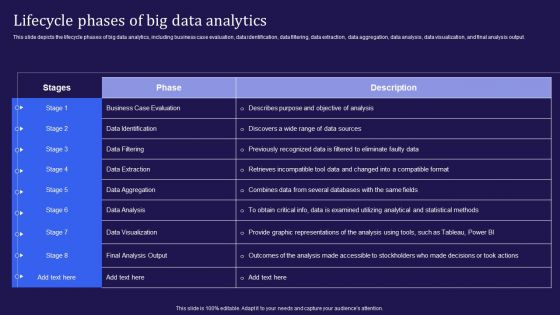
Big Data Analytics Lifecycle Lifecycle Phases Of Big Data Analytics Ppt Gallery Sample PDF
This slide depicts the lifecycle phases of big data analytics, including business case evaluation, data identification, data filtering, data extraction, data aggregation, data analysis, data visualization, and final analysis output. Slidegeeks is one of the best resources for PowerPoint templates. You can download easily and regulate Big Data Analytics Lifecycle Lifecycle Phases Of Big Data Analytics Ppt Gallery Sample PDF for your personal presentations from our wonderful collection. A few clicks is all it takes to discover and get the most relevant and appropriate templates. Use our Templates to add a unique zing and appeal to your presentation and meetings. All the slides are easy to edit and you can use them even for advertisement purposes.
Predictive Analytics In The Age Of Big Data Predictive Analytics Model Performance Tracking Introduction PDF
This slide represents the predictive analytics model performance tracking dashboard, and it covers the details of total visitors, total buyers, total products added to the cart, filters by date and category, visitors to clients conversion rate, and so on. Slidegeeks has constructed Predictive Analytics In The Age Of Big Data Predictive Analytics Model Performance Tracking Introduction PDF after conducting extensive research and examination. These presentation templates are constantly being generated and modified based on user preferences and critiques from editors. Here, you will find the most attractive templates for a range of purposes while taking into account ratings and remarks from users regarding the content. This is an excellent jumping off point to explore our content and will give new users an insight into our top notch PowerPoint Templates.
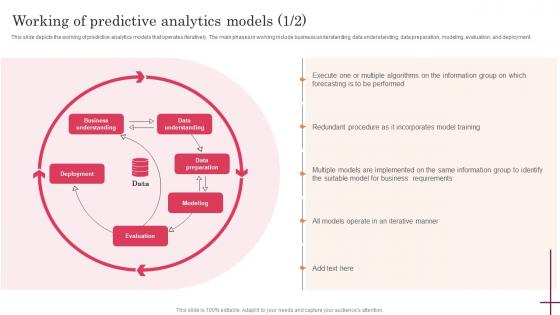
Predictive Analytics For Improved Working Of Predictive Analytics Models Template Pdf
This slide depicts the working of predictive analytics models that operates iteratively. The main phases in working include business understanding, data understanding, data preparation, modeling, evaluation, and deployment. If you are looking for a format to display your unique thoughts, then the professionally designed Predictive Analytics For Improved Working Of Predictive Analytics Models Template Pdf is the one for you. You can use it as a Google Slides template or a PowerPoint template. Incorporate impressive visuals, symbols, images, and other charts. Modify or reorganize the text boxes as you desire. Experiment with shade schemes and font pairings. Alter, share or cooperate with other people on your work. Download Working Of Predictive Analytics Models Predictive Analytics For Improved Template Pdf and find out how to give a successful presentation. Present a perfect display to your team and make your presentation unforgettable. This slide depicts the working of predictive analytics models that operates iteratively. The main phases in working include business understanding, data understanding, data preparation, modeling, evaluation, and deployment.
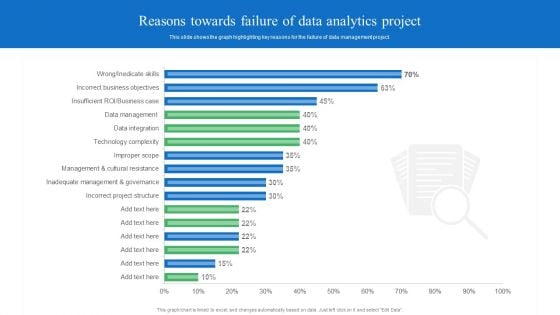
Toolkit For Data Science And Analytics Transition Reasons Towards Failure Of Data Analytics Project Background PDF
This slide shows the graph highlighting key reasons for the failure of data management project. If you are looking for a format to display your unique thoughts, then the professionally designed Toolkit For Data Science And Analytics Transition Reasons Towards Failure Of Data Analytics Project Background PDF is the one for you. You can use it as a Google Slides template or a PowerPoint template. Incorporate impressive visuals, symbols, images, and other charts. Modify or reorganize the text boxes as you desire. Experiment with shade schemes and font pairings. Alter, share or cooperate with other people on your work. Download Toolkit For Data Science And Analytics Transition Reasons Towards Failure Of Data Analytics Project Background PDF and find out how to give a successful presentation. Present a perfect display to your team and make your presentation unforgettable.
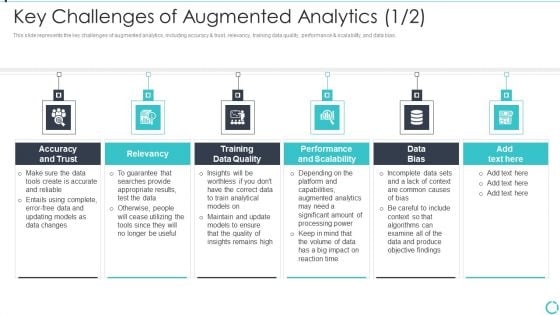
Augmented Analytics Implementation IT Key Challenges Of Augmented Analytics Themes PDF
This slide represents the key challenges of augmented analytics, including accuracy and trust, relevancy, training data quality, performance and scalability, and data bias. This is a Augmented Analytics Implementation IT Key Challenges Of Augmented Analytics Themes PDF template with various stages. Focus and dispense information on six stages using this creative set, that comes with editable features. It contains large content boxes to add your information on topics like Augmented Analytics, Including Accuracy And Trust, Relevancy, Training Data Quality, Performance And Scalability, Data Bias. You can also showcase facts, figures, and other relevant content using this PPT layout. Grab it now.
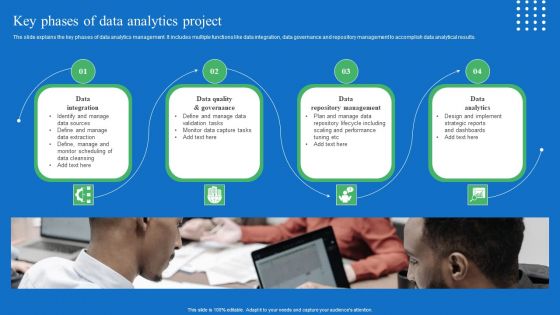
Toolkit For Data Science And Analytics Transition Key Phases Of Data Analytics Project Structure PDF
The slide explains the key phases of data analytics management. It includes multiple functions like data integration, data governance and repository management to accomplish data analytical results. Crafting an eye catching presentation has never been more straightforward. Let your presentation shine with this tasteful yet straightforward Toolkit For Data Science And Analytics Transition Key Phases Of Data Analytics Project Structure PDF template. It offers a minimalistic and classy look that is great for making a statement. The colors have been employed intelligently to add a bit of playfulness while still remaining professional. Construct the ideal Toolkit For Data Science And Analytics Transition Key Phases Of Data Analytics Project Structure PDF that effortlessly grabs the attention of your audience Begin now and be certain to wow your customers.
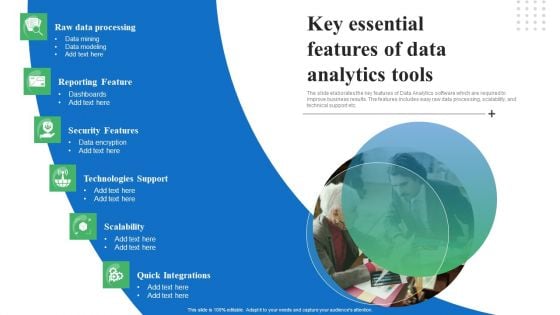
Toolkit For Data Science And Analytics Transition Key Essential Features Of Data Analytics Tools Elements PDF
The slide elaborates the key features of Data Analytics software which are required to improve business results. The features includes easy raw data processing, scalability, and technical support etc. Whether you have daily or monthly meetings, a brilliant presentation is necessary. Toolkit For Data Science And Analytics Transition Key Essential Features Of Data Analytics Tools Elements PDF can be your best option for delivering a presentation. Represent everything in detail using Toolkit For Data Science And Analytics Transition Key Essential Features Of Data Analytics Tools Elements PDF and make yourself stand out in meetings. The template is versatile and follows a structure that will cater to your requirements. All the templates prepared by Slidegeeks are easy to download and edit. Our research experts have taken care of the corporate themes as well. So, give it a try and see the results.
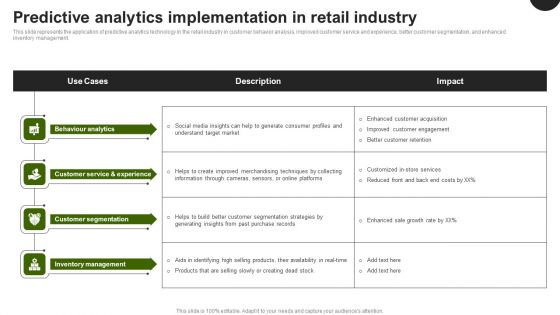
Predictive Analytics In The Age Of Big Data Predictive Analytics Implementation In Retail Industry Themes PDF
This slide represents the application of predictive analytics technology in the retail industry in customer behavior analysis, improved customer service and experience, better customer segmentation, and enhanced inventory management. Coming up with a presentation necessitates that the majority of the effort goes into the content and the message you intend to convey. The visuals of a PowerPoint presentation can only be effective if it supplements and supports the story that is being told. Keeping this in mind our experts created Predictive Analytics In The Age Of Big Data Predictive Analytics Implementation In Retail Industry Themes PDF to reduce the time that goes into designing the presentation. This way, you can concentrate on the message while our designers take care of providing you with the right template for the situation.
Icons Slide For Optimizing Decision Making The Power Of Prescriptive Analytics Data Analytics SS V
Introducing our well designed Icons Slide For Optimizing Decision Making The Power Of Prescriptive Analytics Data Analytics SS V set of slides. The slide displays editable icons to enhance your visual presentation. The icons can be edited easily. So customize according to your business to achieve a creative edge. Download and share it with your audience. Our Icons Slide For Optimizing Decision Making The Power Of Prescriptive Analytics Data Analytics SS V are topically designed to provide an attractive backdrop to any subject. Use them to look like a presentation pro.
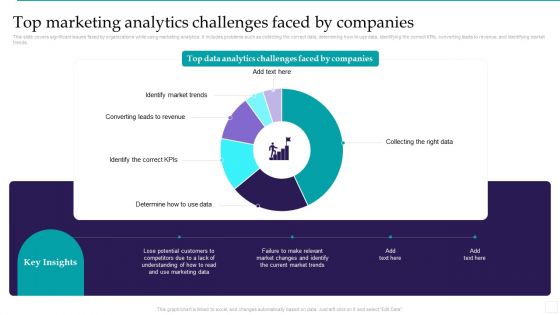
Optimizing Marketing Analytics To Enhance Organizational Growth Top Marketing Analytics Challenges Topics PDF
This slide covers significant issues faced by organizations while using marketing analytics. It includes problems such as collecting the correct data, determining how to use data, identifying the correct KPIs, converting leads to revenue, and identifying market trends. Present like a pro with Optimizing Marketing Analytics To Enhance Organizational Growth Top Marketing Analytics Challenges Topics PDF Create beautiful presentations together with your team, using our easy to use presentation slides. Share your ideas in real time and make changes on the fly by downloading our templates. So whether you are in the office, on the go, or in a remote location, you can stay in sync with your team and present your ideas with confidence. With Slidegeeks presentation got a whole lot easier. Grab these presentations today.
Predictive Analytics For Empowering Predictive Analytics Model Performance Tracking Brochure Pdf
This slide represents the predictive analytics model performance tracking dashboard, and it covers the details of total visitors, total buyers, total products added to the cart, filters by date and category, visitors to clients conversion rate, and so on. Retrieve professionally designed Predictive Analytics For Empowering Predictive Analytics Model Performance Tracking Brochure Pdf to effectively convey your message and captivate your listeners. Save time by selecting pre-made slideshows that are appropriate for various topics, from business to educational purposes. These themes come in many different styles, from creative to corporate, and all of them are easily adjustable and can be edited quickly. Access them as PowerPoint templates or as Google Slides themes. You do not have to go on a hunt for the perfect presentation because Slidegeeks got you covered from everywhere. This slide represents the predictive analytics model performance tracking dashboard, and it covers the details of total visitors, total buyers, total products added to the cart, filters by date and category, visitors to clients conversion rate, and so on.
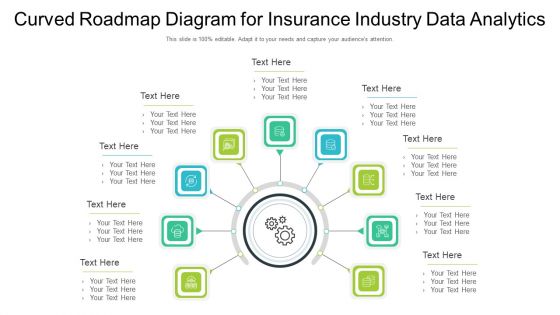
Curved Roadmap Diagram For Insurance Industry Data Analytics Ppt PowerPoint Presentation File Diagrams PDF
Presenting curved roadmap diagram for insurance industry data analytics ppt powerpoint presentation file diagrams pdf to dispense important information. This template comprises nine stages. It also presents valuable insights into the topics including curved roadmap diagram for insurance industry data analytics. This is a completely customizable PowerPoint theme that can be put to use immediately. So, download it and address the topic impactfully.
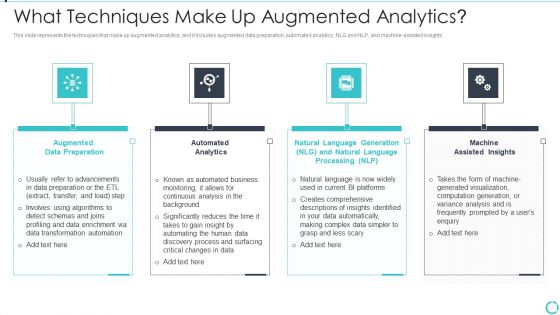
Augmented Analytics Implementation IT What Techniques Make Up Augmented Analytics Microsoft PDF
This slide represents the techniques that make up augmented analytics, and it includes augmented data preparation, automated analytics, NLG and NLP, and machine-assisted insights. Presenting Augmented Analytics Implementation IT What Techniques Make Up Augmented Analytics Microsoft PDF to provide visual cues and insights. Share and navigate important information on four stages that need your due attention. This template can be used to pitch topics like Augmented Data Preparation, Automated Analytics, Machine Assisted Insights, Natural Language Processing. In addtion, this PPT design contains high resolution images, graphics, etc, that are easily editable and available for immediate download.


 Continue with Email

 Home
Home


