Control Chart
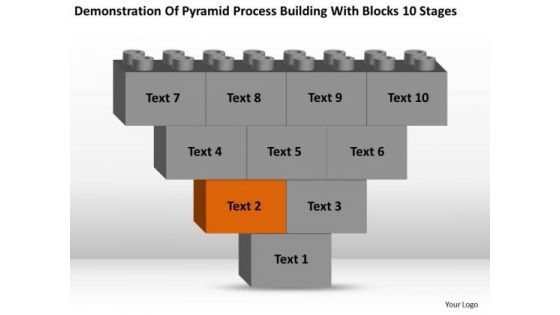
Business Charts Examples Of Pyramid Process Building With Blocks 10 Stages Ppt PowerPoint Slides
We present our business charts examples of pyramid process building with blocks 10 stages ppt PowerPoint Slides.Present our Construction PowerPoint Templates because Our PowerPoint Templates and Slides will let you Leave a lasting impression to your audiences. They possess an inherent longstanding recall factor. Download our Pyramids PowerPoint Templates because Watching this your Audience will Grab their eyeballs, they wont even blink. Download and present our Business PowerPoint Templates because Our PowerPoint Templates and Slides will let you meet your Deadlines. Use our Shapes PowerPoint Templates because You can Be the star of the show with our PowerPoint Templates and Slides. Rock the stage with your ideas. Present our Leadership PowerPoint Templates because Our PowerPoint Templates and Slides will definately Enhance the stature of your presentation. Adorn the beauty of your thoughts with their colourful backgrounds.Use these PowerPoint slides for presentations relating to box, chart, organization, 3d, square, grade, floor, step, triangle, business, concept, vector, sign, success, presentation, template, elements, diagram, graphic, process, tier, flowchart, rectangular, level, layer, shape, class, illustration, figure, stage, object, degree, brochure template, shiny, rating, rectangular shape, design, pyramid, organization chart, company, quadrangle, conceptual, sliced, structure, present, block. The prominent colors used in the PowerPoint template are Brown, Gray, Black. Cover the gaps with our Business Charts Examples Of Pyramid Process Building With Blocks 10 Stages Ppt PowerPoint Slides. They provide an ideal filling.
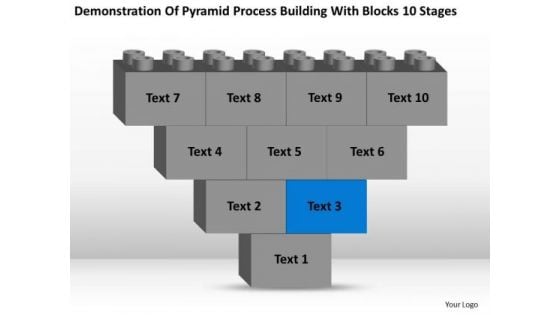
Business Charts Examples Of Pyramid Process Building With Blocks 10 Stages PowerPoint Slides
We present our business charts examples of pyramid process building with blocks 10 stages PowerPoint Slides.Use our Construction PowerPoint Templates because Our PowerPoint Templates and Slides will generate and maintain the level of interest you desire. They will create the impression you want to imprint on your audience. Present our Pyramids PowerPoint Templates because Our PowerPoint Templates and Slides are the chords of your song. String them along and provide the lilt to your views. Download and present our Business PowerPoint Templates because It will Raise the bar of your Thoughts. They are programmed to take you to the next level. Present our Shapes PowerPoint Templates because Our PowerPoint Templates and Slides will let you Leave a lasting impression to your audiences. They possess an inherent longstanding recall factor. Download and present our Leadership PowerPoint Templates because Our PowerPoint Templates and Slides will Activate the energies of your audience. Get their creative juices flowing with your words.Use these PowerPoint slides for presentations relating to box, chart, organization, 3d, square, grade, floor, step, triangle, business, concept, vector, sign, success, presentation, template, elements, diagram, graphic, process, tier, flowchart, rectangular, level, layer, shape, class, illustration, figure, stage, object, degree, brochure template, shiny, rating, rectangular shape, design, pyramid, organization chart, company, quadrangle, conceptual, sliced, structure, present, block. The prominent colors used in the PowerPoint template are Blue, Gray, Black. Your ideas will raise the stocks. Gain equity with our Business Charts Examples Of Pyramid Process Building With Blocks 10 Stages PowerPoint Slides.
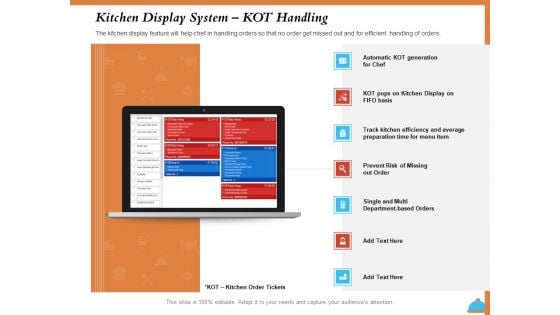
Improving Restaurant Operations Kitchen Display System Kot Handling Ppt Diagram Graph Charts PDF
Presenting this set of slides with name improving restaurant operations kitchen display system kot handling ppt diagram graph charts pdf. This is a seven stage process. The stages in this process are automatic kot generation chef , kot pops kitchen display, fifo basis, track kitchen efficiency and average preparation time, menu item, prevent risk of missing out order, single and multi, department based orders. This is a completely editable PowerPoint presentation and is available for immediate download. Download now and impress your audience.
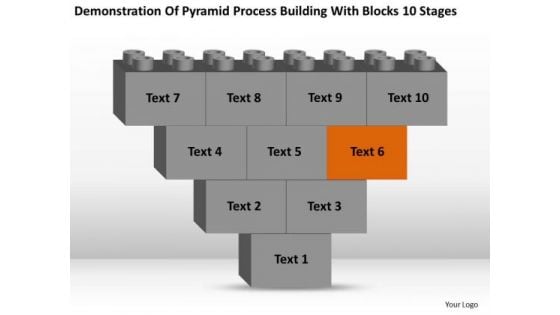
Business Charts Examples Of Pyramid Process Building With Blocks 10 Stages Ppt 6 PowerPoint Slides
We present our business charts examples of pyramid process building with blocks 10 stages ppt 6 PowerPoint Slides.Download and present our Construction PowerPoint Templates because Our PowerPoint Templates and Slides are conceived by a dedicated team. Use them and give form to your wondrous ideas. Use our Pyramids PowerPoint Templates because Our PowerPoint Templates and Slides will fulfill your every need. Use them and effectively satisfy the desires of your audience. Download our Business PowerPoint Templates because It can Bubble and burst with your ideas. Present our Shapes PowerPoint Templates because Timeline crunches are a fact of life. Meet all deadlines using our PowerPoint Templates and Slides. Present our Leadership PowerPoint Templates because Our PowerPoint Templates and Slides will bullet point your ideas. See them fall into place one by one.Use these PowerPoint slides for presentations relating to box, chart, organization, 3d, square, grade, floor, step, triangle, business, concept, vector, sign, success, presentation, template, elements, diagram, graphic, process, tier, flowchart, rectangular, level, layer, shape, class, illustration, figure, stage, object, degree, brochure template, shiny, rating, rectangular shape, design, pyramid, organization chart, company, quadrangle, conceptual, sliced, structure, present, block. The prominent colors used in the PowerPoint template are Brown, Gray, Black. Guide your team with our Business Charts Examples Of Pyramid Process Building With Blocks 10 Stages Ppt 6 PowerPoint Slides. Download without worries with our money back guaranteee.
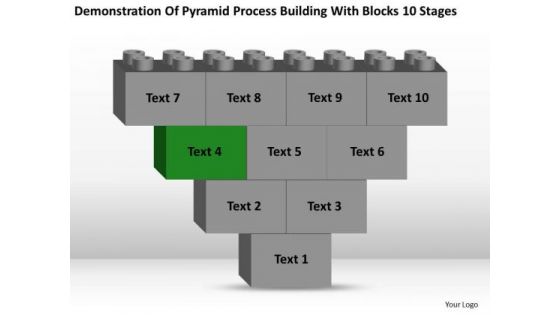
Business Charts Examples Of Pyramid Process Building With Blocks 10 Stages PowerPoint Slide
We present our business charts examples of pyramid process building with blocks 10 stages PowerPoint Slide.Download and present our Construction PowerPoint Templates because You should Throw the gauntlet with our PowerPoint Templates and Slides. They are created to take up any challenge. Download and present our Pyramids PowerPoint Templates because It will let you Set new benchmarks with our PowerPoint Templates and Slides. They will keep your prospects well above par. Download and present our Business PowerPoint Templates because You are well armed with penetrative ideas. Our PowerPoint Templates and Slides will provide the gunpowder you need. Download and present our Shapes PowerPoint Templates because You can safely bank on our PowerPoint Templates and Slides. They will provide a growth factor to your valuable thoughts. Download our Leadership PowerPoint Templates because Our PowerPoint Templates and Slides will steer your racing mind. Hit the right buttons and spur on your audience.Use these PowerPoint slides for presentations relating to box, chart, organization, 3d, square, grade, floor, step, triangle, business, concept, vector, sign, success, presentation, template, elements, diagram, graphic, process, tier, flowchart, rectangular, level, layer, shape, class, illustration, figure, stage, object, degree, brochure template, shiny, rating, rectangular shape, design, pyramid, organization chart, company, quadrangle, conceptual, sliced, structure, present, block. The prominent colors used in the PowerPoint template are Green, Gray, Black. Present technologically advanced operations with our Business Charts Examples Of Pyramid Process Building With Blocks 10 Stages PowerPoint Slide. They will make you look good.
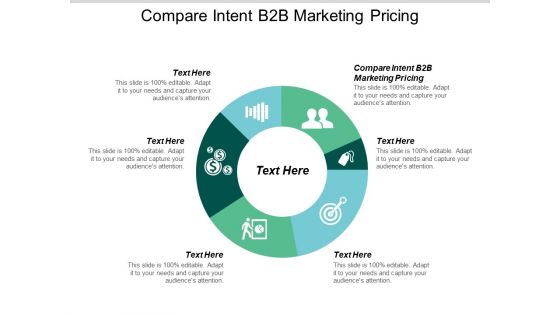
Compare Intent B2B Marketing Pricing Ppt PowerPoint Presentation Diagram Graph Charts Cpb
Presenting this set of slides with name compare intent b2b marketing pricing ppt powerpoint presentation diagram graph charts cpb. This is an editable Powerpoint six stages graphic that deals with topics like compare intent b2b marketing pricing to help convey your message better graphically. This product is a premium product available for immediate download and is 100 percent editable in Powerpoint. Download this now and use it in your presentations to impress your audience.
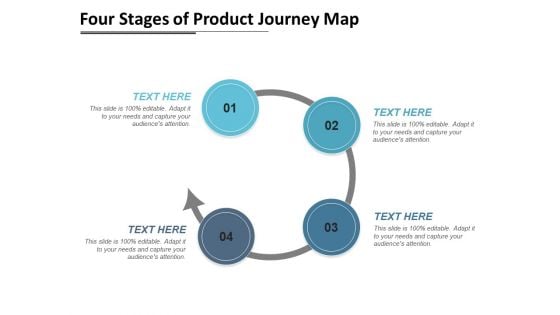
Four Stages Of Product Journey Map Ppt PowerPoint Presentation Diagram Graph Charts PDF
Presenting this set of slides with name four stages of product journey map ppt powerpoint presentation diagram graph charts pdf. This is a four stage process. The stages in this process are four stages of product journey map. This is a completely editable PowerPoint presentation and is available for immediate download. Download now and impress your audience.
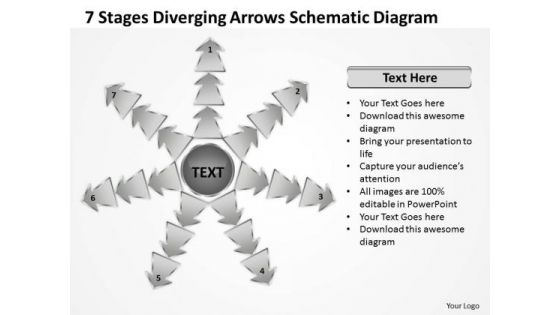
7 Stages Diverging Arrows Schematic Diagram Charts And Networks PowerPoint Slides
We present our 7 stages diverging arrows schematic diagram Charts and Networks PowerPoint Slides.Download and present our Marketing PowerPoint Templates because different personalities, different abilities but formidable together. Download and present our Shapes PowerPoint Templates because you have to coordinate and motivate your team. Download and present our Arrows PowerPoint Templates because our templates illustrates your ability. Download and present our Business PowerPoint Templates because everybody knows The world over it is a priority for many. Along with it there are so many oppurtunities waiting to be utilised. Use our Process and Flows PowerPoint Templates because they pinpoint the core values of your organisation.Use these PowerPoint slides for presentations relating to Arrows, Business, Chart, Cyclic, Data, Diagram, Financial, Goal, Graph, Illustration, Info, Information, Marketing, Model, Option, Part, Pie, Presentation, Process, Result, Sphere, Statistics. The prominent colors used in the PowerPoint template are White, Gray, Black. The feedback we get is that our 7 stages diverging arrows schematic diagram Charts and Networks PowerPoint Slides help you meet deadlines which are an element of today's workplace. Just browse and pick the slides that appeal to your intuitive senses. People tell us our Data PowerPoint templates and PPT Slides are Cheerful. Presenters tell us our 7 stages diverging arrows schematic diagram Charts and Networks PowerPoint Slides look good visually. Use our Data PowerPoint templates and PPT Slides are Wonderful. Use our 7 stages diverging arrows schematic diagram Charts and Networks PowerPoint Slides are Youthful. Use our Diagram PowerPoint templates and PPT Slides are Upbeat. Correct the errant with our 7 Stages Diverging Arrows Schematic Diagram Charts And Networks PowerPoint Slides. They will willingly accept your advice.

Santa Wishing Merry Christmas With Board Work Flow Charts PowerPoint Slides
We present our santa wishing merry christmas with board work flow charts PowerPoint Slides.Use our Spheres PowerPoint Templates because,You can Take your team along by explaining your plans. Use our Events PowerPoint Templates because,You can Signpost your preferred roadmap to your eager co- travellers and demonstrate clearly how you intend to navigate them towards the desired corporate goal. Use our Festival PowerPoint Templates because, This slide demonstrates how they contribute to the larger melting pot. Use our Holidays PowerPoint Templates because,You are aware of some pitfalls ahead where you need to be cautious not to overrun and avoid a stall. Use our Spheres PowerPoint Templates because, It is in your DNA to analyse possible causes to the minutest detail.Use these PowerPoint slides for presentations relating to Background, Business, Celebration, Christmas, Conceptual, Congratulation, Design, Element, Events, Graphic, Greeting, Holidays, Inscription, Invitation, Merry, Mistletoe, Phrase, Sign, Style, Wishes. The prominent colors used in the PowerPoint template are Red, Yellow, Green. People tell us our santa wishing merry christmas with board work flow charts PowerPoint Slides are Classic. PowerPoint presentation experts tell us our Element PowerPoint templates and PPT Slides are Adorable. PowerPoint presentation experts tell us our santa wishing merry christmas with board work flow charts PowerPoint Slides are Exuberant. Professionals tell us our Design PowerPoint templates and PPT Slides are Nostalgic. Professionals tell us our santa wishing merry christmas with board work flow charts PowerPoint Slides are Dazzling. People tell us our Element PowerPoint templates and PPT Slides are Fantastic. Our Santa Wishing Merry Christmas With Board Work Flow Charts PowerPoint Slides help in analysing contributory factors. Examine what each brings to the table.
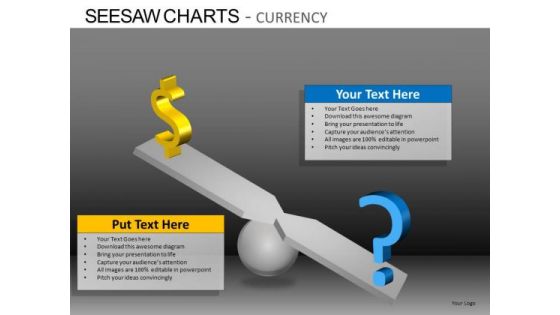
PowerPoint Design Slides Executive Success Seesaw Charts Currency Ppt Ppt Slide
PowerPoint Design Slides Executive Success Seesaw Charts Currency PPT PPT Slide-These high quality powerpoint pre-designed slides and powerpoint templates have been carefully created by our professional team to help you impress your audience. All slides have been created and are 100% editable in powerpoint. Each and every property of any graphic - color, size, orientation, shading, outline etc. can be modified to help you build an effective powerpoint presentation. Any text can be entered at any point in the powerpoint template or slide. Simply DOWNLOAD, TYPE and PRESENT! Achieve strong & sustainable productivity gains with our PowerPoint Design Slides Executive Success Seesaw Charts Currency Ppt Ppt Slide. They will make you look good.
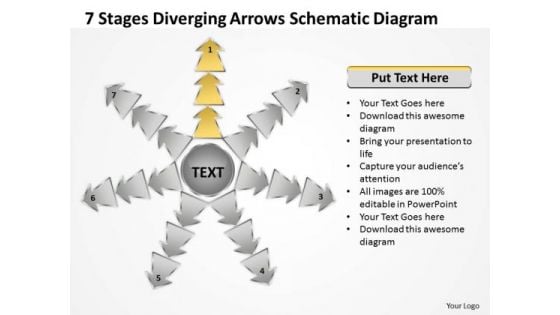
7 Stages Diverging Arrows Schematic Diagram Ppt Charts And Networks PowerPoint Slides
We present our 7 stages diverging arrows schematic diagram ppt Charts and Networks PowerPoint Slides.Download our Marketing PowerPoint Templates because Our PowerPoint Templates and Slides are Clear and concise. Use them and dispel any doubts your team may have. Download and present our Shapes PowerPoint Templates because You can Connect the dots. Fan expectations as the whole picture emerges. Present our Arrows PowerPoint Templates because this Slide offers an excellent background to build up the various stages of your business process. Use our Business PowerPoint Templates because you have analysed many global markets and come up with possibilities. Highlight the pros and cons of other likely business oppurtunities. Download and present our Process and Flows PowerPoint Templates because spreading the light of knowledge around you will clear the doubts and enlighten the questioning minds with your brilliance and ability.Use these PowerPoint slides for presentations relating to Arrows, Business, Chart, Cyclic, Data, Diagram, Financial, Goal, Graph, Illustration, Info, Information, Marketing, Model, Option, Part, Pie, Presentation, Process, Result, Sphere, Statistics. The prominent colors used in the PowerPoint template are Yellow, Gray, Black. The feedback we get is that our 7 stages diverging arrows schematic diagram ppt Charts and Networks PowerPoint Slides are Breathtaking. People tell us our Graph PowerPoint templates and PPT Slides are Splendid. Presenters tell us our 7 stages diverging arrows schematic diagram ppt Charts and Networks PowerPoint Slides are Functional. Use our Graph PowerPoint templates and PPT Slides will make the presenter successul in his career/life. Use our 7 stages diverging arrows schematic diagram ppt Charts and Networks PowerPoint Slides are visually appealing. Use our Graph PowerPoint templates and PPT Slides are Dynamic. Our 7 Stages Diverging Arrows Schematic Diagram Ppt Charts And Networks PowerPoint Slides are committed to benefit you. They ensure your thoughts get the credit.
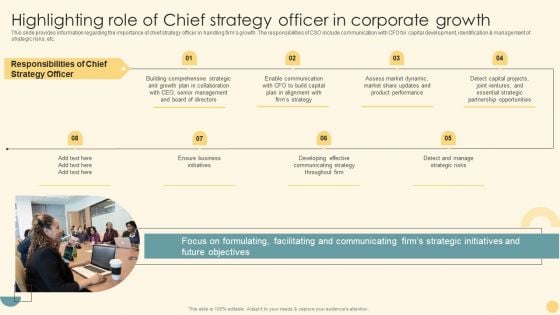
Highlighting Role Of Chief Strategy Officer In Corporate Growth Ppt PowerPoint Presentation Diagram Graph Charts PDF
This slide provides information regarding the importance of chief strategy officer in handling firms growth. The responsibilities of CSO include communication with CFO for capital development, identification and management of strategic risks, etc. Slidegeeks is here to make your presentations a breeze with Highlighting Role Of Chief Strategy Officer In Corporate Growth Ppt PowerPoint Presentation Diagram Graph Charts PDF With our easy to use and customizable templates, you can focus on delivering your ideas rather than worrying about formatting. With a variety of designs to choose from, you are sure to find one that suits your needs. And with animations and unique photos, illustrations, and fonts, you can make your presentation pop. So whether you are giving a sales pitch or presenting to the board, make sure to check out Slidegeeks first.

7 Stages Diverging Arrows Schematic Diagram Charts And Networks PowerPoint Slide
We present our 7 stages diverging arrows schematic diagram Charts and Networks PowerPoint Slide.Download our Marketing PowerPoint Templates because you can Be the cynosure of all eyes with our template depicting . Use our Shapes PowerPoint Templates because you know your business and have a vision for it. Present our Arrows PowerPoint Templates because you have the process in your head, our template design showing will illuminate your thoughts. Use our Business PowerPoint Templates because profit levels have been steady over the recent past. Spread your heightened excitement to others in the room. Use our Process and Flows PowerPoint Templates because this diagram depicts the essence of this chain reaction like sequence of events.Use these PowerPoint slides for presentations relating to Arrows, Business, Chart, Cyclic, Data, Diagram, Financial, Goal, Graph, Illustration, Info, Information, Marketing, Model, Option, Part, Pie, Presentation, Process, Result, Sphere, Statistics. The prominent colors used in the PowerPoint template are Green, Gray, Black. The feedback we get is that our 7 stages diverging arrows schematic diagram Charts and Networks PowerPoint Slide are Handsome. People tell us our Diagram PowerPoint templates and PPT Slides will help you be quick off the draw. Just enter your specific text and see your points hit home. Presenters tell us our 7 stages diverging arrows schematic diagram Charts and Networks PowerPoint Slide are Precious. Use our Diagram PowerPoint templates and PPT Slides are Beautiful. Use our 7 stages diverging arrows schematic diagram Charts and Networks PowerPoint Slide are Nifty. Use our Diagram PowerPoint templates and PPT Slides are Exuberant. Our 7 Stages Diverging Arrows Schematic Diagram Charts And Networks PowerPoint Slide are faithful servants. They will put in all possible effort for you.
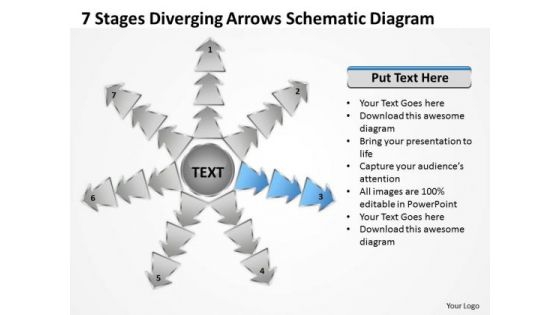
7 Stages Diverging Arrows Schematic Diagram Ppt Charts And Networks PowerPoint Slide
We present our 7 stages diverging arrows schematic diagram ppt Charts and Networks PowerPoint Slide.Use our Marketing PowerPoint Templates because you can Break it all down to Key Result Areas. Use our Shapes PowerPoint Templates because this diagram is designed to help your audience to develop their thoughts along the way. Use our Arrows PowerPoint Templates because this slide illuminates the spiritual brilliance of Jesus and showers the love for mankind he showed even while being crucified. Use our Business PowerPoint Templates because you can Lead your flock steadily to greater heights. Look around at the vast potential of achievement around you. Use our Process and Flows PowerPoint Templates because you can Highlight the key components of your entire manufacturing/ business process.Use these PowerPoint slides for presentations relating to Arrows, Business, Chart, Cyclic, Data, Diagram, Financial, Goal, Graph, Illustration, Info, Information, Marketing, Model, Option, Part, Pie, Presentation, Process, Result, Sphere, Statistics. The prominent colors used in the PowerPoint template are Blue, Gray, Black. The feedback we get is that our 7 stages diverging arrows schematic diagram ppt Charts and Networks PowerPoint Slide are Fashionable. People tell us our Data PowerPoint templates and PPT Slides are Perfect. Presenters tell us our 7 stages diverging arrows schematic diagram ppt Charts and Networks PowerPoint Slide will make the presenter successul in his career/life. Use our Goal PowerPoint templates and PPT Slides are Bold. Use our 7 stages diverging arrows schematic diagram ppt Charts and Networks PowerPoint Slide are Spiffy. Use our Financial PowerPoint templates and PPT Slides are Functional. Feather your nest with our 7 Stages Diverging Arrows Schematic Diagram Ppt Charts And Networks PowerPoint Slide. Your thoughts will evolve in a comfortable climate.
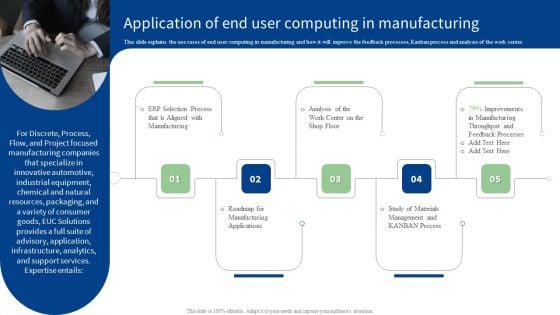
Application Of End User Computing In Manufacturing Ppt PowerPoint Presentation Diagram Graph Charts PDF
This slide explains the use cases of end user computing in manufacturing and how it will improve the feedback processes, Kanban process and analysis of the work center. Do you have to make sure that everyone on your team knows about any specific topic I yes, then you should give Application Of End User Computing In Manufacturing Ppt PowerPoint Presentation Diagram Graph Charts PDF a try. Our experts have put a lot of knowledge and effort into creating this impeccable Application Of End User Computing In Manufacturing Ppt PowerPoint Presentation Diagram Graph Charts PDF. You can use this template for your upcoming presentations, as the slides are perfect to represent even the tiniest detail. You can download these templates from the Slidegeeks website and these are easy to edit. So grab these today.
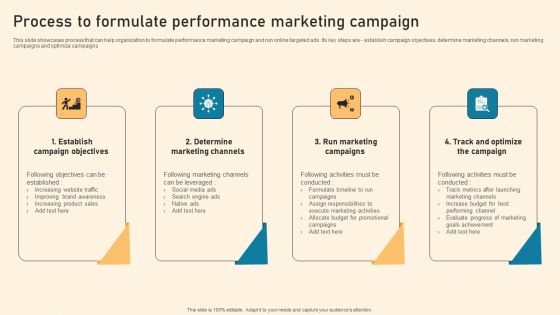
Process To Formulate Performance Marketing Campaign Ppt PowerPoint Presentation Diagram Graph Charts PDF
This slide showcases process that can help organization to formulate performance marketing campaign and run online targeted ads. Its key steps are - establish campaign objectives, determine marketing channels, run marketing campaigns and optimize campaigns Explore a selection of the finest Process To Formulate Performance Marketing Campaign Ppt PowerPoint Presentation Diagram Graph Charts PDF here. With a plethora of professionally designed and pre made slide templates, you can quickly and easily find the right one for your upcoming presentation. You can use our Process To Formulate Performance Marketing Campaign Ppt PowerPoint Presentation Diagram Graph Charts PDF to effectively convey your message to a wider audience. Slidegeeks has done a lot of research before preparing these presentation templates. The content can be personalized and the slides are highly editable. Grab templates today from Slidegeeks.
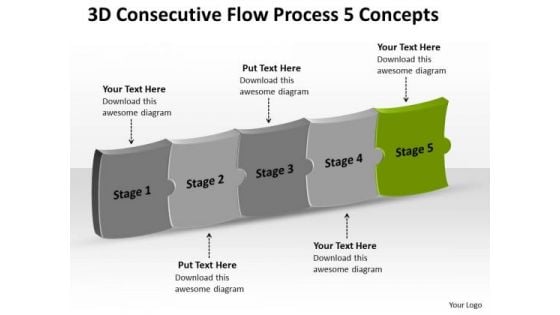
3d Consecutive Flow Process 5 Concepts What Is Charts PowerPoint Slides
We present our 3d consecutive flow process 5 concepts what is charts PowerPoint Slides. Use our Business PowerPoint Templates because, Marketing Strategy Business Template:- Maximizing sales of your product is the intended destination. Use our Leadership PowerPoint Templates because, Knowledge is power goes the popular saying. Use our Shapes PowerPoint Templates because, you have it all down to a nicety, slice by slice, layer by layer. Use our Metaphor PowerPoint Templates because, Gears interconnected: - The Gear Train is a basic element of living and daily business. Use our Process and Flows PowerPoint Templates because, But you have the ideas, you have got a brainwave. Use these PowerPoint slides for presentations relating to abstract, arrow, blank, business, chart, circular, circulation, concept, conceptual, consecutive, design, diagram, executive, flow, icon, idea, illustration, management, model, numbers, organization, procedure, process. The prominent colors used in the PowerPoint template are Green, Gray, and Black Our 3d Consecutive Flow Process 5 Concepts What Is Charts PowerPoint Slides are committed to benefit you. They ensure your thoughts get the credit.
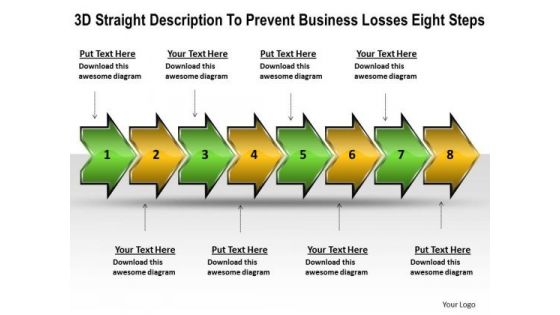
3d Straight Description To Prevent Business Losses Eight Steps Flow Charts PowerPoint Slides
We present our 3d straight description to prevent business losses eight steps flow charts PowerPoint Slides.Use our Arrows PowerPoint Templates because,the gears of youthful minds are useful, therefore set them in motion. Use our Shapes PowerPoint Templates because,This one depicts the popular chart. Use our Signs PowerPoint Templates because,You are aware of some pitfalls ahead where you need to be cautious not to overrun and avoid a stall. Use our Business PowerPoint Templates because, You can see clearly through to the bigger bowl ahead. Time your jump to perfection and hit the nail on the head Use our Process and Flows PowerPoint Templates because,There is a vision, a need you can meet.Use these PowerPoint slides for presentations relating to advance, aiming, arrow, arrowhead, back, balance, communication, connect, connection, descriptive, design, direct, direction, forward, graphic, icon, illustration, information, internet, join, journey, language, left, multimedia, page, pointer, reflect, set, shape, sign, straight, symbol, together, top, transportation, vector. The prominent colors used in the PowerPoint template are Green, Yellow, Black. People tell us our 3d straight description to prevent business losses eight steps flow charts PowerPoint Slides will help them to explain complicated concepts. The feedback we get is that our arrowhead PowerPoint templates and PPT Slides will help you be quick off the draw. Just enter your specific text and see your points hit home. People tell us our 3d straight description to prevent business losses eight steps flow charts PowerPoint Slides are Breathtaking. Presenters tell us our arrowhead PowerPoint templates and PPT Slides are designed by a team of presentation professionals. The feedback we get is that our 3d straight description to prevent business losses eight steps flow charts PowerPoint Slides are Elevated. Professionals tell us our back PowerPoint templates and PPT Slides are Efficacious. Our 3d Straight Description To Prevent Business Losses Eight Steps Flow Charts PowerPoint Slides believe in fair play. They adhere to the ethics of it all.
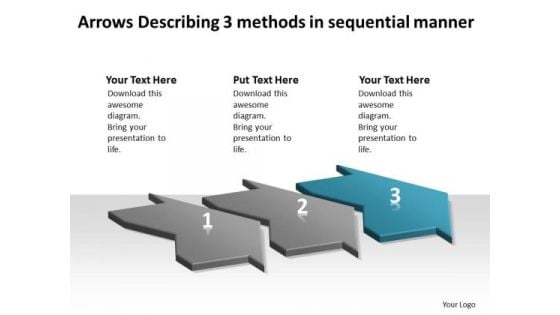
Arrows Describing 3 Methods Sequential Manner Ppt Flow Charts Vision PowerPoint Templates
We present our arrows describing 3 methods sequential manner ppt flow charts vision PowerPoint templates.Download our Marketing PowerPoint Templates because this diagram helps you to explain your strategy to co-ordinate activities of these seperate groups. Download and present our Business PowerPoint Templates because you too have got the framework of your companys growth in place. Download and present our Process and Flows PowerPoint Templates because you can Present your views on the methods using our self-explanatory templates. Use our Shapes PowerPoint Templates because this is Aesthetically designed to make a great first impression this template highlights . Download our Arrows PowerPoint Templates because this outlines the path you have in mind in order to boost sales and stay ahead of the competition enhancing your corporate reputation as you go along the road to success.Use these PowerPoint slides for presentations relating to 3d, Abstract, Around, Arrows, Blue, Border, Business, Center, Circle, Circular, Concept, Connections, Copy, Curve, Cycle, Directions, Distribution, Illustration, Management, Middle, Objects, Pieces, Plan, Pointing, Process, Recycle, Rounded, Shadows, Space, System. The prominent colors used in the PowerPoint template are Blue, Gray, Black. People tell us our arrows describing 3 methods sequential manner ppt flow charts vision PowerPoint templates are Wistful. PowerPoint presentation experts tell us our Around PowerPoint templates and PPT Slides are designed by a team of presentation professionals. Presenters tell us our arrows describing 3 methods sequential manner ppt flow charts vision PowerPoint templates are designed by professionals The feedback we get is that our Center PowerPoint templates and PPT Slides will generate and maintain the level of interest you desire. They will create the impression you want to imprint on your audience. You can be sure our arrows describing 3 methods sequential manner ppt flow charts vision PowerPoint templates are Liberated. Professionals tell us our Circle PowerPoint templates and PPT Slides are Dazzling. Put the audience firmly in your favour. Extract their appreciation with our Arrows Describing 3 Methods Sequential Manner Ppt Flow Charts Vision PowerPoint Templates.
Customer Voice Service Data Flow Charts Ppt PowerPoint Presentation Icon Styles PDF
This slide presents a data flow charts, which includes visual data about the inputs and outputs of entities and processes illustrating the flow of information between client voice services and data verse. it covers procedures including create project, distribute survey, respond to survey and analyse results. Presenting Customer Voice Service Data Flow Charts Ppt PowerPoint Presentation Icon Styles PDF to dispense important information. This template comprises one stages. It also presents valuable insights into the topics including Create Project, Distribute Survey, Analyze Results, Project Information. This is a completely customizable PowerPoint theme that can be put to use immediately. So, download it and address the topic impactfully.
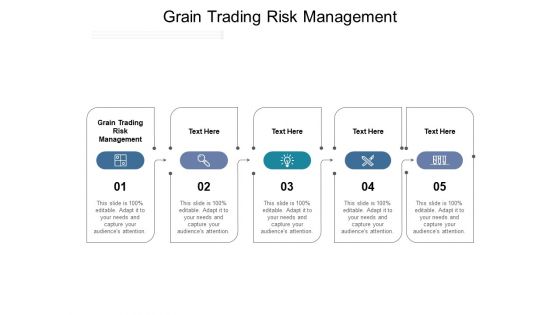
Grain Trading Risk Management Ppt PowerPoint Presentation Diagram Graph Charts Cpb Pdf
Presenting this set of slides with name grain trading risk management ppt powerpoint presentation diagram graph charts cpb pdf. This is an editable Powerpoint five stages graphic that deals with topics like grain trading risk management to help convey your message better graphically. This product is a premium product available for immediate download and is 100 percent editable in Powerpoint. Download this now and use it in your presentations to impress your audience.

Table Of Contents Information Security Ppt PowerPoint Presentation Diagram Graph Charts PDF
Find highly impressive Table Of Contents Information Security Ppt PowerPoint Presentation Diagram Graph Charts PDF on Slidegeeks to deliver a meaningful presentation. You can save an ample amount of time using these presentation templates. No need to worry to prepare everything from scratch because Slidegeeks experts have already done a huge research and work for you. You need to download Table Of Contents Information Security Ppt PowerPoint Presentation Diagram Graph Charts PDF for your upcoming presentation. All the presentation templates are 100 percent editable and you can change the color and personalize the content accordingly. Download now.
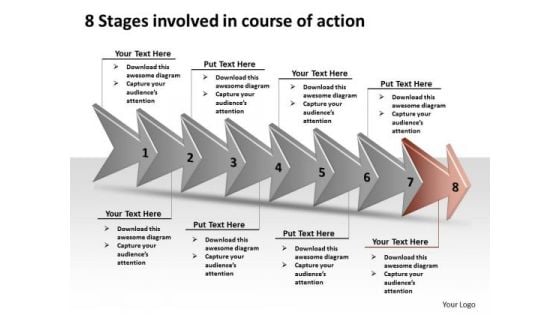
8 Stages Involved Course Of Action Ppt Production Flow Charts PowerPoint Slides
We present our 8 stages involved course of action ppt production flow charts PowerPoint Slides.Download our Leadership PowerPoint Templates because this diagram can be used to illustrate the logical path or system. Download our Shapes PowerPoint Templates because it Educates your team with your thoughts and logic. Present our Signs PowerPoint Templates because some opportunities are bound to be highly profitable for you to follow up. Use our Arrows PowerPoint Templates because we all know that alphabetical order is a time honoured concept. Download our Process and Flows PowerPoint Templates because this slide helps you to give your team an overview of your capability and insight into the minute details of the overall picture highlighting the interdependence at every operational level.Use these PowerPoint slides for presentations relating to Around, Arrows, artistic, bevel, bright, concept, conceptual, decrease, design, direction, down, ecology, high, icon, illustration, increase, indication, isolated, low, motion, movement, nature, opposite, point, protection, recycling, red, reflection, renewable, reuse, set, shinning, sign, stylish, symbol. The prominent colors used in the PowerPoint template are White, Black, Gray. The feedback we get is that our 8 stages involved course of action ppt production flow charts PowerPoint Slides are Youthful. People tell us our decrease PowerPoint templates and PPT Slides are Wistful. We assure you our 8 stages involved course of action ppt production flow charts PowerPoint Slides are Striking. Presenters tell us our design PowerPoint templates and PPT Slides are Gorgeous. We assure you our 8 stages involved course of action ppt production flow charts PowerPoint Slides are Charming. Use our concept PowerPoint templates and PPT Slides are Dynamic. Try our 8 Stages Involved Course Of Action Ppt Production Flow Charts PowerPoint Slides and get bitten by the bug. You will cease to consider anything else.
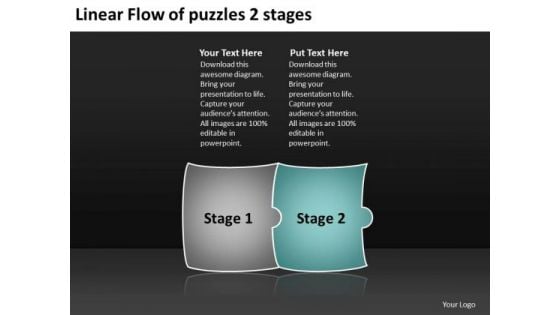
Linear Flow Of Puzzles 2 Stages Ppt Process Charts Examples PowerPoint Templates
We present our linear flow of puzzles 2 stages ppt process charts examples PowerPoint templates.Use our Arrows PowerPoint Templates because, This will helps you to explore the minutest detail of each concept and follow the trail to its conclusion. Use our Marketing PowerPoint Templates because, Customer satisfaction is a mantra of the marketplace. Building a loyal client base is an essential element of your business Use our Puzzles or Jigsaws PowerPoint Templates because,This template helps you to delve on these thoughts and brief your team on the value of your depth of understanding of the subject. Use our Process and Flows PowerPoint Templates because,This shows ideas to get the different elements of your Business to mesh and coalesce into a focused team driven by a common goal to achieve the common aim with Excellence. Use our Business PowerPoint Templates because,Like the famed William Tell, they put aside all emotions and concentrate on the target.Use these PowerPoint slides for presentations relating to Abstract, Arrow, Arrows, Business, Chart, Design, Development, Diagram, Direction, Element, Flow, Flowchart, Graph, Linear, Management, Model, Motion, Organization, Plan, Process, Program, Section, Segment, Set, Sign, Solution, Strategy, Symbol, Technology. The prominent colors used in the PowerPoint template are Green, Gray, White Give the gift of career growth with our Linear Flow Of Puzzles 2 Stages Ppt Process Charts Examples PowerPoint Templates. Dont waste time struggling with PowerPoint. Let us do it for you.
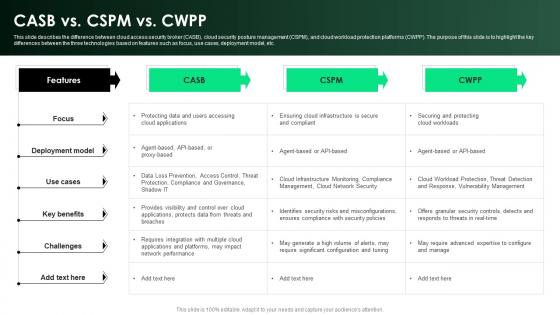
CASB 2 0 IT CASB Vs CSPM Vs CWPP Ppt Diagram Graph Charts
This slide describes the difference between cloud access security broker CASB , cloud security posture management CSPM , and cloud workload protection platforms CWPP . The purpose of this slide is to highlight the key differences between the three technologies based on features such as focus, use cases, deployment model, etc. Are you in need of a template that can accommodate all of your creative concepts This one is crafted professionally and can be altered to fit any style. Use it with Google Slides or PowerPoint. Include striking photographs, symbols, depictions, and other visuals. Fill, move around, or remove text boxes as desired. Test out color palettes and font mixtures. Edit and save your work, or work with colleagues. Download CASB 2 0 IT CASB Vs CSPM Vs CWPP Ppt Diagram Graph Charts and observe how to make your presentation outstanding. Give an impeccable presentation to your group and make your presentation unforgettable. This slide describes the difference between cloud access security broker CASB , cloud security posture management CSPM , and cloud workload protection platforms CWPP . The purpose of this slide is to highlight the key differences between the three technologies based on features such as focus, use cases, deployment model, etc.
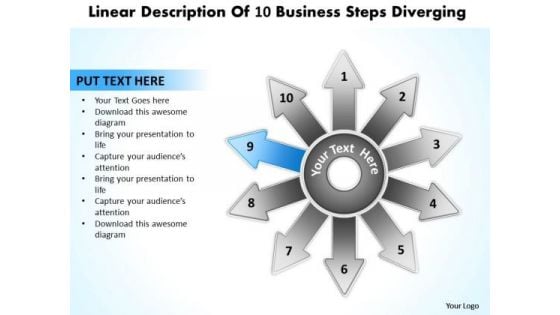
New Business PowerPoint Presentation Steps Diverging Ppt Charts And Diagrams Slides
We present our new business powerpoint presentation steps diverging ppt Charts and Diagrams Slides.Download and present our Communication PowerPoint Templates because the concept and strategy is your strength. Use our Business PowerPoint Templates because it will demonstrate the strength of character under severe stress. Shine the torch ahead and bring the light to shine on all. Present our Arrows PowerPoint Templates because this slide is Designed to help bullet-point your views and thoughts. Present our Symbol PowerPoint Templates because it Creates a winner with your passion and dream. Download and present our Process and Flows PowerPoint Templates because you should Lay down the fundamentals to build upon.Use these PowerPoint slides for presentations relating to Abstract, Arrow, Background, Buttons, Circle, Clean, Communication, Concept, Conceptual, Design, Diagram, Direction, Elements, Exchange, Flow, Flowchart, Graph, Graphic, Icon, Illustration, Internet, Precise, Process, Red, Sign, Symbol, Template. The prominent colors used in the PowerPoint template are Blue, Gray, Black. Use our new business powerpoint presentation steps diverging ppt Charts and Diagrams Slides will make the presenter look like a pro even if they are not computer savvy. We assure you our Conceptual PowerPoint templates and PPT Slides are Luxuriant. People tell us our new business powerpoint presentation steps diverging ppt Charts and Diagrams Slides are readymade to fit into any presentation structure. PowerPoint presentation experts tell us our Background PowerPoint templates and PPT Slides are Pleasant. PowerPoint presentation experts tell us our new business powerpoint presentation steps diverging ppt Charts and Diagrams Slides are Great. Use our Circle PowerPoint templates and PPT Slides are Liberated. Your customer is the center of it all. Our New Business PowerPoint Presentation Steps Diverging Ppt Charts And Diagrams Slides will concentrate on him.
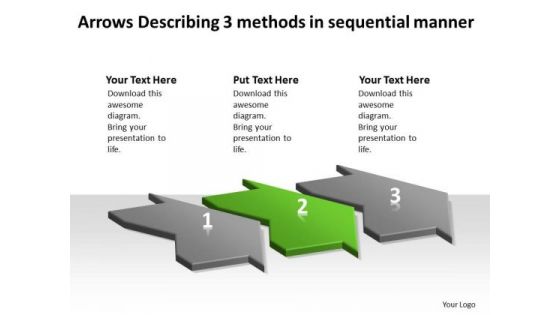
Arrows Describing 3 Methods Sequential Manner Flow Charts Vision PowerPoint Templates
We present our arrows describing 3 methods sequential manner flow charts vision PowerPoint templates.Present our Marketing PowerPoint Templates because they are Designed to attract the attention of your audience. Present our Business PowerPoint Templates because you have selected your team man for man. Download our Process and Flows PowerPoint Templates because you can Highlight the key components of your entire manufacturing/ business process. Use our Shapes PowerPoint Templates because clarity of thought has been the key to your growth. Download and present our Arrows PowerPoint Templates because you have an idea of which you are sure.Use these PowerPoint slides for presentations relating to 3d, Abstract, Around, Arrows, Blue, Border, Business, Center, Circle, Circular, Concept, Connections, Copy, Curve, Cycle, Directions, Distribution, Illustration, Management, Middle, Objects, Pieces, Plan, Pointing, Process, Recycle, Rounded, Shadows, Space, System. The prominent colors used in the PowerPoint template are Green, Gray, Black. People tell us our arrows describing 3 methods sequential manner flow charts vision PowerPoint templates are Wistful. PowerPoint presentation experts tell us our Center PowerPoint templates and PPT Slides are Beautiful. Presenters tell us our arrows describing 3 methods sequential manner flow charts vision PowerPoint templates are Vintage. The feedback we get is that our Arrows PowerPoint templates and PPT Slides are Ultra. You can be sure our arrows describing 3 methods sequential manner flow charts vision PowerPoint templates are One-of-a-kind. Professionals tell us our Circle PowerPoint templates and PPT Slides are Tasteful. Mix your wisdom with our designs with our Arrows Describing 3 Methods Sequential Manner Flow Charts Vision PowerPoint Templates. You will be at the top of your game.
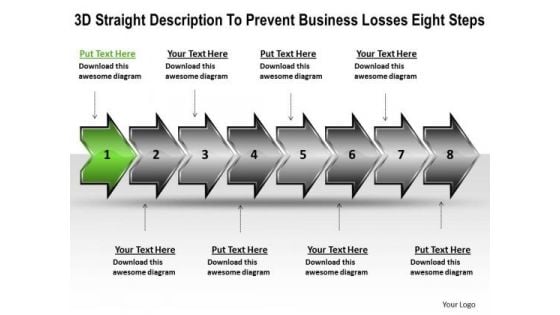
New Business PowerPoint Presentation Losses Eight Steps Create Flow Charts Slides
We present our new business powerpoint presentation losses eight steps create flow charts Slides.Download our Success PowerPoint Templates because the gears of youthful minds are useful, therefore set them in motion. Download and present our Business PowerPoint Templates because you can Lead your flock steadily to greater heights. Look around at the vast potential of achievement around you. Download and present our Shapes PowerPoint Templates because the Venn graphic comprising interlinking circles geometrically demonstate how various functions operating independantly, to a large extent, are essentially interdependant. Present our Process and Flows PowerPoint Templates because others naturally tend to follow in the path blazed by you. Download and present our Arrows PowerPoint Templates because this layout helps you to see satisfaction spread across the room as they unravel your gifted views.Use these PowerPoint slides for presentations relating to 3d, Abstract, Around, Arrows, Business, Center, Circle, Circular, Concept, Connections, Curve, Cycle, Directions, Distribution, Illustration, Management, Middle, Objects, Plan, Process, Recycle, Rounded, Shadows, Space, System. The prominent colors used in the PowerPoint template are Green, Gray, Black. People tell us our new business powerpoint presentation losses eight steps create flow charts Slides are Sparkling. PowerPoint presentation experts tell us our Business PowerPoint templates and PPT Slides are Dynamic. Presenters tell us our new business powerpoint presentation losses eight steps create flow charts Slides will help them to explain complicated concepts. The feedback we get is that our Around PowerPoint templates and PPT Slides are second to none. You can be sure our new business powerpoint presentation losses eight steps create flow charts Slides are Stunning. Professionals tell us our Around PowerPoint templates and PPT Slides are Chic. Let our New Business PowerPoint Presentation Losses Eight Steps Create Flow Charts Slides do your errands. They will bring in the goodies for you.

Risk Due Diligence For M And A Ppt Diagram Graph Charts PDF
The following slide showcases the approach and execution of due diligence for mergers and acquisitions. It depicts M and A strategy, target screening, transaction execution, integration, divestiture and key insights. Showcasing this set of slides titled Risk Due Diligence For M And A Ppt Diagram Graph Charts PDF. The topics addressed in these templates are Approach Risk, Handoff Risk, Execution Risk, Transaction Curve. All the content presented in this PPT design is completely editable. Download it and make adjustments in color, background, font etc. as per your unique business setting.

Use Cases Of Cloud Access Security Broker Ppt PowerPoint Presentation Diagram Graph Charts PDF
Find highly impressive Use Cases Of Cloud Access Security Broker Ppt PowerPoint Presentation Diagram Graph Charts PDF on Slidegeeks to deliver a meaningful presentation. You can save an ample amount of time using these presentation templates. No need to worry to prepare everything from scratch because Slidegeeks experts have already done a huge research and work for you. You need to download Use Cases Of Cloud Access Security Broker Ppt PowerPoint Presentation Diagram Graph Charts PDF for your upcoming presentation. All the presentation templates are 100 percent editable and you can change the color and personalize the content accordingly. Download now.
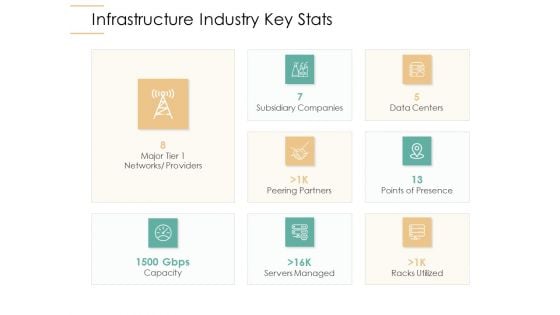
Infrastructure Strategies Infrastructure Industry Key Stats Ppt Diagram Graph Charts PDF
Deliver and pitch your topic in the best possible manner with this infrastructure strategies infrastructure industry key stats ppt diagram graph charts pdf. Use them to share invaluable insights on capacity, servers managed, racks utilized, peering partners, points of presence and impress your audience. This template can be altered and modified as per your expectations. So, grab it now.
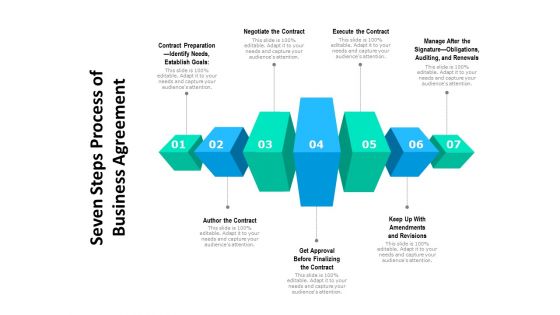
Seven Steps Process Of Business Agreement Ppt PowerPoint Presentation Diagram Graph Charts PDF
Presenting seven steps process of business agreement ppt powerpoint presentation diagram graph charts pdf to dispense important information. This template comprises seven stages. It also presents valuable insights into the topics including contract preparation, identify needs, establish goals, negotiate the contract, execute the contract, manage after the signature, obligations, auditing, and renewals, author the contract, get approval before finalizing the contract, keep up with amendments and revisions. This is a completely customizable PowerPoint theme that can be put to use immediately. So, download it and address the topic impactfully.
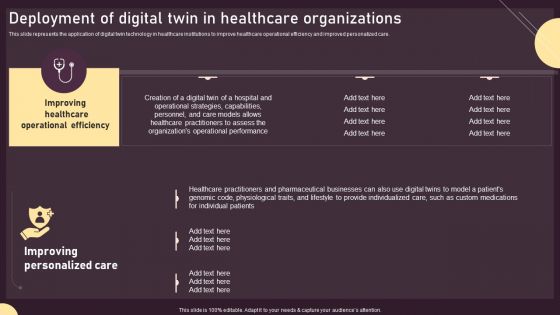
Deployment Of Digital Twin In Healthcare Organizations Ppt PowerPoint Presentation Diagram Graph Charts PDF
This slide represents the application of digital twin technology in healthcare institutions to improve healthcare operational efficiency and improved personalized care. Here you can discover an assortment of the finest PowerPoint and Google Slides templates. With these templates, you can create presentations for a variety of purposes while simultaneously providing your audience with an eye catching visual experience. Download Deployment Of Digital Twin In Healthcare Organizations Ppt PowerPoint Presentation Diagram Graph Charts PDF to deliver an impeccable presentation. These templates will make your job of preparing presentations much quicker, yet still, maintain a high level of quality. Slidegeeks has experienced researchers who prepare these templates and write high quality content for you. Later on, you can personalize the content by editing the Deployment Of Digital Twin In Healthcare Organizations Ppt PowerPoint Presentation Diagram Graph Charts PDF.

Agenda SDN Security Architecture Ppt PowerPoint Presentation Diagram Graph Charts PDF
Do you have an important presentation coming up Are you looking for something that will make your presentation stand out from the rest Look no further than Agenda SDN Security Architecture Ppt PowerPoint Presentation Diagram Graph Charts PDF. With our professional designs, you can trust that your presentation will pop and make delivering it a smooth process. And with Slidegeeks, you can trust that your presentation will be unique and memorable. So why wait Grab Agenda SDN Security Architecture Ppt PowerPoint Presentation Diagram Graph Charts PDF today and make your presentation stand out from the rest
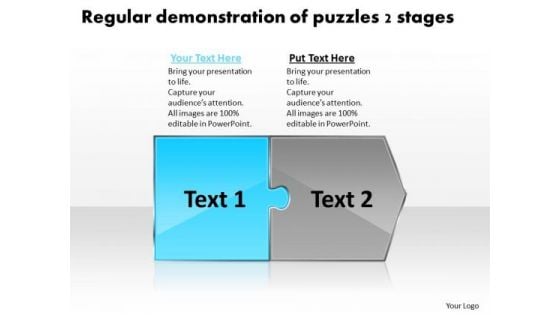
Regular Demonstration Of Puzzles 2 Stages Flow Process Charts PowerPoint Slides
We present our regular demonstration of puzzles 2 stages flow process charts PowerPoint Slides.Use our Business PowerPoint Templates because,Profit levels have been steady over the recent past. Spread your heightened excitement to others in the room Use our Puzzles or Jigsaws PowerPoint Templates because, You have the ideas and plans on how to achieve success Use our Leadership PowerPoint Templates because, It helps your team to align their arrows to consistently be accurate. Use our Shapes PowerPoint Templates because, As a result we often end up with errors. Use our Design PowerPoint Templates because, You can Transmit your passion via our creative templates.Use these PowerPoint slides for presentations relating to algorithm, arrow, arrows, block, business, chart, connection, design, development, diagram, direction, element, flow, flowchart, graph, kind, linear, management, of, organization, process, program, section, segment, set, sign, solution, strategy, symbol. The prominent colors used in the PowerPoint template are Green, Gray, Black Arrive at base camp with our Regular Demonstration Of Puzzles 2 Stages Flow Process Charts PowerPoint Slides. Your thoughts will then begin the ascent.
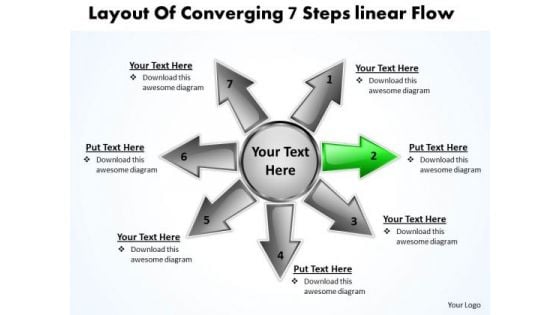
Layout Of Converging 7 Steps Linear Flow Charts And Diagrams PowerPoint Templates
We present our layout of converging 7 steps linear flow Charts and Diagrams PowerPoint templates.Download and present our Advertising PowerPoint Templates because the colour coding of our templates are specifically designed to highlight you points. Present our Arrows PowerPoint Templates because this helps you to put all your brilliant views to your audience. Use our Process and Flows PowerPoint Templates because this unique template give you an enthusiastic response and a purposeful Aye- Aye Sir. Present our Marketing PowerPoint Templates because networking is an imperative in todays world. You need to access the views of others. Similarly you need to give access to them of your abilities. Download our Shapes PowerPoint Templates because you can Enlighten them with your brilliant understanding of mental health.Use these PowerPoint slides for presentations relating to Advertising, Arrow, Background, Banner, Blue, Bookmark, Card, Choice, Concept, Creative, Design, Direction, Flow, Four, Illustration, Instruction, Label, Layout, Manual, Marketing, Modern, Next, Number, Offer, One, Options, Order, Page, Paper, Pointer, Process, Product, Promotion, Sequence, Simple, Special, Step, Symbol. The prominent colors used in the PowerPoint template are Green, Gray, Black. Use our layout of converging 7 steps linear flow Charts and Diagrams PowerPoint templates are Romantic. We assure you our Banner PowerPoint templates and PPT Slides will get their audience's attention. People tell us our layout of converging 7 steps linear flow Charts and Diagrams PowerPoint templates are Spectacular. PowerPoint presentation experts tell us our Concept PowerPoint templates and PPT Slides effectively help you save your valuable time. PowerPoint presentation experts tell us our layout of converging 7 steps linear flow Charts and Diagrams PowerPoint templates are Graceful. Use our Choice PowerPoint templates and PPT Slides are One-of-a-kind. Grab this opportunity to present with our Layout Of Converging 7 Steps Linear Flow Charts And Diagrams PowerPoint Templates. Try us out and see what a difference our templates make.
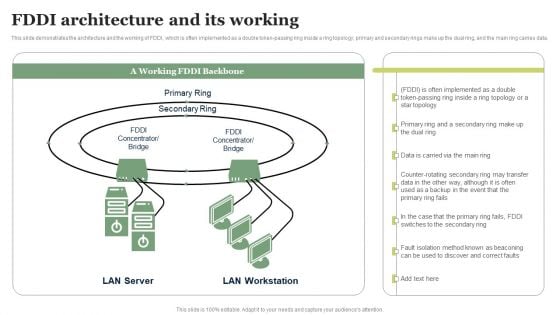
FDDI Architecture And Its Working Ppt PowerPoint Presentation Diagram Graph Charts PDF
This slide demonstrates the architecture and the working of FDDI, which is often implemented as a double token-passing ring inside a ring topology primary and secondary rings make up the dual ring, and the main ring carries data. Here you can discover an assortment of the finest PowerPoint and Google Slides templates. With these templates, you can create presentations for a variety of purposes while simultaneously providing your audience with an eye catching visual experience. Download FDDI Architecture And Its Working Ppt PowerPoint Presentation Diagram Graph Charts PDF to deliver an impeccable presentation. These templates will make your job of preparing presentations much quicker, yet still, maintain a high level of quality. Slidegeeks has experienced researchers who prepare these templates and write high quality content for you. Later on, you can personalize the content by editing the FDDI Architecture And Its Working Ppt PowerPoint Presentation Diagram Graph Charts PDF.
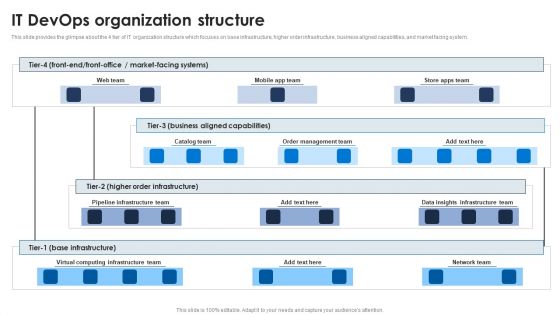
It Devops Organization Structure Ppt PowerPoint Presentation Diagram Graph Charts PDF
This slide provides the glimpse about the 4 tier of IT organization structure which focuses on base infrastructure, higher order infrastructure, business aligned capabilities, and market facing system. Do you have an important presentation coming up Are you looking for something that will make your presentation stand out from the rest Look no further than It Devops Organization Structure Ppt PowerPoint Presentation Diagram Graph Charts PDF. With our professional designs, you can trust that your presentation will pop and make delivering it a smooth process. And with Slidegeeks, you can trust that your presentation will be unique and memorable. So why wait Grab It Devops Organization Structure Ppt PowerPoint Presentation Diagram Graph Charts PDF today and make your presentation stand out from the rest.
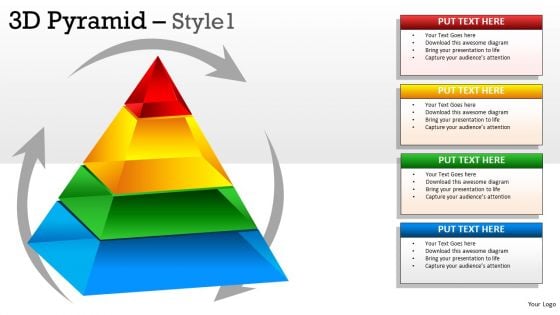
Ppt Charts 3d Pyramid 1 PowerPoint Slides And Ppt Diagrams Templates
PPT Charts 3D Pyramid 1 PowerPoint Slides And PPT Diagrams TemplatesThese high quality powerpoint pre-designed slides and powerpoint templates have been carefully created by our professional team to help you impress your audience. All slides have been created and are 100% editable in powerpoint. Each and every property of any graphic - color, size, orientation, shading, outline etc. can be modified to help you build an effective powerpoint presentation. Any text can be entered at any point in the powerpoint template or slide. Simply DOWNLOAD, TYPE and PRESENT! See your audience react before your very eyes. Our Ppt Charts 3d Pyramid 1 PowerPoint Slides And Ppt Diagrams Templates extract positive delight.
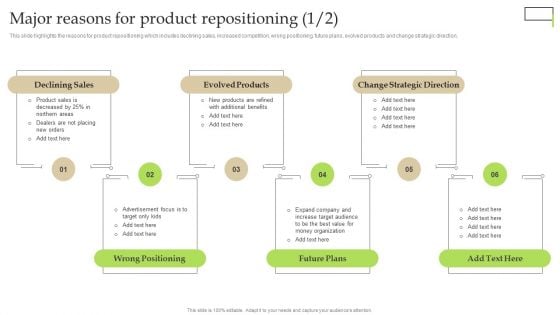
Major Reasons For Product Repositioning Ppt PowerPoint Presentation Diagram Graph Charts PDF
This slide highlights the reasons for product repositioning which includes declining sales, increased competition, wrong positioning, future plans, evolved products and change strategic direction. Do you have to make sure that everyone on your team knows about any specific topic I yes, then you should give Major Reasons For Product Repositioning Ppt PowerPoint Presentation Diagram Graph Charts PDF a try. Our experts have put a lot of knowledge and effort into creating this impeccable Major Reasons For Product Repositioning Ppt PowerPoint Presentation Diagram Graph Charts PDF. You can use this template for your upcoming presentations, as the slides are perfect to represent even the tiniest detail. You can download these templates from the Slidegeeks website and these are easy to edit. So grab these today

Key Texting And SMS Marketing Statistics Ppt PowerPoint Presentation Diagram Graph Charts PDF
This slide represents the statistical data to help marketers analyze the benefits and importance of SMS marketing for business growth and development. It includes key SMS marketing statistics such as click through rates, opt-ins etc. Get a simple yet stunning designed Key Texting And SMS Marketing Statistics Ppt PowerPoint Presentation Diagram Graph Charts PDF. It is the best one to establish the tone in your meetings. It is an excellent way to make your presentations highly effective. So, download this PPT today from Slidegeeks and see the positive impacts. Our easy to edit Key Texting And SMS Marketing Statistics Ppt PowerPoint Presentation Diagram Graph Charts PDF can be your go to option for all upcoming conferences and meetings. So, what are you waiting for Grab this template today.
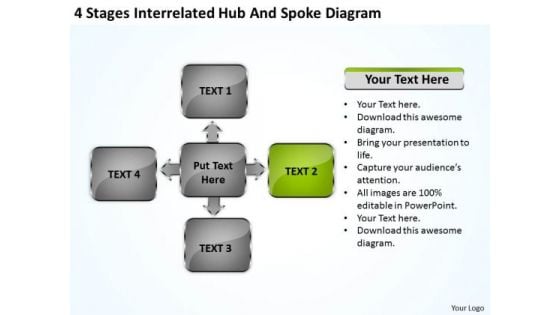
Business Flow Charts Examples Spoke Diagram Ppt PowerPoint Templates Backgrounds For Slides
We present our business flow charts examples spoke diagram ppt PowerPoint templates backgrounds for slides.Download our Technology PowerPoint Templates because Our PowerPoint Templates and Slides will give good value for money. They also have respect for the value of your time. Download and present our Process and Flows PowerPoint Templates because Your audience will believe you are the cats whiskers. Download and present our Boxes PowerPoint Templates because Our PowerPoint Templates and Slides are created with admirable insight. Use them and give your group a sense of your logical mind. Use our Business PowerPoint Templates because our PowerPoint Templates and Slides are the string of your bow. Fire of your ideas and conquer the podium. Present our Arrows PowerPoint Templates because Timeline crunches are a fact of life. Meet all deadlines using our PowerPoint Templates and Slides.Use these PowerPoint slides for presentations relating to 3d, Abstract, Algorithm, Arrow, Background, Blank, Block, Box, Business, Chain, Chart, Circle, Colorful, Concept, Connect, Connection, Corporate, Design, Diagram, Empty, Flow, Flowchart, Graph, Graphic, Hierarchy, Illustration, Information, Isolated, Management, Network, Organization, Organization, Organize, Plan, Procedure, Process, Program, Scalable, Shape, Sign, Solution, Structure, Symbol, Teamwork, Technology. The prominent colors used in the PowerPoint template are Green, Gray, Black. Imagine your audience applauding with our Business Flow Charts Examples Spoke Diagram Ppt PowerPoint Templates Backgrounds For Slides. Make sure your presentation gets the attention it deserves.
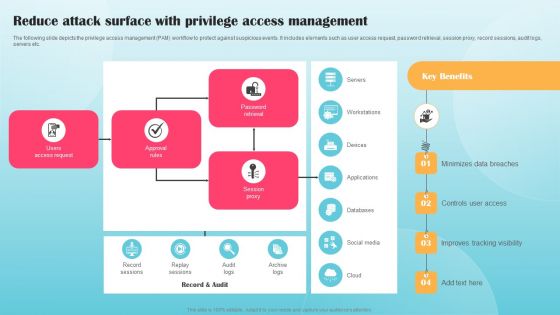
Reduce Attack Surface With Privilege Access Management Ppt PowerPoint Presentation Diagram Graph Charts PDF
The following slide depicts the privilege access management PAM workflow to protect against suspicious events. It includes elements such as user access request, password retrieval, session proxy, record sessions, audit logs, servers etc. Want to ace your presentation in front of a live audience Our Reduce Attack Surface With Privilege Access Management Ppt PowerPoint Presentation Diagram Graph Charts PDF can help you do that by engaging all the users towards you. Slidegeeks experts have put their efforts and expertise into creating these impeccable powerpoint presentations so that you can communicate your ideas clearly. Moreover, all the templates are customizable, and easy to edit and downloadable. Use these for both personal and commercial use.
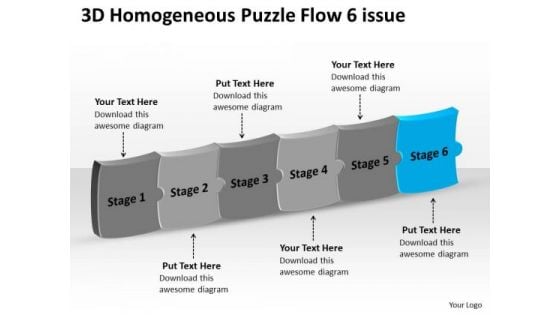
3d Homogeneous Puzzle Flow 6 Issue How To Make Charts PowerPoint Templates
We present our 3d homogeneous puzzle flow 6 issues how to make charts PowerPoint templates. Use our Business PowerPoint Templates because, Vision Ave Future St Template: - There was a vision of a desired destination and the best road to take to reach that goal. Use our Puzzles or Jigsaws PowerPoint Templates because, and keep you group steady in the top bracket. Use our Shapes PowerPoint Templates because, this one depicts the popular chart. Use our Communication PowerPoint Templates because; Break it all down to Key Result Areas. Use our Process and Flows PowerPoint Templates because, Our Template designs are State of the Art. Use these PowerPoint slides for presentations relating to abstract, action, attach, box, business, center, chain, chart, color, communication, concept, connection, cube, cycle, data, diagram, flow, globe, horizontal, idea, illustration, individual, information, interaction, jigsaw, join pieces, process puzzle, relationship, shape, success. The prominent colors used in the PowerPoint template are Blue, Gray, and Black Our 3d Homogeneous Puzzle Flow 6 Issue How To Make Charts PowerPoint Templates are clearly eye catching. One look and you will not want to even blink.
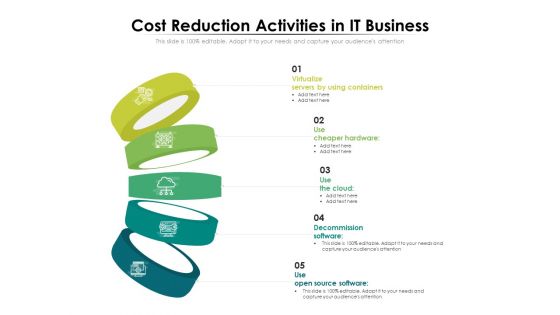
Cost Reduction Activities In IT Business Ppt PowerPoint Presentation Diagram Graph Charts PDF
Presenting this set of slides with name cost reduction activities in it business ppt powerpoint presentation diagram graph charts pdf. This is a five stage process. The stages in this process are virtualize servers by using containers, use cheaper hardware, use the cloud decommission software, use open source software. This is a completely editable PowerPoint presentation and is available for immediate download. Download now and impress your audience.
Business Flow Charts 3d Men Working On Laptop Sitting Pie PowerPoint Slides
We present our business flow charts 3d men working on laptop sitting pie PowerPoint Slides.Present our Technology PowerPoint Templates because It will mark the footprints of your journey. Illustrate how they will lead you to your desired destination. Download and present our Business PowerPoint Templates because You can Score a slam dunk with our PowerPoint Templates and Slides. Watch your audience hang onto your every word. Present our Puzzles or Jigsaws PowerPoint Templates because Our PowerPoint Templates and Slides team portray an attitude of elegance. Personify this quality by using them regularly. Download our Communication PowerPoint Templates because you can Break through with our PowerPoint Templates and Slides. Bring down the mental barriers of your audience. Download and present our Shapes PowerPoint Templates because Your success is our commitment. Our PowerPoint Templates and Slides will ensure you reach your goal.Use these PowerPoint slides for presentations relating to 3d, Blank, Business, Character, Communication, Computer, Connection, Education, Email, Empty, Global Communications, Guy, Human, Icon, Idea, Internet, Jigsaw, Laptop, Men, Mobility, People, Person, Piece, Planning, Pointing, Presentation, Public Speaker, Puppet, Puzzle, Screen, Seminar, Showing, Standing, Supported, Teaching, Technology, Tie, Web Page, White, Wireless Technology. The prominent colors used in the PowerPoint template are Blue, Red, White. The feedback we get is that our business flow charts 3d men working on laptop sitting pie PowerPoint Slides are designed to make your presentations professional. Customers tell us our Connection PowerPoint templates and PPT Slides provide great value for your money. Be assured of finding the best projection to highlight your words. The feedback we get is that our business flow charts 3d men working on laptop sitting pie PowerPoint Slides provide you with a vast range of viable options. Select the appropriate ones and just fill in your text. Professionals tell us our Character PowerPoint templates and PPT Slides will make you look like a winner. Presenters tell us our business flow charts 3d men working on laptop sitting pie PowerPoint Slides are designed by professionals You can be sure our Character PowerPoint templates and PPT Slides will impress their bosses and teams. Our Business Flow Charts 3d Men Working On Laptop Sitting Pie PowerPoint Slides team are an enduring lot. The further the distance, the better they become.
PowerPoint Template Horizontal Flow Course Charts Theme Of 5 Stage Diagram Image
We present our PowerPoint template horizontal flow course charts theme of 5 stage diagram Image. Use our Arrows PowerPoint Templates because, getting it done in time is the key to success. Use our Leadership PowerPoint Templates because; Employ the right colors for your brilliant ideas. Use our Process and flows PowerPoint Templates because, Targets: - You have a handle on all the targets, a master of the game, the experienced and consummate juggler. Use our Symbol PowerPoint Templates because, Brainstorming Light Bulbs: - The atmosphere in the workplace is electric. Use our Business PowerPoint Templates because, Marketing Strategy Business Template: - Maximizing sales of your product is the intended destination. Use these PowerPoint slides for presentations relating to Abstract, Arrow, Blank, Business, Chart, Circular, Circulation, Concept, Conceptual, Design, Diagram, Executive, Icon, Idea, Illustration, Linear, Management, Model, Numbers, Organization, Procedure, Process, Progression, Resource, Sequence, Sequential, Stages, Steps, Strategy. The prominent colors used in the PowerPoint template are Green, Gray, and White Your ideas will never go out of fashion. Our PowerPoint Template Horizontal Flow Course Charts Theme Of 5 Stage Diagram Image will keep them contemporary.
Ppt Template Horizontal Flow Route Charts Of 6 Stage Diagram PowerPoint Free 1 Image
We present our PPT template horizontal flow route charts of 6 stage diagram PowerPoint free 1 Image. Use our Leadership PowerPoint Templates because, There are different paths to gain the necessary knowledge to achieve it. Use our Business PowerPoint Templates because, Corporate Ladder:- The graphic is a symbol of growth and success. Use our Process and Flows PowerPoint Templates because, designed to attract the attention of your audience. Use our Arrows PowerPoint Templates because, are the triggers of our growth. Use our Symbol PowerPoint Templates because; Use them to help you organize the logic of your views. Use these PowerPoint slides for presentations relating to Abstract, Arrow, Blank, Business, Chart, Circular, Circulation, Concept, Conceptual, Design, Diagram, Executive, Icon, Idea, Illustration, Linear, Stages, Management, Model, Numbers, Organization, Procedure, Process, Progression, Resource, Sequence, Sequential, Stages, Steps, Strategy. The prominent colors used in the PowerPoint template are Yellow, Red, and Green Acquire the fame you deserve. Our Ppt Template Horizontal Flow Route Charts Of 6 Stage Diagram PowerPoint Free 1 Image will aid you to achieve acclaim.
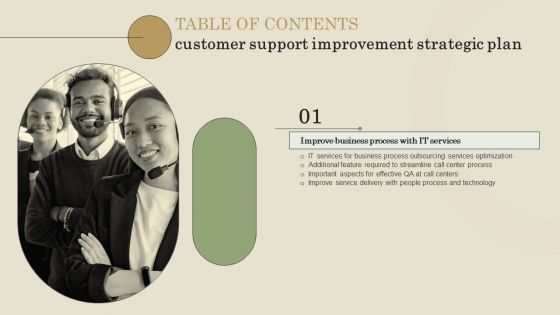
Customer Support Improvement Strategic Plan Table Of Contents Ppt PowerPoint Presentation Diagram Graph Charts PDF
From laying roadmaps to briefing everything in detail, our templates are perfect for you. You can set the stage with your presentation slides. All you have to do is download these easy to edit and customizable templates. Customer Support Improvement Strategic Plan Table Of Contents Ppt PowerPoint Presentation Diagram Graph Charts PDF will help you deliver an outstanding performance that everyone would remember and praise you for. Do download this presentation today.
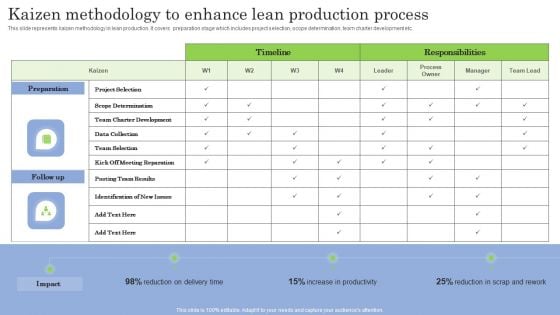
Kaizen Methodology To Enhance Lean Production Process Ppt PowerPoint Presentation Diagram Graph Charts PDF
This slide represents kaizen methodology in lean production. It covers preparation stage which includes project selection, scope determination, team charter development etc. Crafting an eye catching presentation has never been more straightforward. Let your presentation shine with this tasteful yet straightforward Kaizen Methodology To Enhance Lean Production Process Ppt PowerPoint Presentation Diagram Graph Charts PDF template. It offers a minimalistic and classy look that is great for making a statement. The colors have been employed intelligently to add a bit of playfulness while still remaining professional. Construct the ideal Kaizen Methodology To Enhance Lean Production Process Ppt PowerPoint Presentation Diagram Graph Charts PDF that effortlessly grabs the attention of your audience. Begin now and be certain to wow your customers.
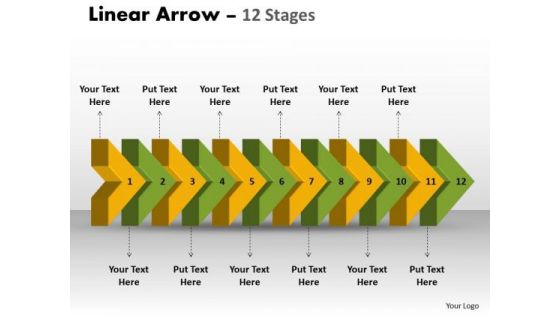
Ppt Template 3d Illustration Of Straightaway Arrow Flow Process Charts Diagram 1 Graphic
We present our PPT template 3d illustration of straightaway arrow flow process charts diagram 1 Graphic. Use our Arrows PowerPoint Templates because, designed to attract the attention of your audience. Use our Symbol PowerPoint Templates because, Shine the light on these thoughts and motivate your team to improve the quality of celebration for all around you. Use our Shapes PowerPoint Templates because, However there is a key aspect to be emphasized. Use our Business PowerPoint Templates because; explain your strategy to co-ordinate activities of these separate groups. Use our Signs PowerPoint Templates because, however you are aware of some pitfalls ahead where you need to be cautious not to overran and avoid a stall. Use these PowerPoint slides for presentations relating to 3d, Arrow, Background, Banner, Business, Chart, Colorful, Diagram, Direction, Element, Financial, Flow, Gradient, Illustration, Isolated, Mirrored, Placeholder, Presentation, Process, Steps. The prominent colors used in the PowerPoint template are Yellow, Green, and Black Create a better workplace with our Ppt Template 3d Illustration Of Straightaway Arrow Flow Process Charts Diagram 1 Graphic. Dont pass up this opportunity to shine.
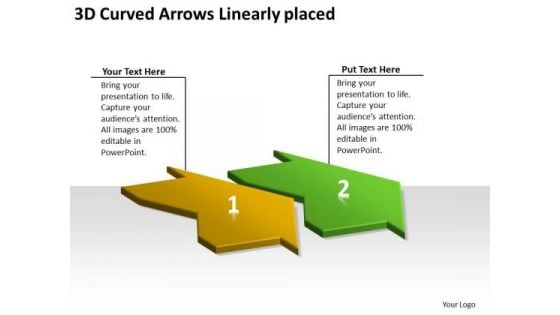
3d Curved Arrows Linearly Placed What Is Flow Charts PowerPoint Templates
We present our 3d curved arrows linearly placed what is flow charts PowerPoint templates.Use our Arrows PowerPoint Templates because, Profit is fairly earned in what you believe. Use our Shapes PowerPoint Templates because,There are a bunch of ideas brewing in your head which give you the heady taste of success. Use our Signs PowerPoint Templates because,With the help of our Slides you can Illustrate your plans on using the many social media modes available to inform soceity at large of the benefits of your product. Use our Business PowerPoint Templates because, You can Lead your flock steadily to greater heights. Look around at the vast potential of achievement around you Use our Process and Flows PowerPoint Templates because,Your listeners do not have to put on their thinking caps.Use these PowerPoint slides for presentations relating to arrow, automobile, city, curve, destination, direction, freeway, grunge, heading, highway, journey, land, landscape, line, linear, marks, motion, multiple, network, paint, path, perspective, pointing, road, sign, speed, street, strip, symbol, track, traffic, transport, transportation, travel, way. The prominent colors used in the PowerPoint template are Yellow, Green, White. People tell us our 3d curved arrows linearly placed what is flow charts PowerPoint templates are Gorgeous. The feedback we get is that our direction PowerPoint templates and PPT Slides are Great. People tell us our 3d curved arrows linearly placed what is flow charts PowerPoint templates are Radiant. Presenters tell us our freeway PowerPoint templates and PPT Slides are Pretty. The feedback we get is that our 3d curved arrows linearly placed what is flow charts PowerPoint templates will save the presenter time. Professionals tell us our city PowerPoint templates and PPT Slides are Great. Bounce your ideas off our 3d Curved Arrows Linearly Placed What Is Flow Charts PowerPoint Templates. They will echo your thoughts all the way.

Strategies And Tactics For Effective Growth Of Business Ppt PowerPoint Presentation Diagram Graph Charts PDF
Persuade your audience using this strategies and tactics for effective growth of business ppt powerpoint presentation diagram graph charts pdf. This PPT design covers three stages, thus making it a great tool to use. It also caters to a variety of topics including strategies and tactics for effective growth of business. Download this PPT design now to present a convincing pitch that not only emphasizes the topic but also showcases your presentation skills.
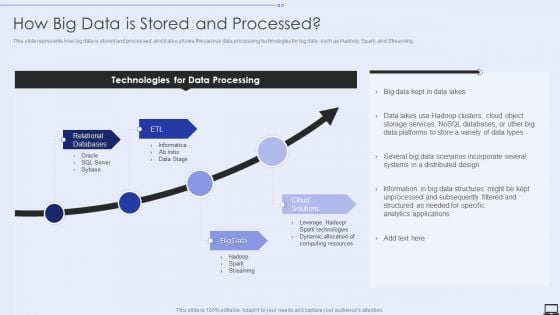
How Big Data Is Stored And Processe Ppt PowerPoint Presentation Diagram Graph Charts PDF
Presenting How Big Data Is Stored And Processe Ppt PowerPoint Presentation Diagram Graph Charts PDF to provide visual cues and insights. Share and navigate important information on four stages that need your due attention. This template can be used to pitch topics like Relational Databases, Big Data, Cloud Solutions. In addtion, this PPT design contains high resolution images, graphics, etc, that are easily editable and available for immediate download.
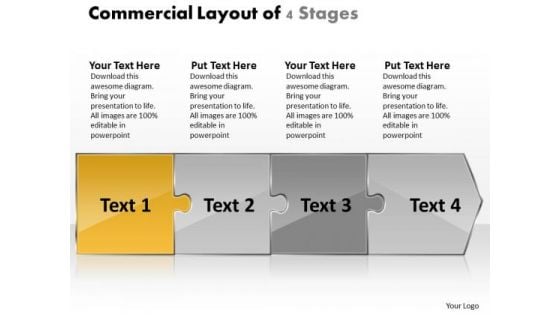
Commercial Layout Of 4 Stages Flow Charts In Office PowerPoint Slides
We present our commercial layout of 4 stages flow charts in office PowerPoint Slides.Use our Success PowerPoint Templates because,You have come up with a brilliant breakthrough idea. You can also visualise the interest it will generate. Use our Puzzles or Jigsaws PowerPoint Templates because, Activities which in themselves have many inherent business oppurtunities. Use our Arrows PowerPoint Templates because,Using our templates for your colleagues will impart knowledge tofeed. Use our Business PowerPoint Templates because, Infrastructure growth is an obvious requirement of today.Inform your group on how exactly this potential is tailor made for you Use our Metaphors-Visual Concepts PowerPoint Templates because,This diagram provides trainers a tool to teach the procedure in a highly visual, engaging way.Use these PowerPoint slides for presentations relating to Areows, Business, Assembly, complete, concept, copy, finish, finished, fit, idea, interlock, jigsaw, match, metaphor, mystery, outline, patience, picture, piece, play, playing, point, pointing, problem, puzzle, quiz, skill, solution, solved, space, struggle, success, support, teamwork. The prominent colors used in the PowerPoint template are Yellow, Gray, White Our Commercial Layout Of 4 Stages Flow Charts In Office PowerPoint Slides amplify your erudition. You will be earmarked for your brilliance.
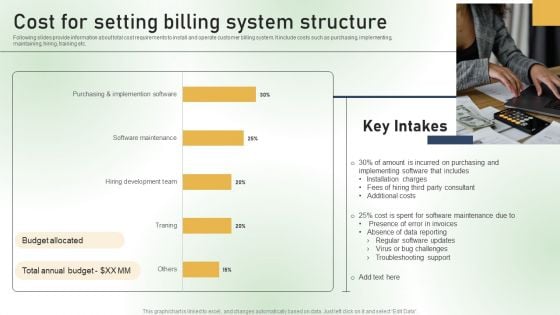
Cost For Setting Billing System Structure Ppt PowerPoint Presentation Diagram Graph Charts PDF
Following slides provide information about total cost requirements to install and operate customer billing system. It include costs such as purchasing, implementing, maintaining, hiring, training etc. Crafting an eye catching presentation has never been more straightforward. Let your presentation shine with this tasteful yet straightforward Cost For Setting Billing System Structure Ppt PowerPoint Presentation Diagram Graph Charts PDF template. It offers a minimalistic and classy look that is great for making a statement. The colors have been employed intelligently to add a bit of playfulness while still remaining professional. Construct the ideal Cost For Setting Billing System Structure Ppt PowerPoint Presentation Diagram Graph Charts PDF that effortlessly grabs the attention of your audience. Begin now and be certain to wow your customers.

Business Charts Examples 3d Men Working Laptops Technology Meeting PowerPoint Templates
We present our business charts examples 3d men working laptops technology meeting PowerPoint templates.Download and present our Communication PowerPoint Templates because Our PowerPoint Templates and Slides have the Brilliant backdrops. Guaranteed to illuminate the minds of your audience. Download and present our Business PowerPoint Templates because Your success is our commitment. Our PowerPoint Templates and Slides will ensure you reach your goal. Present our People PowerPoint Templates because It will get your audience in sync. Download and present our Computer PowerPoint Templates because you can Break through with our PowerPoint Templates and Slides. Bring down the mental barriers of your audience. Download our Shapes PowerPoint Templates because Our PowerPoint Templates and Slides will let you Hit the right notes. Watch your audience start singing to your tune.Use these PowerPoint slides for presentations relating to 3d, Background, Business, Circle, Color, Communication, Computer, Concept, Connection, Design, Digital, Download, Education, Global, Globe, Group, Human, Ideas, Illustration, Internet, Isolated, Keyboard, Laptop, Learning, Line, Man, Mobile, Modern, Network, Notebook, Object, Office, Online, People, Person, Planet, Screen, Shape, Sphere, Study, Teaching, Technology, Three-Dimensional, University, Web, White, Work, World, Worldwide, Www. The prominent colors used in the PowerPoint template are Blue, Gray, Orange. The feedback we get is that our business charts examples 3d men working laptops technology meeting PowerPoint templates will make you look like a winner. Customers tell us our Communication PowerPoint templates and PPT Slides provide you with a vast range of viable options. Select the appropriate ones and just fill in your text. The feedback we get is that our business charts examples 3d men working laptops technology meeting PowerPoint templates effectively help you save your valuable time. Professionals tell us our Business PowerPoint templates and PPT Slides will generate and maintain the level of interest you desire. They will create the impression you want to imprint on your audience. Presenters tell us our business charts examples 3d men working laptops technology meeting PowerPoint templates help you meet deadlines which are an element of today's workplace. Just browse and pick the slides that appeal to your intuitive senses. You can be sure our Color PowerPoint templates and PPT Slides have awesome images to get your point across. Put your ideas out to flower. Our Business Charts Examples 3d Men Working Laptops Technology Meeting PowerPoint Templates will get them to bloom.
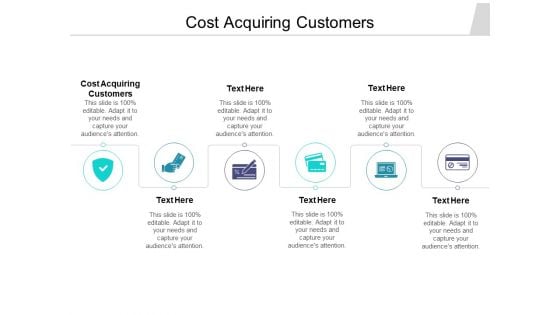
Cost Acquiring Customers Ppt PowerPoint Presentation Diagram Graph Charts Cpb Pdf
Presenting this set of slides with name cost acquiring customers ppt powerpoint presentation diagram graph charts cpb pdf. This is an editable Powerpoint six stages graphic that deals with topics like cost acquiring customers to help convey your message better graphically. This product is a premium product available for immediate download and is 100 percent editable in Powerpoint. Download this now and use it in your presentations to impress your audience.
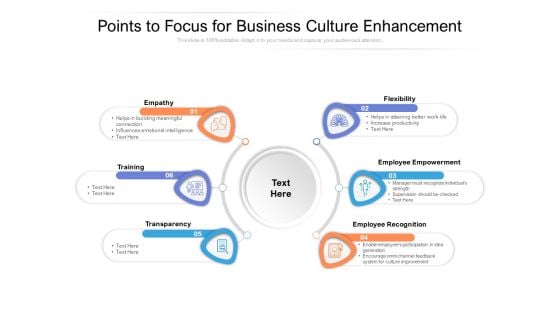
Points To Focus For Business Culture Enhancement Ppt PowerPoint Presentation Diagram Graph Charts PDF
Persuade your audience using this points to focus for business culture enhancement ppt powerpoint presentation diagram graph charts pdf. This PPT design covers six stages, thus making it a great tool to use. It also caters to a variety of topics including empathy, training, transparency, flexibility, employee empowerment, employee recognition. Download this PPT design now to present a convincing pitch that not only emphasizes the topic but also showcases your presentation skills.
Marketing Funnel Icon With Dollar Symbol Ppt PowerPoint Presentation Diagram Graph Charts PDF
Presenting this set of slides with name marketing funnel icon with dollar symbol ppt powerpoint presentation diagram graph charts pdf. This is a three stage process. The stages in this process are marketing funnel icon with dollar symbol. This is a completely editable PowerPoint presentation and is available for immediate download. Download now and impress your audience.


 Continue with Email

 Home
Home


