Control Chart
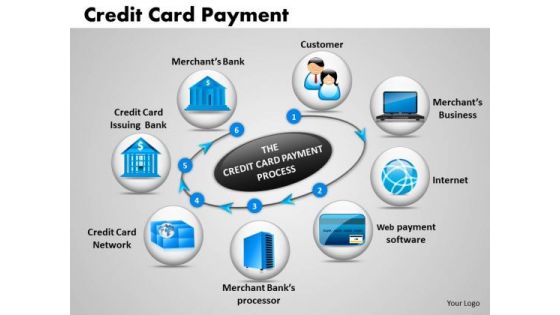
Business Circle Charts PowerPoint Templates Business Credit Card Payment Ppt Slides
Business Circle Charts PowerPoint Templates Business Credit Card Payment PPT Slides-This PowerPoint diagram shows Circles representing related points in an idea. You can also use it as credit card payment slide-Business Circle Charts PowerPoint Templates Business Credit Card Payment PPT Slides-This template can be used for presentations relating to Account, Bank, Business, Buy, Buying, Cards, Cash, Chips, Close-Up, Commerce, Credit, Credits, Date, Ecommerce, Expiration, Expire, Expired, Finance, Financial, Gold, Limit, Macro, Master, Money, Now, Online, Order, Paid, Pay, Paying, Payment Be a proactive manager with our Business Circle Charts PowerPoint Templates Business Credit Card Payment Ppt Slides. They will make you look good.
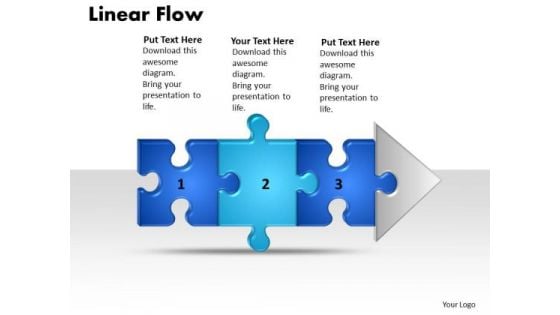
Ppt Linear Flow Process Charts 3 Power Point Stage Style1 PowerPoint Templates
PPT linear flow process charts 3 power point stage style1 PowerPoint Templates-You can show various processes with these linear designed puzzle pieces. The separate pieces are in linear order. Arrow in the end can declare a process as concluded.-PPT linear flow process charts 3 power point stage style1 PowerPoint Templates-Amusement, Arrow, Board, Cardboard, Children, Deficient, Direction, Diversion, Entertainment, Game, Illustration, Image, Jigsaw, Logo, Lots, Many, Paper, Perspective, Pieces, Play, Puzzle, Vector Create a better future with your thoughts. Move comfidently onwards with our Ppt Linear Flow Process Charts 3 Power Point Stage Style1 PowerPoint Templates.
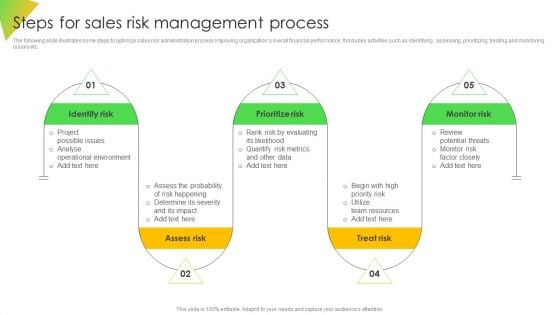
Steps For Sales Risk Management Process Ppt Diagram Graph Charts PDF
The following slide illustrates some steps to optimize sales risk administration process improving organizations overall financial performance. It includes activities such as identifying , assessing, prioritizing, treating and monitoring issues etc. The Steps For Sales Risk Management Process Ppt Diagram Graph Charts PDF is a compilation of the most recent design trends as a series of slides. It is suitable for any subject or industry presentation, containing attractive visuals and photo spots for businesses to clearly express their messages. This template contains a variety of slides for the user to input data, such as structures to contrast two elements, bullet points, and slides for written information. Slidegeeks is prepared to create an impression.
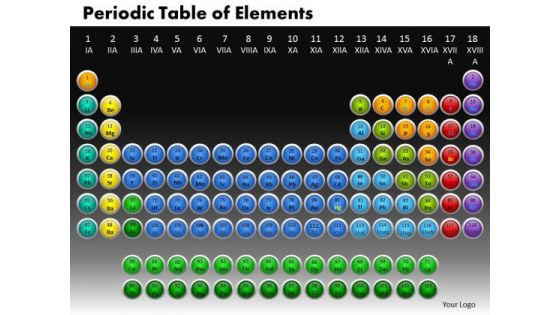
Business Circle Charts PowerPoint Templates Business Periodic Table Of Elements Ppt Slides
Business Circle Charts PowerPoint Templates Business periodic table of elements PPT Slides-Use this graphic to represent a continuing sequence of stages, tasks, or events in a circular flow and emphasize the connection between all components. -Business Circle Charts PowerPoint Templates Business periodic table of elements PPT Slides-This template can be used for presentations relating to Actinoids, Atom, Atomic, Chemistry, Electrons, Element, Helium, Hydrogen, Lanthanoids, Liquid, Molecule, Noble, Periodic, Physics, Plutonium, Quantum, Radium, Science, Scientific, Solid, Symbol, Table Our Business Circle Charts PowerPoint Templates Business Periodic Table Of Elements Ppt Slides are based on factual inputs. Your thoughts deserve the true picture.
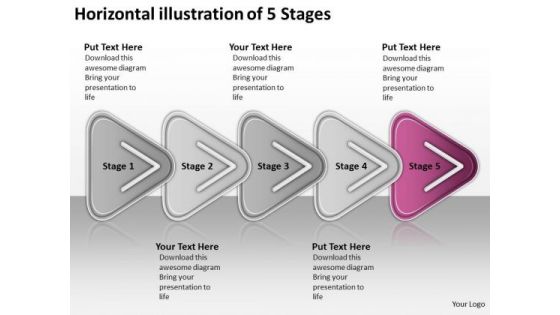
Horizontal Illustration Of 5 Stages Ppt Work Flow Charts PowerPoint Templates
We present our horizontal illustration of 5 stages ppt work flow charts PowerPoint templates.Use our Arrows PowerPoint Templates because our cleverly selected background hues are guaranteed to achieve this aim. Use our Shapes PowerPoint Templates because you require care and diligence to function well. Use our Business PowerPoint Templates because this template helps to pierce through the doubts of your audience. Present our Signs PowerPoint Templates because clarity of thought has been the key to your growth. Use our Process and Flows PowerPoint Templates because it shows the pyramid which is a symbol of the desire to reach the top in a steady manner.Use these PowerPoint slides for presentations relating to abstract, arrow, blank, business, chart, circular, circulation, concept, conceptual, design, diagram, executive, flow, horizontal, icon, idea, illustration, management, model, numbers, organization, process, progression, resource, sequence, stages, steps, strategy. The prominent colors used in the PowerPoint template are Pink, Gray, White. The feedback we get is that our horizontal illustration of 5 stages ppt work flow charts PowerPoint templates are Colorful. PowerPoint presentation experts tell us our business PowerPoint templates and PPT Slides are Colorful. People tell us our horizontal illustration of 5 stages ppt work flow charts PowerPoint templates will get their audience's attention. Professionals tell us our blank PowerPoint templates and PPT Slides are Reminiscent. You can be sure our horizontal illustration of 5 stages ppt work flow charts PowerPoint templates are designed by professionals We assure you our circulation PowerPoint templates and PPT Slides are Elegant. The audience will be hard put to find fault. Our Horizontal Illustration Of 5 Stages Ppt Work Flow Charts PowerPoint Templates ensure accuracy of thought.
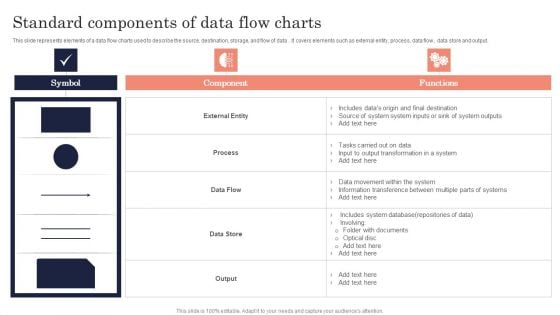
Standard Components Of Data Flow Charts Ppt PowerPoint Presentation File Pictures PDF
this slide represents elements of a data flow charts used to describe the source, destination, storage, and flow of data. it covers elements such as external entity, process, data flow, data store and output. Showcasing this set of slides titled Standard Components Of Data Flow Charts Ppt PowerPoint Presentation File Pictures PDF. The topics addressed in these templates are Symbol, Component, Functions. All the content presented in this PPT design is completely editable. Download it and make adjustments in color, background, font etc. as per your unique business setting.
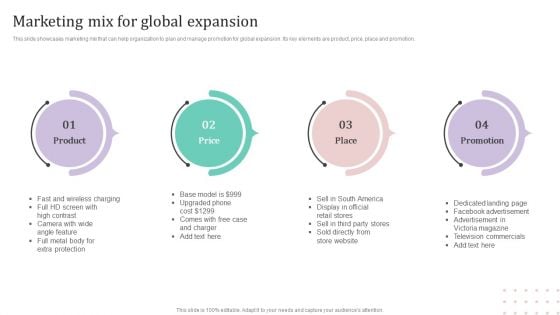
Marketing Mix For Global Expansion Ppt PowerPoint Presentation Diagram Graph Charts PDF
This slide showcases marketing mix that can help organization to plan and manage promotion for global expansion. Its key elements are product, price, place and promotion.If you are looking for a format to display your unique thoughts, then the professionally designed Marketing Mix For Global Expansion Ppt PowerPoint Presentation Diagram Graph Charts PDF is the one for you. You can use it as a Google Slides template or a PowerPoint template. Incorporate impressive visuals, symbols, images, and other charts. Modify or reorganize the text boxes as you desire. Experiment with shade schemes and font pairings. Alter, share or cooperate with other people on your work. Download Marketing Mix For Global Expansion Ppt PowerPoint Presentation Diagram Graph Charts PDF and find out how to give a successful presentation. Present a perfect display to your team and make your presentation unforgettable.
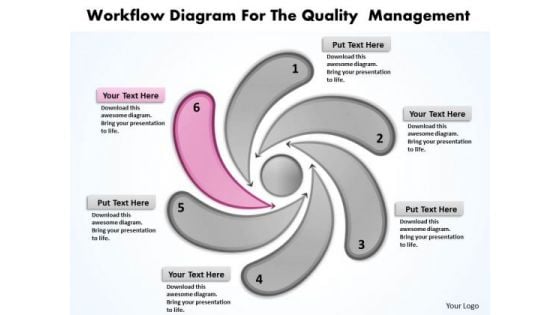
Business Charts Examples Workflow Diagram For The Quality Management PowerPoint Templates
We present our business charts examples workflow diagram for the quality management PowerPoint templates.Download our Advertising PowerPoint Templates because you know the path so show the way. Download and present our Business PowerPoint Templates because you can Flutter your wings and enchant the world. Impress them with the innate attractiveness of your thoughts and words. Use our Marketing PowerPoint Templates because you can blaze a brilliant trail from point to point. Use our Finance PowerPoint Templates because you should take your team soaring to the pinnacle they crave. Download and present our Shapes PowerPoint Templates because you have the ability to judge Which out of late have been proving to be a hassle.Use these PowerPoint slides for presentations relating to Abstract, Background, Buttons, Clean, Color, Communication, Concept, Conceptual, Design, Diagram, Direction, Elements, Exchange, Flow, Flowchart, Graph, Graphic, Icon, Illustration, Internet, Pointing, Precise, Process, Red, Sign, Simple, Symbol, Template, Web Graphics, Web Icons. The prominent colors used in the PowerPoint template are Pink, Gray, Black. PowerPoint presentation experts tell us our business charts examples workflow diagram for the quality management PowerPoint templates will make the presenter successul in his career/life. Professionals tell us our Communication PowerPoint templates and PPT Slides are Festive. People tell us our business charts examples workflow diagram for the quality management PowerPoint templates are Pretty. We assure you our Clean PowerPoint templates and PPT Slides are Chic. PowerPoint presentation experts tell us our business charts examples workflow diagram for the quality management PowerPoint templates are Delightful. Professionals tell us our Clean PowerPoint templates and PPT Slides are Bright. Restructure your organization with our Business Charts Examples Workflow Diagram For The Quality Management PowerPoint Templates. Download without worries with our money back guaranteee.
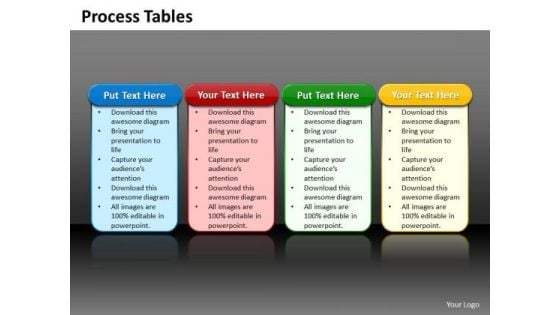
Business Charts PowerPoint Templates 4 Reasons You Should Buy From Circular Process Tables Sales
Business Charts PowerPoint templates 4 reasons you should buy from circular process tables Sales-This PowerPoint Diagram consists of four animated Process tables of Different Colors. It can be used to symbolize four different Approaches or four distinct techniques. It consists of single color slide as well. This diagram will fit for Business Presentations. Display entrepreneurial vision with our Business Charts PowerPoint Templates 4 Reasons You Should Buy From Circular Process Tables Sales. They will make you look good.
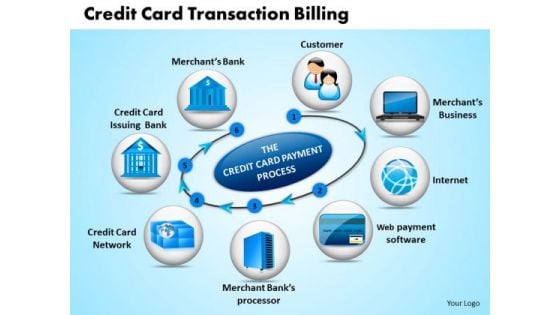
Business Circle Charts PowerPoint Templates Business Credit Card Transaction Billing Ppt Slides
Business Circle Charts PowerPoint Templates Business credit card transaction billing PPT Slides-This PowerPoint diagram shows Circles representing related points in an idea. You can also use it as credit card transaction slide-Business Circle Charts PowerPoint Templates Business credit card transaction billing PPT Slides-This template can be used for presentations relating to Account, Bank, Business, Buy, Buying, Cards, Cash, Chips, Close-Up, Commerce, Credit, Credits, Date, Ecommerce, Expiration, Expire, Expired, Finance, Financial, Gold, Limit, Macro, Master, Money, Now, Online, Order, Paid, Pay, Paying, Payment Our Business Circle Charts PowerPoint Templates Business Credit Card Transaction Billing Ppt Slides are never a drag. The audience will be always attentive.
Pdca Slide For Best Charts For Technical Analysis Ppt PowerPoint Presentation Icon Backgrounds PDF
This is a pdca slide for best charts for technical analysis ppt powerpoint presentation icon backgrounds pdf template with various stages. Focus and dispense information on four stages using this creative set, that comes with editable features. It contains large content boxes to add your information on topics like pdca slide for best charts for technical analysis. You can also showcase facts, figures, and other relevant content using this PPT layout. Grab it now.

Business Charts PowerPoint Templates Red Strategy Puzzle Pieces The Form Key
Business Charts PowerPoint templates red Strategy Puzzle pieces the form key-This PowerPoint Diagram represents the Key to Success made from Red Puzzles. This PowerPoint Diagram will show you the keys and path which will lead to Success. You can apply other 3D Styles and shapes to the slide to enhance your presentations-Business Charts PowerPoint templates red Strategy Puzzle pieces the form key Win easily with our Business Charts PowerPoint Templates Red Strategy Puzzle Pieces The Form Key. Dont pass up this opportunity to shine.
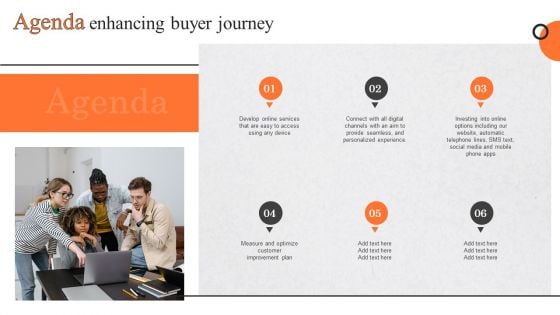
Agenda Enhancing Buyer Journey Ppt PowerPoint Presentation Diagram Graph Charts PDF
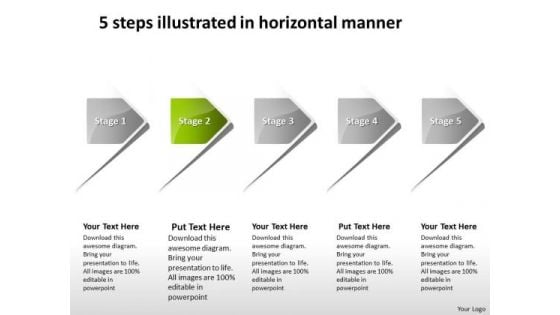
5 Steps Illustrated In Horizontal Manner Process Flow Charts Examples PowerPoint Templates
We present our 5 steps illustrated in horizontal manner process flow charts examples PowerPoint templates.Download and present our Arrows PowerPoint Templates because it shows you the vision of a desired destination and the best road to take to reach that goal. Download and present our Shapes PowerPoint Templates because it helps your team to align their arrows to consistently be accurate. Download our Signs PowerPoint Templates because generation of sales is the core of any business. Use our Business PowerPoint Templates because you have churned your mind and come upwith solutions. Use our Process and Flows PowerPoint Templates because this diagram has the unique ability to drive home your ideas and show how they mesh to guarantee success.Use these PowerPoint slides for presentations relating to Abstract, Arrows, business, chart, circulation, concept, conceptual, design, diagram, executive, four, icon, idea, illustration, management, map, mapping, model, numbers, organization, procedure, process, progression, resource, sequence, sequential, stages, steps, strategy,. The prominent colors used in the PowerPoint template are Green, Gray, White. The feedback we get is that our 5 steps illustrated in horizontal manner process flow charts examples PowerPoint templates are topically designed to provide an attractive backdrop to any subject. People tell us our circulation PowerPoint templates and PPT Slides are Luxuriant. We assure you our 5 steps illustrated in horizontal manner process flow charts examples PowerPoint templates are Wistful. Presenters tell us our conceptual PowerPoint templates and PPT Slides are Amazing. We assure you our 5 steps illustrated in horizontal manner process flow charts examples PowerPoint templates are Beautiful. Use our concept PowerPoint templates and PPT Slides are Striking. Whatever the nationality,our 5 Steps Illustrated In Horizontal Manner Process Flow Charts Examples PowerPoint Templates are relevant. They have no ethnic bias.
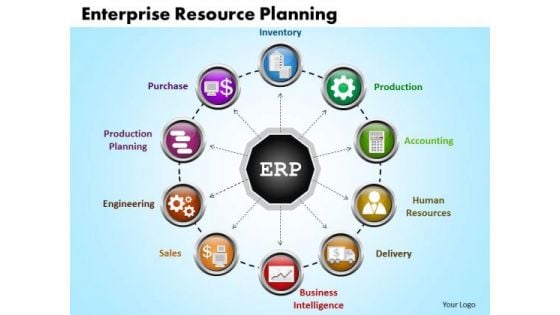
Business Circle Charts PowerPoint Templates Business Enterprise Resource Planning Ppt Slides
Business Circle Charts PowerPoint Templates Business Enterprise Resource Planning PPT Slides-A wonderful graphics to make a PowerPoint presentation on Enterprise Resource Planning-Business Circle Charts PowerPoint Templates Business Enterprise Resource Planning PPT Slides-This template can be used for presentations relating to 3d, Arrow, Blueprint, Business, Circle, Cleverness, Commerce, Company, Competence, Concept, Constructive, Corporate, Create, Creative, Creativity, Decision, Design, Develop, Device, Discover, Earn, Enterprise, Finance, Goal, Idea, Imaginative, Ingenious, Innovative, Inspiration, Inspire, Inventive, Job, Management, Market Convince your customers that you care. Express your commitment through our Business Circle Charts PowerPoint Templates Business Enterprise Resource Planning Ppt Slides.
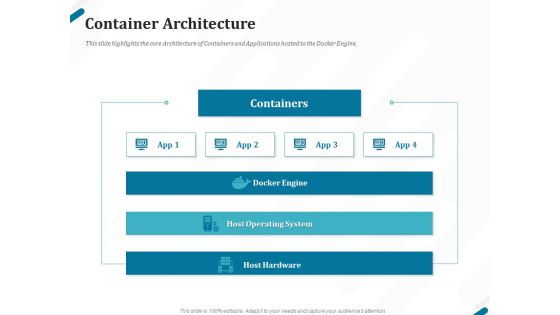
Kubernetes Containers Architecture Overview Container Architecture Ppt Diagram Graph Charts PDF
Presenting this set of slides with name kubernetes containers architecture overview container architecture ppt diagram graph charts pdf. The topics discussed in these slides are containers, docker engine, host operating system, host hardware. This is a completely editable PowerPoint presentation and is available for immediate download. Download now and impress your audience.
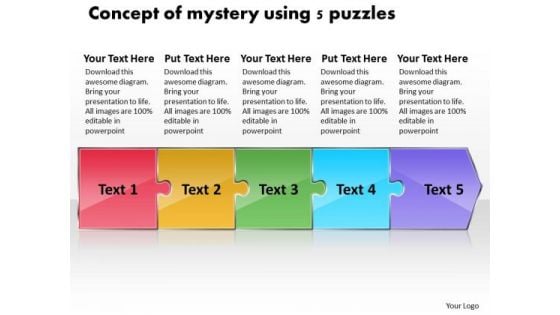
Concept Of Mystery Using 5 Puzzles Office Flow Charts PowerPoint Templates
We present our concept of mystery using 5 puzzles office flow charts PowerPoint templates.Use our Arrows PowerPoint Templates because, It helps you to get your team in the desired sequence into the bracket. Use our Puzzles or Jigsaws PowerPoint Templates because,This is an excellent slide to detail and highlight your thought process, your views and your positive expectations.. Use our Shapes PowerPoint Templates because,You know Coincidentally it will always point to the top. Use our Business PowerPoint Templates because,This diagram helps you to light up enthusiasm in your team like dream emerge.ge. Use our Process and Flows PowerPoint Templates because,Displaying your ideas and highlighting your ability will accelerate the growth of your company and yours.Use these PowerPoint slides for presentations relating to adversity, answers, beginnings, business, challenge, choice, complexity, concepts, confusion, conquering adversity, creativity, decisions, direction, horizontal, ideas, intelligence, journey, lost, mystery, path, perspective, plan, problem, puzzle, riddle, route, searching, solution, strategy, success. The prominent colors used in the PowerPoint template are Red, Yellow, Green. People tell us our concept of mystery using 5 puzzles office flow charts PowerPoint templates are Reminiscent. The feedback we get is that our choice PowerPoint templates and PPT Slides are Nice. People tell us our concept of mystery using 5 puzzles office flow charts PowerPoint templates are Playful. Presenters tell us our concepts PowerPoint templates and PPT Slides are Romantic. The feedback we get is that our concept of mystery using 5 puzzles office flow charts PowerPoint templates are readymade to fit into any presentation structure. Professionals tell us our business PowerPoint templates and PPT Slides are Fun. Empower yourself with our Concept Of Mystery Using 5 Puzzles Office Flow Charts PowerPoint Templates. Put extra force behind your thoughts.
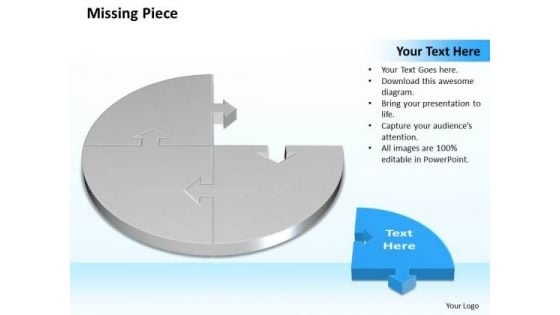
Business Charts PowerPoint Templates 3d Circle Problem Solving Puzzle Piece Showing Missing Diagram
Business Charts PowerPoint templates 3d circle Problem Solving Puzzle Piece showing missing diagram-Use this Business PowerPoint Diagram to explain the missing concept in a process. It shows that if one piece is missing , the puzzle is not complete, in the similar way if in business one With our Business Charts PowerPoint Templates 3d Circle Problem Solving Puzzle Piece Showing Missing Diagram there are no mixed feelings. The aim will be loud and clear to all.

White House Winter Image With Snow Ppt PowerPoint Presentation Diagram Graph Charts PDF
Pitch your topic with ease and precision using this white house winter image with snow ppt powerpoint presentation diagram graph charts pdf. This layout presents information on white house winter image with snow. It is also available for immediate download and adjustment. So, changes can be made in the color, design, graphics or any other component to create a unique layout.
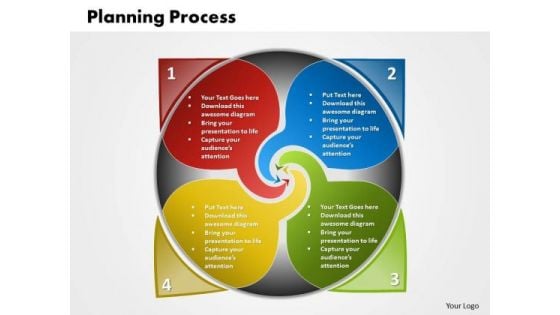
Business Charts PowerPoint Templates 4 Steps Planning Circular Direction Diagram Sales
Business Charts PowerPoint templates 4 steps planning circular direction diagram Sales-This Rangoli Based PowerPoint Diagram shows the four step planning process in Circular Manner. It shows four Phases required in any Process related to Business. Use this Fascinating Diagram to make your Presentation delightful. Add brilliance with our Business Charts PowerPoint Templates 4 Steps Planning Circular Direction Diagram Sales. You will come out on top.
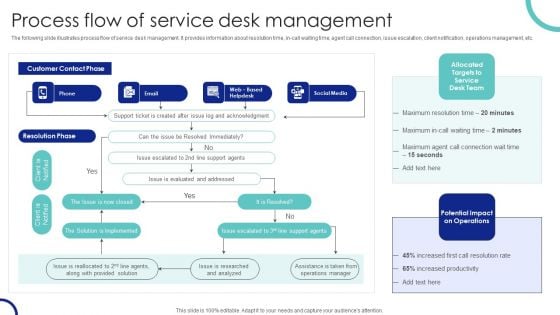
Process Flow Of Service Desk Management Ppt PowerPoint Presentation Diagram Graph Charts PDF
The following slide illustrates process flow of service desk management. It provides information about resolution time, in-call waiting time, agent call connection, issue escalation, client notification, operations management, etc. Explore a selection of the finest Process Flow Of Service Desk Management Ppt PowerPoint Presentation Diagram Graph Charts PDF here. With a plethora of professionally designed and pre made slide templates, you can quickly and easily find the right one for your upcoming presentation. You can use our Process Flow Of Service Desk Management Ppt PowerPoint Presentation Diagram Graph Charts PDF to effectively convey your message to a wider audience. Slidegeeks has done a lot of research before preparing these presentation templates. The content can be personalized and the slides are highly editable. Grab templates today from Slidegeeks.
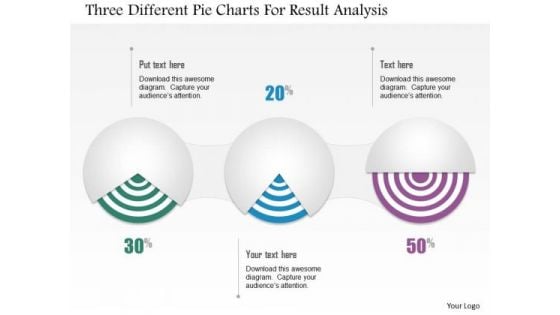
Business Diagram Three Different Pie Charts For Result Analysis Presentation Template
Three different pie charts are used to designed this power point template slide. This PPT slide contains the concept of result analysis. Use this PPT slide for your data and process related presentations.
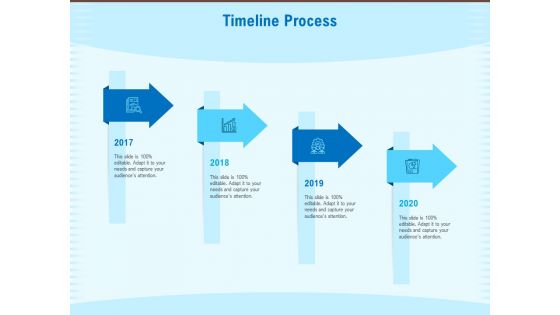
Artificial Surveillance Timeline Process Ppt PowerPoint Presentation Diagram Graph Charts PDF
Presenting this set of slides with name artificial surveillance timeline process ppt powerpoint presentation diagram graph charts pdf. This is a four stage process. The stages in this process are timeline, 2017 to 2020. This is a completely editable PowerPoint presentation and is available for immediate download. Download now and impress your audience.
Icons Slide For Establishing And Implementing HR Online Learning Program Ppt Diagram Graph Charts PDF
Presenting this set of slides containing editable icons for topic icons slide for establishing and implementing hr online learning program ppt diagram graph charts pdf. All icons in this slide are 100 percent editable. You can replace icons in your deck with any of these icons. Download now and impress your audience.
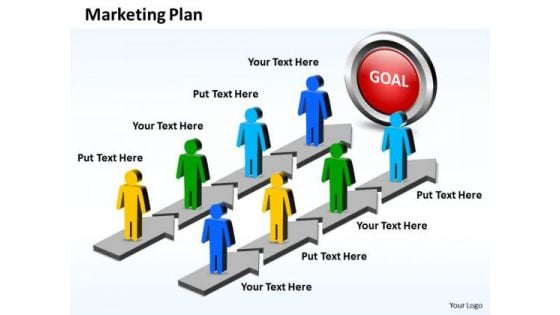
Business Charts PowerPoint Templates Stages For Marketing Plan Sales And Slides
Business Charts PowerPoint templates stages for marketing plan Sales and Slides-This PowerPoint diagram is a simple diagram that provides a graphical overview of a continuing sequence of stages, tasks, actions, or events in a parallel way. This PowerPoint diagram can be used for business process automation and other business related issues.-Business Charts PowerPoint templates stages for marketing plan Sales and Slides You intend to deliver. Make it happen with our Business Charts PowerPoint Templates Stages For Marketing Plan Sales And Slides. Make sure your presentation gets the attention it deserves.
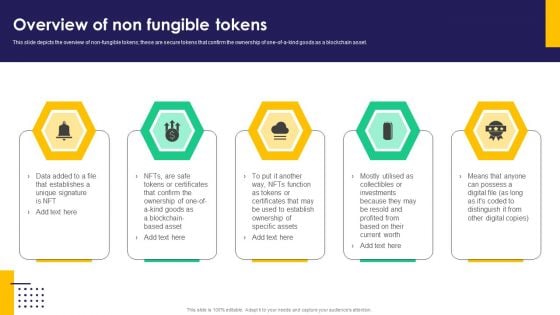
Overview Of Non Fungible Tokens Ppt PowerPoint Presentation Diagram Graph Charts PDF
This slide depicts the overview of non-fungible tokens these are secure tokens that confirm the ownership of one-of-a-kind goods as a blockchain asset. If you are looking for a format to display your unique thoughts, then the professionally designed Overview Of Non Fungible Tokens Ppt PowerPoint Presentation Diagram Graph Charts PDF is the one for you. You can use it as a Google Slides template or a PowerPoint template. Incorporate impressive visuals, symbols, images, and other charts. Modify or reorganize the text boxes as you desire. Experiment with shade schemes and font pairings. Alter, share or cooperate with other people on your work. Download Overview Of Non Fungible Tokens Ppt PowerPoint Presentation Diagram Graph Charts PDF and find out how to give a successful presentation. Present a perfect display to your team and make your presentation unforgettable.
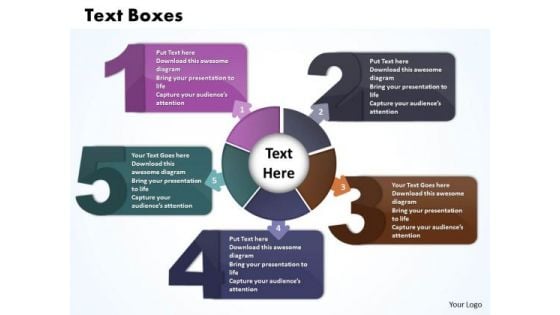
Business Charts PowerPoint Templates Five Text Boxes Connected With Circular Direction
Business Charts PowerPoint templates five text boxes connected with circular direction-Use this Circular Process with five text Boxes to represent a continuing sequence of stages, tasks, or events in a circular flow and emphasize the connection between all components. You can change color, size and orientation of any icon to your liking.-Business Charts PowerPoint templates five text boxes connected with circular direction Create an engaging ambience with our Business Charts PowerPoint Templates Five Text Boxes Connected With Circular Direction. Their content will appeal to all the brains.
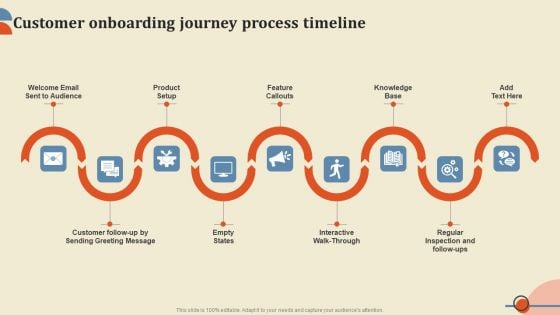
Customer Onboarding Journey Process Timeline Ppt PowerPoint Presentation Diagram Graph Charts PDF
Do you have to make sure that everyone on your team knows about any specific topic I yes, then you should give Customer Onboarding Journey Process Timeline Ppt PowerPoint Presentation Diagram Graph Charts PDF a try. Our experts have put a lot of knowledge and effort into creating this impeccable Customer Onboarding Journey Process Timeline Ppt PowerPoint Presentation Diagram Graph Charts PDF. You can use this template for your upcoming presentations, as the slides are perfect to represent even the tiniest detail. You can download these templates from the Slidegeeks website and these are easy to edit. So grab these today.
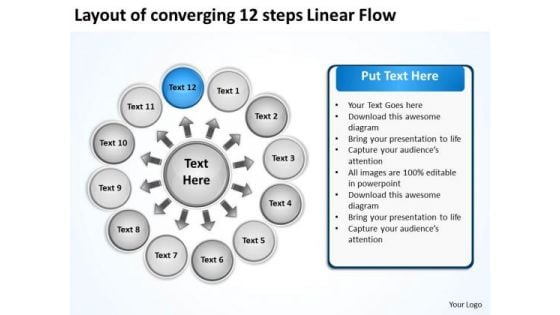
Layout Of Converging 12 Steps Linear Flow Ppt Charts And Diagrams PowerPoint Slides
We present our layout of converging 12 steps linear flow ppt Charts and Diagrams PowerPoint Slides.Download our Symbol PowerPoint Templates because you can Present your views on the methods using our self-explanatory templates. Download and present our Business PowerPoint Templates because you have had your share of being a goldfish in a small bowl.you are ready to launch out and spread your wings. Download our Arrows PowerPoint Templates because this layout helps you to impress upon the audience how your strategy will carry all to the top of the corporate heap. Download and present our Shapes PowerPoint Templates because infrastructure growth is an obvious requirement of today.inform your group on how exactly this potential is tailor made for you. Present our Process and Flows PowerPoint Templates because all elements of the venture are equally critical.Use these PowerPoint slides for presentations relating to Arrows, Business, Central, Centralized, Chart, Circle, Circular, Circulation, Concept, Conceptual, Converging, Design, Diagram, Executive, Icon, Idea, Illustration, Management, Mapping, Model, Numbers, Organization, Outwards, Pointing, Procedure, Process, Radial, Radiating, Relationship, Resource, Sequence, Sequential, Square. The prominent colors used in the PowerPoint template are Blue, Gray, White. Use our layout of converging 12 steps linear flow ppt Charts and Diagrams PowerPoint Slides are Radiant. We assure you our Circulation PowerPoint templates and PPT Slides are Stunning. People tell us our layout of converging 12 steps linear flow ppt Charts and Diagrams PowerPoint Slides are Stunning. PowerPoint presentation experts tell us our Concept PowerPoint templates and PPT Slides are Reminiscent. PowerPoint presentation experts tell us our layout of converging 12 steps linear flow ppt Charts and Diagrams PowerPoint Slides are Detailed. Use our Central PowerPoint templates and PPT Slides are Precious. Ambiguity can be exasperating. Give definite answers with our Layout Of Converging 12 Steps Linear Flow Ppt Charts And Diagrams PowerPoint Slides.
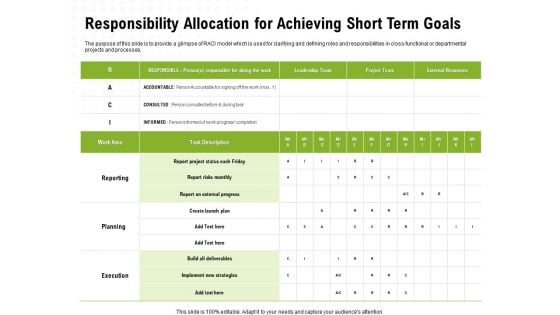
Strategic Growth Technique Responsibility Allocation For Achieving Short Term Goals Ppt Diagram Graph Charts PDF
Presenting this set of slides with name strategic growth technique responsibility allocation for achieving short term goals ppt diagram graph charts pdf. The topics discussed in these slides are implement, strategies, leadership team, external resources. This is a completely editable PowerPoint presentation and is available for immediate download. Download now and impress your audience.
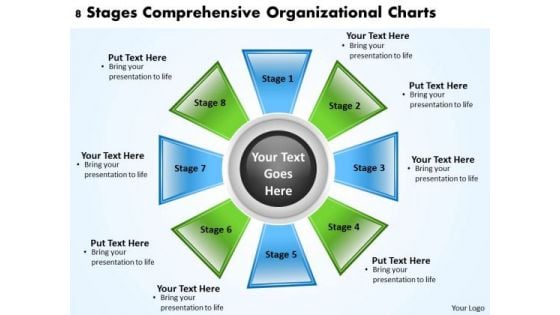
Business Process Management Diagram 8 Stages Comprehensive Organizational Charts PowerPoint Slides
We present our business process management diagram 8 stages comprehensive organizational charts PowerPoint Slides.Download and present our Marketing PowerPoint Templates because Our PowerPoint Templates and Slides will provide weight to your words. They will bring out the depth of your thought process. Download and present our Business PowerPoint Templates because Our PowerPoint Templates and Slides are created with admirable insight. Use them and give your group a sense of your logical mind. Download our Finance PowerPoint Templates because Our PowerPoint Templates and Slides are Clear and concise. Use them and dispel any doubts your team may have. Download our Process and Flows PowerPoint Templates because Our PowerPoint Templates and Slides are created by a hardworking bunch of busybees. Always flitting around with solutions gauranteed to please. Present our Shapes PowerPoint Templates because Our PowerPoint Templates and Slides will bullet point your ideas. See them fall into place one by one.Use these PowerPoint slides for presentations relating to Box, Brochure, Business, Button, Catalog, Chart, Circle, Company, Data, Design, Diagram, Direction, Document, Financial, Goals, Graph, Junction, Management, Market, Marketing, Model, Multicolored, Multiple, Navigation, Network, Options, Orange, Pie, Plan, Presentation, Process, Red, Results, Statistics, Stock, Structure, Template, Vector, Website, Wheel. The prominent colors used in the PowerPoint template are Green, Blue, Black. Enter any arena with our Business Process Management Diagram 8 Stages Comprehensive Organizational Charts PowerPoint Slides. You will certainly emerge the champion.
Project Screen With Graphs And Charts For Visual Presentation Ppt PowerPoint Presentation Gallery Design Inspiration
This is a project screen with graphs and charts for visual presentation ppt powerpoint presentation gallery design inspiration. This is a four stage process. The stages in this process are visual aids, communication, business.
Social Media Icons With Pie Charts For Marketing Analysis Ppt PowerPoint Presentation Ideas Example
This is a social media icons with pie charts for marketing analysis ppt powerpoint presentation ideas example. This is a six stage process. The stages in this process are kpi proposal, kpi plan, kpi scheme.
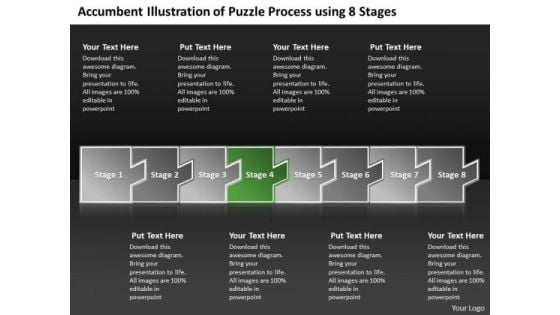
Accumbent Illustration Of Puzzle Process Using 8 Stages Flow Charting PowerPoint Slides
We present our accumbent illustration of puzzle process using 8 stages flow charting PowerPoint Slides.Download our Signs PowerPoint Templates because educate your staff on the means to provide the required support for speedy recovery. Use our Process and Flows PowerPoint Templates because your listeners do not have to put on their thinking caps. Use our Leadership PowerPoint Templates because you can Help your viewers automatically emphathise with your thoughts. Present our Shapes PowerPoint Templates because it helps you to get your team in the desired sequence into the bracket. Download our Arrows PowerPoint Templates because you understand how each drives the next to motor the entire sequence.Use these PowerPoint slides for presentations relating to Arrows, art, assess, background, blue, business, campaign, chart, client, clip, clipart, clouds, determine, development, diagram, effectiveness, eps10, goal, graph, graphic, illustration, implement, outcome, process, results, shadow,. The prominent colors used in the PowerPoint template are White, Black, Gray. The feedback we get is that our accumbent illustration of puzzle process using 8 stages flow charting PowerPoint Slides are Bold. People tell us our client PowerPoint templates and PPT Slides look good visually. We assure you our accumbent illustration of puzzle process using 8 stages flow charting PowerPoint Slides are Beautiful. Presenters tell us our campaign PowerPoint templates and PPT Slides are effectively colour coded to prioritise your plans They automatically highlight the sequence of events you desire. We assure you our accumbent illustration of puzzle process using 8 stages flow charting PowerPoint Slides help you meet deadlines which are an element of today's workplace. Just browse and pick the slides that appeal to your intuitive senses. Use our assess PowerPoint templates and PPT Slides are Attractive. Set up the base with our Accumbent Illustration Of Puzzle Process Using 8 Stages Flow Charting PowerPoint Slides. You will soon celebrate success.
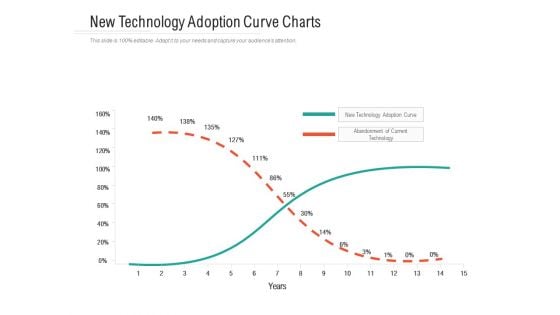
New Technology Adoption Curve Charts Ppt PowerPoint Presentation Inspiration Structure PDF
Pitch your topic with ease and precision using this new technology adoption curve charts ppt powerpoint presentation inspiration structure pdf. This layout presents information on new technology, adoption curve, abandonment of current technology. It is also available for immediate download and adjustment. So, changes can be made in the color, design, graphics or any other component to create a unique layout.
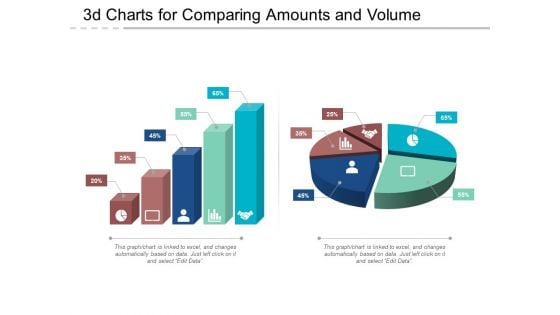
3D Charts For Comparing Amounts And Volume Ppt PowerPoint Presentation Show Deck
This is a 3d charts for comparing amounts and volume ppt powerpoint presentation show deck. This is a five stage process. The stages in this process are art, colouring, paint brush.
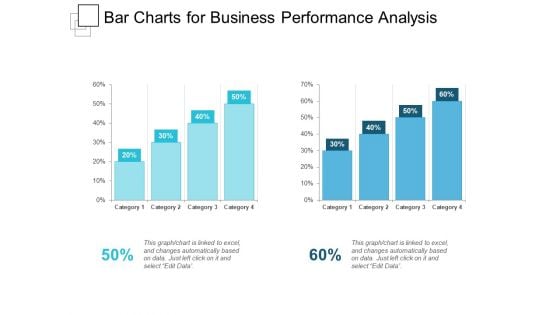
Bar Charts For Business Performance Analysis Ppt PowerPoint Presentation Show Slideshow
This is a bar charts for business performance analysis ppt powerpoint presentation show slideshow. This is a two stage process. The stages in this process are compare, comparison of two, competitive analysis.

Business Analysis Data Charts And Reports Ppt Powerpoint Presentation Ideas Portrait
This is a business analysis data charts and reports ppt powerpoint presentation ideas portrait. This is a three stage process. The stages in this process are business metrics, business kpi, business dashboard.
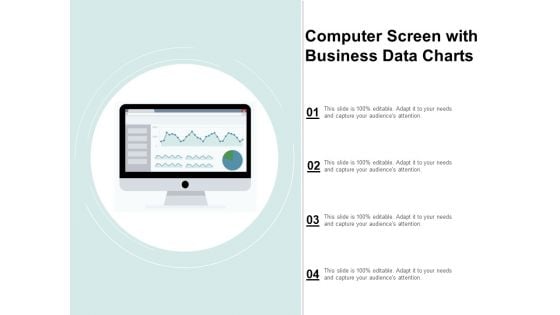
Computer Screen With Business Data Charts Ppt Powerpoint Presentation Show Vector
This is a computer screen with business data charts ppt powerpoint presentation show vector. This is a four stage process. The stages in this process are business metrics, business kpi, business dashboard.
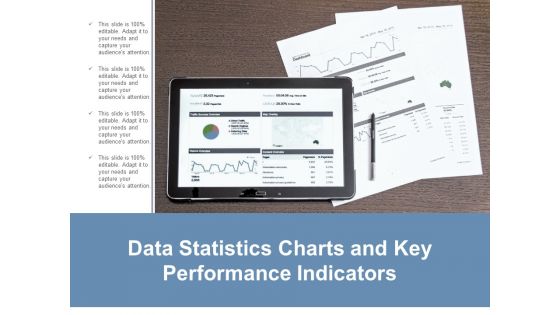
Data Statistics Charts And Key Performance Indicators Ppt Powerpoint Presentation Layouts Guide
This is a data statistics charts and key performance indicators ppt powerpoint presentation layouts guide. This is a four stage process. The stages in this process are business metrics, business kpi, business dashboard.
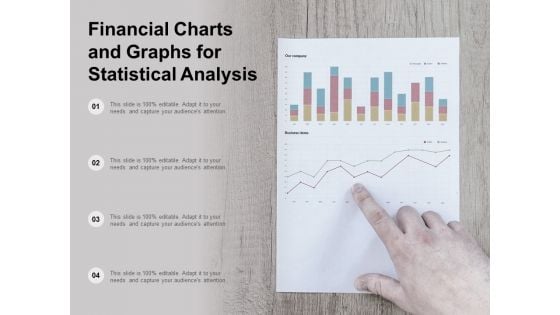
Financial Charts And Graphs For Statistical Analysis Ppt Powerpoint Presentation Show Layout
This is a financial charts and graphs for statistical analysis ppt powerpoint presentation show layout. This is a four stage process. The stages in this process are business metrics, business kpi, business dashboard.
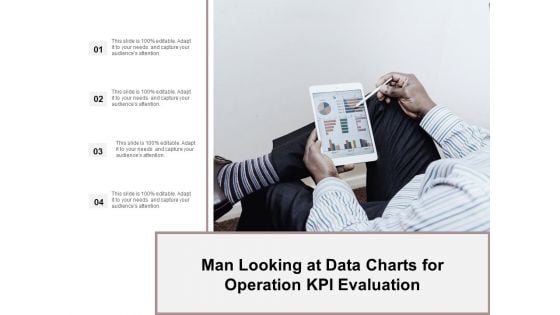
Man Looking At Data Charts For Operation Kpi Evaluation Ppt Powerpoint Presentation Ideas Demonstration
This is a man looking at data charts for operation kpi evaluation ppt powerpoint presentation ideas demonstration. This is a four stage process. The stages in this process are business metrics, business kpi, business dashboard.
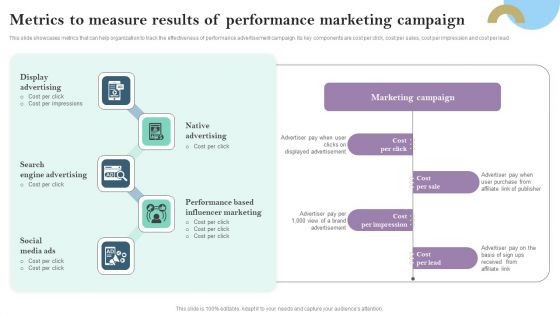
Metrics To Measure Results Of Performance Marketing Campaign Ppt PowerPoint Presentation Diagram Graph Charts PDF
This slide showcases metrics that can help organization to track the effectiveness of performance advertisement campaign. Its key components are cost per click, cost per sales, cost per impression and cost per lead Presenting this PowerPoint presentation, titled Metrics To Measure Results Of Performance Marketing Campaign Ppt PowerPoint Presentation Diagram Graph Charts PDF, with topics curated by our researchers after extensive research. This editable presentation is available for immediate download and provides attractive features when used. Download now and captivate your audience. Presenting this Metrics To Measure Results Of Performance Marketing Campaign Ppt PowerPoint Presentation Diagram Graph Charts PDF. Our researchers have carefully researched and created these slides with all aspects taken into consideration. This is a completely customizable Metrics To Measure Results Of Performance Marketing Campaign Ppt PowerPoint Presentation Diagram Graph Charts PDF that is available for immediate downloading. Download now and make an impact on your audience. Highlight the attractive features available with our PPTs.
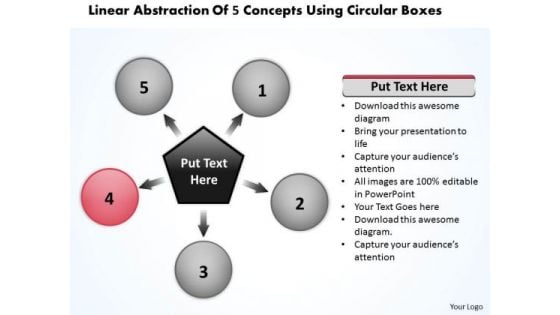
Linear Abstraction Of 5 Concepts Using Circular Boxes Ppt Charts And PowerPoint Slides
We present our linear abstraction of 5 concepts using circular boxes ppt Charts and PowerPoint Slides.Download our Shapes PowerPoint Templates because Our PowerPoint Templates and Slides come in all colours, shades and hues. They help highlight every nuance of your views. Download our Arrows PowerPoint Templates because your group can behave steady in the top bracket. Present our Process and Flows PowerPoint Templates because It can Conjure up grand ideas with our magical PowerPoint Templates and Slides. Leave everyone awestruck by the end of your presentation. Use our Business PowerPoint Templates because you can Lead your flock steadily to greater heights. Look around at the vast potential of achievement around you. Download our Signs PowerPoint Templates because forward thinking is the way to go.Use these PowerPoint slides for presentations relating to Arrow, Blank, Business, Chart, Circle, Circular, Concept, Connection, Copy, Cycle, Development, Diagram, Direction, Element, Flow, Four, Graph, Group, Mapping, Method, Model, Motion, Movement, Numbers, Organization, Pattern, Procedure, Process, Recycle, Redo, Repeat, Repetitive, Report, Resource, Reuse, Ring, Rotate, Rotation, Round, Segment, Sequence, Sequential, Shape, Sign, Space, Step, Strategy, System. The prominent colors used in the PowerPoint template are Red, Gray, Black. Use our linear abstraction of 5 concepts using circular boxes ppt Charts and PowerPoint Slides are Luxuriant. We assure you our Business PowerPoint templates and PPT Slides are Nostalgic. People tell us our linear abstraction of 5 concepts using circular boxes ppt Charts and PowerPoint Slides are designed by professionals PowerPoint presentation experts tell us our Concept PowerPoint templates and PPT Slides are second to none. PowerPoint presentation experts tell us our linear abstraction of 5 concepts using circular boxes ppt Charts and PowerPoint Slides are Precious. Use our Concept PowerPoint templates and PPT Slides are Graceful. Ideas flow from our Linear Abstraction Of 5 Concepts Using Circular Boxes Ppt Charts And PowerPoint Slides. They have the ability to be creative.
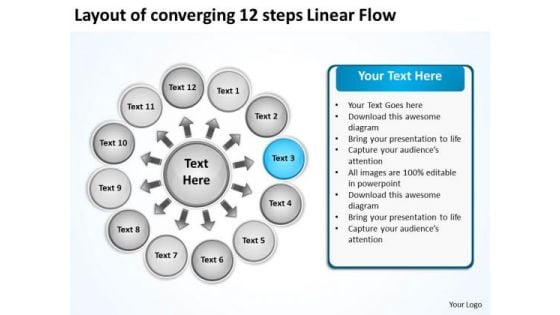
Layout Of Converging 12 Steps Linear Flow Charts And Networks PowerPoint Templates
We present our layout of converging 12 steps linear flow Charts and Networks PowerPoint templates.Present our Symbol PowerPoint Templates because you can Decorate it with your well wrapped ideas and colourful thoughts. Download our Business PowerPoint Templates because your product has established a foothold in the market. Customers are happy with the value it brings to their lives. Download and present our Arrows PowerPoint Templates because your team and you always raise a toast. Download and present our Shapes PowerPoint Templates because your ideas are fundamentally stable with a broad base of workable possibilities. Use our Process and Flows PowerPoint Templates because you have the moves to sway the market.Use these PowerPoint slides for presentations relating to Arrows, Business, Central, Centralized, Chart, Circle, Circular, Circulation, Concept, Conceptual, Converging, Design, Diagram, Executive, Icon, Idea, Illustration, Management, Mapping, Model, Numbers, Organization, Outwards, Pointing, Procedure, Process, Radial, Radiating, Relationship, Resource, Sequence, Sequential, Square. The prominent colors used in the PowerPoint template are Blue, Gray, White. Use our layout of converging 12 steps linear flow Charts and Networks PowerPoint templates are Appealing. We assure you our Centralized PowerPoint templates and PPT Slides are Playful. People tell us our layout of converging 12 steps linear flow Charts and Networks PowerPoint templates are Youthful. PowerPoint presentation experts tell us our Central PowerPoint templates and PPT Slides are Wistful. PowerPoint presentation experts tell us our layout of converging 12 steps linear flow Charts and Networks PowerPoint templates are Fun. Use our Circular PowerPoint templates and PPT Slides are Endearing. Put your fate in the hands of our Layout Of Converging 12 Steps Linear Flow Charts And Networks PowerPoint Templates. They will carve out a great destiny.
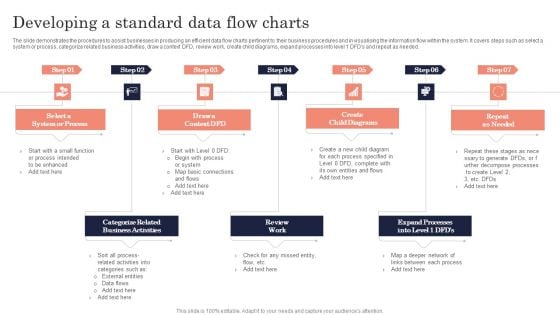
Developing A Standard Data Flow Charts Ppt PowerPoint Presentation File Clipart PDF
The slide demonstrates the procedures to assist businesses in producing an efficient data flow chartspertinent to their business procedures and in visualising the information flow within the system. it covers steps such as select a system or process, categorize related business activities, draw a context dfd, review work, create child diagrams, expand processes into level 1 dfds and repeat as needed. Persuade your audience using this Developing A Standard Data Flow Charts Ppt PowerPoint Presentation File Clipart PDF. This PPT design covers seven stages, thus making it a great tool to use. It also caters to a variety of topics including Create Child Diagrams, Repeat As Needed, Review Work. Download this PPT design now to present a convincing pitch that not only emphasizes the topic but also showcases your presentation skills.
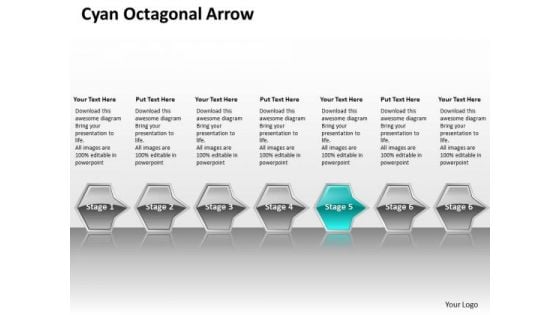
Ppt Consecutive Flow Process Charts Of Cyan Octagonal Arrow 7 Stages PowerPoint Templates
PPT consecutive flow process charts of cyan octagonal arrow 7 stages PowerPoint Templates-This PowerPoint Diagram shows you the Continual Series of seven stages through octagonal boxes. It shows the consecutive concepts to be explained together in one process. You can change color, size and orientation of any icon to your liking.-PPT consecutive flow process charts of cyan octagonal arrow 7 stages PowerPoint Templates-Shapes, Designs, Arrows, Badge, Balloon, Bar, Blank, Blue, Bright, Bubbles, Buttons, Circle, Color, Cross, Design, Drop, Elements, Glossy, Glowing, Graphic, Hexagon, Icon, Illustration, Navigation, Octagon, Plus, Polygon, Rectangles, Round, Seals, Set, Shadow, Shiny, Sign, Speech, Squares, Stars, Stickers, Submit, Symbol Go with the flow with our Ppt Consecutive Flow Process Charts Of Cyan Octagonal Arrow 7 Stages PowerPoint Templates. Your thoughts will go cruising along.
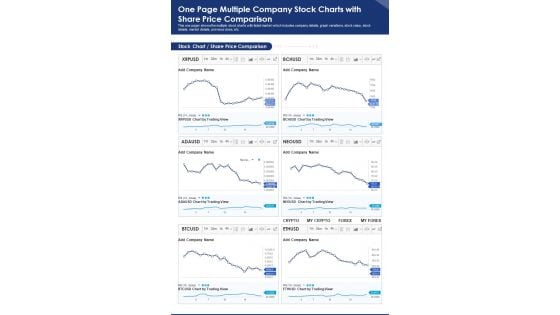
One Page Multiple Company Stock Charts With Share Price Comparison PDF Document PPT Template
Presenting you an exemplary One Page Multiple Company Stock Charts With Share Price Comparison PDF Document PPT Template. Our one-pager template comprises all the must-have essentials of an inclusive document. You can edit it with ease, as its layout is completely editable. With such freedom, you can tweak its design and other elements to your requirements. Download this One Page Multiple Company Stock Charts With Share Price Comparison PDF Document PPT Template Download now.
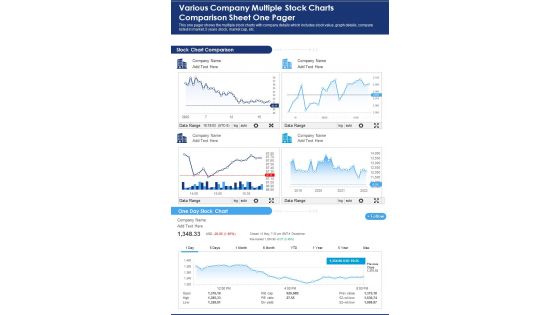
Various Company Multiple Stock Charts Comparison Sheet One Pager PDF Document PPT Template
Presenting you a fantastic Various Company Multiple Stock Charts Comparison Sheet One Pager PDF Document PPT Template. This one-pager document is crafted on hours of research and professional design efforts to ensure you have the best resource. It is completely editable and its design allow you to rehash its elements to suit your needs. Get this Various Company Multiple Stock Charts Comparison Sheet One Pager PDF Document PPT Template Download now.
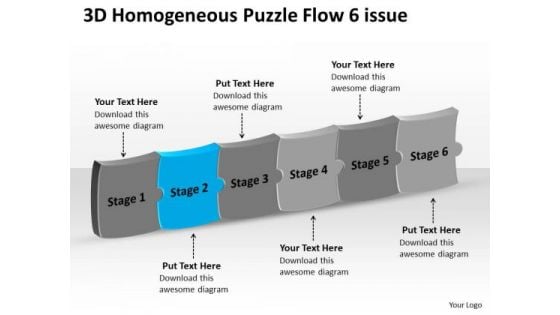
3d Homogeneous Puzzle Flow 6 Issue Ppt Office Charts PowerPoint Templates
We present our 3d homogeneous puzzle flow 6 issue ppt office charts PowerPoint templates. Use our Business PowerPoint Templates because, Show how one can contribute to the overall feeling of wellbeing. Use our Puzzles or Jigsaws PowerPoint Templates because, you are going along well but your foresight shows that it may need a slight change in plans or direction. Use our Shapes PowerPoint Templates because, you are the star of your enlightened team. Use our Communication PowerPoint Templates because; explain your strategy to co-ordinate activities of these separate groups. Use our Process and Flows PowerPoint Templates because, Our PowerPoint templates designed for your ideas to sell. Use these PowerPoint slides for presentations relating to abstract, action, attach, box, business, center, chain, chart, color, communication, concept, connection, cube, cycle, data, diagram, flow, globe, horizontal, idea, illustration, individual, information, interaction, jigsaw, join pieces, process puzzle, relationship, shape, success. The prominent colors used in the PowerPoint template are Blue, Gray, and Black Choke confusion and bring clarity with our 3d Homogeneous Puzzle Flow 6 Issue Ppt Office Charts PowerPoint Templates. You will come out on top.
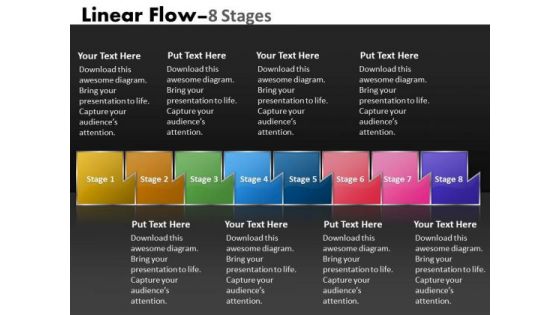
Ppt Multicolored Sequential Flow Process Charts Network Diagram PowerPoint Template 1 Graphic
We present our PPT multicolored Sequential flow process charts network diagram PowerPoint template 1 Graphic. Use our Design PowerPoint Templates because, coincidentally it always points to the top. Use our Shapes PowerPoint Templates because, your foot is on the pedal and your company is purring along smoothly. Use our Business PowerPoint Templates because, Harness these opportunities, celebrate your performance till date and focus on greater growth and expansion in coming years. Use our Process and Flows PowerPoint Templates because, There are different paths to gain the necessary knowledge to achieve it. Use our Signs PowerPoint Templates because, Signpost your preferred roadmap to your eager co- travelers and demonstrate clearly how you intend to navigate them towards the desired corporate goal. Use these PowerPoint slides for presentations relating to abstract, algorithm, arrow, arrow chart, diagram, business, chart, connection, design, development, diagram, direction, element, flow diagram, diagram, linear diagram, management, organization, process, process arrows, process, process diagram, sign, solution, strategy, symbol, vector, vibrant . The prominent colors used in the PowerPoint template are Red, Green, and Pink Equip your thoughts with all accessories. Add on our Ppt Multicolored Sequential Flow Process Charts Network Diagram PowerPoint Template 1 Graphic for good measure.
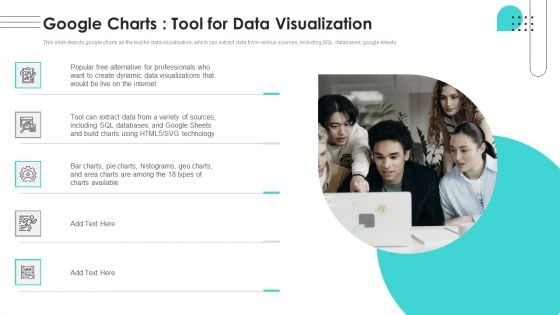
Branches For Visualization Research And Development Google Charts Tool For Data Elements PDF
This slide depicts google charts as the tool for data visualization, which can extract data from various sources, including SQL, databases, google sheets. Do you have an important presentation coming up Are you looking for something that will make your presentation stand out from the rest Look no further than Branches For Visualization Research And Development Google Charts Tool For Data Elements PDF. With our professional designs, you can trust that your presentation will pop and make delivering it a smooth process. And with Slidegeeks, you can trust that your presentation will be unique and memorable. So why wait Grab Branches For Visualization Research And Development Google Charts Tool For Data Elements PDF today and make your presentation stand out from the rest.
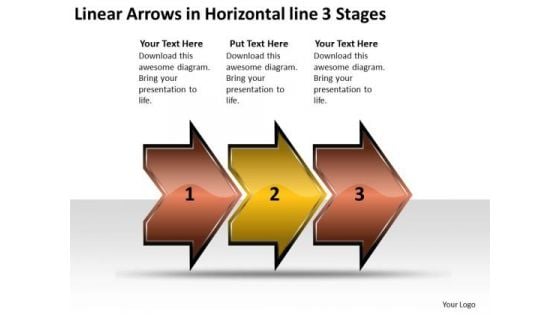
Linear Arrows Horizontal 3 Stages Sample Flow Charts Vision PowerPoint Slides
We present our linear arrows horizontal 3 stages sample flow charts vision PowerPoint Slides.Use our Arrows PowerPoint Templates because,It is Inspired by the indelible Olympic logo this graphic exemplifies the benefits of teamwork. Use our Shapes PowerPoint Templates because,You can blaze a brilliant trail from point to point. Use our Signs PowerPoint Templates because,You have configured your targets, identified your goals as per priority and importance. Use our Business PowerPoint Templates because,Everybody knows The world over it is a priority for many. Along with it there are so many oppurtunities waiting to be utilised Use our Process and Flows PowerPoint Templates because,Clarity of thought has been the key to your growth.Use these PowerPoint slides for presentations relating to abstract, arrow, arrows, business, chart, design, development, diagram, direction, element, flow, flowchart, graph, linear, management, model, motion, organization, plan, process, program, section, segment, set, sign, solution, strategy, symbol, technology. The prominent colors used in the PowerPoint template are Brown, Yellow, Black. People tell us our linear arrows horizontal 3 stages sample flow charts vision PowerPoint Slides are the best it can get when it comes to presenting. The feedback we get is that our arrows PowerPoint templates and PPT Slides provide you with a vast range of viable options. Select the appropriate ones and just fill in your text. People tell us our linear arrows horizontal 3 stages sample flow charts vision PowerPoint Slides are Ritzy. Presenters tell us our business PowerPoint templates and PPT Slides will make the presenter look like a pro even if they are not computer savvy. The feedback we get is that our linear arrows horizontal 3 stages sample flow charts vision PowerPoint Slides are Multicolored. Professionals tell us our design PowerPoint templates and PPT Slides are Elevated. Expose your audience to your brilliance. Our Linear Arrows Horizontal 3 Stages Sample Flow Charts Vision PowerPoint Slides will spotlight you on centrestage.
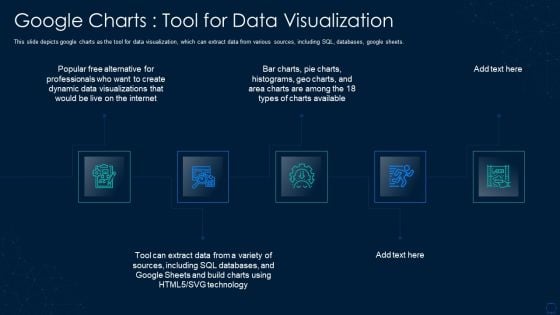
Graphical Representation Of Research IT Google Charts Tool For Data Visualization Introduction PDF
This slide depicts google charts as the tool for data visualization, which can extract data from various sources, including SQL, databases, google sheets. This is a graphical representation of research it google charts tool for data visualization introduction pdf template with various stages. Focus and dispense information on five stages using this creative set, that comes with editable features. It contains large content boxes to add your information on topics like dynamic, databases, sources, technology. You can also showcase facts, figures, and other relevant content using this PPT layout. Grab it now.
Mail With Cross Symbol Vector Icon Ppt PowerPoint Presentation Diagram Graph Charts PDF
Presenting this set of slides with name mail with cross symbol vector icon ppt powerpoint presentation diagram graph charts pdf. This is a three stage process. The stages in this process are mail with cross symbol vector icon. This is a completely editable PowerPoint presentation and is available for immediate download. Download now and impress your audience.
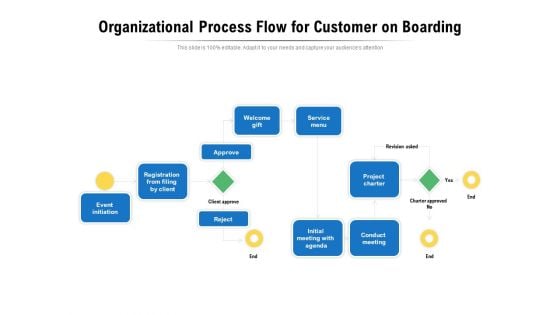
Organizational Process Flow For Customer On Boarding Ppt PowerPoint Presentation Diagram Graph Charts PDF
Persuade your audience using this organizational process flow for customer on boarding ppt powerpoint presentation diagram graph charts pdf. This PPT design covers one stages, thus making it a great tool to use. It also caters to a variety of topics including service menu, project charter, conduct meeting, initial meeting with agenda, registration from filing by client, approve. Download this PPT design now to present a convincing pitch that not only emphasizes the topic but also showcases your presentation skills.

Classification Of Visual Tools With Electronic Presentation And Flip Charts Ppt PowerPoint Presentation File Display PDF
Presenting this set of slides with name classification of visual tools with electronic presentation and flip charts ppt powerpoint presentation file display pdf. This is a five stage process. The stages in this process are electronic presentations, transparencies, flipcharts. This is a completely editable PowerPoint presentation and is available for immediate download. Download now and impress your audience.
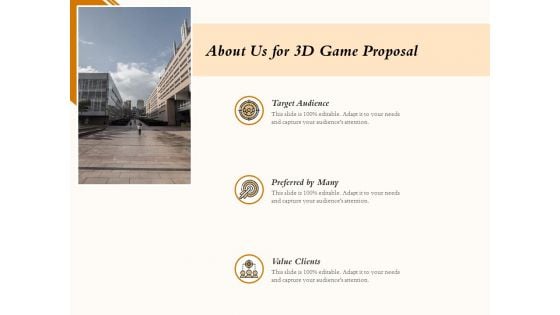
Three Dimensional Games Proposal About Us For 3D Game Proposal Target Ppt Diagram Graph Charts PDF
Presenting this set of slides with name three dimensional games proposal about us for 3d game proposal target ppt diagram graph charts pdf. This is a two stage process. The stages in this process are vision, mission, core values. This is a completely editable PowerPoint presentation and is available for immediate download. Download now and impress your audience.
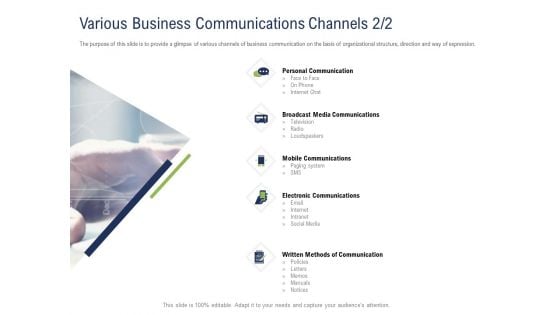
Incremental Decision Making Various Business Communications Channels Media Ppt Diagram Graph Charts PDF
Presenting this set of slides with name incremental decision making various business communications channels media ppt diagram graph charts pdf. This is a five stage process. The stages in this process are communication, broadcast media, mobile, electronic. This is a completely editable PowerPoint presentation and is available for immediate download. Download now and impress your audience.
Vertical And Horizontal Org Charts Ppt PowerPoint Presentation Model Icon PDF
Presenting this set of slides with name vertical and horizontal org charts ppt powerpoint presentation model icon pdf. This is a two stage process. The stages in this process are vertical, horizontal. This is a completely editable PowerPoint presentation and is available for immediate download. Download now and impress your audience.


 Continue with Email

 Home
Home


