Control Chart
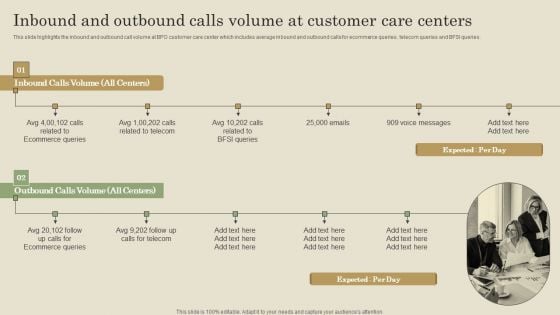
Inbound And Outbound Calls Volume At Customer Care Centers Ppt PowerPoint Presentation Diagram Graph Charts PDF
This slide highlights the inbound and outbound call volume at BPO customer care center which includes average inbound and outbound calls for ecommerce queries , telecom queries and BFSI queries. If your project calls for a presentation, then Slidegeeks is your go to partner because we have professionally designed, easy to edit templates that are perfect for any presentation. After downloading, you can easily edit Inbound And Outbound Calls Volume At Customer Care Centers Ppt PowerPoint Presentation Diagram Graph Charts PDF and make the changes accordingly. You can rearrange slides or fill them with different images. Check out all the handy templates
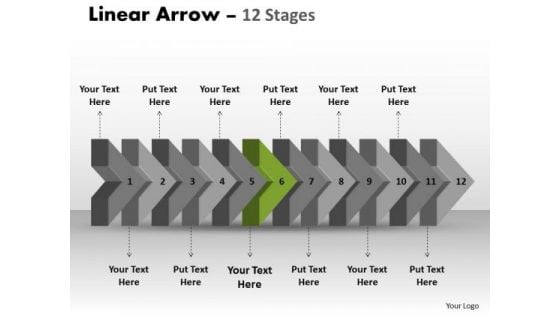
Ppt Theme 3d Illustration Of Straightaway Arrow Flow Activity Charts Diagram 7 Image
We present our PPT Theme 3d illustration of straightaway arrow flow activity charts diagram 7 Image. Use our Arrows PowerPoint Templates because, Like your thoughts arrows are inherently precise and true. Use our Symbol PowerPoint Templates because; represent the progress in our lives. Use our Business PowerPoint Templates because, You have the process in your head, our template design showing will illuminate your thoughts. Use our Process and Flows PowerPoint Templates because, you have analyzed the illness and know the need. Use our Marketing PowerPoint Templates because, now fire the arrows to emblazon the desired path by which you will achieve anticipated results. Use these PowerPoint slides for presentations relating to Aim, Angle, Arrow, Arrowheads, Badge, Banner, Connection, Curve, Design, Direction, Download, Element, Fuchsia, Icon, Illustration, Indicator, Internet, Label, Link, Magenta, Mark, Marker, Next, Object, Orientation, Pointer, Shadow, Shape, Signs, Symbol. The prominent colors used in the PowerPoint template are Green, Gray, and Black Dare to dream with our Ppt Theme 3d Illustration Of Straightaway Arrow Flow Activity Charts Diagram 7 Image. You will come out on top.
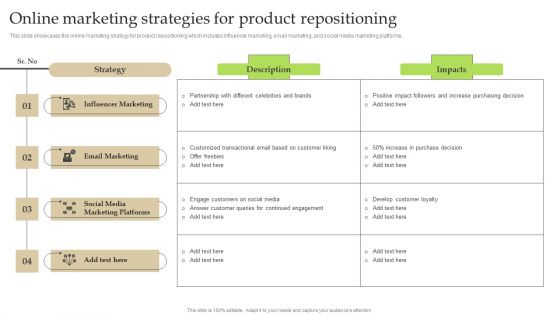
Online Marketing Strategies For Product Repositioning Ppt PowerPoint Presentation Diagram Graph Charts PDF
This slide showcases the online marketing strategy for product repositioning which includes influencer marketing, email marketing, and social media marketing platforms. Present like a pro with Online Marketing Strategies For Product Repositioning Ppt PowerPoint Presentation Diagram Graph Charts PDF Create beautiful presentations together with your team, using our easy-to-use presentation slides. Share your ideas in real-time and make changes on the fly by downloading our templates. So whether you are in the office, on the go, or in a remote location, you can stay in sync with your team and present your ideas with confidence. With Slidegeeks presentation got a whole lot easier. Grab these presentations today.
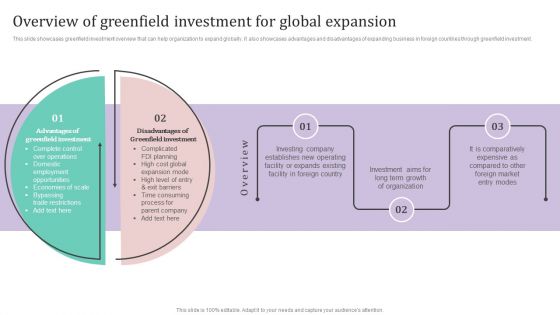
Overview Of Greenfield Investment For Global Expansion Ppt PowerPoint Presentation Diagram Graph Charts PDF
This slide showcases greenfield investment overview that can help organization to expand globally. It also showcases advantages and disadvantages of expanding business in foreign countries through greenfield investment.The best PPT templates are a great way to save time, energy, and resources. Slidegeeks have 100precent editable powerpoint slides making them incredibly versatile. With these quality presentation templates, you can create a captivating and memorable presentation by combining visually appealing slides and effectively communicating your message. Download Overview Of Greenfield Investment For Global Expansion Ppt PowerPoint Presentation Diagram Graph Charts PDF from Slidegeeks and deliver a wonderful presentation.
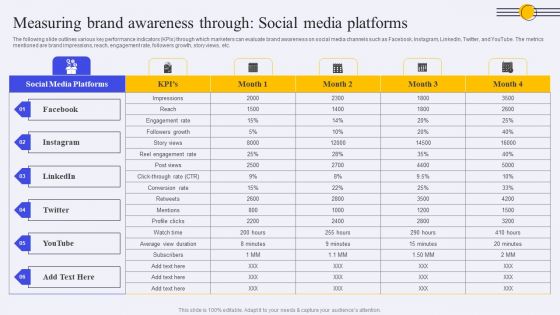
Measuring Brand Awareness Through Social Media Platforms Ppt PowerPoint Presentation Diagram Graph Charts PDF
The following slide outlines various key performance indicators KPIs through which marketers can evaluate brand awareness on social media channels such as Facebook, Instagram, LinkedIn, Twitter, and YouTube. The metrics mentioned are brand impressions, reach, engagement rate, followers growth, story views, etc. The best PPT templates are a great way to save time, energy, and resources. Slidegeeks have 100 percent editable powerpoint slides making them incredibly versatile. With these quality presentation templates, you can create a captivating and memorable presentation by combining visually appealing slides and effectively communicating your message. Download Measuring Brand Awareness Through Social Media Platforms Ppt PowerPoint Presentation Diagram Graph Charts PDF from Slidegeeks and deliver a wonderful presentation.
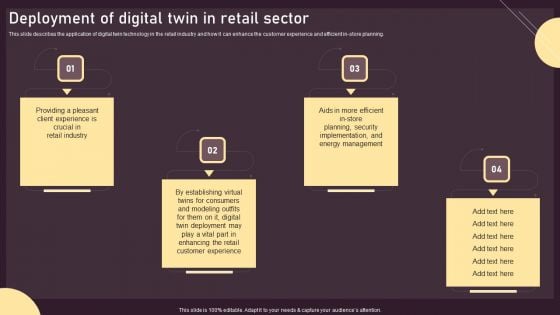
Deployment Of Digital Twin In Retail Sector Ppt PowerPoint Presentation Diagram Graph Charts PDF
This slide describes the application of digital twin technology in the retail industry and how it can enhance the customer experience and efficient in store planning. This Deployment Of Digital Twin In Retail Sector Ppt PowerPoint Presentation Diagram Graph Charts PDF from Slidegeeks makes it easy to present information on your topic with precision. It provides customization options, so you can make changes to the colors, design, graphics, or any other component to create a unique layout. It is also available for immediate download, so you can begin using it right away. Slidegeeks has done good research to ensure that you have everything you need to make your presentation stand out. Make a name out there for a brilliant performance.
3 Stages Parallel Organizational Charts Real Estate Agent Business Plan PowerPoint Slides
We present our 3 stages parallel organizational charts real estate agent business plan PowerPoint Slides.Use our Business PowerPoint Templates because Our PowerPoint Templates and Slides are effectively colour coded to prioritise your plans They automatically highlight the sequence of events you desire. Use our Gear Wheels PowerPoint Templates because Timeline crunches are a fact of life. Meet all deadlines using our PowerPoint Templates and Slides. Use our Success PowerPoint Templates because Our PowerPoint Templates and Slides will provide you the cutting edge. Slice through the doubts in the minds of your listeners. Download our Arrows PowerPoint Templates because Our PowerPoint Templates and Slides offer you the needful to organise your thoughts. Use them to list out your views in a logical sequence. Download and present our Process and Flows PowerPoint Templates because Your audience will believe you are the cats whiskers.Use these PowerPoint slides for presentations relating to Abstract, account, arrow, background, business, chart, communication, competition, concept, corporate, economy, finance, financial, future, gear, illustration, marketing, presentation, profit, progress, report, results, statistic, stock, strategy, success, tax, trade, up. The prominent colors used in the PowerPoint template are Green, Gray, Black. Spread awareness of digital tools. Whatever the divide our PT&s will bridge it.
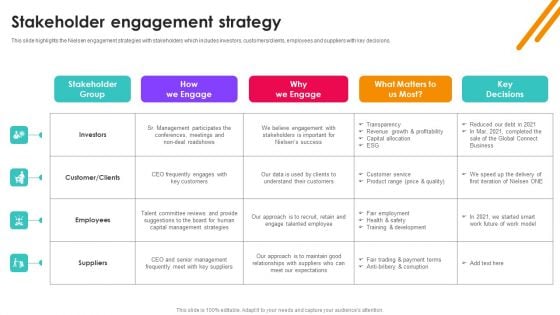
Nielsen Business Profile Stakeholder Engagement Strategy Ppt PowerPoint Presentation Diagram Graph Charts PDF
This slide highlights the Nielsen engagement strategies with stakeholders which includes investors, customers or clients, employees and suppliers with key decisions. The Nielsen Business Profile Stakeholder Engagement Strategy Ppt PowerPoint Presentation Diagram Graph Charts PDF is a compilation of the most recent design trends as a series of slides. It is suitable for any subject or industry presentation, containing attractive visuals and photo spots for businesses to clearly express their messages. This template contains a variety of slides for the user to input data, such as structures to contrast two elements, bullet points, and slides for written information. Slidegeeks is prepared to create an impression.
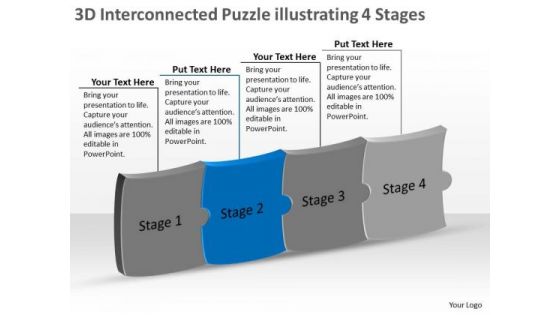
3d Interconnected Puzzle Illustrating 4 Stages Flow Charts Vision PowerPoint Templates
We present our 3d interconnected puzzle illustrating 4 stages flow charts vision PowerPoint templates.Use our Success PowerPoint Templates because, The success of your venture depends on the performance of every team member. Use our Puzzles or Jigsaws PowerPoint Templates because,This helps you to comprehend your plan to get the entire act together. Use our Shapes PowerPoint Templates because,This diagram helps in examine each brilliant thought in thorough detail highlighting all the pros and cons as minutely as possible. Use our Business PowerPoint Templates because,The fruits of your labour are beginning to show.Enlighten them on the great plans you have for their enjoyment Use our Metaphors-Visual Concepts PowerPoint Templates because,This template helps you to delve on these thoughts and brief your team on the value of your depth of understanding of the subject.Use these PowerPoint slides for presentations relating to Assembly, complete, concept, copy, finish, finished, fit, idea, interlock, jigsaw, match, metaphor, mystery, outline, patience, picture, piece, play, playing, point, pointing, problem, puzzle, quiz, skill, solution, solved, space, struggle, success, support, teamwork. The prominent colors used in the PowerPoint template are Blue, Gray, Black Stay up ahead with our 3d Interconnected Puzzle Illustrating 4 Stages Flow Charts Vision PowerPoint Templates. Your thoughts will score above par.
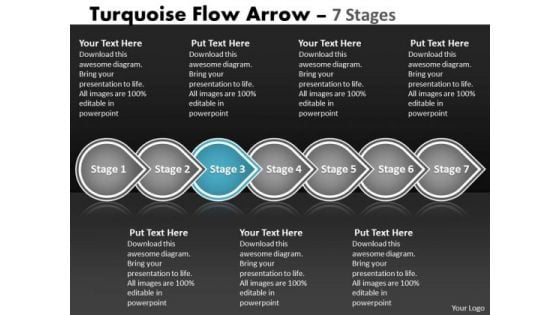
Ppt Theme Continual Seven Phase Diagram Linear Flow Method Charts 4 Design
We present our PPT Theme continual seven phase diagram linear Flow method charts 4 designs. Use our Advertising PowerPoint Templates because; emphasize the benefits of healthy food habits and lifestyles in respect of vital organs of the human anatomy. Use our Shapes PowerPoint Templates because, now fire the arrows to emblazon the desired path by which you will achieve anticipated results. Use our Signs PowerPoint Templates because, Build on your foundation or prepare for change ahead to enhance the future. Use our Marketing PowerPoint Templates because; Get your listeners to put on their thinking caps. Use our Business PowerPoint Templates because; Highlight these individual targets and the paths to their achievement. Use these PowerPoint slides for presentations relating to advertising, arrow, background, banner, bookmark, choice, concept, creative, design, direction, flow, label, layout, manual, marketing, modern, process, product, promotion, sequence, simple, special, step, symbol, tab, tag, turquoise, tutorial, two, vector, . The prominent colors used in the PowerPoint template are Blue, Gray, and White Aim for the skies with our Ppt Theme Continual Seven Phase Diagram Linear Flow Method Charts 4 Design. You will come out on top.
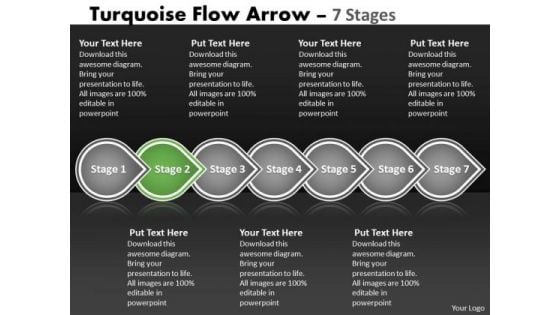
Ppt Theme Continual Seven Phase Diagram Linear Flow Method Charts 3 Design
We present our PPT Theme continual seven phase diagram linear Flow method charts 3 designs. Use our Advertising PowerPoint Templates because, Illuminate the spiritual brilliance of Jesus and shower the love for mankind he showed even while being crucified. Use our Shapes PowerPoint Templates because; illustrate how each element flows seamlessly onto the next stage. Use our Signs PowerPoint Templates because; educate your staff on the means to provide the required support for speedy recovery. Use our Marketing PowerPoint Templates because, your foot is on the pedal and your company is purring along smoothly. Use our Business PowerPoint Templates because, But you have the ideas, you have got a brainwave. Use these PowerPoint slides for presentations relating to advertising, arrow, background, banner, bookmark, choice, concept, creative, design, direction, flow, label, layout, manual, marketing, modern, process, product, promotion, sequence, simple, special, step, symbol, tab, tag, turquoise, tutorial, two, vector, . The prominent colors used in the PowerPoint template are Green, Gray, and White Exhibit your erudition on our Ppt Theme Continual Seven Phase Diagram Linear Flow Method Charts 3 Design. Give the audience a taste of your profound knowledge.
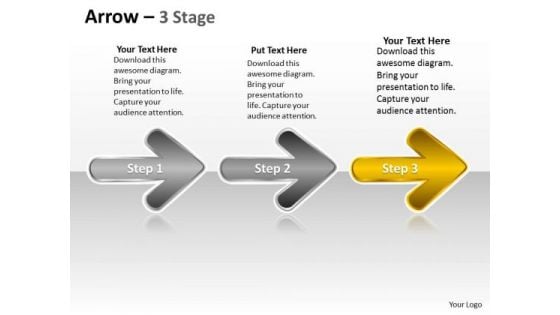
Ppt Series Of Continual Free Custom Presentation PowerPoint Charts Plan 4 Image
We present our PPT series of continual free custom presentation PowerPoint charts plan 4 Image. Use our Symbol PowerPoint Templates because, Brilliant ideas are your forte. Use our Shapes PowerPoint Templates because, Focus on each one and investigate which one would be the best fit for your needs. Use our Signs PowerPoint Templates because; Focus the light on the path to sure shot success. Use our Business PowerPoint Templates because; now imprint them on the minds of your audience via our slides. Use our Arrows PowerPoint Templates because; educate your staff on the means to provide the required support for speedy recovery. Use these PowerPoint slides for presentations relating to arrow, arrowheads, badge, banner, cerulean, colored, colorful, connection, design element, designator, directional, download, emblem, indicator, interface, internet, magenta, marker, matted, menu tool, navigation panel, next, orientation, page site, pictogram, pointer, sign. The prominent colors used in the PowerPoint template are Yellow, Gray, and White Subscribe to our Ppt Series Of Continual Free Custom Presentation PowerPoint Charts Plan 4 Image and receive success. Be assured of finding the best projection to highlight your words.
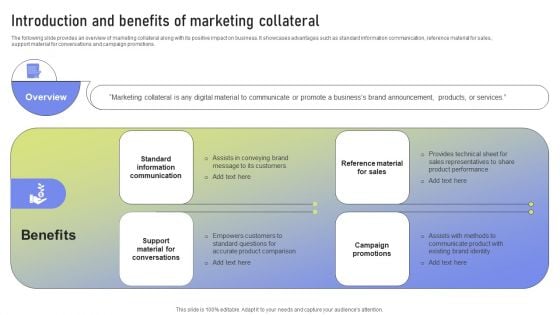
Introduction And Benefits Of Marketing Collateral Ppt PowerPoint Presentation Diagram Graph Charts PDF
The following slide provides an overview of marketing collateral along with its positive impact on business. It showcases advantages such as standard information communication, reference material for sales, support material for conversations and campaign promotions. Present like a pro with Introduction And Benefits Of Marketing Collateral Ppt PowerPoint Presentation Diagram Graph Charts PDF Create beautiful presentations together with your team, using our easy to use presentation slides. Share your ideas in real time and make changes on the fly by downloading our templates. So whether you are in the office, on the go, or in a remote location, you can stay in sync with your team and present your ideas with confidence. With Slidegeeks presentation got a whole lot easier. Grab these presentations today.
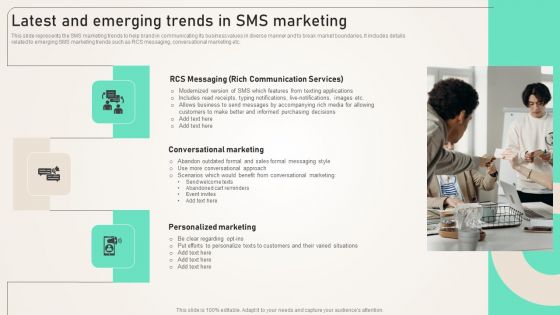
Latest And Emerging Trends In SMS Marketing Ppt PowerPoint Presentation Diagram Graph Charts PDF
This slide represents the SMS marketing trends to help brand in communicating its business values in diverse manner and to break market boundaries. It includes details related to emerging SMS marketing trends such as RCS messaging, conversational marketing etc. Present like a pro with Latest And Emerging Trends In SMS Marketing Ppt PowerPoint Presentation Diagram Graph Charts PDF Create beautiful presentations together with your team, using our easy to use presentation slides. Share your ideas in real time and make changes on the fly by downloading our templates. So whether you are in the office, on the go, or in a remote location, you can stay in sync with your team and present your ideas with confidence. With Slidegeeks presentation got a whole lot easier. Grab these presentations today.
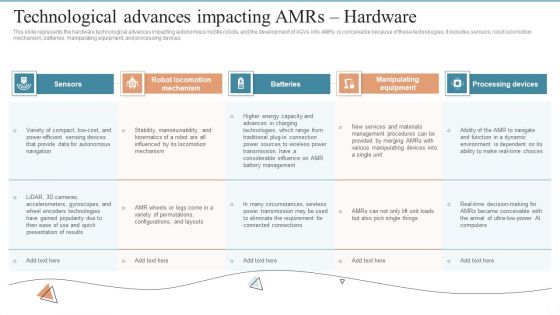
AMR Robot Technological Advances Impacting Amrs Hardware Ppt PowerPoint Presentation Diagram Graph Charts PDF
This slide represents the hardware technological advances impacting autonomous mobile robots, and the development of AGVs into AMRs is conceivable because of these technologies. It includes sensors, robot locomotion mechanism, batteries, manipulating equipment, and processing devices. Present like a pro with AMR Robot Technological Advances Impacting Amrs Hardware Ppt PowerPoint Presentation Diagram Graph Charts PDF Create beautiful presentations together with your team, using our easy to use presentation slides. Share your ideas in real time and make changes on the fly by downloading our templates. So whether you are in the office, on the go, or in a remote location, you can stay in sync with your team and present your ideas with confidence. With Slidegeeks presentation got a whole lot easier. Grab these presentations today.

Presenting Deals And Offers To Lure Prospects Ppt PowerPoint Presentation Diagram Graph Charts PDF

Potential Segment Analysis For Amazon Customer Base Ppt PowerPoint Presentation Diagram Graph Charts PDF
This slide provides information regarding potential segments assessed across the customer base in terms of market size, recurring purchases, percent of online buyers, conversion rate, and purchasing power. Present like a pro with Potential Segment Analysis For Amazon Customer Base Ppt PowerPoint Presentation Diagram Graph Charts PDF Create beautiful presentations together with your team, using our easy to use presentation slides. Share your ideas in real time and make changes on the fly by downloading our templates. So whether you are in the office, on the go, or in a remote location, you can stay in sync with your team and present your ideas with confidence. With Slidegeeks presentation got a whole lot easier. Grab these presentations today.
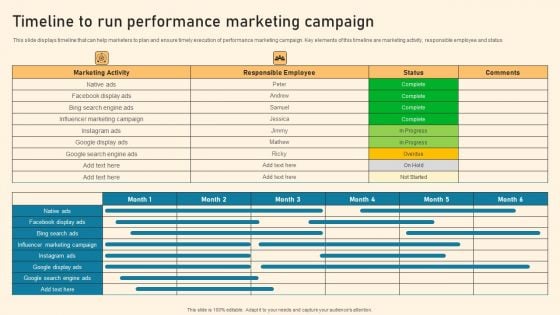
Timeline To Run Performance Marketing Campaign Ppt PowerPoint Presentation Diagram Graph Charts PDF
This slide displays timeline that can help marketers to plan and ensure timely execution of performance marketing campaign. Key elements of this timeline are marketing activity, responsible employee and status The Timeline To Run Performance Marketing Campaign Ppt PowerPoint Presentation Diagram Graph Charts PDF is a compilation of the most recent design trends as a series of slides. It is suitable for any subject or industry presentation, containing attractive visuals and photo spots for businesses to clearly express their messages. This template contains a variety of slides for the user to input data, such as structures to contrast two elements, bullet points, and slides for written information. Slidegeeks is prepared to create an impression.
Customizable Circle Charts Infographic Ppt PowerPoint Presentation Complete Deck With Slides
Improve your presentation delivery using this Customizable Circle Charts Infographic Ppt PowerPoint Presentation Complete Deck With Slides. Support your business vision and objectives using this well-structured PPT deck. This template offers a great starting point for delivering beautifully designed presentations on the topic of your choice. Comprising twelve this professionally designed template is all you need to host discussion and meetings with collaborators. Each slide is self-explanatory and equipped with high-quality graphics that can be adjusted to your needs. Therefore, you will face no difficulty in portraying your desired content using this PPT slideshow. This PowerPoint slideshow contains every important element that you need for a great pitch. It is not only editable but also available for immediate download and utilization. The color, font size, background, shapes everything can be modified to create your unique presentation layout. Therefore, download it now.
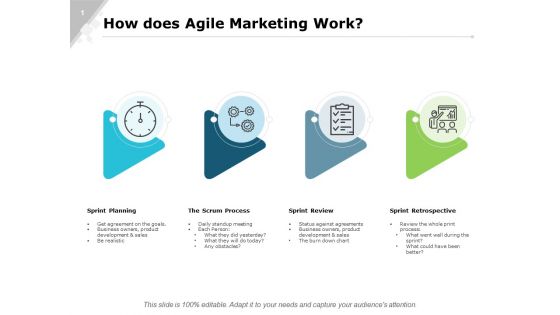
How Does Agile Marketing Work Ppt PowerPoint Presentation Diagram Graph Charts
This is a how does agile marketing work ppt powerpoint presentation diagram graph charts. This is a four stage process. The stages in this process are business, planning, strategy, marketing, management.
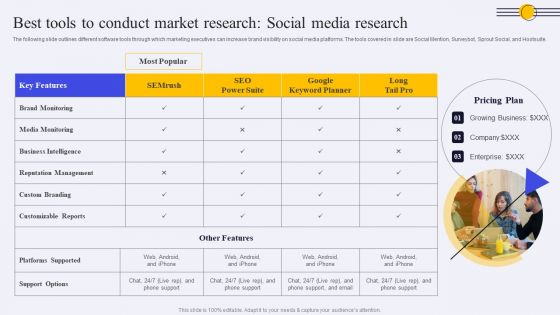
Best Tools To Conduct Market Research Social Media Research Ppt PowerPoint Presentation Diagram Graph Charts PDF
The following slide outlines different software tools through which marketing executives can increase brand visibility on social media platforms. The tools covered in slide are Social Mention, Surveybot, Sprout Social, and Hootsuite. This Best Tools To Conduct Market Research Social Media Research Ppt PowerPoint Presentation Diagram Graph Charts PDF from Slidegeeks makes it easy to present information on your topic with precision. It provides customization options, so you can make changes to the colors, design, graphics, or any other component to create a unique layout. It is also available for immediate download, so you can begin using it right away. Slidegeeks has done good research to ensure that you have everything you need to make your presentation stand out. Make a name out there for a brilliant performance.

Project Conclusion Report Performance Analysis Ppt PowerPoint Presentation Diagram Graph Charts
This is a project conclusion report performance analysis ppt powerpoint presentation diagram graph charts. The topics discussed in this diagram are marketing, business, management, planning, strategy This is a completely editable PowerPoint presentation, and is available for immediate download.
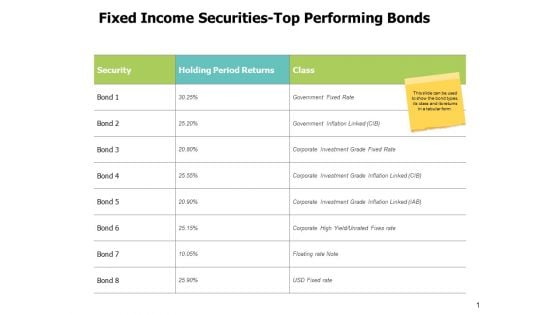
Fixed Income Securities Top Performing Bonds Ppt PowerPoint Presentation Diagram Graph Charts
This is a fixed income securities top performing bonds ppt powerpoint presentation diagram graph charts. This is a two stage process. The stages in this process are compare, marketing, business, management, planning.
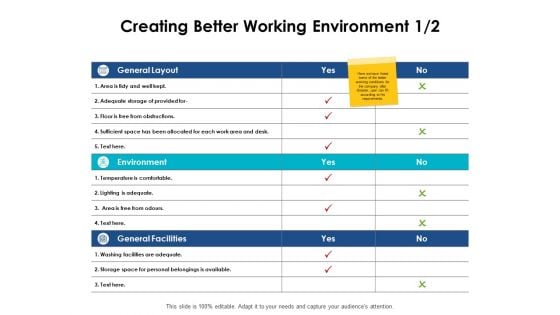
Creating Better Working Environment Storage Ppt PowerPoint Presentation Diagram Graph Charts
Presenting this set of slides with name creating better working environment storage ppt powerpoint presentation diagram graph charts. The topics discussed in these slides are strength, marketing, business, management, planning. This is a completely editable PowerPoint presentation and is available for immediate download. Download now and impress your audience.
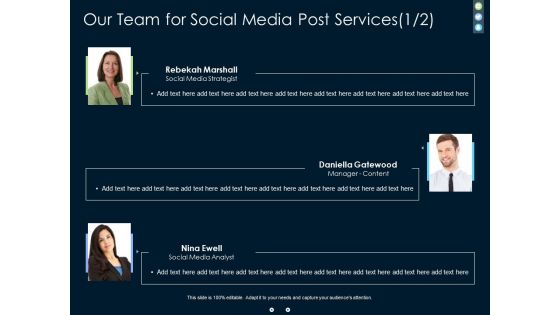
Our Team For Social Media Post Services Communication Ppt PowerPoint Presentation Diagram Graph Charts
Presenting this set of slides with name our team for social media post services communication ppt powerpoint presentation diagram graph charts. This is a one stage process. The stages in this process are our team, social media, post services. This is a completely editable PowerPoint presentation and is available for immediate download. Download now and impress your audience.
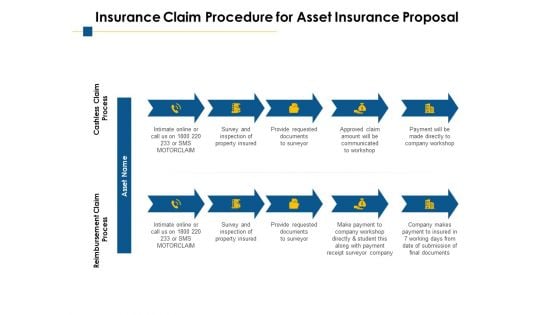
Insurance Claim Procedure For Asset Insurance Proposal Ppt PowerPoint Presentation Diagram Graph Charts
Presenting this set of slides with name insurance claim procedure for asset insurance proposal ppt powerpoint presentation diagram graph charts. This is a ten stage process. The stages in this process are reimbursement claim process, cashless claim process, asset. This is a completely editable PowerPoint presentation and is available for immediate download. Download now and impress your audience.

Business Associate Shaking Hands After A Deal Ppt PowerPoint Presentation Diagram Graph Charts
Presenting this set of slides with name business associate shaking hands after a deal ppt powerpoint presentation diagram graph charts. This is a one stage process. The stage in this process is business associate shaking hands after a deal. This is a completely editable PowerPoint presentation and is available for immediate download. Download now and impress your audience.
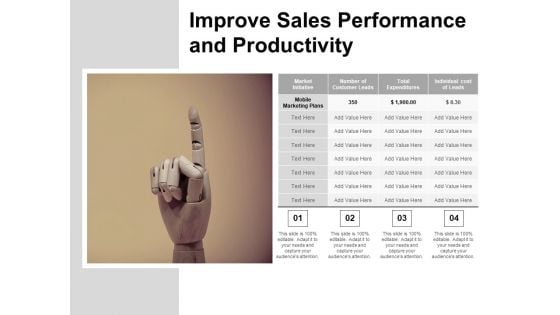
Improve Sales Performance And Productivity Ppt PowerPoint Presentation Diagram Graph Charts
This is a improve sales performance and productivity ppt powerpoint presentation diagram graph charts. This is a four stage process. The stages in this process are marketing effort, branding initiative, marketing initiatives.
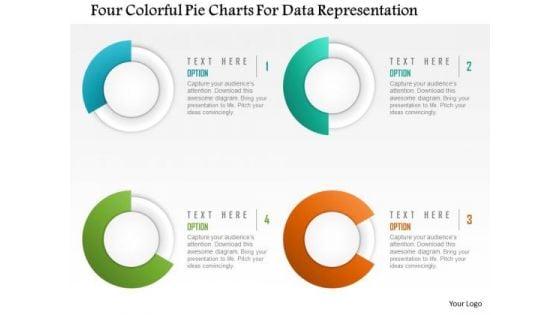
Business Diagram Four Colorful Pie Charts For Data Representation Presentation Template
This diagram is designed with four colorful pie charts. Download this diagram to analyze the key points. This diagram offers a way for your audience to visually conceptualize the process.
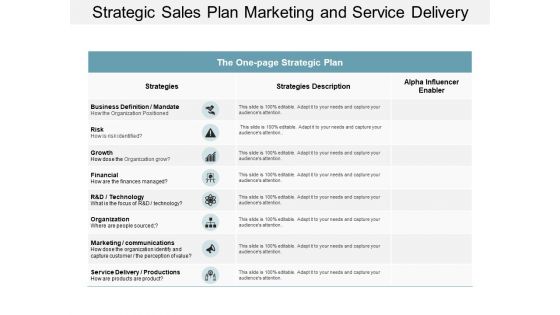
Strategic Sales Plan Marketing And Service Delivery Ppt Powerpoint Presentation Diagram Graph Charts
This is a strategic sales plan marketing and service delivery ppt powerpoint presentation diagram graph charts. This is a three stage process. The stages in this process are one page strategy, one page plan, one page approach.
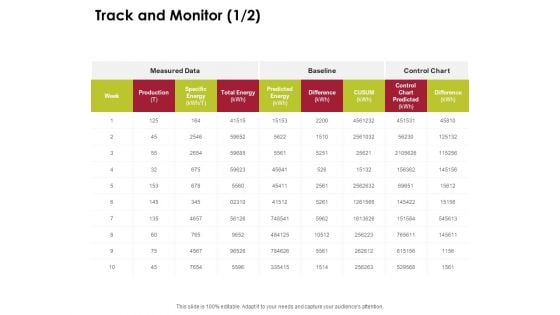
Power Management System And Technology Track And Monitor Production Ppt PowerPoint Presentation Inspiration Gridlines PDF
Presenting this set of slides with name power management system and technology track and monitor production ppt powerpoint presentation inspiration gridlines pdf. The topics discussed in these slides are week, production, control chart, baseline, total energy, specific energy, control chart predicted, difference. This is a completely editable PowerPoint presentation and is available for immediate download. Download now and impress your audience.
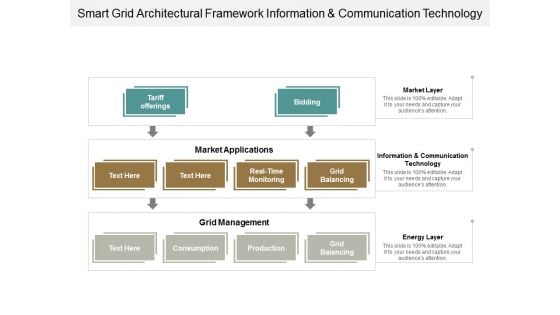
Smart Grid Architectural Framework Information And Communication Technology Ppt Powerpoint Presentation Diagram Graph Charts
This is a smart grid architectural framework information and communication technology ppt powerpoint presentation diagram graph charts. This is a three stage process. The stages in this process are functional architecture, functional planning, functional designing.
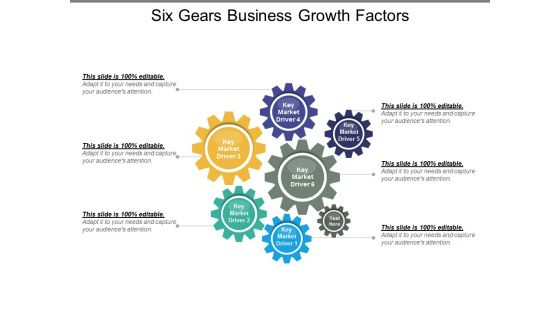
Six Gears Business Growth Factors Ppt PowerPoint Presentation Diagram Graph Charts
This is a six gears business growth factors ppt powerpoint presentation diagram graph charts. This is a seven stage process. The stages in this process are growth opportunity, growth drivers, market drivers.
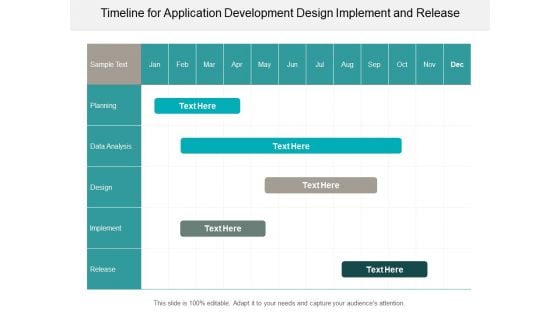
Timeline For Application Development Design Implement And Release Ppt PowerPoint Presentation Diagram Graph Charts
This is a timeline for application development design implement and release ppt powerpoint presentation diagram graph charts. This is a five stage process. The stages in this process are overlapping timeline, overlapping roadmap, overlapping linear roadmap.

About Me Personal Profile I30 Ppt Powerpoint Presentation Diagram Graph Charts
Boost your pitch with our creative About Me Personal Profile I30 Ppt Powerpoint Presentation Diagram Graph Charts. Deliver an awe-inspiring pitch that will mesmerize everyone. Using these presentation templates you will surely catch everyones attention. You can browse the ppts collection on our website. We have researchers who are experts at creating the right content for the templates. So you do not have to invest time in any additional work. Just grab the template now and use them. Cover every possible aspect with our About Me Personal Profile I30 PPT PowerPoint Presentation Diagram Graph Charts. Address all outcomes effectively.
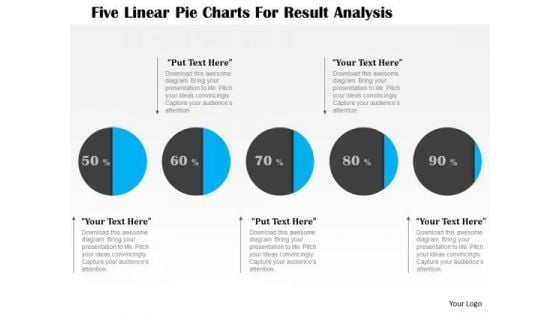
Business Diagram Five Linear Pie Charts For Result Analysis Presentation Template
This business diagram displays graphic of five staged process flow diagram. This PPT slide contains the concept of business data representation. Use this diagram to build professional presentation for your viewers.
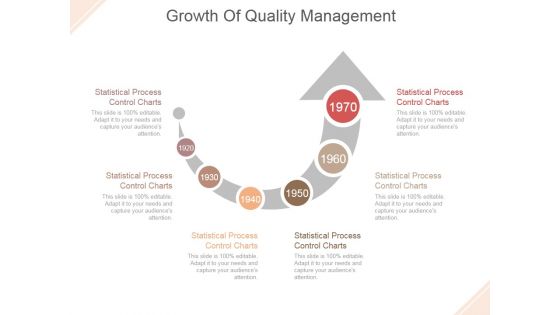
Growth Of Quality Management Ppt PowerPoint Presentation Picture
This is a growth of quality management ppt powerpoint presentation picture. This is a six stage process. The stage in this process are statistical process control charts.
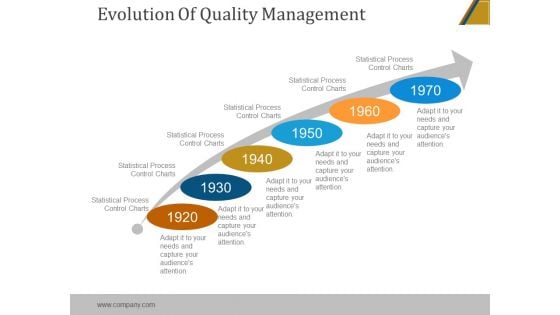
Evolution Of Quality Management Ppt PowerPoint Presentation Files
This is a evolution of quality management ppt powerpoint presentation files. This is a six stage process. The stages in this process are statistical process control charts.
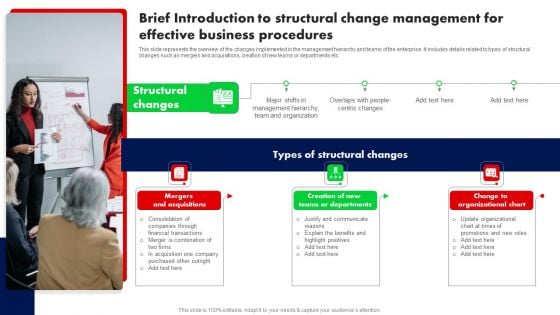
Brief Introduction To Structural Change Management For Effective Business Procedures Ppt PowerPoint Presentation Diagram Graph Charts PDF
This slide represents the overview of the changes implemented in the management hierarchy and teams of the enterprise. It includes details related to types of structural changes such as mergers and acquisitions, creation of new teams or departments etc. Want to ace your presentation in front of a live audience Our Brief Introduction To Structural Change Management For Effective Business Procedures Ppt PowerPoint Presentation Diagram Graph Charts PDF can help you do that by engaging all the users towards you. Slidegeeks experts have put their efforts and expertise into creating these impeccable powerpoint presentations so that you can communicate your ideas clearly. Moreover, all the templates are customizable, and easy to edit and downloadable. Use these for both personal and commercial use.
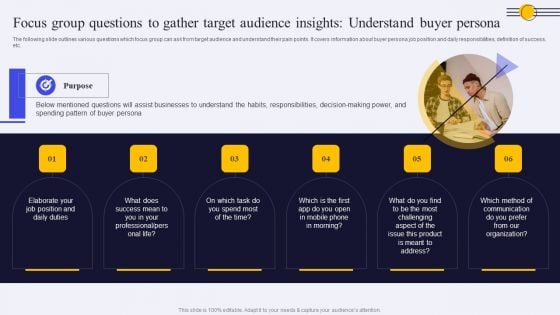
Focus Group Questions To Gather Target Audience Insights Understand Buyer Persona Ppt PowerPoint Presentation Diagram Graph Charts PDF
The following slide outlines various questions which focus group can ask from target audience and understand their pain points. It covers information about buyer persona job position and daily responsibilities, definition of success, etc. Do you have to make sure that everyone on your team knows about any specific topic I yes, then you should give Focus Group Questions To Gather Target Audience Insights Understand Buyer Persona Ppt PowerPoint Presentation Diagram Graph Charts PDF a try. Our experts have put a lot of knowledge and effort into creating this impeccable Focus Group Questions To Gather Target Audience Insights Understand Buyer Persona Ppt PowerPoint Presentation Diagram Graph Charts PDF. You can use this template for your upcoming presentations, as the slides are perfect to represent even the tiniest detail. You can download these templates from the Slidegeeks website and these are easy to edit. So grab these today.
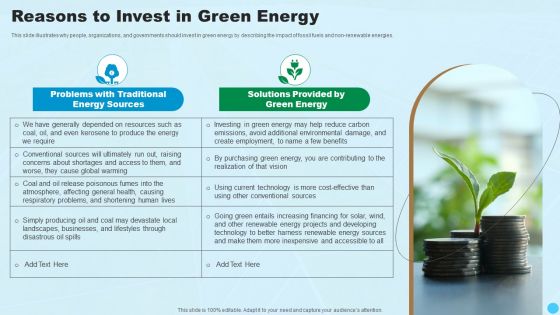
Reasons To Invest In Green Energy Clean And Renewable Energy Ppt PowerPoint Presentation Diagram Graph Charts PDF
This slide illustrates why people, organizations, and governments should invest in green energy by describing the impact of fossil fuels and non-renewable energies.Presenting Reasons To Invest In Green Energy Clean And Renewable Energy Ppt PowerPoint Presentation Diagram Graph Charts PDF to provide visual cues and insights. Share and navigate important information on two stages that need your due attention. This template can be used to pitch topics like Problems Traditional, Energy Sources, Solutions Provided. In addtion, this PPT design contains high resolution images, graphics, etc, that are easily editable and available for immediate download.
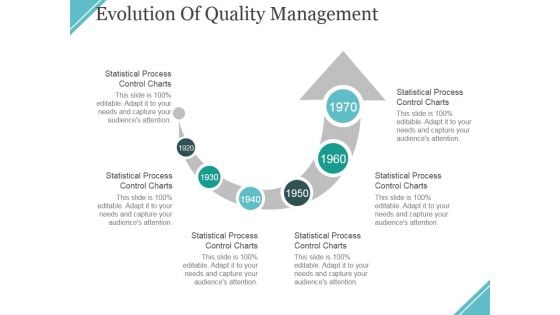
Evolution Of Quality Management Ppt PowerPoint Presentation Inspiration Demonstration
This is a evolution of quality management ppt powerpoint presentation inspiration demonstration. This is a six stage process. The stages in this process are statistical process control charts, arrows, business, marketing, management.
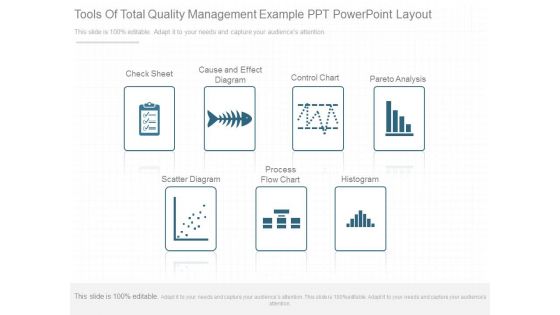
Tools Of Total Quality Management Example Ppt Powerpoint Layout
This is a tools of total quality management example ppt powerpoint layout. This is a seven stage process. The stages in this process are check sheet, cause and effect diagram, control chart, pareto analysis, scatter diagram, process flow chart, histogram.
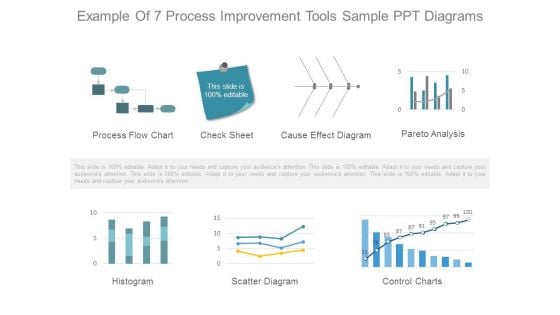
Example Of 7 Process Improvement Tools Sample Ppt Diagrams
This is a example of 7 process improvement tools sample ppt diagrams. This is a seven stage process. The stages in this process are process flow chart, check sheet, cause effect diagram, pareto analysis, histogram, scatter diagram, control charts.
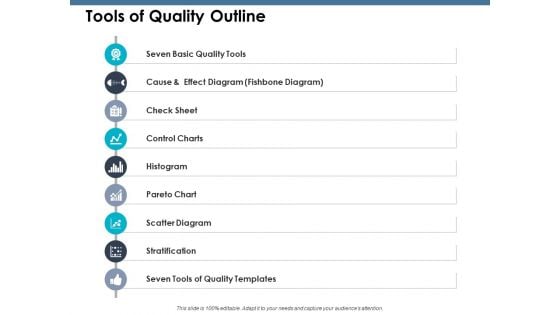
Tools Of Quality Outline Ppt PowerPoint Presentation Ideas Good
This is a tools of quality outline ppt powerpoint presentation ideas good. This is a nine stage process. The stages in this process are control charts, stratification, pareto chart, check sheet.
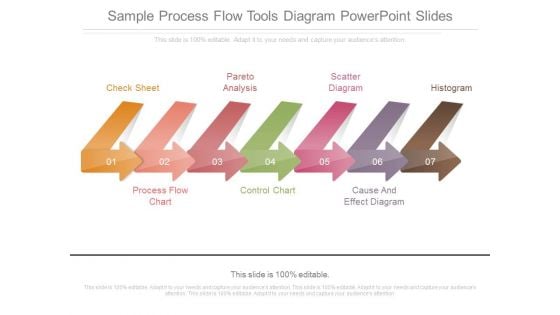
Sample Process Flow Tools Diagram Powerpoint Slides
This is a sample process flow tools diagram powerpoint slides. This is a seven stage process. The stages in this process are check sheet, process flow chart, pareto analysis, control chart, scatter diagram, cause and effect diagram, histogram.
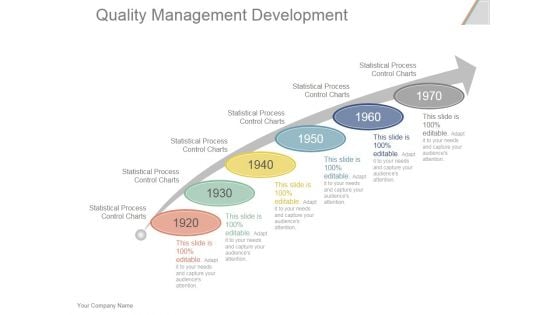
Quality Management Development Ppt PowerPoint Presentation Deck
This is a quality management development ppt powerpoint presentation deck. This is a six stage process. The stages in this process are statistical process control charts, business, strategy, time planning.
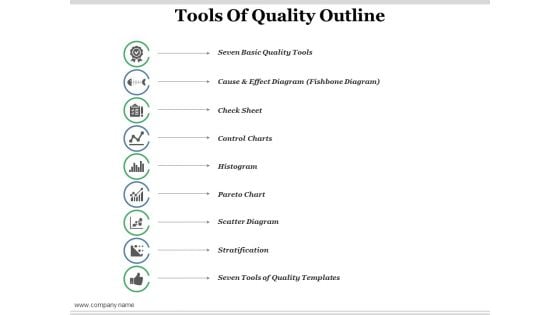
Tools Of Quality Outline Ppt PowerPoint Presentation Summary Introduction
This is a tools of quality outline ppt powerpoint presentation summary introduction. This is a nine stage process. The stages in this process are stratification, scatter diagram, histogram, control charts, seven basic quality tools.
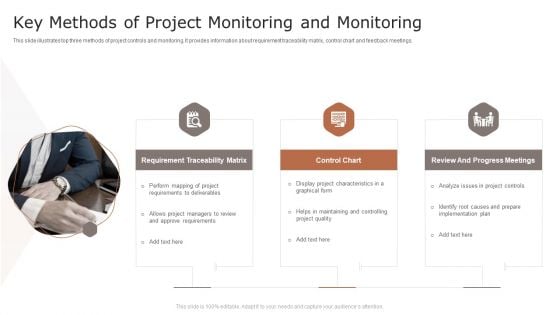
Key Methods Of Project Monitoring And Monitoring Ppt Summary File Formats PDF
This slide illustrates top three methods of project controls and monitoring. It provides information about requirement traceability matrix, control chart and feedback meetings. Persuade your audience using this Key Methods Of Project Monitoring And Monitoring Ppt Summary File Formats PDF. This PPT design covers three stages, thus making it a great tool to use. It also caters to a variety of topics including Requirement Traceability Matrix, Control Chart, Review And Progress. Download this PPT design now to present a convincing pitch that not only emphasizes the topic but also showcases your presentation skills.
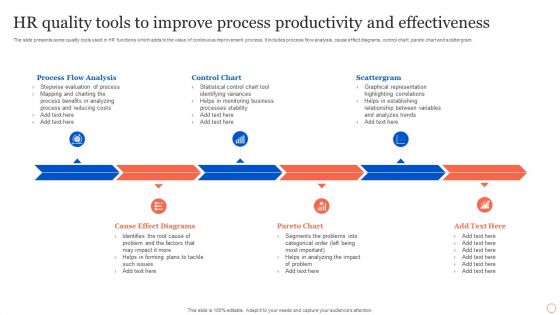
HR Quality Tools To Improve Process Productivity And Effectiveness Ideas PDF
The slide presents some quality tools used in HR functions which adds to the value of continuous improvement process. It includes process flow analysis, cause effect diagrams, control chart, pareto chart and scattergram. Presenting HR Quality Tools To Improve Process Productivity And Effectiveness Ideas PDF to dispense important information. This template comprises six stages. It also presents valuable insights into the topics including Control Chart, Scattergram, Process Flow Analysis, Cause Effect Diagrams. This is a completely customizable PowerPoint theme that can be put to use immediately. So, download it and address the topic impactfully.
Tracking Energy Consumption Track And Monitor Baseline Ppt Infographic Template Picture PDF
Deliver and pitch your topic in the best possible manner with this tracking energy consumption track and monitor baseline ppt infographic template picture pdf. Use them to share invaluable insights on measured data, baseline, control chart and impress your audience. This template can be altered and modified as per your expectations. So, grab it now.
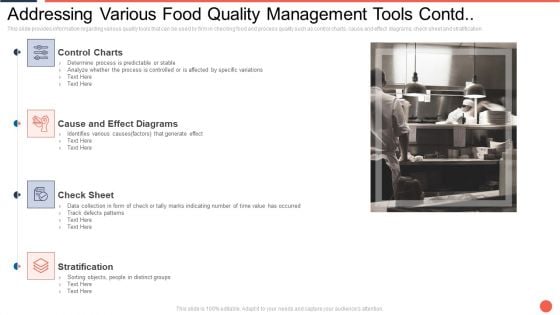
Addressing Various Food Quality Management Tools Contd Assuring Food Quality And Hygiene Introduction PDF
This slide provides information regarding various quality tools that can be used by firm in checking food and process quality such as control charts, cause and effect diagrams, check sheet and stratification. This is a addressing various food quality management tools contd assuring food quality and hygiene introduction pdf template with various stages. Focus and dispense information on four stages using this creative set, that comes with editable features. It contains large content boxes to add your information on topics like control charts, cause and effect diagrams, check sheet, stratification. You can also showcase facts, figures, and other relevant content using this PPT layout. Grab it now.
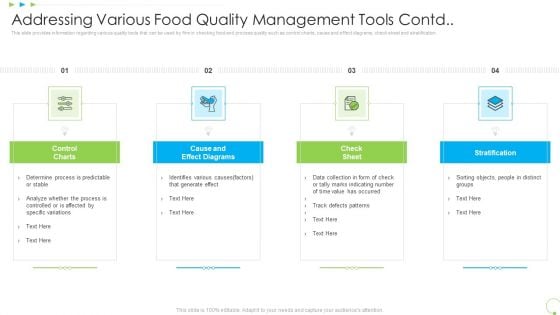
Addressing Various Food Quality Management Tools Contd Uplift Food Production Company Quality Standards Mockup PDF
This slide provides information regarding various quality tools that can be used by firm in checking food and process quality such as control charts, cause and effect diagrams, check sheet and stratification. This is a addressing various food quality management tools contd uplift food production company quality standards mockup pdf template with various stages. Focus and dispense information on four stages using this creative set, that comes with editable features. It contains large content boxes to add your information on topics like control charts, cause and effect diagrams, check sheet, stratification. You can also showcase facts, figures, and other relevant content using this PPT layout. Grab it now.
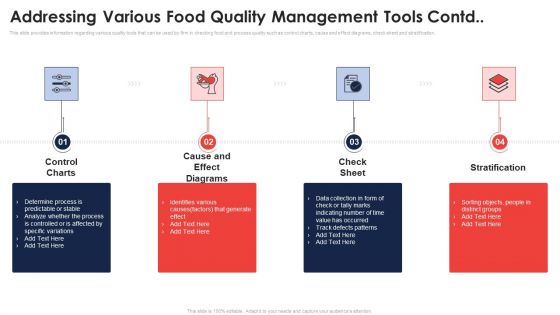
Addressing Various Food Quality Management Tools Contd Application Of Quality Management For Food Processing Companies Template PDF
This slide provides information regarding various quality tools that can be used by firm in checking food and process quality such as control charts, cause and effect diagrams, check sheet and stratification. This is a addressing various food quality management tools contd application of quality management for food processing companies template pdf template with various stages. Focus and dispense information on four stages using this creative set, that comes with editable features. It contains large content boxes to add your information on topics like control charts, cause and effect diagrams, check sheet, stratification. You can also showcase facts, figures, and other relevant content using this PPT layout. Grab it now.
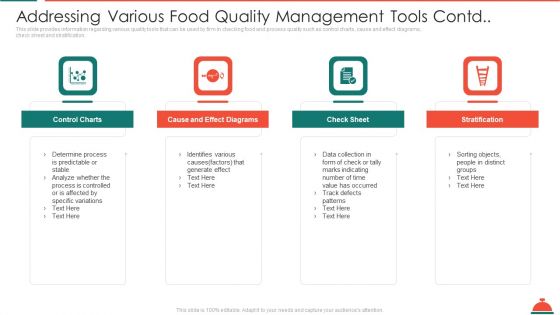
Addressing Various Food Quality Management Tools Contd Increased Superiority For Food Products Rules PDF
This slide provides information regarding various quality tools that can be used by firm in checking food and process quality such as control charts, cause and effect diagrams, check sheet and stratification. This is a addressing various food quality management tools contd increased superiority for food products rules pdf template with various stages. Focus and dispense information on four stages using this creative set, that comes with editable features. It contains large content boxes to add your information on topics like control charts, cause and effect diagrams, check sheet, stratification. You can also showcase facts, figures, and other relevant content using this PPT layout. Grab it now.
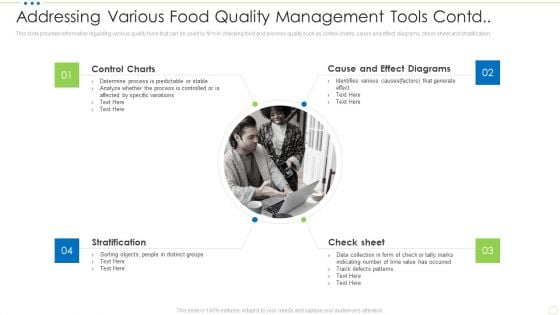
Addressing Various Food Quality Management Tools Contd Food Security Excellence Ppt Infographics Pictures PDF
This slide provides information regarding various quality tools that can be used by firm in checking food and process quality such as control charts, cause and effect diagrams, check sheet and stratification. This is a addressing various food quality management tools contd food security excellence ppt infographics pictures pdf template with various stages. Focus and dispense information on four stages using this creative set, that comes with editable features. It contains large content boxes to add your information on topics like control charts, cause and effect diagrams, check sheet, stratification. You can also showcase facts, figures, and other relevant content using this PPT layout. Grab it now.
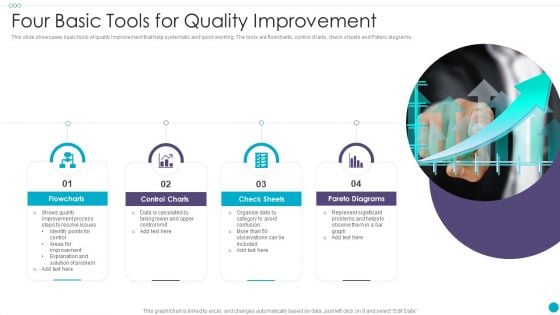
Four Basic Tools For Quality Improvement Ideas PDF
This slide showcases basic tools of quality improvement that help systematic and quick working. The tools are flowcharts, control charts, check sheets and Patero diagrams.Persuade your audience using this Four Basic Tools For Quality Improvement Ideas PDF This PPT design covers four stages, thus making it a great tool to use. It also caters to a variety of topics including Flowcharts, Control Charts, Check Sheets Download this PPT design now to present a convincing pitch that not only emphasizes the topic but also showcases your presentation skills.
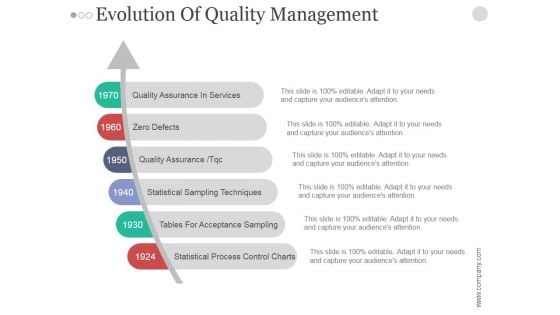
Evolution Of Quality Management Ppt PowerPoint Presentation Design Ideas
This is a evolution of quality management ppt powerpoint presentation design ideas. This is a six stage process. The stages in this process are quality assurance in services, zero defects, quality assurance tqc, statistical sampling techniques, tables for acceptance sampling, statistical process control charts .

Pie Chart02 Finance PowerPoint Themes And PowerPoint Slides 0511
Microsoft PowerPoint Theme and Slide with computer online finance accounting with pie chart and notebook Regain control with our Pie Chart02 Finance PowerPoint Themes And PowerPoint Slides 0511. Download without worries with our money back guaranteee.
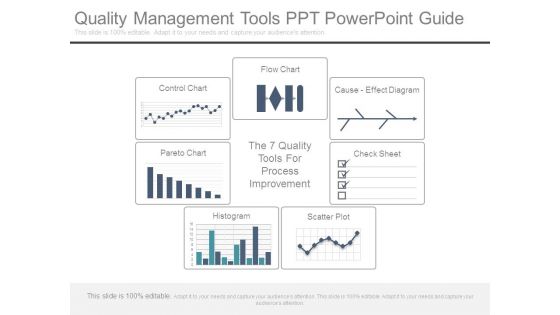
Quality Management Tools Ppt Powerpoint Guide
This is a quality management tools ppt powerpoint guide. This is a seven stage process. The stages in this process are control chart, flow chart, cause effect diagram, pareto chart, the 7 quality tools, for process improvement, check sheet, histogram, scatter plot.


 Continue with Email

 Home
Home


