Dashboard Icon

Digital Marketing Progress Report And Insights Ppt PowerPoint Presentation Complete Deck With Slides
This complete deck acts as a great communication tool. It helps you in conveying your business message with personalized sets of graphics, icons etc. Comprising a set of thirty three slides, this complete deck can help you persuade your audience. It also induces strategic thinking as it has been thoroughly researched and put together by our experts. Not only is it easily downloadable but also editable. The colour, graphics, theme any component can be altered to fit your individual needs. So grab it now.

Market Access Report For Revamping Settlement Offerings Through Online Platforms Ppt PowerPoint Presentation Complete Deck With Slides
This complete deck acts as a great communication tool. It helps you in conveying your business message with personalized sets of graphics, icons etc. Comprising a set of fifty eight slides, this complete deck can help you persuade your audience. It also induces strategic thinking as it has been thoroughly researched and put together by our experts. Not only is it easily downloadable but also editable. The color, graphics, theme any component can be altered to fit your individual needs. So grab it now.

Companys Data Safety Recognition Ppt PowerPoint Presentation Complete Deck With Slides
This complete deck acts as a great communication tool. It helps you in conveying your business message with personalized sets of graphics, icons etc. Comprising a set of fifty one slides, this complete deck can help you persuade your audience. It also induces strategic thinking as it has been thoroughly researched and put together by our experts. Not only is it easily downloadable but also editable. The color, graphics, theme any component can be altered to fit your individual needs. So grab it now.
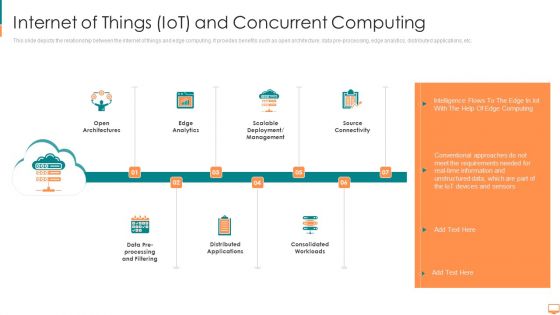
Internet Of Things Iot And Concurrent Computing Ppt Outline Objects PDF
This slide depicts the relationship between the internet of things and edge computing. It provides benefits such as open architecture, data pre processing, edge analytics, distributed applications, etc. This is a icons slide for concurrent computing ppt summary clipart pdf template with various stages. Focus and dispense information on seven stages using this creative set, that comes with editable features. It contains large content boxes to add your information on topics like intelligence, computing, approaches, conventional, information. You can also showcase facts, figures, and other relevant content using this PPT layout. Grab it now.
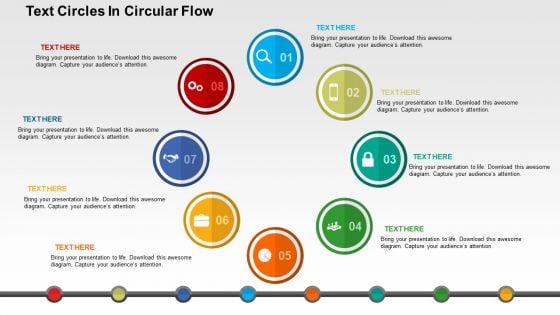
Text Circles In Circular Flow Powerpoint Templates
If anything that can depict a continuous flow of information or data, then it has to be this template which is one of our top rated PowerPoint templates. You can use this multicolored slide to represent various steps involved in a nonstop process. This template can also be perfect choice to denote a continuous process or a process which is repetitive in nature. The diagram is self-explanatory to a lot of extent and with the right icons it is will surely pass the right message in one go. This design can be your perfect solution to depict a loop in anything ranging from a business organization to a communication process.
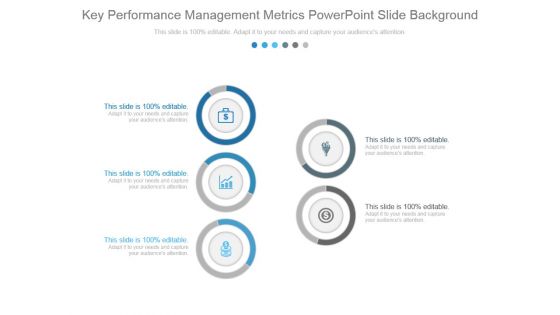
Key Performance Management Metrics Powerpoint Slide Background
This is a key performance management metrics powerpoint slide background. This is a five stage process. The stages in this process are business, marketing, finance, icons, strategy.
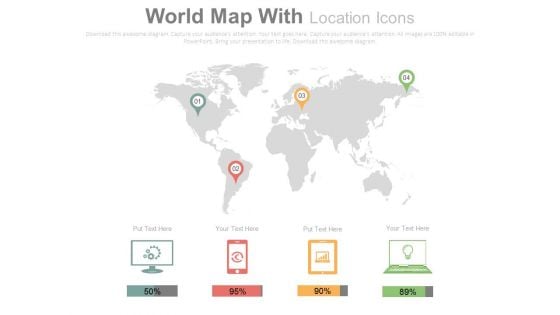
Electronic Devices Global Market Reports PowerPoint Slides
The fight between various gadget manufacturers, internet service providers and operating systems is no longer limited to any specific country. It has gone global and this slide can help present relevant data in a very modern and easy to understand and remember manner. This template has been created by our experienced designers keeping in mind the regular reporting and the data that is to be maintained regarding the number of users and their patterns by various technology companies. The slide has icons of a desktop, a smartphone, a tablet and a laptop accompanied with percentage bars. These can be effectively used to mark the percentage of users on each device, users accessing a website or an app on each device or the sales figures. The location pins can be used to mark the location with maximum number of users or the maximum sales from a location.
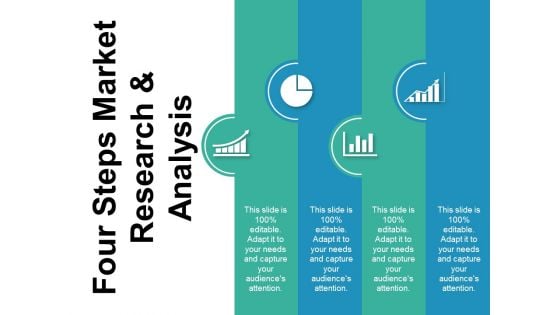
Four Steps Market Reasrch And Analysis Ppt PowerPoint Presentation Infographic Template Maker
This is a four steps market reasrch and analysis ppt powerpoint presentation infographic template maker. This is a four stage process. The stages in this process are metrics icon, kpis icon, statistics icon.
Laptop With Gears Software Testing Ppt PowerPoint Presentation Infographic Template Sample
This is a laptop with gears software testing ppt powerpoint presentation infographic template sample. This is a two stage process. The stages in this process are metrics icon, kpis icon, statistics icon.
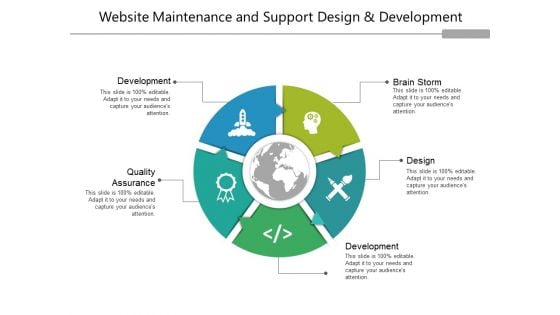
Website Maintenance And Support Design And Development Ppt PowerPoint Presentation Inspiration Outfit
This is a website maintenance and support design and development ppt powerpoint presentation inspiration outfit. This is a five stage process. The stages in this process are metrics icon, kpis icon, statistics icon.
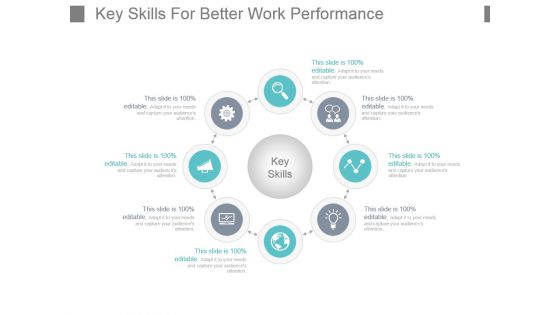
Key Skills For Better Work Performance Powerpoint Shapes
This is a key skills for better work performance powerpoint shapes. This is a four stage process. The stages in this process are key skills, flow, process, circle, icons.
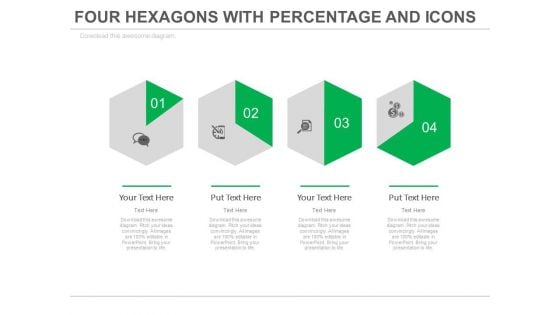
Four Steps Of Financial Growth Analysis Powerpoint Slides
This PowerPoint template with multiple Hexagons can be creatively used to present a timeline in a visual manner. This slide can also help the audience understand a 6 step process in an easier manner. The icons are totally customizable and can be edited to represent the particular process happening at that stage. It can also be used to represent different times or different activities to be carried out at different times in in a day in an office or an organization (e.g. - Medicine schedule) since the hexagon represents a clock and change of shade moves in a clockwise manner. The diagram can be used to represent a comparison or a report or an analysis of the data.
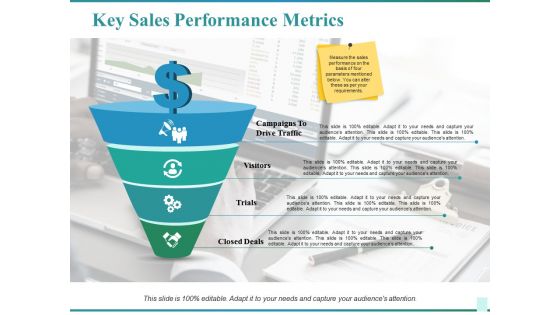
Key Sales Performance Metrics Ppt PowerPoint Presentation Infographics Show
This is a key sales performance metrics ppt powerpoint presentation infographics show. This is a four stage process. The stages in this process are campaigns to drive traffic, visitors, trials, closed deals, business, icons.
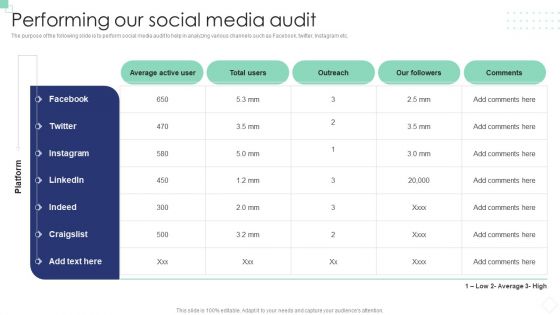
Implementing B2B And B2C Marketing Performing Our Social Media Audit Structure PDF
The purpose of the following slide is to perform social media audit to help in analyzing various channels such as Facebook, twitter, Instagram etc. Purpose of the following slide is to display social media marketing as organization strategy. It provides and overview of the strategy along with key elements such as profile optimization, posting, advertisement etc. This modern and well-arranged Implementing B2B And B2C Marketing Overview Social Media Marketing Icons PDF provides lots of creative possibilities. It is very simple to customize and edit with the Powerpoint Software. Just drag and drop your pictures into the shapes. All facets of this template can be edited with Powerpoint, no extra software is necessary. Add your own material, put your images in the places assigned for them, adjust the colors, and then you can show your slides to the world, with an animated slide included.
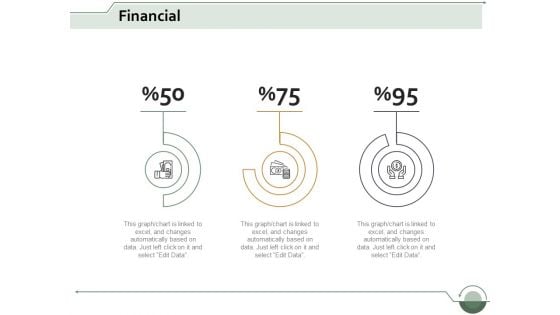
financial analysis ppt powerpoint presentation styles objects
This is a financial analysis ppt powerpoint presentation styles objects. This is a three stage process. The stages in this process are dashboard, business, marketing, management, planning.
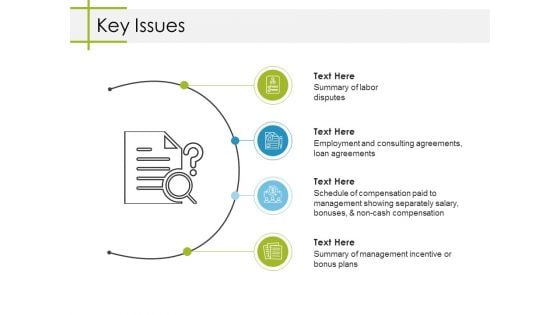
Key Issues Ppt PowerPoint Presentation Slides Deck
This is a key issues ppt powerpoint presentation slides deck. This is a four stage process. The stages in this process are key issues, business, marketing, icons, strategy.
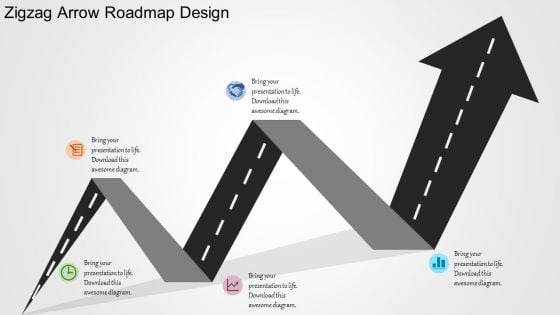
Zigzag Arrow Roadmap Design PowerPoint Templates
Need to show the achievements or performance of your company or want to show your colleagues their targets. Have a look at the above slide. Presenting zigzag arrow road map PowerPoint template design which has everything that you need for your presentation. This PPT template is very helpful and can be used in various ways. For example, it can depict what are the hindrances one might face in order to achieve the goal. This design can also be used to show your business or company?s performance over the period of time, or how has the journey been. This slide has five customizable icons which can help you put forward your point and give you the edge over those boring presentations. This template can be modified as per your needs. So what are you waiting for? Download this amazing zigzag road map PowerPoint template for your presentation.
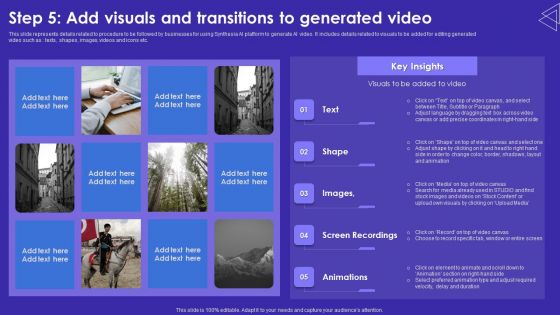
Step 5 Add Visuals And Transitions To Generated Video Graphics PDF
This slide represents details related to procedure to be followed by businesses for using Synthesia AI platform to generate AI video. It includes details related to visuals to be added for editing generated video such as texts, shapes, images, videos and icons etc. This Step 5 Add Visuals And Transitions To Generated Video Graphics PDF from Slidegeeks makes it easy to present information on your topic with precision. It provides customization options, so you can make changes to the colors, design, graphics, or any other component to create a unique layout. It is also available for immediate download, so you can begin using it right away. Slidegeeks has done good research to ensure that you have everything you need to make your presentation stand out. Make a name out there for a brilliant performance.
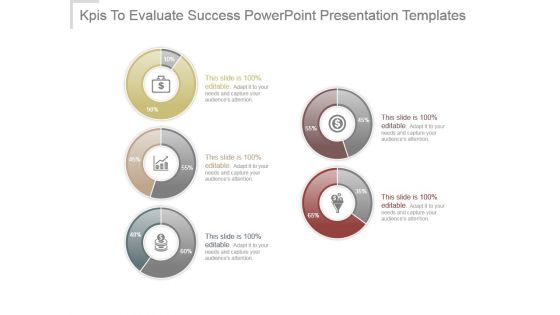
Kpis To Evaluate Success Powerpoint Presentation Templates
This is a kpis to evaluate success powerpoint presentation templates. This is a five stage process. The stages in this process are business, marketing, finance, icons, strategy.
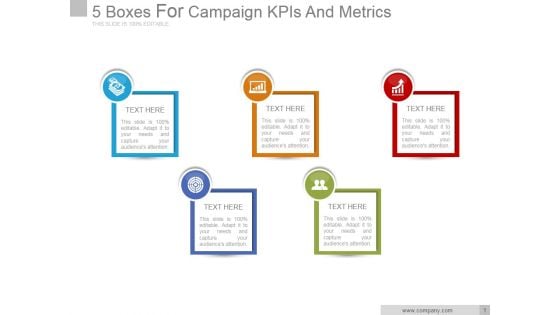
5 Boxes For Campaign Kpis And Metrics Good Ppt PowerPoint Presentation Designs
This is a 5 boxes for campaign kpis and metrics good ppt powerpoint presentation designs. This is a five stage process. The stages in this process are business, marketing, icons, metrics, strategy.
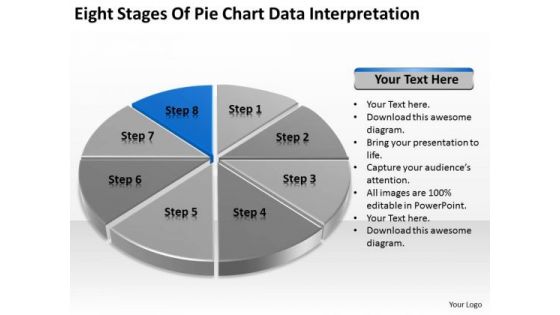
Eight Stages Of Pie Chart Data Interpretation Detailed Business Plan PowerPoint Templates
We present our eight stages of pie chart data interpretation detailed business plan PowerPoint templates.Download and present our Competition PowerPoint Templates because You can Stir your ideas in the cauldron of our PowerPoint Templates and Slides. Cast a magic spell on your audience. Download and present our Marketing PowerPoint Templates because You should Kick up a storm with our PowerPoint Templates and Slides. The heads of your listeners will swirl with your ideas. Download and present our Arrows PowerPoint Templates because Your ideas provide food for thought. Our PowerPoint Templates and Slides will help you create a dish to tickle the most discerning palate. Present our Circle Charts PowerPoint Templates because You can Stir your ideas in the cauldron of our PowerPoint Templates and Slides. Cast a magic spell on your audience. Download our Business PowerPoint Templates because You can Score a slam dunk with our PowerPoint Templates and Slides. Watch your audience hang onto your every word.Use these PowerPoint slides for presentations relating to chart, graph, pie, 3d, diagram, graphic, icon, control, business, data, profit, market, sales, display, corporate, concept, render, success, presentation, finance, report, marketing, accounting, management, piece, strategy, money, growth, company, competition, progress, account, sheet, part, information, investment, improvement, banking, index, financial, reflect, results, performance, exchange. The prominent colors used in the PowerPoint template are Blue, Black, Gray. Exult in the comfort of our Eight Stages Of Pie Chart Data Interpretation Detailed Business Plan PowerPoint Templates. Experience the convenience they deliver.
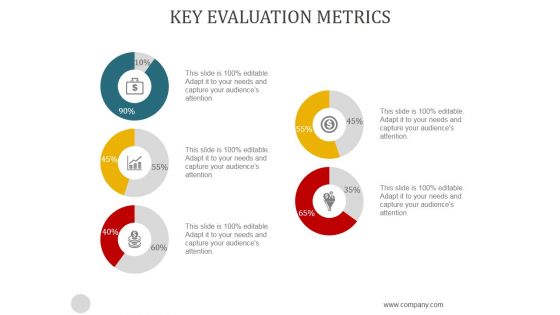
Key Evaluation Metrics Ppt PowerPoint Presentation Files
This is a key evaluation metrics ppt powerpoint presentation files. This is a five stage process. The stages in this process are icons, business, management, success, percentage.
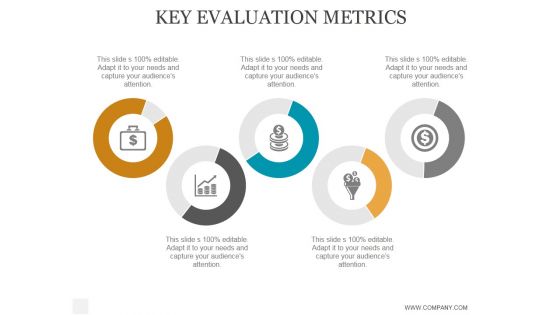
Key Evaluation Metrics Ppt PowerPoint Presentation Portfolio
This is a key evaluation metrics ppt powerpoint presentation portfolio. This is a five stage process. The stages in this process are business, strategy, marketing, analysis, success, icons.
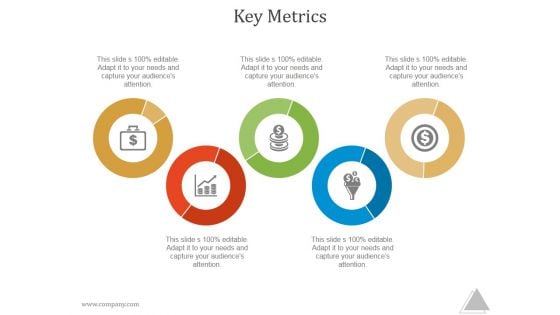
Key Metrics Ppt PowerPoint Presentation Introduction
This is a key metrics ppt powerpoint presentation introduction. This is a five stage process. The stages in this process are icons, marketing, business, strategy.
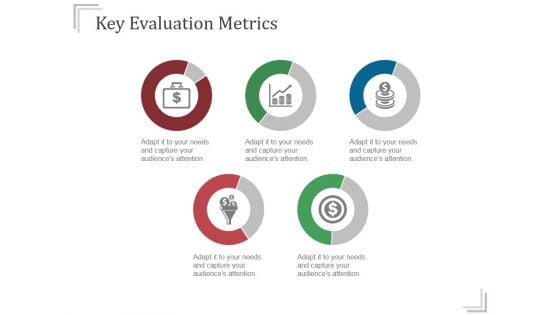
Key Evaluation Metrics Ppt PowerPoint Presentation Gallery
This is a key evaluation metrics ppt powerpoint presentation gallery. This is a five stage process. The stages in this process are business, icons, marketing, strategy, success.

Charts Vector For Statistical Analysis Ppt PowerPoint Presentation Layouts Professional
Presenting this set of slides with name charts vector for statistical analysis ppt powerpoint presentation layouts professional. The topics discussed in these slides are data icon, status icon, status symbol icon. This is a completely editable PowerPoint presentation and is available for immediate download. Download now and impress your audience.
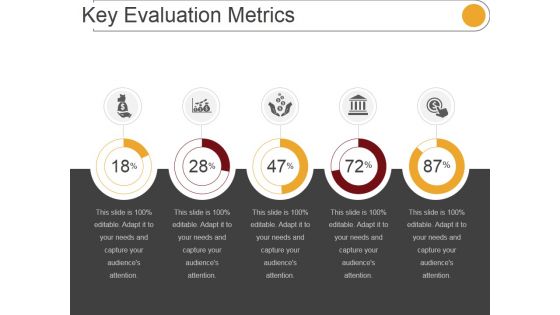
Key Evaluation Metrics Ppt PowerPoint Presentation Influencers
This is a key evaluation metrics ppt powerpoint presentation influencers. This is a five stage process. The stages in this process are icons, percentage, marketing, management.
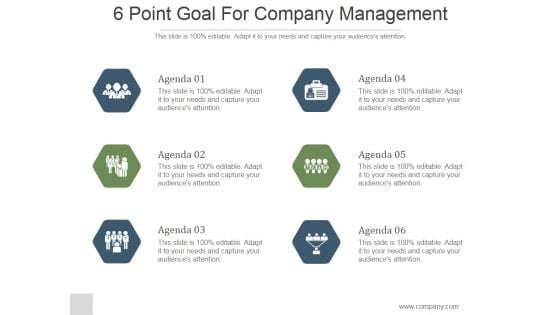
6 Point Goal For Company Management Ppt PowerPoint Presentation Slide
This is a 6 point goal for company management ppt powerpoint presentation slide. This is a six stage process. The stages in this process are agenda, business, strategy, icons, hexagon, marketing.
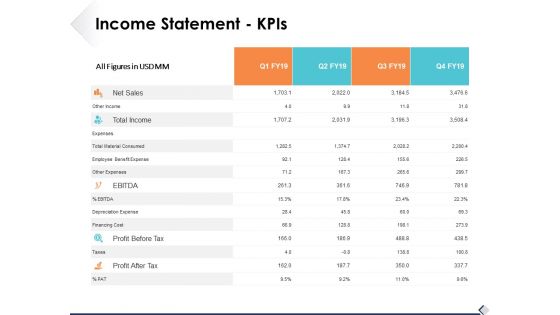
Income Statement Kpis Ppt PowerPoint Presentation Professional Template
This is a income statement kpis ppt powerpoint presentation professional template. This is a four stage process. The stages in this process are business, management, strategy, analysis, icons.
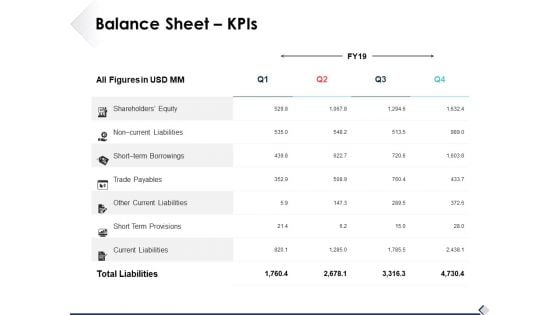
Balance Sheet Kpis Ppt PowerPoint Presentation Summary Layouts
This is a balance sheet kpis ppt powerpoint presentation summary layouts. This is a four stage process. The stages in this process are business, icons, management, strategy, analysis.
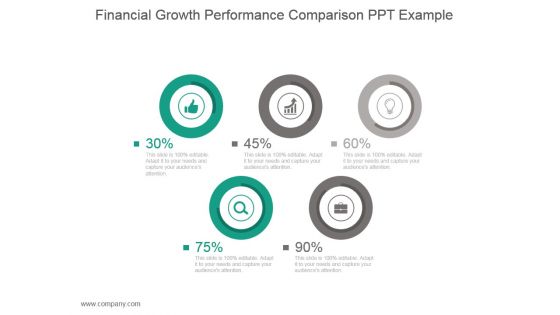
Financial Growth Performance Comparison Ppt Example
This is a financial growth performance comparison ppt example. This is a five stage process. The stages in this process are business, strategy, marketing, finance, icons.
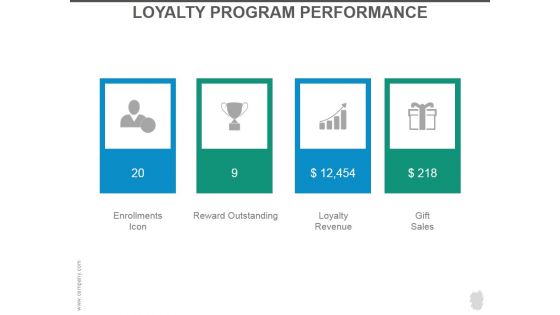
Loyalty Program Performance Ppt PowerPoint Presentation Slides
This is a loyalty program performance ppt powerpoint presentation slides. This is a four stage process. The stages in this process are enrollments icon, reward outstanding, loyalty revenue, gift sales.
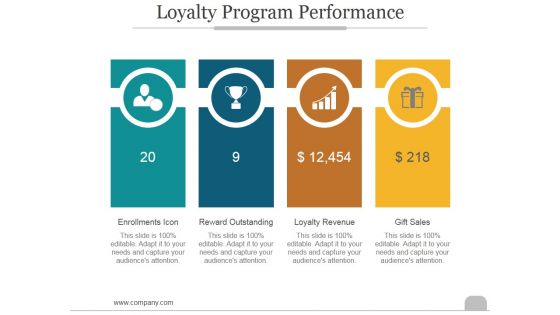
Loyalty Program Performance Ppt PowerPoint Presentation Introduction
This is a loyalty program performance ppt powerpoint presentation introduction. This is a four stage process. The stages in this process are enrollments icon, reward outstanding, loyalty revenue, gift sales.
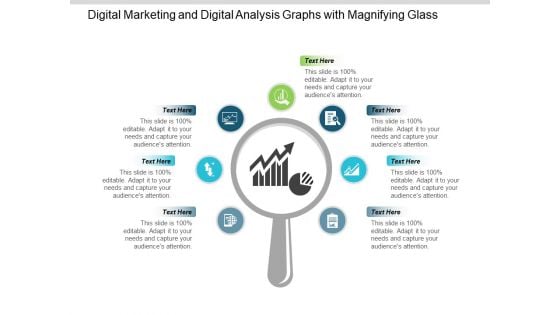
Digital Marketing And Digital Analysis Graphs With Magnifying Glass Ppt PowerPoint Presentation Portfolio Show
This is a digital marketing and digital analysis graphs with magnifying glass ppt powerpoint presentation portfolio show. This is a seven stage process. The stages in this process are digital analytics, digital dashboard, marketing.
Data Analysis Reports Under Magnifying Glass Ppt Powerpoint Presentation Summary Slideshow
This is a data analysis reports under magnifying glass ppt powerpoint presentation summary slideshow. This is a three stage process. The stages in this process are data visualization icon, data management icon.
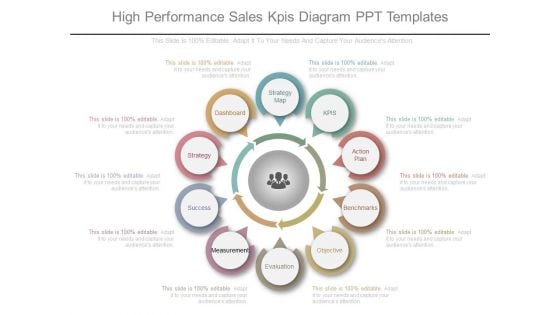
High Performance Sales Kpis Diagram Ppt Templates
This is a high performance sales kpis diagram ppt templates. This is a ten stage process. The stages in this process are strategy map, kpis, action plan, benchmarks, objective, evaluation, measurement, success, strategy, dashboard.
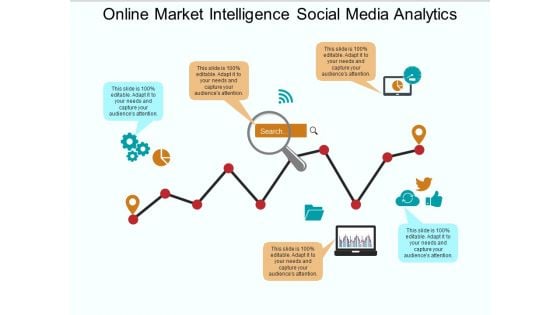
Online Market Intelligence Social Media Analytics Ppt PowerPoint Presentation Infographics Themes
This is a online market intelligence social media analytics ppt powerpoint presentation infographics themes. This is a five stage process. The stages in this process are digital analytics, digital dashboard, marketing.
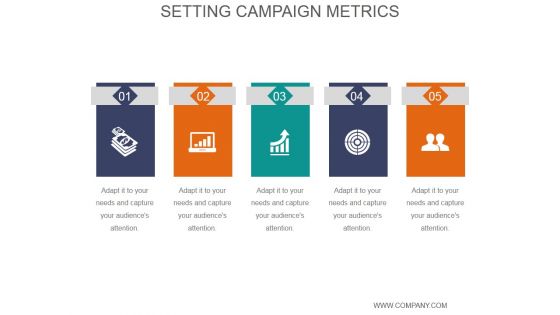
Setting Campaign Metrics Ppt PowerPoint Presentation Slide Download
This is a setting campaign metrics ppt powerpoint presentation slide download. This is a five stage process. The stages in this process are icons, process, strategy, business, marketing, management.
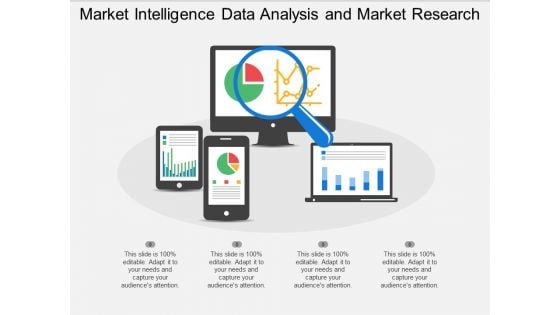
Market Intelligence Data Analysis And Market Research Ppt PowerPoint Presentation Professional Templates
This is a market intelligence data analysis and market research ppt powerpoint presentation professional templates. This is a four stage process. The stages in this process are digital analytics, digital dashboard, marketing.
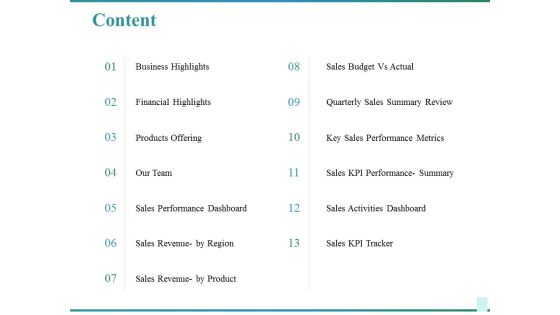
Content Ppt PowerPoint Presentation Infographics Diagrams
This is a content ppt powerpoint presentation infographics diagrams. This is a thirteen stage process. The stages in this process are business highlights, financial highlights, products offering, sales performance dashboard, sales revenue by region.
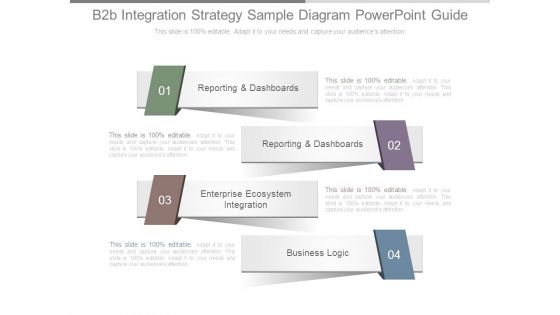
B2b Integration Strategy Sample Diagram Powerpoint Guide
This is a b2b integration strategy sample diagram powerpoint guide. This is a four stage process. The stages in this process are reporting and dashboards, enterprise ecosystem integration, business logic.
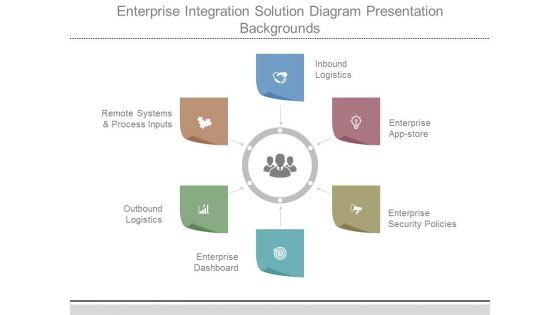
Enterprise Integration Solution Diagram Presentation Backgrounds
This is a enterprise integration solution diagram presentation backgrounds. This is a six stage process. The stages in this process are remote systems and process inputs, outbound, logistics, enterprise, dashboard, enterprise, policies, security, enterprise app store, inbound logistics.
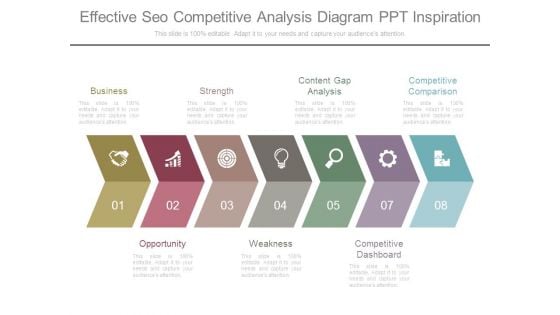
Effective Seo Competitive Analysis Diagram Ppt Inspiration
This is a effective seo competitive analysis diagram ppt inspiration. This is a eight stage process. The stages in this process are business, opportunity, strength, weakness, content gap analysis, competitive dashboard, competitive comparison.
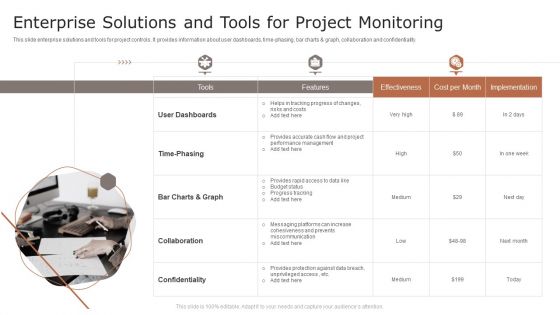
Enterprise Solutions And Tools For Project Monitoring Ppt Model Examples PDF
This slide enterprise solutions and tools for project controls. It provides information about user dashboards, time-phasing, bar charts and graph, collaboration and confidentiality. Presenting Enterprise Solutions And Tools For Project Monitoring Ppt Model Examples PDF to dispense important information. This template comprises three stages. It also presents valuable insights into the topics including User Dashboards, Time Phasing, Collaboration. This is a completely customizable PowerPoint theme that can be put to use immediately. So, download it and address the topic impactfully.
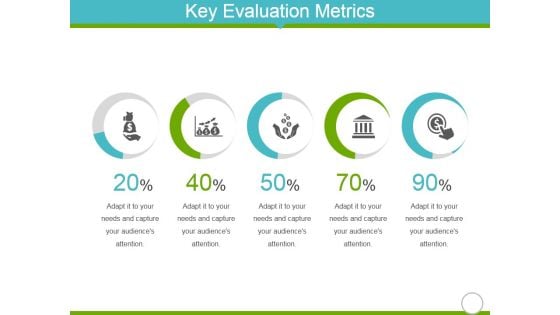
Key Evaluation Metrics Ppt Powerpoint Presentation Styles Design Inspiration
This is a key evaluation metrics ppt powerpoint presentation styles design inspiration. This is a five stage process. The stages in this process are business, marketing, icons, finance.
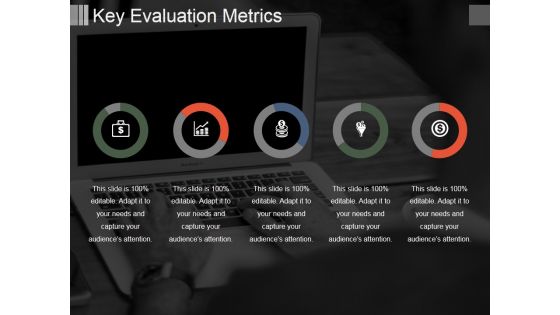
Key Evaluation Metrics Ppt PowerPoint Presentation Show Guide
This is a key evaluation metrics ppt powerpoint presentation show guide. This is a five stage process. The stages in this process are donut, icons, business, strategy, analysis.
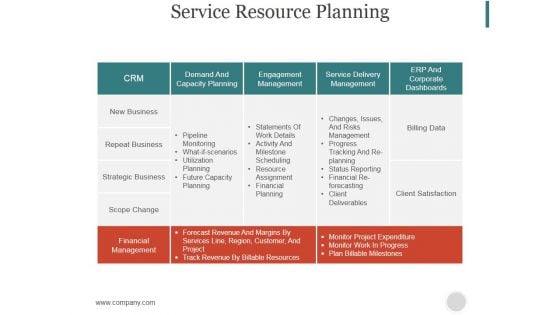
Service Resource Planning Ppt PowerPoint Presentation Styles
This is a service resource planning ppt powerpoint presentation styles. This is a five stage process. The stages in this process are crm, demand and capacity planning, engagement management, service delivery management, erp and corporate dashboards, financial management.
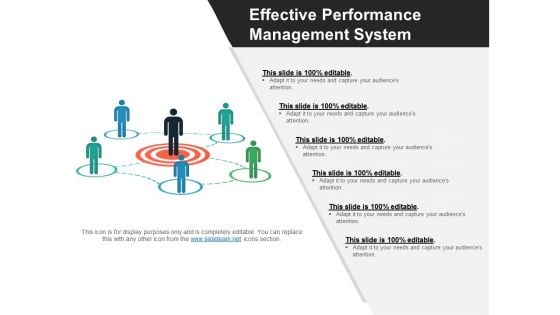
Effective Performance Management System Ppt PowerPoint Presentation Slides Microsoft
This is a effective performance management system ppt powerpoint presentation slides microsoft. This is a six stage process. The stages in this process are talent acquisition icon, human resource management icon, talent management icon, hr icon.
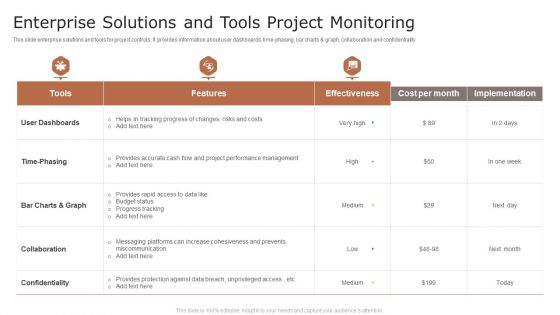
Enterprise Solutions And Tools Project Monitoring Ppt File Visuals PDF
This slide enterprise solutions and tools for project controls. It provides information about user dashboards, time-phasing, bar charts and graph, collaboration and confidentiality. Pitch your topic with ease and precision using this Enterprise Solutions And Tools Project Monitoring Ppt File Visuals PDF. This layout presents information on User Dashboards, Time Phasing, Collaboration. It is also available for immediate download and adjustment. So, changes can be made in the color, design, graphics or any other component to create a unique layout.

Business Growth Strategy And Revenue Model Ppt PowerPoint Presentation Complete Deck With Slides
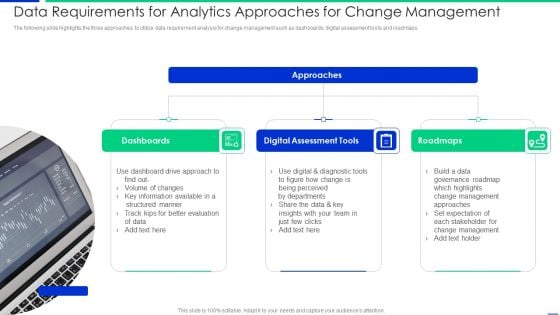
Data Requirements For Analytics Approaches For Change Management Topics PDF
The following slide highlights the three approaches to utilize data requirement analysis for change management such as dashboards, digital assessment tools and roadmaps. Presenting data requirements for analytics approaches for change management topics pdf to dispense important information. This template comprises three stages. It also presents valuable insights into the topics including dashboards, digital assessment tools, roadmaps. This is a completely customizable PowerPoint theme that can be put to use immediately. So, download it and address the topic impactfully.
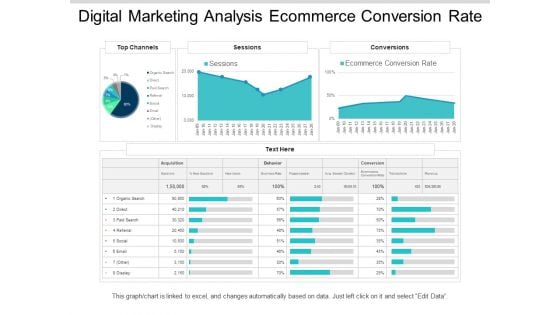
Digital Marketing Analysis Ecommerce Conversion Rate Ppt PowerPoint Presentation Outline Example File
This is a digital marketing analysis ecommerce conversion rate ppt powerpoint presentation outline example file. This is a three stage process. The stages in this process are digital analytics, digital dashboard, marketing.
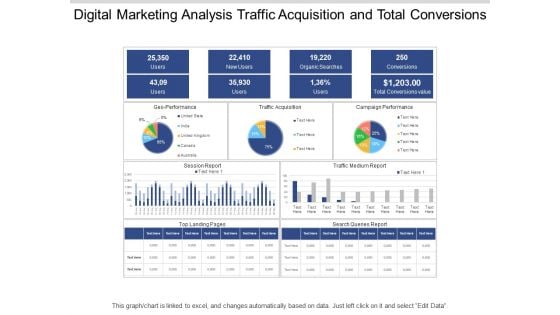
Digital Marketing Analysis Traffic Acquisition And Total Conversions Ppt PowerPoint Presentation Pictures Layouts
This is a digital marketing analysis traffic acquisition and total conversions ppt powerpoint presentation pictures layouts. This is a three stage process. The stages in this process are digital analytics, digital dashboard, marketing.
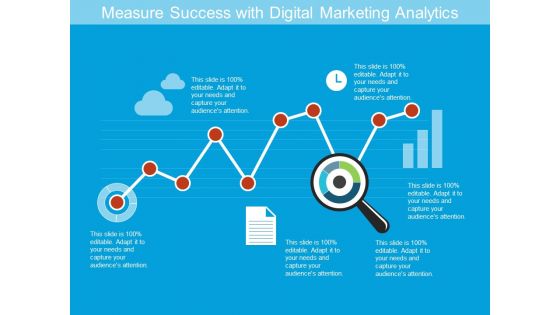
Measure Success With Digital Marketing Analytics Ppt PowerPoint Presentation Gallery Infographics
This is a measure success with digital marketing analytics ppt powerpoint presentation gallery infographics. This is a five stage process. The stages in this process are digital analytics, digital dashboard, marketing.
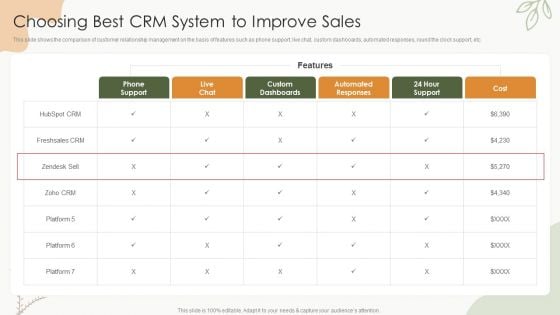
Sales Procedure Automation To Enhance Sales Choosing Best CRM System To Improve Sales Diagrams PDF
This slide shows the comparison of customer relationship management on the basis of features such as phone support, live chat, custom dashboards, automated responses, round the clock support, etc.Deliver an awe inspiring pitch with this creative Sales Procedure Automation To Enhance Sales Choosing Best CRM System To Improve Sales Diagrams PDF bundle. Topics like Custom Dashboards, Automated Responses, Phone Support can be discussed with this completely editable template. It is available for immediate download depending on the needs and requirements of the user.
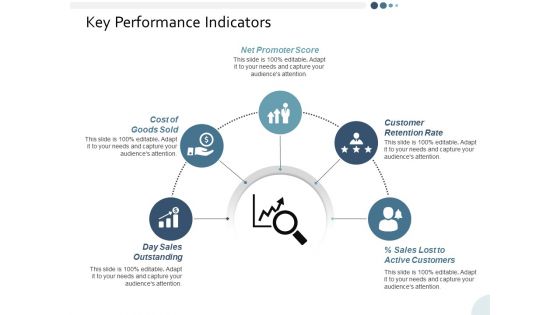
Key Performance Indicators Ppt PowerPoint Presentation Gallery Gridlines
This is a key performance indicators ppt powerpoint presentation gallery gridlines. This is a five stage process. The stages in this process are business, management, strategy, analysis, icons.
Key Performance Indicators With Team Performance Analysis Powerpoint Slide Rules
This is a key performance indicators with team performance analysis powerpoint slide rules. This is a five stage process. The stages in this process are business, strategy, marketing, success, process, icons.
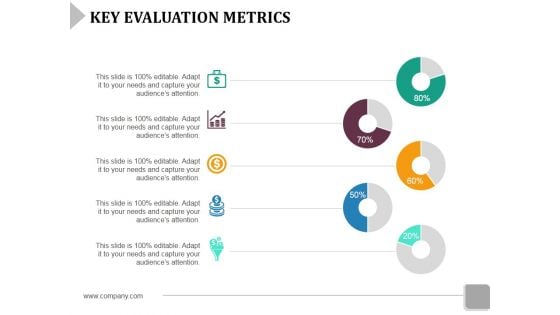
Key Evaluation Metrics Ppt PowerPoint Presentation File Design Ideas
This is a key evaluation metrics ppt powerpoint presentation file design ideas. This is a five stage process. The stages in this process are business, icons, strategy, marketing, finance.
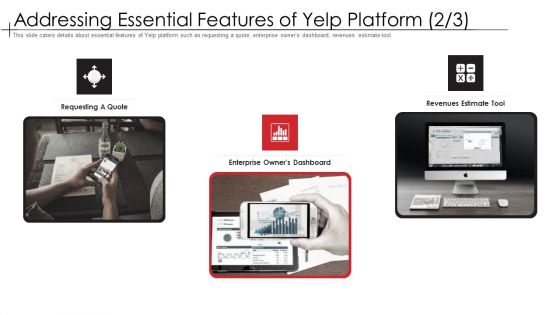
Addressing Essential Features Of Yelp Platform Quote Themes PDF
This slide caters details about essential features of Yelp platform such as requesting a quote, enterprise owners dashboard, revenues estimate tool. This is a addressing essential features of yelp platform quote themes pdf template with various stages. Focus and dispense information on three stages using this creative set, that comes with editable features. It contains large content boxes to add your information on topics like requesting a quote, enterprise owners dashboard, revenues estimate tool . You can also showcase facts, figures, and other relevant content using this PPT layout. Grab it now.
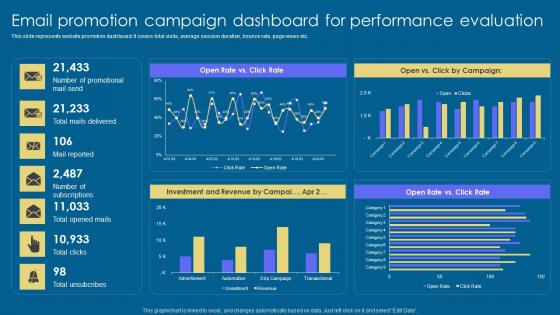
Email Promotion Campaign Implementation Of Digital Advertising Strategies Rules Pdf
This slide represents website promotion dashboard. It covers total visits, average session duration, bounce rate, page views etc. The best PPT templates are a great way to save time, energy, and resources. Slidegeeks have 100 percent editable powerpoint slides making them incredibly versatile. With these quality presentation templates, you can create a captivating and memorable presentation by combining visually appealing slides and effectively communicating your message. Download Email Promotion Campaign Implementation Of Digital Advertising Strategies Rules Pdf from Slidegeeks and deliver a wonderful presentation. This slide represents website promotion dashboard. It covers total visits, average session duration, bounce rate, page views etc.

 Home
Home