Dashboard Icon
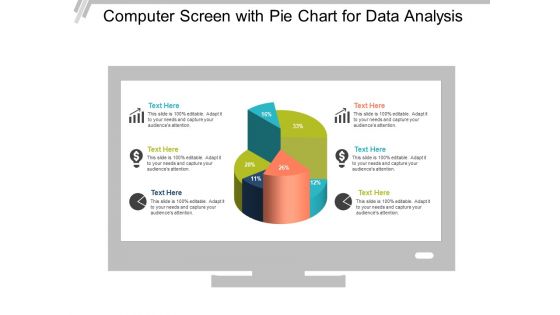
Computer Screen With Pie Chart For Data Analysis Ppt PowerPoint Presentation Show Picture
This is a computer screen with pie chart for data analysis ppt powerpoint presentation show picture. This is a six stage process. The stages in this process are computer icon, desktop icon, laptop screen icon.
Performance Measures Ppt PowerPoint Presentation Layouts Clipart Images
This is a performance measures ppt powerpoint presentation layouts clipart images. This is a two stage process. The stages in this process are non financial measures, financial measures, business, icons, marketing.
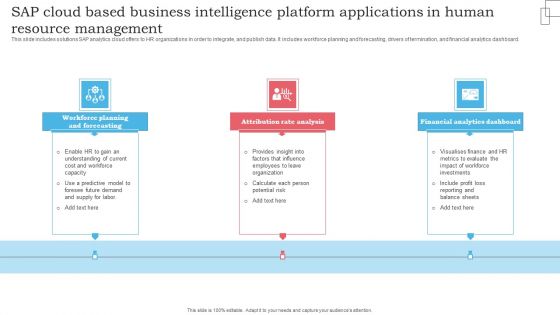
SAP Cloud Based Business Intelligence Platform Applications In Human Resource Management Microsoft PDF
This slide includes solutions SAP analytics cloud offers to HR organizations in order to integrate, and publish data. It includes workforce planning and forecasting, drivers of termination, and financial analytics dashboard. Presenting SAP Cloud Based Business Intelligence Platform Applications In Human Resource Management Microsoft PDF to dispense important information. This template comprises three stages. It also presents valuable insights into the topics including Workforce Planning Forecasting, Attribution Rate Analysis, Financial Analytics Dashboard. This is a completely customizable PowerPoint theme that can be put to use immediately. So, download it and address the topic impactfully.
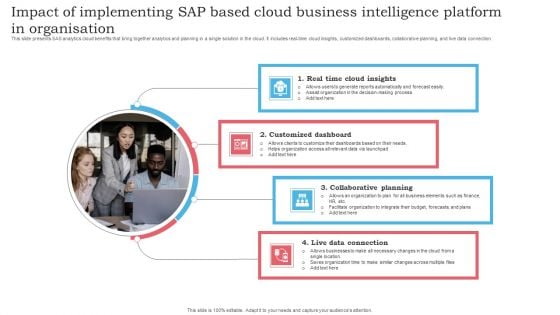
Impact Of Implementing SAP Based Cloud Business Intelligence Platform In Organisation Portrait PDF
This slide presents SAS analytics cloud benefits that bring together analytics and planning in a single solution in the cloud. It includes real-time cloud insights, customized dashboards, collaborative planning, and live data connection. Presenting Impact Of Implementing SAP Based Cloud Business Intelligence Platform In Organisation Portrait PDF to dispense important information. This template comprises four stages. It also presents valuable insights into the topics including Real Time Cloud Insights, Customized Dashboard, Collaborative Planning. This is a completely customizable PowerPoint theme that can be put to use immediately. So, download it and address the topic impactfully.
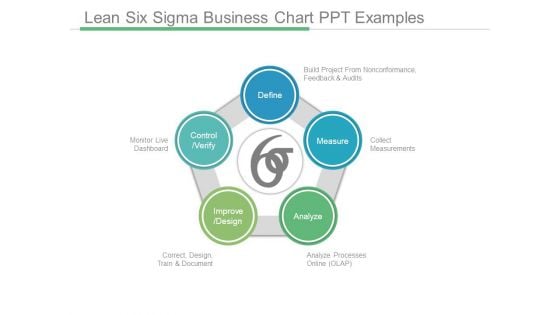
Lean Six Sigma Business Chart Ppt Examples
This is a lean six sigma business chart ppt examples. This is a five stage process. The stages in this process are define build project from nonconformance feedback and audits, measure collect measurements, analyze processes online olap, improve design correct design train and document, control verify monitor live dashboard.
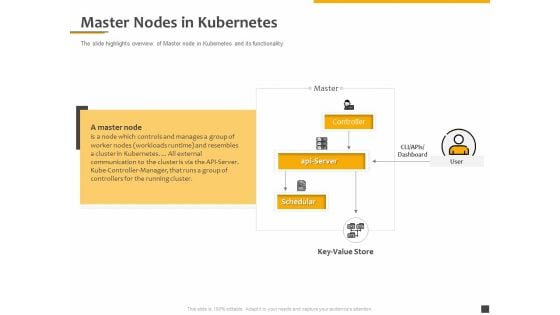
Understanding The Kubernetes Components Through Diagram Master Nodes In Kubernetes Ppt Slides Structure PDF
Presenting this set of slides with name understanding the kubernetes components through diagram master nodes in kubernetes ppt slides structure pdf. This is a five stage process. The stages in this process are controller, api server, schedular, key value store, master, dashboard. This is a completely editable PowerPoint presentation and is available for immediate download. Download now and impress your audience.
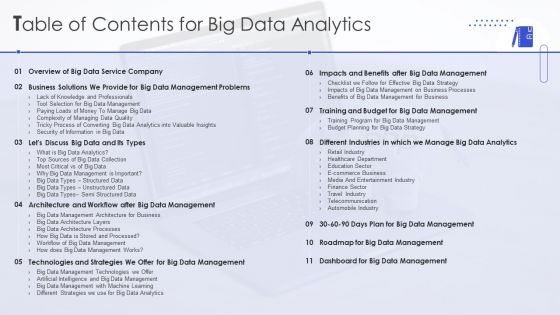
Table Of Contents For Big Data Analytics Ppt PowerPoint Presentation Diagram PDF
Deliver an awe inspiring pitch with this creative Table Of Contents For Big Data Analytics Ppt PowerPoint Presentation Diagram PDF bundle. Topics like Dashboard, Big Data Management, E Commerce Business can be discussed with this completely editable template. It is available for immediate download depending on the needs and requirements of the user.
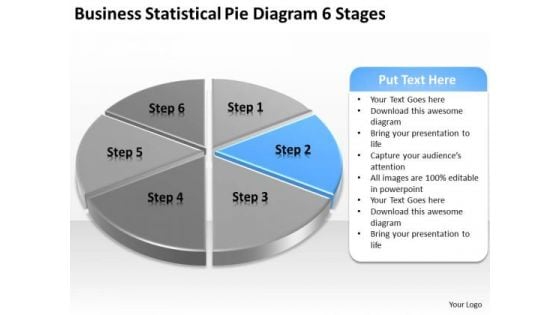
Business Statistical Pie Diagram 6 Stages Plan Consulting PowerPoint Slides
We present our business statistical pie diagram 6 stages plan consulting PowerPoint Slides.Use our Competition PowerPoint Templates because You have the co-ordinates for your destination of success. Let our PowerPoint Templates and Slides map out your journey. Download and present our Marketing PowerPoint Templates because You can Hit the nail on the head with our PowerPoint Templates and Slides. Embed your ideas in the minds of your audience. Present our Arrows PowerPoint Templates because You can Be the puppeteer with our PowerPoint Templates and Slides as your strings. Lead your team through the steps of your script. Download and present our Circle Charts PowerPoint Templates because Our PowerPoint Templates and Slides will provide you a launch platform. Give a lift off to your ideas and send them into orbit. Download and present our Business PowerPoint Templates because Our PowerPoint Templates and Slides will let your team Walk through your plans. See their energy levels rise as you show them the way.Use these PowerPoint slides for presentations relating to chart, graph, pie, 3d, diagram, graphic, icon, control, business, data, profit, market, sales, display, corporate, concept, render, success, presentation, finance, report, marketing, accounting, management, piece, strategy, money, growth, company, competition, progress, account, sheet, part, information, investment, improvement, banking, index, financial, reflect, results, performance, exchange. The prominent colors used in the PowerPoint template are Blue, Black, Gray. Grab the chance to use our Business Statistical Pie Diagram 6 Stages Plan Consulting PowerPoint Slides. Dip your hand in the lucky basket.
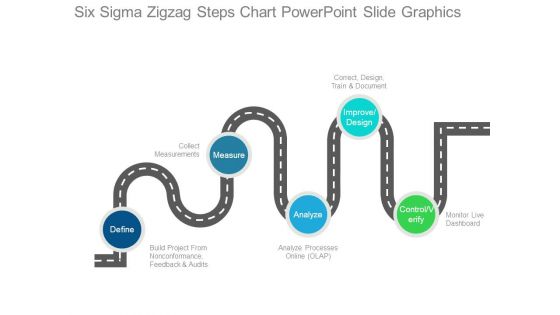
Six Sigma Zigzag Steps Chart Powerpoint Slide Graphics
This is a six sigma zigzag steps chart powerpoint slide graphics. This is a five stage process. The stages in this process are define, build project from nonconformance feedback and audits, collect measurements, measure, analyze, analyze processes online olap, improve design, correct design train and document, monitor live dashboard, control verify.
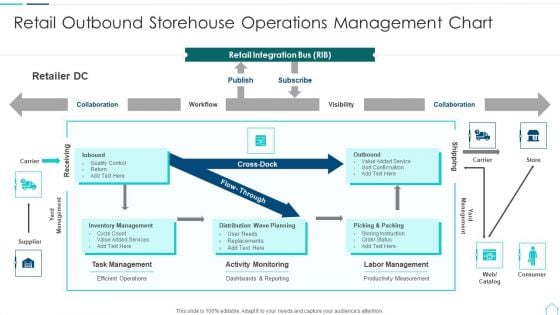
Retail Outbound Storehouse Operations Management Chart Information PDF
Pitch your topic with ease and precision using this retail outbound storehouse operations management chart information pdf. This layout presents information on inventory management, task management, dashboards. It is also available for immediate download and adjustment. So, changes can be made in the color, design, graphics or any other component to create a unique layout.
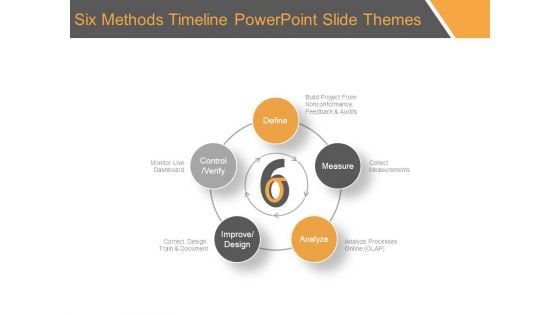
Six Methods Timeline Powerpoint Slide Themes
This is a six methods timeline powerpoint slide themes. This is a five stage process. The stages in this process are define, measure, analyze, improve design, control verify, build project from nonconformance, feedback and audits, collect measurements, analyze processes online, correct, design, train and document, monitor live dashboard.
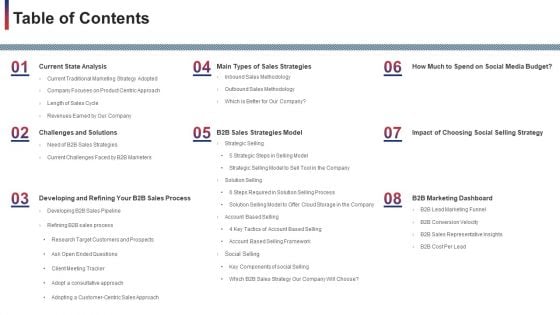
Table Of Contents Diagrams PDF
Deliver and pitch your topic in the best possible manner with this table of contents diagrams pdf. Use them to share invaluable insights on main types of sales strategies, b2b sales strategies model, b2b marketing dashboard, current state analysis, challenges and solutions and impress your audience. This template can be altered and modified as per your expectations. So, grab it now.
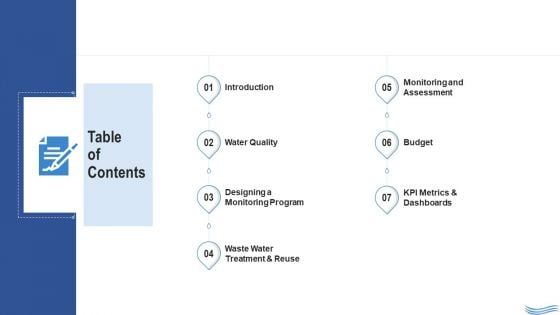
Water Quality Management Table Of Contents Themes PDF
Deliver an awe inspiring pitch with this creative water quality management table of contents themes pdf bundle. Topics like monitoring, treatment, dashboards, budget, assessment can be discussed with this completely editable template. It is available for immediate download depending on the needs and requirements of the user.
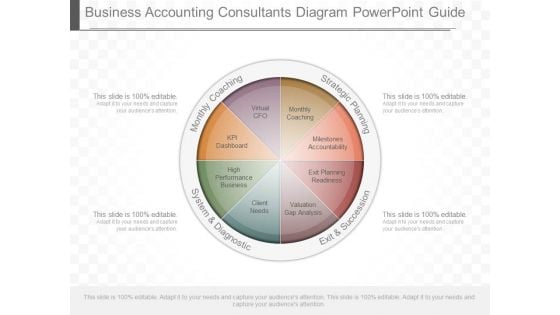
Business Accounting Consultants Diagram Powerpoint Guide
This is a business accounting consultants diagram powerpoint guide. This is a eight stage process. The stages in this process are monthly coaching, strategic planning, system and diagnostic, exit and succession, monthly coaching, milestones accountability, exit planning readiness, valuation gap analysis, client needs, high performance business, kpi dashboard, virtual cfo.
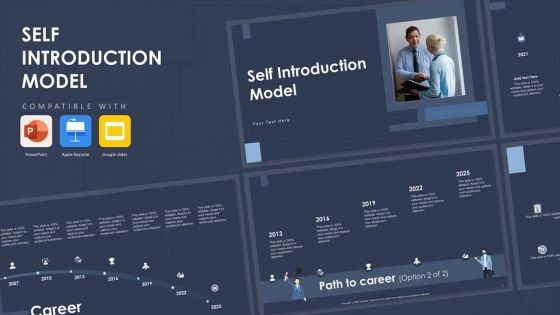
Self Introduction Model Powerpoint Presentation Slides
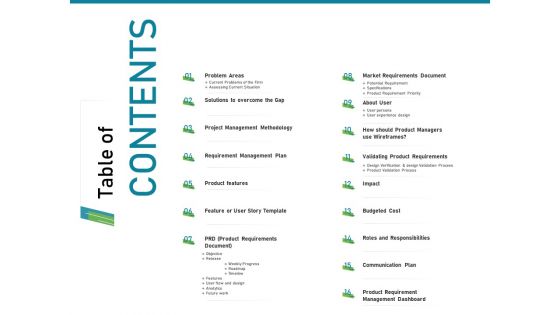
Requirements Governance Plan Table Of Contents Diagrams PDF
Deliver and pitch your topic in the best possible manner with this requirements governance plan table of contents diagrams pdf. Use them to share invaluable insights on market requirements, budgeted cost, communication plan, management dashboard, product features and impress your audience. This template can be altered and modified as per your expectations. So, grab it now.
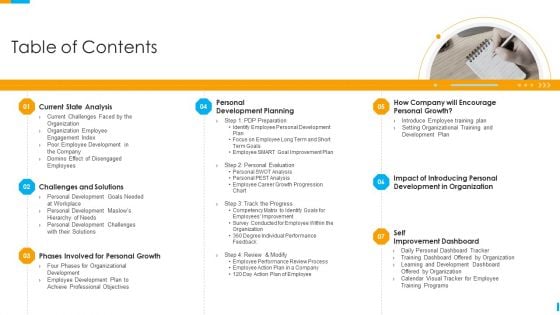
Business Journey Table Of Contents Ppt Styles Diagrams PDF
Deliver and pitch your topic in the best possible manner with this business journey table of contents ppt styles diagrams pdf. Use them to share invaluable insights on growth, improvement, dashboard, development, organization and impress your audience. This template can be altered and modified as per your expectations. So, grab it now.
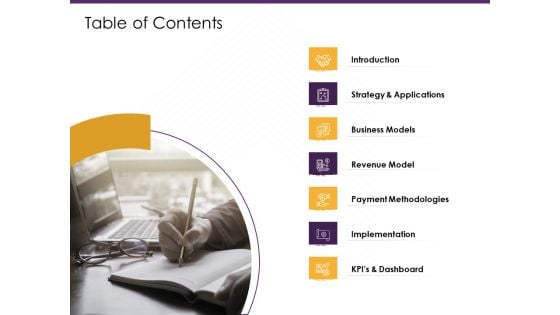
E Commerce Table Of Contents Ppt PowerPoint Presentation Diagram Templates PDF
Presenting this set of slides with name e commerce table of contents ppt powerpoint presentation diagram templates pdf. This is a seven stage process. The stages in this process are introduction, strategy and applications, business models, revenue model, payment methodologies, implementation, kpis and dashboard. This is a completely editable PowerPoint presentation and is available for immediate download. Download now and impress your audience.
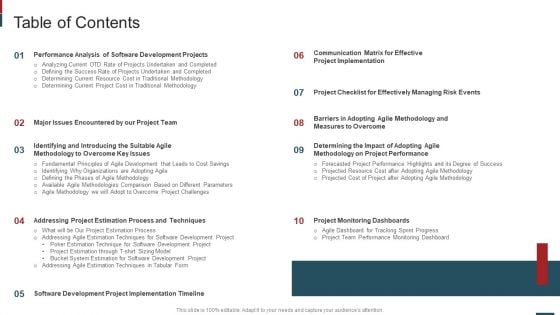
Cost Saving With Agile Methodology IT Table Of Contents Diagrams PDF
Deliver an awe inspiring pitch with this creative cost saving with agile methodology it table of contents diagrams pdf bundle. Topics like project monitoring dashboards, addressing project estimation, major issues encountered can be discussed with this completely editable template. It is available for immediate download depending on the needs and requirements of the user.
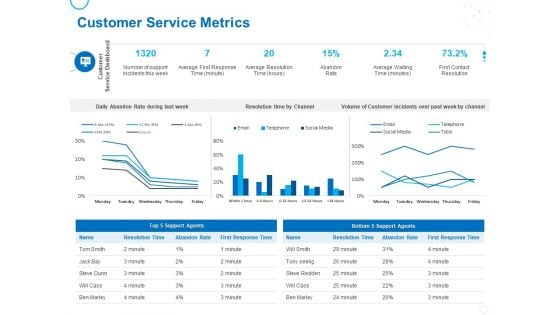
Service Strategy And Service Lifecycle Implementation Customer Service Metrics Ppt Ideas Templates PDF
Presenting this set of slides with name service strategy and service lifecycle implementation customer service metrics ppt ideas templates pdf. The topics discussed in these slides are customer service dashboard, resolution time channel, customer incidents, average waiting time, resolution, resolution time channel. This is a completely editable PowerPoint presentation and is available for immediate download. Download now and impress your audience.
Employee Engagement Report With Score And Role Ppt PowerPoint Presentation Infographics Visual Aids PDF
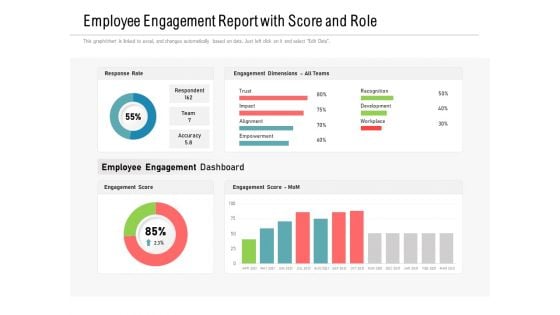
Pitch your topic with ease and precision using this employee engagement report with score and role ppt powerpoint presentation infographics visual aids pdf. This layout presents information on response rate, engagement score, employee engagement dashboard. It is also available for immediate download and adjustment. So, changes can be made in the color, design, graphics or any other component to create a unique layout.
Financial Snapshot Ppt PowerPoint Presentation Backgrounds
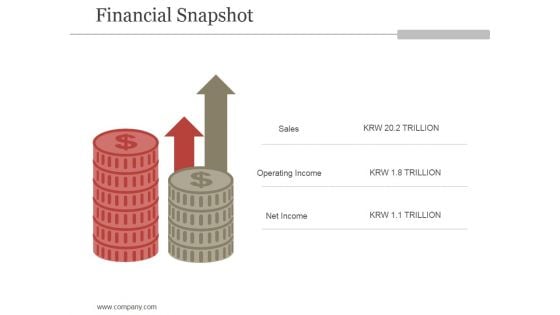
This is a financial snapshot ppt powerpoint presentation backgrounds. This is a six stage process. The stages in this process are icons, strategy, percentage, finance, business.
Kubernetes Containers Architecture Overview Master Nodes In Kubernetes Ppt Portfolio Graphics PDF
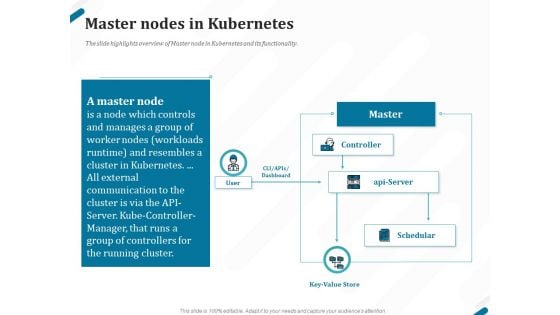
Presenting this set of slides with name kubernetes containers architecture overview master nodes in kubernetes ppt portfolio graphics pdf. This is a five stage process. The stages in this process are controller, api server, schedular, key value store, master, dashboard. This is a completely editable PowerPoint presentation and is available for immediate download. Download now and impress your audience.
Magnifying Ppt PowerPoint Presentation Background Designs
This is a magnifying ppt powerpoint presentation background designs. This is a four stage process. The stages in this process are business, marketing, success, management, icons.
Magnifying Glass Ppt PowerPoint Presentation Outline
This is a magnifying glass ppt powerpoint presentation outline. This is a six stage process. The stages in this process are magnifying glass, icons, process, marketing, business.
Main Features Of Human Resource Analytics System Ppt PowerPoint Presentation File Skills PDF
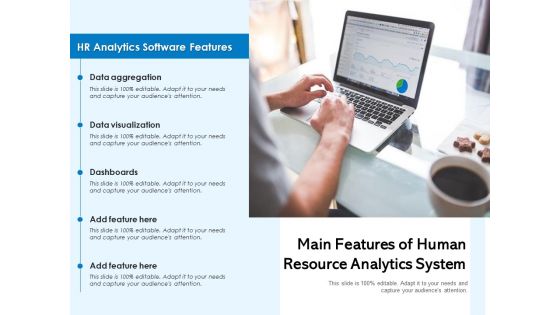
Presenting main features of human resource analytics system ppt powerpoint presentation file skills pdf. to dispense important information. This template comprises one stage. It also presents valuable insights into the topics including data aggregation, data visualization, dashboards. This is a completely customizable PowerPoint theme that can be put to use immediately. So, download it and address the topic impactfully.
Magnifying Glass Ppt PowerPoint Presentation Gallery
This is a magnifying glass ppt powerpoint presentation gallery. This is a five stage process. The stages in this process are magnifying glass, business, marketing, icons, technology.

Business Plan For Partner Enablement Implementation Ppt PowerPoint Presentation File Background Images PDF
Presenting business plan for partner enablement implementation ppt powerpoint presentation file background images pdf to dispense important information. This template comprises three stages. It also presents valuable insights into the topics including planning, business, dashboard. This is a completely customizable PowerPoint theme that can be put to use immediately. So, download it and address the topic impactfully.
Statistical Data Chart On Screen Monitor Ppt PowerPoint Presentation Outline Summary
Presenting this set of slides with name statistical data chart on screen monitor ppt powerpoint presentation outline summary. This is a one stage process. The stages in this process are data icon, status icon, status symbol icon. This is a completely editable PowerPoint presentation and is available for immediate download. Download now and impress your audience.
Data Reports Visualization Vector Ppt PowerPoint Presentation Visual Aids Deck
Presenting this set of slides with name data reports visualization vector ppt powerpoint presentation visual aids deck. The topics discussed in these slides are data visualization icon, research analysis, business focus. This is a completely editable PowerPoint presentation and is available for immediate download. Download now and impress your audience.
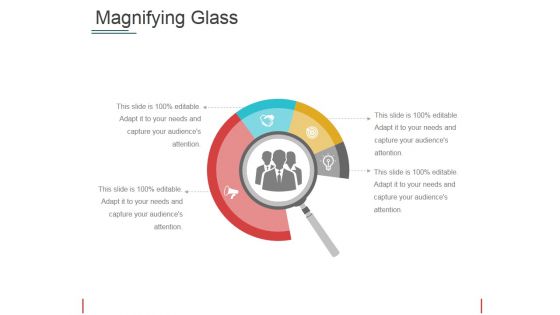
Magnifying Glass Ppt PowerPoint Presentation File Grid
This is a magnifying glass ppt powerpoint presentation file grid. This is a four stage process. The stages in this process are magnifying glass, icons, marketing, business, management.
Data Reports Visualization Vector Ppt Powerpoint Presentation Portfolio Grid
This is a data reports visualization vector ppt powerpoint presentation portfolio grid. This is a three stage process. The stages in this process are data visualization icon, data management icon.
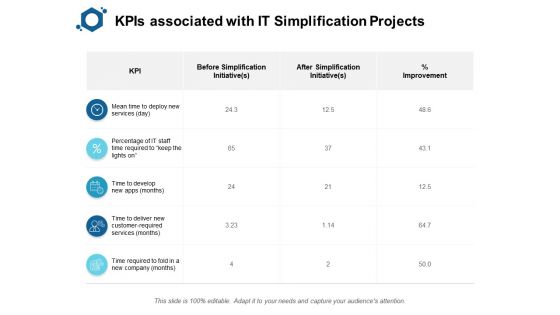
Kpis Associated With IT Simplification Projects Ppt PowerPoint Presentation Infographics Backgrounds
Presenting this set of slides with name kpis associated with it simplification projects ppt powerpoint presentation infographics backgrounds. The topics discussed in these slides are business, icons, planning, strategy, marketing. This is a completely editable PowerPoint presentation and is available for immediate download. Download now and impress your audience.
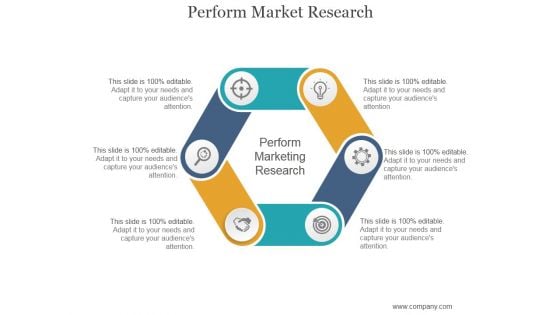
Perform Market Research Ppt PowerPoint Presentation Template
This is a perform market research ppt powerpoint presentation template. This is a six stage process. The stages in this process are perform marketing research, icons, management, process, icons.
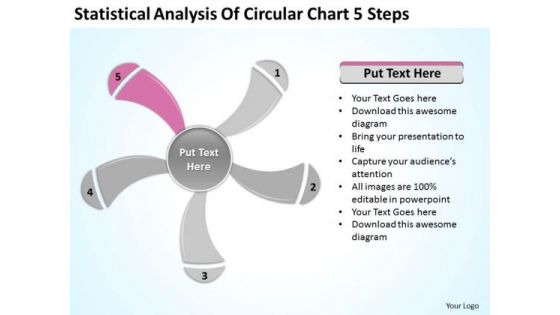
Statistical Analysis Of Circular Chart 5 Steps Ppt Outline For Business Plan PowerPoint Slides
We present our statistical analysis of circular chart 5 steps ppt outline for business plan PowerPoint Slides.Present our Business PowerPoint Templates because Our PowerPoint Templates and Slides will definately Enhance the stature of your presentation. Adorn the beauty of your thoughts with their colourful backgrounds. Download our Signs PowerPoint Templates because They will Put the wind in your sails. Skim smoothly over the choppy waters of the market. Download our Shapes PowerPoint Templates because Our PowerPoint Templates and Slides come in all colours, shades and hues. They help highlight every nuance of your views. Download and present our Metaphors-Visual Concepts PowerPoint Templates because Our PowerPoint Templates and Slides will let your words and thoughts hit bullseye everytime. Download and present our Process and Flows PowerPoint Templates because Our PowerPoint Templates and Slides will help you be quick off the draw. Just enter your specific text and see your points hit home.Use these PowerPoint slides for presentations relating to graphically, graphic, vector, layout, business, computation, sign, infochart, visual, symbol, template, diagram, calculations, sector, data, revenue, schedule, element, analysis, drawing, report, technology, contour, classification, graph, modern, illustration, icon, comparison, object, chart, collection, science, color, growth, composition, professional, set, education, math, profits, information, symmetry, statistic, structure, infographics, button. The prominent colors used in the PowerPoint template are Pink, Gray, White. Our Statistical Analysis Of Circular Chart 5 Steps Ppt Outline For Business Plan PowerPoint Slides will ensure you get a good grade. You will be glad you tried us out.
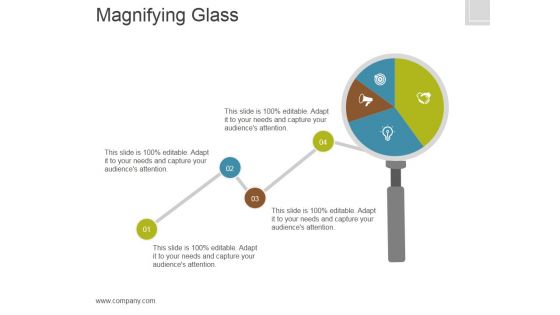
Magnifying Glass Ppt PowerPoint Presentation Professional
This is a magnifying glass ppt powerpoint presentation professional. This is a four stage process. The stages in this process are icons, process, business, marketing, analysis.
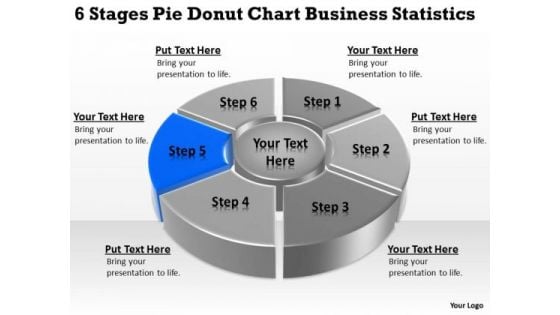
Templates Free Download Statistics Startup Business Plan Outline PowerPoint
We present our templates free download statistics startup business plan outline PowerPoint.Download our Process and Flows PowerPoint Templates because It can be used to Set your controls for the heart of the sun. Our PowerPoint Templates and Slides will be the propellant to get you there. Download our Circle Charts PowerPoint Templates because Our PowerPoint Templates and Slides will steer your racing mind. Hit the right buttons and spur on your audience. Present our Marketing PowerPoint Templates because You can Raise a toast with our PowerPoint Templates and Slides. Spread good cheer amongst your audience. Present our Flow Charts PowerPoint Templates because You can Double your output with our PowerPoint Templates and Slides. They make beating deadlines a piece of cake. Use our Business PowerPoint Templates because You can Rise to the occasion with our PowerPoint Templates and Slides. You will bring your audience on their feet in no time.Use these PowerPoint slides for presentations relating to Infographic, graph, chart, data, icon, diagram, progress, bar, line, download, button, pie, search, time, statistics, percent, segment, cloud, business, concept, sign,loading, symbol, template, circle, graphic, modern, status, visualization, roundabstract, management, mba, manage, illustration, weakness, strategy, project, clipart, guidelines, direction, design, organization, commerce, conceptual,heirarchy, resource, theoretical, action, goals, performance. The prominent colors used in the PowerPoint template are Blue, Gray, White. Display your class with our Templates Free Download Statistics Startup Business Plan Outline PowerPoint. Demonstrate your expertise to your audience.
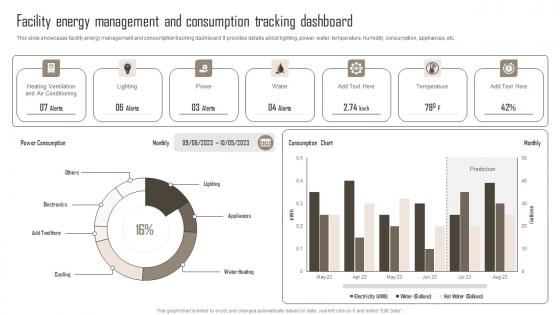
Facility Energy Management Comprehensive Guide For Building Management Diagrams Pdf
This slide showcases facility energy management and consumption tracking dashboard. It provides details about lighting, power, water, temperature, humidity, consumption, appliances, etc. If you are looking for a format to display your unique thoughts, then the professionally designed Facility Energy Management Comprehensive Guide For Building Management Diagrams Pdf is the one for you. You can use it as a Google Slides template or a PowerPoint template. Incorporate impressive visuals, symbols, images, and other charts. Modify or reorganize the text boxes as you desire. Experiment with shade schemes and font pairings. Alter, share or cooperate with other people on your work. Download Facility Energy Management Comprehensive Guide For Building Management Diagrams Pdf and find out how to give a successful presentation. Present a perfect display to your team and make your presentation unforgettable. This slide showcases facility energy management and consumption tracking dashboard. It provides details about lighting, power, water, temperature, humidity, consumption, appliances, etc.
Magnify Ppt PowerPoint Presentation Template
This is a magnify ppt powerpoint presentation template. This is a one stage process. The stages in this process are magnifier, icons, search, brand, analysis, success.
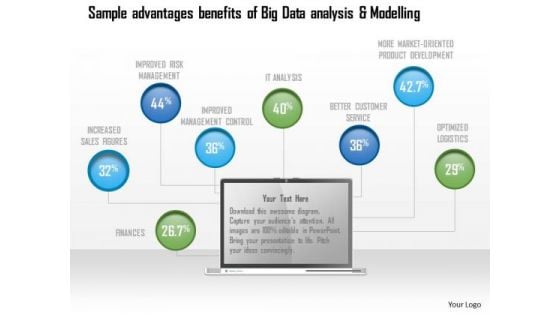
Business Diagram Sample Advantages Benefits Of Big Data Analysis And Modelling Ppt Slide
Explain the concept of sample advantages and benefits of big data analysis with this unique diagram. This slide contains the graphic of data icons. Use this slide to present data analysis and modeling related topics in any presentation.
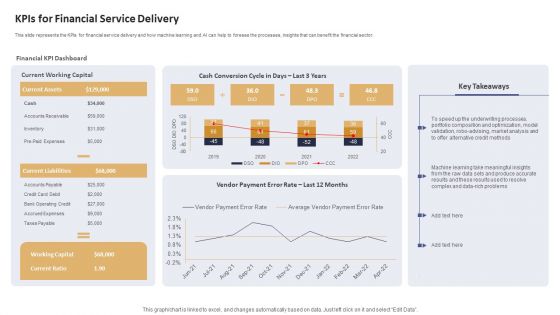
Data Processing Services Delivery Kpis For Financial Service Delivery Diagrams PDF
This slide represents the KPIs for financial service delivery and how machine learning and AI can help to foresee the processes, insights that can benefit the financial sector. Deliver an awe inspiring pitch with this creative Data Processing Services Delivery Kpis For Financial Service Delivery Diagrams PDF bundle. Topics like Financial KPI Dashboard, Current Working Capital, Cash Conversion can be discussed with this completely editable template. It is available for immediate download depending on the needs and requirements of the user.
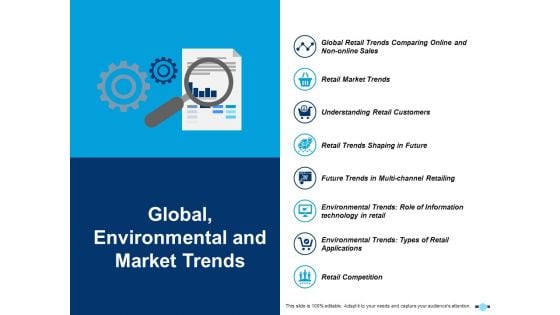
Global Environmental And Market Trends Retail Market Trends Ppt PowerPoint Presentation Styles Information
This is a global environmental and market trends retail market trends ppt powerpoint presentation styles information. This is a eight stage process. The stages in this process are icons, management, strategy, analysis, marketing.
Data Model Performance Tracking Data Modeling Approaches For Modern Analytics Formats Pdf
This slide shows the data model performance tracking dashboard. The purpose of this slide is to represent the Information related to the change brought by data models graphically. Present like a pro with Data Model Performance Tracking Data Modeling Approaches For Modern Analytics Formats Pdf Create beautiful presentations together with your team, using our easy to use presentation slides. Share your ideas in real time and make changes on the fly by downloading our templates. So whether you are in the office, on the go, or in a remote location, you can stay in sync with your team and present your ideas with confidence. With Slidegeeks presentation got a whole lot easier. Grab these presentations today. This slide shows the data model performance tracking dashboard. The purpose of this slide is to represent the Information related to the change brought by data models graphically.
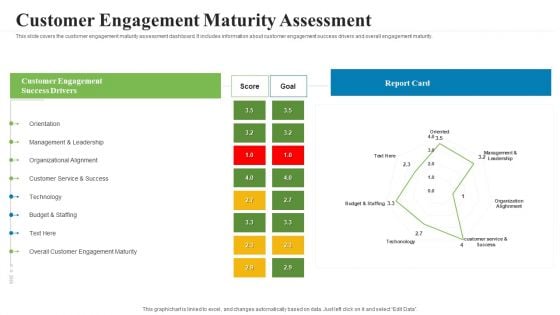
Creating Successful Advertising Campaign Customer Engagement Maturity Assessment Diagrams PDF
This slide covers the customer engagement maturity assessment dashboard. It includes information about customer engagement success drivers and overall engagement maturity. Deliver an awe inspiring pitch with this creative Creating Successful Advertising Campaign Customer Engagement Maturity Assessment Diagrams PDF bundle. Topics like customer engagement, management, leadership, technology, budget can be discussed with this completely editable template. It is available for immediate download depending on the needs and requirements of the user.
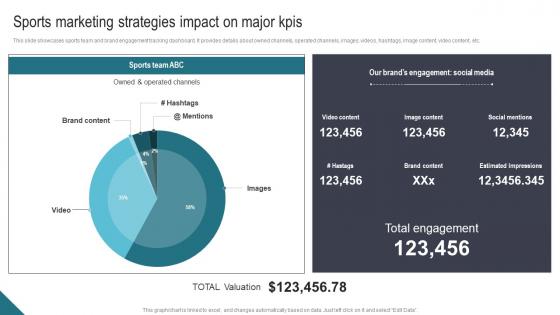
Sports Marketing Strategies Impact On Major KPIs Athletic Activities Advertising Program Graphics Pdf
This slide showcases sports team and brand engagement tracking dashboard. It provides details about owned channels, operated channels, images, videos, hashtags, image content, video content, etc. Do you have an important presentation coming up Are you looking for something that will make your presentation stand out from the rest Look no further than Sports Marketing Strategies Impact On Major KPIs Athletic Activities Advertising Program Graphics Pdf. With our professional designs, you can trust that your presentation will pop and make delivering it a smooth process. And with Slidegeeks, you can trust that your presentation will be unique and memorable. So why wait Grab Sports Marketing Strategies Impact On Major KPIs Athletic Activities Advertising Program Graphics Pdf today and make your presentation stand out from the rest. This slide showcases sports team and brand engagement tracking dashboard. It provides details about owned channels, operated channels, images, videos, hashtags, image content, video content, etc.
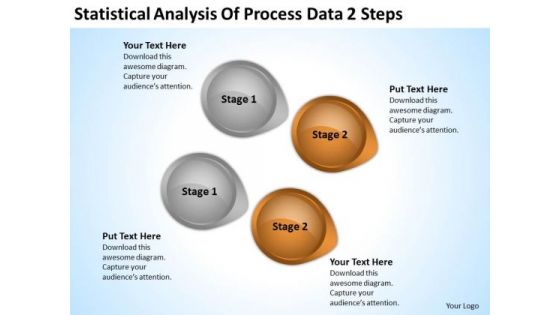
Arrow In PowerPoint Statistical Analysis Of Process Data 2 Steps Ppt Slide
We present our arrow in powerpoint statistical analysis of process data 2 steps ppt Slide.Download our Business PowerPoint Templates because Our PowerPoint Templates and Slides will weave a web of your great ideas. They are gauranteed to attract even the most critical of your colleagues. Use our Circle Charts PowerPoint Templates because Our PowerPoint Templates and Slides will let your words and thoughts hit bullseye everytime. Download our Arrows PowerPoint Templates because Our PowerPoint Templates and Slides will let you Hit the right notes. Watch your audience start singing to your tune. Download and present our Shapes PowerPoint Templates because You have the co-ordinates for your destination of success. Let our PowerPoint Templates and Slides map out your journey. Download and present our Signs PowerPoint Templates because It will let you Set new benchmarks with our PowerPoint Templates and Slides. They will keep your prospects well above par.Use these PowerPoint slides for presentations relating to 3d, abstract, analysis, arrow, background, business, button, chart, circle, circular, color, concept, conservation, cycle, development, diagram, direction, eco, ecology, energy, environment, flow, flowchart, globe, graphic, growing, growth, icon, internet, isolated, object, power, process, protection, recyclable, recycle, recycling, render, resource, saving, sign, solution, sphere, statistic, sustainable, symbol, technology, white. The prominent colors used in the PowerPoint template are Brown, Gray, Black. You can be sure our arrow in powerpoint statistical analysis of process data 2 steps ppt Slide are designed by professionals People tell us our button PowerPoint templates and PPT Slides will make the presenter look like a pro even if they are not computer savvy. You can be sure our arrow in powerpoint statistical analysis of process data 2 steps ppt Slide are designed by professionals Use our arrow PowerPoint templates and PPT Slides have awesome images to get your point across. Presenters tell us our arrow in powerpoint statistical analysis of process data 2 steps ppt Slide will make the presenter successul in his career/life. We assure you our arrow PowerPoint templates and PPT Slides are visually appealing. Get noticed immediately with our Arrow In PowerPoint Statistical Analysis Of Process Data 2 Steps Ppt Slide. Dont waste time struggling with PowerPoint. Let us do it for you.
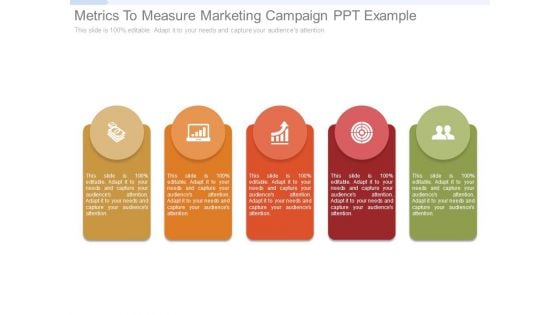
Metrics To Measure Marketing Campaign Ppt Example
This is a metrics to measure marketing campaign ppt example. This is a five stage process. The stages in this process are marketing, business, strategy, icons, management.
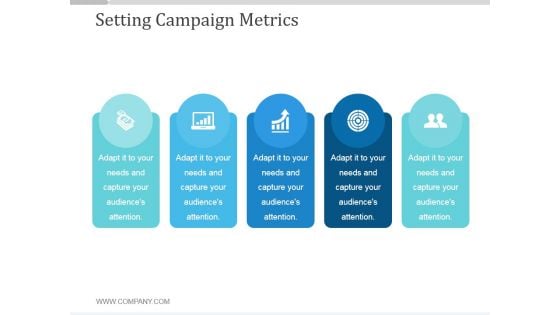
Setting Campaign Metrics Ppt PowerPoint Presentation Templates
This is a setting campaign metrics ppt powerpoint presentation templates. This is a five stage process. The stages in this process are business, marketing, icons, strategy.
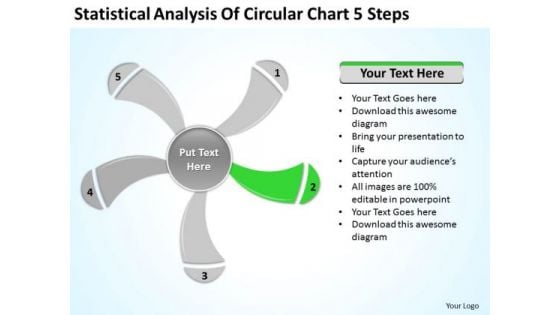
Statistical Analysis Of Circular Chart 5 Steps Ppt Business Plan PowerPoint Slide
We present our statistical analysis of circular chart 5 steps ppt business plan PowerPoint Slide.Download and present our Business PowerPoint Templates because Our PowerPoint Templates and Slides will definately Enhance the stature of your presentation. Adorn the beauty of your thoughts with their colourful backgrounds. Use our Signs PowerPoint Templates because Our PowerPoint Templates and Slides will give good value for money. They also have respect for the value of your time. Download our Shapes PowerPoint Templates because Our PowerPoint Templates and Slides team portray an attitude of elegance. Personify this quality by using them regularly. Use our Metaphors-Visual Concepts PowerPoint Templates because Our PowerPoint Templates and Slides will effectively help you save your valuable time. They are readymade to fit into any presentation structure. Use our Process and Flows PowerPoint Templates because our PowerPoint Templates and Slides are the string of your bow. Fire of your ideas and conquer the podium.Use these PowerPoint slides for presentations relating to graphically, graphic, vector, layout, business, computation, sign, infochart, visual, symbol, template, diagram, calculations, sector, data, revenue, schedule, element, analysis, drawing, report, technology, contour, classification, graph, modern, illustration, icon, comparison, object, chart, collection, science, color, growth, composition, professional, set, education, math, profits, information, symmetry, statistic, structure, infographics, button. The prominent colors used in the PowerPoint template are Green, Gray, White. Get a blue-chip client list with your ideas. Attract the best customers with our Statistical Analysis Of Circular Chart 5 Steps Ppt Business Plan PowerPoint Slide.
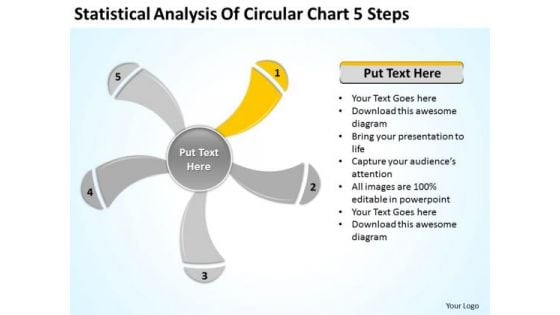
Statistical Analysis Of Circular Chart 5 Steps Ppt Business Plan PowerPoint Slides
We present our statistical analysis of circular chart 5 steps ppt business plan PowerPoint Slides.Download and present our Business PowerPoint Templates because Timeline crunches are a fact of life. Meet all deadlines using our PowerPoint Templates and Slides. Present our Signs PowerPoint Templates because You can Zap them with our PowerPoint Templates and Slides. See them reel under the impact. Use our Shapes PowerPoint Templates because It can Bubble and burst with your ideas. Download our Metaphors-Visual Concepts PowerPoint Templates because You can Create a matrix with our PowerPoint Templates and Slides. Feel the strength of your ideas click into place. Present our Process and Flows PowerPoint Templates because Our PowerPoint Templates and Slides has conjured up a web of all you need with the help of our great team. Use them to string together your glistening ideas.Use these PowerPoint slides for presentations relating to graphically, graphic, vector, layout, business, computation, sign, infochart, visual, symbol, template, diagram, calculations, sector, data, revenue, schedule, element, analysis, drawing, report, technology, contour, classification, graph, modern, illustration, icon, comparison, object, chart, collection, science, color, growth, composition, professional, set, education, math, profits, information, symmetry, statistic, structure, infographics, button. The prominent colors used in the PowerPoint template are Yellow, Gray, White. Use our Statistical Analysis Of Circular Chart 5 Steps Ppt Business Plan PowerPoint Slides to brainstorm. You will be amazed at the ideas that emerge.
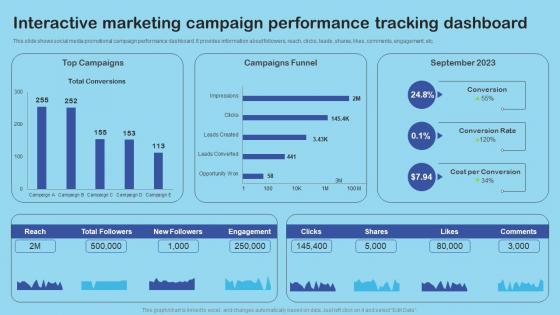
Interactive Marketing Campaign Performance Enhance Client Engagement With Interactive Pictures Pdf
This slide shows social media promotional campaign performance dashboard. It provides information about followers, reach, clicks, leads, shares, likes, comments, engagement, etc. Whether you have daily or monthly meetings, a brilliant presentation is necessary. Interactive Marketing Campaign Performance Enhance Client Engagement With Interactive Pictures Pdf can be your best option for delivering a presentation. Represent everything in detail using Interactive Marketing Campaign Performance Enhance Client Engagement With Interactive Pictures Pdf and make yourself stand out in meetings. The template is versatile and follows a structure that will cater to your requirements. All the templates prepared by Slidegeeks are easy to download and edit. Our research experts have taken care of the corporate themes as well. So, give it a try and see the results. This slide shows social media promotional campaign performance dashboard. It provides information about followers, reach, clicks, leads, shares, likes, comments, engagement, etc.
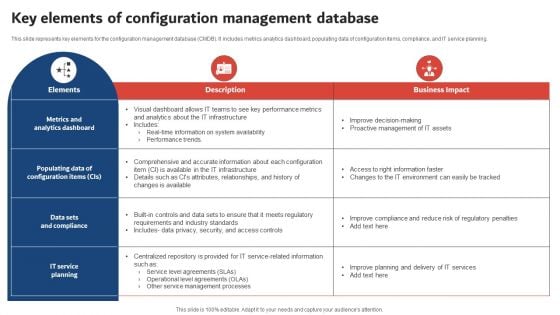
Execution Of ICT Strategic Plan Key Elements Of Configuration Management Database Themes PDF
This slide represents key elements for the configuration management database CMDB. It includes metrics analytics dashboard, populating data of configuration items, compliance, and IT service planning. There are so many reasons you need a Execution Of ICT Strategic Plan Key Elements Of Configuration Management Database Themes PDF. The first reason is you can not spend time making everything from scratch, Thus, Slidegeeks has made presentation templates for you too. You can easily download these templates from our website easily.
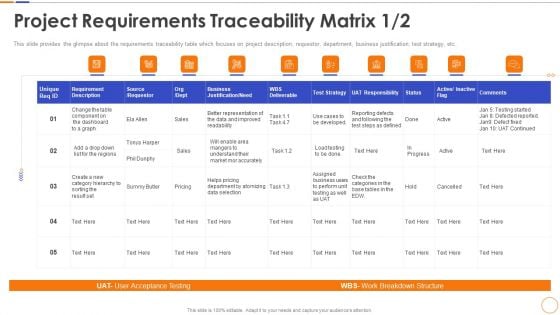
Project Requirements Traceability Matrix Strategy Diagrams PDF
This slide provides the glimpse about the requirements traceability table which focuses on project description, requestor, department, business justification, test strategy, etc. Deliver and pitch your topic in the best possible manner with this project requirements traceability matrix strategy diagrams pdf. Use them to share invaluable insights on dashboard, data, requirement, strategy and impress your audience. This template can be altered and modified as per your expectations. So, grab it now.
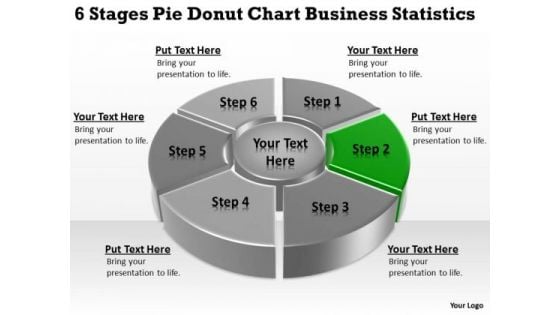
Templates Download Statistics Business Plan For Small PowerPoint Slides
We present our templates download statistics business plan for small PowerPoint Slides.Download our Process and Flows PowerPoint Templates because Our PowerPoint Templates and Slides will give you great value for your money. Be assured of finding the best projection to highlight your words. Present our Circle Charts PowerPoint Templates because You should Press the right buttons with our PowerPoint Templates and Slides. They will take your ideas down the perfect channel. Download our Shapes PowerPoint Templates because It will get your audience in sync. Download our Business PowerPoint Templates because You will get more than you ever bargained for. Download and present our Marketing PowerPoint Templates because Our PowerPoint Templates and Slides are focused like a searchlight beam. They highlight your ideas for your target audience.Use these PowerPoint slides for presentations relating to Infographic, graph, chart, data, icon, diagram, progress, bar, line, download, button, pie, search, time, statistics, percent, segment, cloud, business, concept, sign,loading, symbol, template, circle, graphic, full, element, report, level, black, shape, computer, modern, status, visualization, round, section, web,design, statistics, growth, colorful, info, stats, information, indicator. The prominent colors used in the PowerPoint template are Green, Gray, Black. Get up real close with our Templates Download Statistics Business Plan For Small PowerPoint Slides. Your goals will come within touching distance.
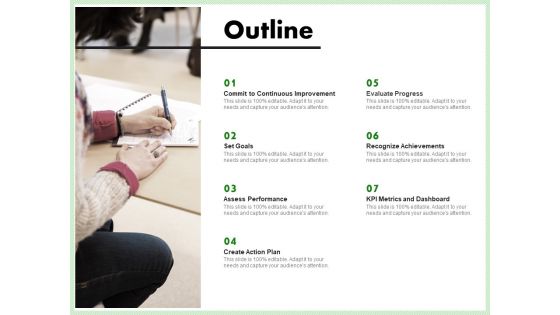
Eco Friendly And Feasibility Management Outline Themes PDF
Presenting eco friendly and feasibility management outline themes pdf. to provide visual cues and insights. Share and navigate important information on seven stages that need your due attention. This template can be used to pitch topics like assess performance, create action plan, metrics and dashboard, recognize achievements, evaluate progress, continuous improvement. In addtion, this PPT design contains high-resolution images, graphics, etc, that are easily editable and available for immediate download.
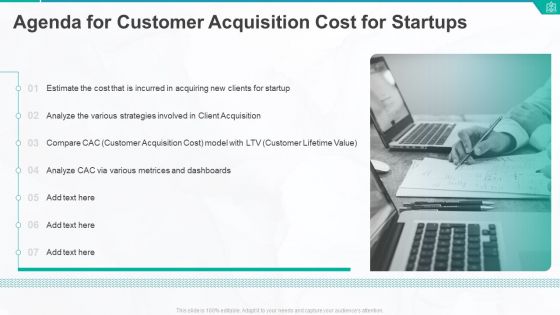
Agenda For Customer Acquisition Cost For Startups Themes PDF
This is a agenda for customer acquisition cost for startups themes pdf template with various stages. Focus and dispense information on seven stages using this creative set, that comes with editable features. It contains large content boxes to add your information on topics like client acquisition, dashboards, metrices, various strategies, analyze. You can also showcase facts, figures, and other relevant content using this PPT layout. Grab it now.
Magnifier Glass Ppt PowerPoint Presentation Ideas
This is a magnifier glass ppt powerpoint presentation ideas. This is a five stage process. The stages in this process are magnifier, icons, process, strategy, success.
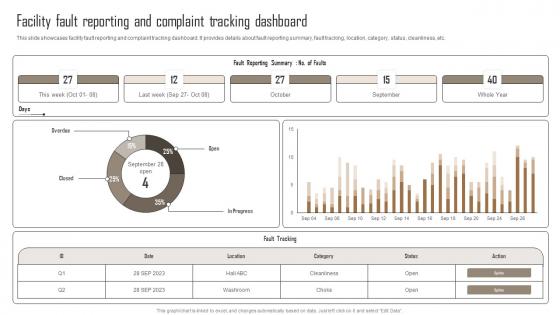
Facility Fault Reporting And Comprehensive Guide For Building Management Professional Pdf
This slide showcases facility fault reporting and complaint tracking dashboard. It provides details about fault reporting summary, fault tracking, location, category, status, cleanliness, etc. Are you in need of a template that can accommodate all of your creative concepts This one is crafted professionally and can be altered to fit any style. Use it with Google Slides or PowerPoint. Include striking photographs, symbols, depictions, and other visuals. Fill, move around, or remove text boxes as desired. Test out color palettes and font mixtures. Edit and save your work, or work with colleagues. Download Facility Fault Reporting And Comprehensive Guide For Building Management Professional Pdf and observe how to make your presentation outstanding. Give an impeccable presentation to your group and make your presentation unforgettable. This slide showcases facility fault reporting and complaint tracking dashboard. It provides details about fault reporting summary, fault tracking, location, category, status, cleanliness, etc.
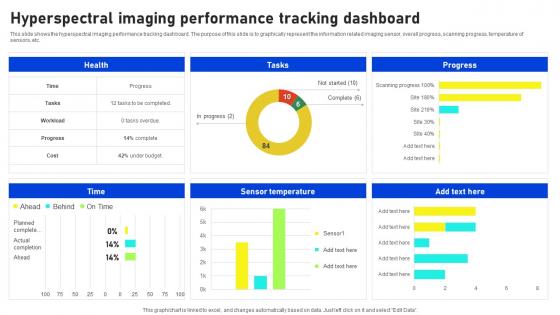
Hyperspectral Imaging Performance Hyperspectral Imaging Sensors And Systems Introduction Pdf
This slide shows the hyperspectral imaging performance tracking dashboard. The purpose of this slide is to graphically represent the information related imaging sensor, overall progress, scanning progress, temperature of sensors, etc. Do you have an important presentation coming up Are you looking for something that will make your presentation stand out from the rest Look no further than Hyperspectral Imaging Performance Hyperspectral Imaging Sensors And Systems Introduction Pdf. With our professional designs, you can trust that your presentation will pop and make delivering it a smooth process. And with Slidegeeks, you can trust that your presentation will be unique and memorable. So why wait Grab Hyperspectral Imaging Performance Hyperspectral Imaging Sensors And Systems Introduction Pdf today and make your presentation stand out from the rest This slide shows the hyperspectral imaging performance tracking dashboard. The purpose of this slide is to graphically represent the information related imaging sensor, overall progress, scanning progress, temperature of sensors, etc.

Project Cost And Performance Schedule Management Techniques PPT Example
This slide presents project cost and performance analysis dashboard, that highlights effectiveness of scheduling on output. It provides information on project cost, performance, stages and resource capacity compared with time. Slidegeeks has constructed Project Cost And Performance Schedule Management Techniques PPT Example after conducting extensive research and examination. These presentation templates are constantly being generated and modified based on user preferences and critiques from editors. Here, you will find the most attractive templates for a range of purposes while taking into account ratings and remarks from users regarding the content. This is an excellent jumping-off point to explore our content and will give new users an insight into our top-notch PowerPoint Templates. This slide presents project cost and performance analysis dashboard, that highlights effectiveness of scheduling on output. It provides information on project cost, performance, stages and resource capacity compared with time

 Home
Home