Dashboard Icon
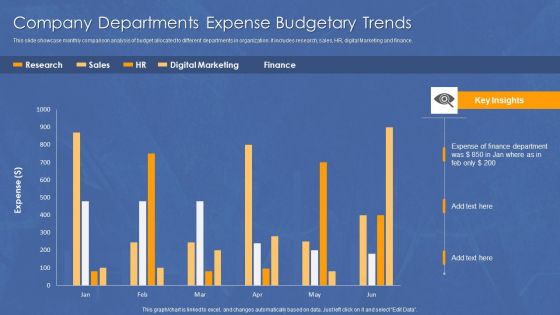
Company Departments Expense Budgetary Trends Diagrams PDF
This slide showcase monthly comparison analysis of budget allocated to different departments in organization. It includes research, sales, HR, digital Marketing and finance. Pitch your topic with ease and precision using this Company Departments Expense Budgetary Trends Diagrams PDF. This layout presents information on Expense, Finance, Department. It is also available for immediate download and adjustment. So, changes can be made in the color, design, graphics or any other component to create a unique layout.
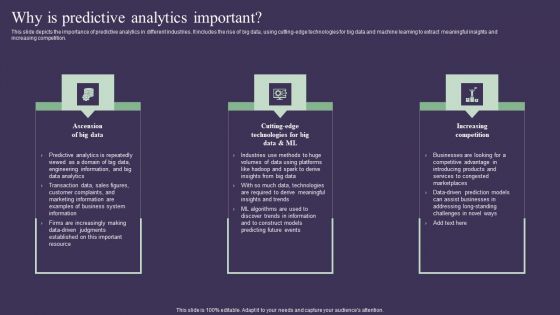
Projection Model Why Is Predictive Analytics Important Diagrams PDF
This slide depicts the importance of predictive analytics in different industries. It includes the rise of big data, using cutting-edge technologies for big data and machine learning to extract meaningful insights and increasing competition. Create an editable Projection Model Why Is Predictive Analytics Important Diagrams PDF that communicates your idea and engages your audience. Whether you are presenting a business or an educational presentation, pre-designed presentation templates help save time. Projection Model Why Is Predictive Analytics Important Diagrams PDF is highly customizable and very easy to edit, covering many different styles from creative to business presentations. Slidegeeks has creative team members who have crafted amazing templates. So, go and get them without any delay.
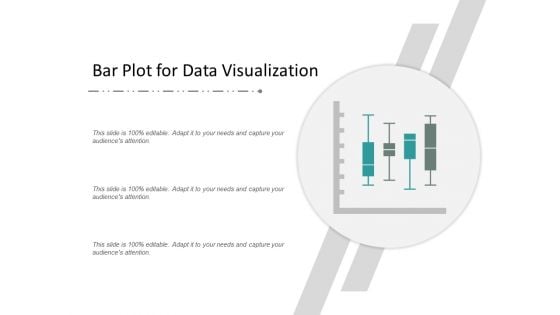
Bar Plot For Data Visualization Ppt Powerpoint Presentation Pictures Guide
This is a bar plot for data visualization ppt powerpoint presentation pictures guide. This is a four stage process. The stages in this process are scatter plot, probability plots, plot diagram.
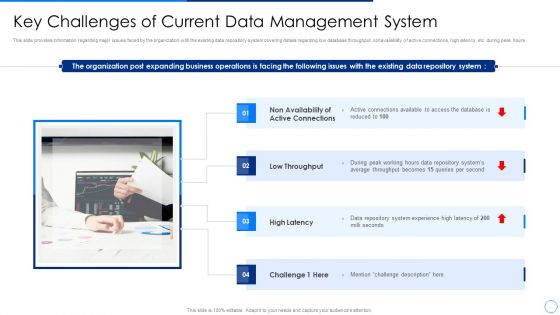
Scale Up Plan For Data Inventory Model Key Challenges Of Current Data Management System Themes PDF
This slide provides information regarding major issues faced by the organization with the existing data repository system covering details regarding low database throughput, nonavailability of active connections, high latency, etc. during peak hours. This is a scale up plan for data inventory model key challenges of current data management system themes pdf template with various stages. Focus and dispense information on four stages using this creative set, that comes with editable features. It contains large content boxes to add your information on topics like non availability of active connections, low throughput, high latency. You can also showcase facts, figures, and other relevant content using this PPT layout. Grab it now.
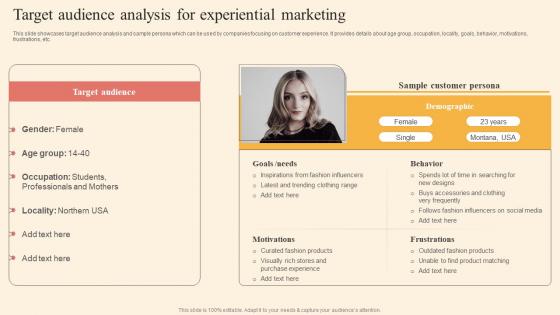
Target Audience Analysis Driving Business Success By Hosting Experiential Diagrams Pdf
This slide showcases target audience analysis and sample persona which can be used by companies focusing on customer experience. It provides details about age group, occupation, locality, goals, behavior, motivations, frustrations, etc. The Target Audience Analysis Driving Business Success By Hosting Experiential Diagrams Pdf is a compilation of the most recent design trends as a series of slides. It is suitable for any subject or industry presentation, containing attractive visuals and photo spots for businesses to clearly express their messages. This template contains a variety of slides for the user to input data, such as structures to contrast two elements, bullet points, and slides for written information. Slidegeeks is prepared to create an impression. This slide showcases target audience analysis and sample persona which can be used by companies focusing on customer experience. It provides details about age group, occupation, locality, goals, behavior, motivations, frustrations, etc.
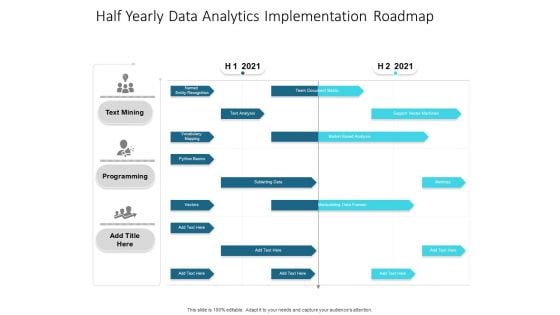
Half Yearly Data Analytics Implementation Roadmap Demonstration
We present our half yearly data analytics implementation roadmap demonstration. This PowerPoint layout is easy-to-edit so you can change the font size, font type, color, and shape conveniently. In addition to this, the PowerPoint layout is Google Slides compatible, so you can share it with your audience and give them access to edit it. Therefore, download and save this well-researched half yearly data analytics implementation roadmap demonstration in different formats like PDF, PNG, and JPG to smoothly execute your business plan.

Quarterly Data Analytics Career Roadmap For Engineering Professional Diagrams
Presenting our innovatively-structured quarterly data analytics career roadmap for engineering professional diagrams Template. Showcase your roadmap process in different formats like PDF, PNG, and JPG by clicking the download button below. This PPT design is available in both Standard Screen and Widescreen aspect ratios. It can also be easily personalized and presented with modified font size, font type, color, and shapes to measure your progress in a clear way.
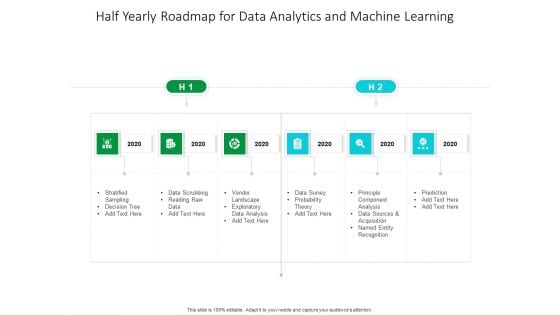
Half Yearly Roadmap For Data Analytics And Machine Learning Diagrams
Introducing our half yearly roadmap for data analytics and machine learning diagrams. This PPT presentation is Google Slides compatible, therefore, you can share it easily with the collaborators for measuring the progress. Also, the presentation is available in both standard screen and widescreen aspect ratios. So edit the template design by modifying the font size, font type, color, and shapes as per your requirements. As this PPT design is fully editable it can be presented in PDF, JPG and PNG formats.
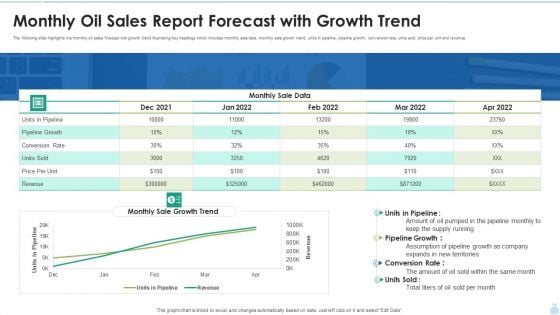
Monthly Oil Sales Report Forecast With Growth Trend Graphics PDF
The following slide highlights the monthly oil sales forecast with growth trend illustrating key headings which includes monthly sale data, monthly sale growth trend, units in pipeline, pipeline growth, conversion rate, units sold, price per unit and revenue. Showcasing this set of slides titled Monthly Oil Sales Report Forecast With Growth Trend Graphics PDF. The topics addressed in these templates are Pipeline Growth, Monthly Sale Data, Conversion Rate. All the content presented in this PPT design is completely editable. Download it and make adjustments in color, background, font etc. as per your unique business setting.
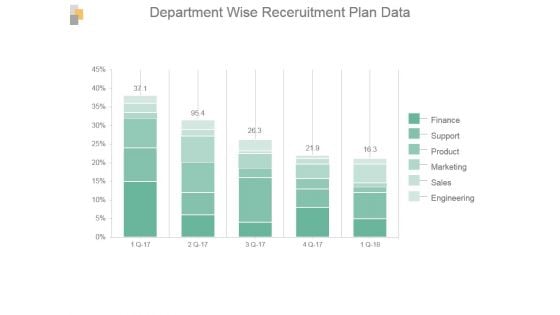
Department Wise Recruitment Plan Data Ppt Infographics
This is a department wise recruitment plan data ppt infographics. This is a five stage process. The stages in this process are finance, support, product, marketing, sales, engineering.
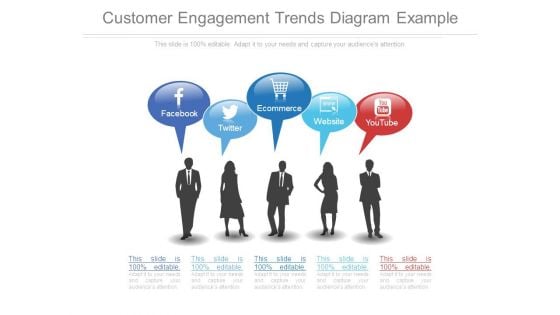
Customer Engagement Trends Diagram Example
This is a customer engagement trends diagram example. This is a five stage process. The stages in this process are facebook, twitter, ecommerce, website, youtube.
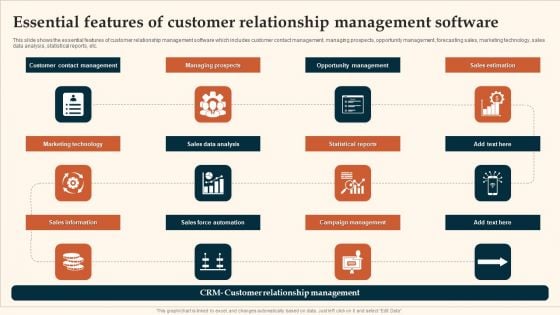
Essential Features Of Customer Relationship Management Software Formats PDF
This slide shows the essential features of customer relationship management software which includes customer contact management, managing prospects, opportunity management, forecasting sales, marketing technology, sales data analysis, statistical reports, etc. Presenting Essential Features Of Customer Relationship Management Software Formats PDF to dispense important information. This template comprises tweleve stages. It also presents valuable insights into the topics including Marketing Technology, Sales Data Analysis, Statistical Reports. This is a completely customizable PowerPoint theme that can be put to use immediately. So, download it and address the topic impactfully.
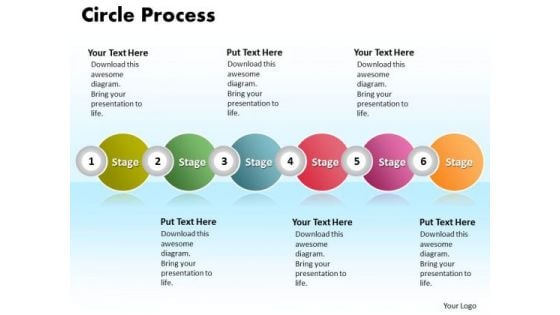
Ppt Circle Procurement Process PowerPoint Presentation 6 Phase Diagram Templates
PPT circle procurement process powerpoint presentation 6 phase diagram Templates-This template offers an excellent background to build up the various stages of your marketing process. Bullet-point your thoughts and ideas to profitably accomplish every step of every stage along the way.-PPT circle procurement process powerpoint presentation 6 phase diagram Templates-Abstract, Business, Chart, Circle, Company, Corporate, Design, Diagram, Different, Graph, Illustration, Information, Item, Junction, Management, Marketing, Menu, Modern, Network, Options, Parts, Pie, Plan, Presentation, Process, Report, Representational, Segments, Sphere, Statistics, Strategy, Structure, Wheel Back up your boast with our Ppt Circle Procurement Process PowerPoint Presentation 6 Phase Diagram Templates. Demonstrate to your audience that you can.
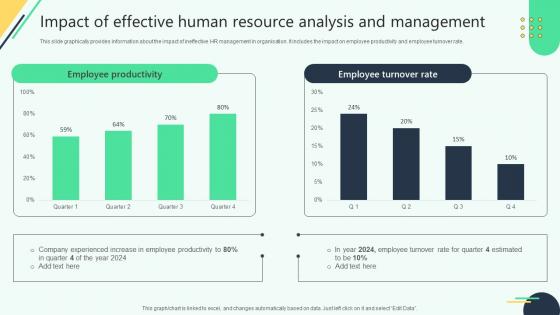
Impact Of Effective Human Resource Analysis And Analysing Hr Data For Effective Decision Making
This slide graphically provides information about the impact of ineffective HR management in organisation. It includes the impact on employee productivity and employee turnover rate. Slidegeeks has constructed Impact Of Effective Human Resource Analysis And Analysing Hr Data For Effective Decision Making after conducting extensive research and examination. These presentation templates are constantly being generated and modified based on user preferences and critiques from editors. Here, you will find the most attractive templates for a range of purposes while taking into account ratings and remarks from users regarding the content. This is an excellent jumping-off point to explore our content and will give new users an insight into our top-notch PowerPoint Templates. This slide graphically provides information about the impact of ineffective HR management in organisation. It includes the impact on employee productivity and employee turnover rate.
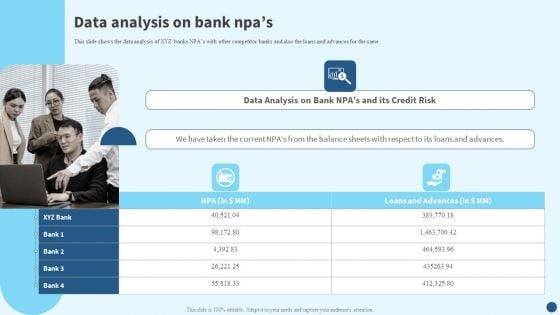
Credit Risk Management Data Analysis On Bank Npas Microsoft PDF
This slide shows the data analysis of XYZ banks NPAs with other competitor banks and also the loans and advances for the same. Whether you have daily or monthly meetings, a brilliant presentation is necessary. Credit Risk Management Data Analysis On Bank Npas Microsoft PDF can be your best option for delivering a presentation. Represent everything in detail using Credit Risk Management Data Analysis On Bank Npas Microsoft PDF and make yourself stand out in meetings. The template is versatile and follows a structure that will cater to your requirements. All the templates prepared by Slidegeeks are easy to download and edit. Our research experts have taken care of the corporate themes as well. So, give it a try and see the results.
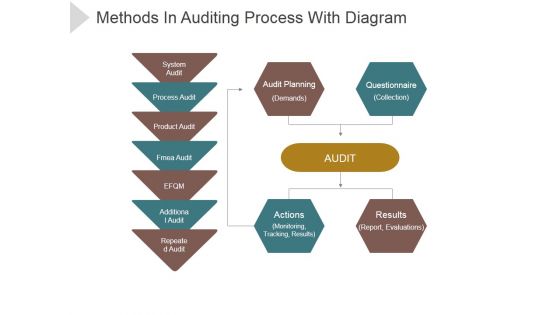
Methods In Auditing Process With Diagram Ppt PowerPoint Presentation Visual Aids
This is a methods in auditing process with diagram ppt powerpoint presentation visual aids. This is a four stage process. The stages in this process are system audit, process audit, product audit, fame audit, additional audit.
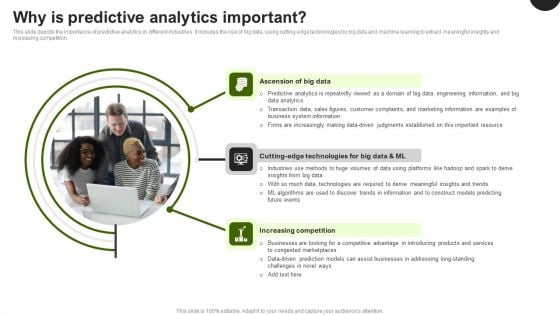
Predictive Analytics In The Age Of Big Data Why Is Predictive Analytics Important Clipart PDF
This slide depicts the importance of predictive analytics in different industries. It includes the rise of big data, using cutting-edge technologies for big data and machine learning to extract meaningful insights and increasing competition. Whether you have daily or monthly meetings, a brilliant presentation is necessary. Predictive Analytics In The Age Of Big Data Why Is Predictive Analytics Important Clipart PDF can be your best option for delivering a presentation. Represent everything in detail using Predictive Analytics In The Age Of Big Data Why Is Predictive Analytics Important Clipart PDF and make yourself stand out in meetings. The template is versatile and follows a structure that will cater to your requirements. All the templates prepared by Slidegeeks are easy to download and edit. Our research experts have taken care of the corporate themes as well. So, give it a try and see the results.
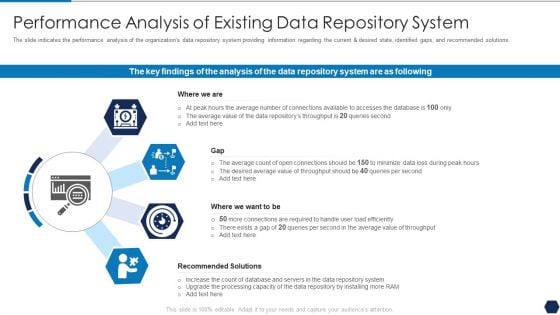
Tactical Plan For Upgrading DBMS Performance Analysis Of Existing Data Repository System Themes PDF
The slide indicates the performance analysis of the organizations data repository system providing information regarding the current and desired state, identified gaps, and recommended solutions. This is a tactical plan for upgrading dbms performance analysis of existing data repository system themes pdf template with various stages. Focus and dispense information on four stages using this creative set, that comes with editable features. It contains large content boxes to add your information on topics like performance analysis of existing data repository system. You can also showcase facts, figures, and other relevant content using this PPT layout. Grab it now.
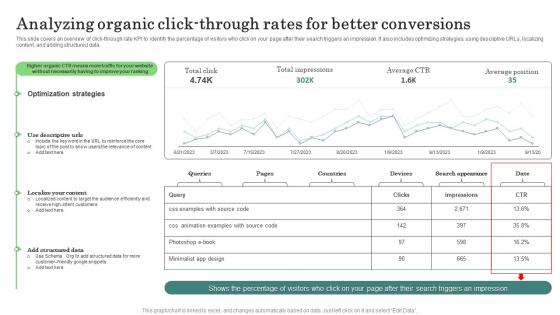
Analyzing Organic Click Through Major Promotional Analytics Future Trends Microsoft Pdf
This slide covers an overview of click through rate KPI to identify the percentage of visitors who click on your page after their search triggers an impression. It also includes optimizing strategies, using descriptive URLs, localizing content, and adding structured data. From laying roadmaps to briefing everything in detail, our templates are perfect for you. You can set the stage with your presentation slides. All you have to do is download these easy to edit and customizable templates. Analyzing Organic Click Through Major Promotional Analytics Future Trends Microsoft Pdf will help you deliver an outstanding performance that everyone would remember and praise you for. Do download this presentation today. This slide covers an overview of click through rate KPI to identify the percentage of visitors who click on your page after their search triggers an impression. It also includes optimizing strategies, using descriptive URLs, localizing content, and adding structured data.
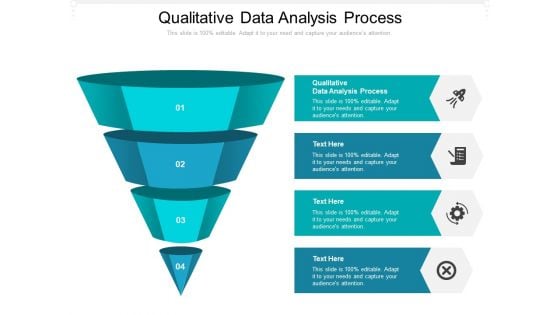
Qualitative Data Analysis Process Ppt PowerPoint Presentation Layouts Themes Cpb Pdf
Presenting this set of slides with name qualitative data analysis process ppt powerpoint presentation layouts themes cpb pdf. This is an editable Powerpoint four stages graphic that deals with topics like qualitative data analysis process to help convey your message better graphically. This product is a premium product available for immediate download and is 100 percent editable in Powerpoint. Download this now and use it in your presentations to impress your audience.
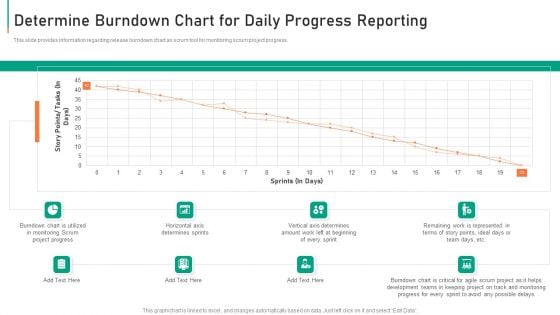
Determine Burndown Chart For Daily Progress Reporting Diagrams PDF
This slide provides information regarding release burndown chart as scrum tool for monitoring scrum project progress. Deliver and pitch your topic in the best possible manner with this determine burndown chart for daily progress reporting diagrams pdf. Use them to share invaluable insights on determine burndown chart for daily progress reporting and impress your audience. This template can be altered and modified as per your expectations. So, grab it now.
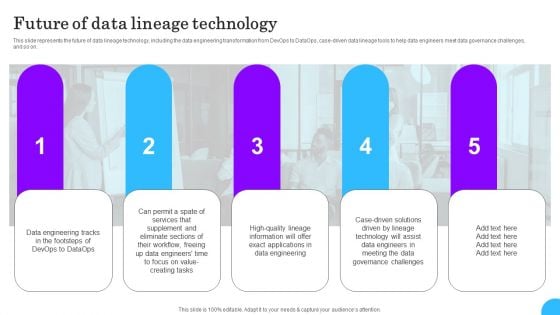
Comprehensive Analysis Of Different Data Lineage Classification Future Of Data Lineage Technology Ideas PDF
This slide represents the future of data lineage technology, including the data engineering transformation from DevOps to DataOps, case-driven data lineage tools to help data engineers meet data governance challenges, and so on. Are you searching for a Comprehensive Analysis Of Different Data Lineage Classification Future Of Data Lineage Technology Ideas PDF that is uncluttered, straightforward, and original Its easy to edit, and you can change the colors to suit your personal or business branding. For a presentation that expresses how much effort you have put in, this template is ideal With all of its features, including tables, diagrams, statistics, and lists, its perfect for a business plan presentation. Make your ideas more appealing with these professional slides. Download Comprehensive Analysis Of Different Data Lineage Classification Future Of Data Lineage Technology Ideas PDF from Slidegeeks today.
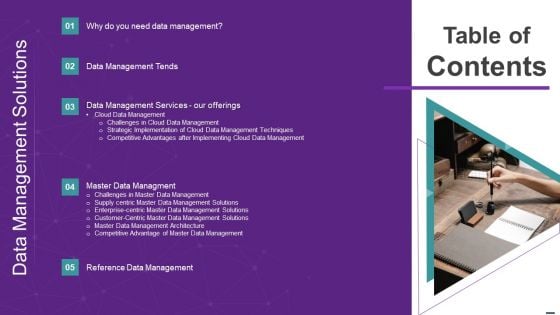
Data Management Solutions Table Of Contents Themes PDF
This is a Data Management Solutions Table Of Contents Themes PDF template with various stages. Focus and dispense information on eleven stages using this creative set, that comes with editable features. It contains large content boxes to add your information on topics like Data Management Tends, Data Management Services, Master Data Managment. You can also showcase facts, figures, and other relevant content using this PPT layout. Grab it now.
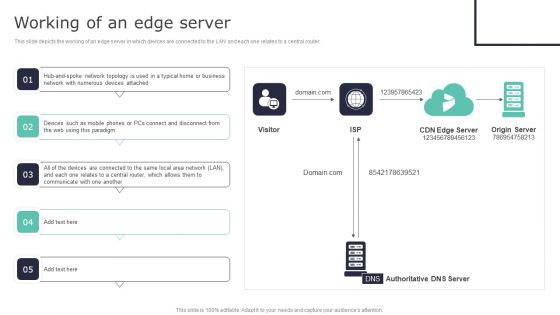
Deploying Content Distribution Network System Working Of An Edge Server Diagrams PDF
This slide depicts the working of an edge server in which devices are connected to the LAN and each one relates to a central router. From laying roadmaps to briefing everything in detail, our templates are perfect for you. You can set the stage with your presentation slides. All you have to do is download these easy-to-edit and customizable templates. Deploying Content Distribution Network System Working Of An Edge Server Diagrams PDF will help you deliver an outstanding performance that everyone would remember and praise you for. Do download this presentation today.
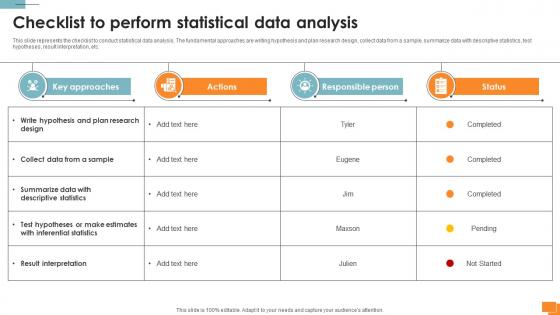
Statistical Tools For Evidence Checklist To Perform Statistical Data Analysis
This slide represents the checklist to conduct statistical data analysis. The fundamental approaches are writing hypothesis and plan research design, collect data from a sample, summarize data with descriptive statistics, test hypotheses, result interpretation, etc. Whether you have daily or monthly meetings, a brilliant presentation is necessary. Statistical Tools For Evidence Checklist To Perform Statistical Data Analysis can be your best option for delivering a presentation. Represent everything in detail using Statistical Tools For Evidence Checklist To Perform Statistical Data Analysis and make yourself stand out in meetings. The template is versatile and follows a structure that will cater to your requirements. All the templates prepared by Slidegeeks are easy to download and edit. Our research experts have taken care of the corporate themes as well. So, give it a try and see the results. This slide represents the checklist to conduct statistical data analysis. The fundamental approaches are writing hypothesis and plan research design, collect data from a sample, summarize data with descriptive statistics, test hypotheses, result interpretation, etc.
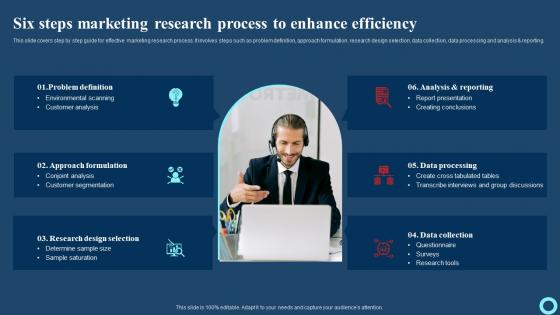
Six Steps Marketing Research Process To Enhance Efficiency Effective Strategies To Enhance Guidelines Pdf
This slide covers step by step guide for effective marketing research process. It involves steps such as problem definition, approach formulation, research design selection, data collection, data processing and analysis and reporting. Are you searching for a Six Steps Marketing Research Process To Enhance Efficiency Effective Strategies To Enhance Guidelines Pdf that is uncluttered, straightforward, and original It is easy to edit, and you can change the colors to suit your personal or business branding. For a presentation that expresses how much effort you have put in, this template is ideal With all of its features, including tables, diagrams, statistics, and lists, it is perfect for a business plan presentation. Make your ideas more appealing with these professional slides. Download Six Steps Marketing Research Process To Enhance Efficiency Effective Strategies To Enhance Guidelines Pdf from Slidegeeks today. This slide covers step by step guide for effective marketing research process. It involves steps such as problem definition, approach formulation, research design selection, data collection, data processing and analysis and reporting.
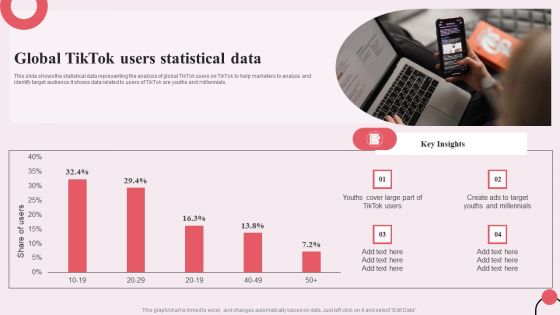
Tiktok Digital Marketing Campaign Global Tiktok Users Statistical Data Information PDF
This slide shows the statistical data representing the analysis of global TikTok users on TikTok to help marketers to analyze and identify target audience.It shows data related to users of TikTok are youths and millennials. Presenting this PowerPoint presentation, titled Tiktok Digital Marketing Campaign Global Tiktok Users Statistical Data Information PDF, with topics curated by our researchers after extensive research. This editable presentation is available for immediate download and provides attractive features when used. Download now and captivate your audience. Presenting this Tiktok Digital Marketing Campaign Global Tiktok Users Statistical Data Information PDF. Our researchers have carefully researched and created these slides with all aspects taken into consideration. This is a completely customizable Tiktok Digital Marketing Campaign Global Tiktok Users Statistical Data Information PDF that is available for immediate downloading. Download now and make an impact on your audience. Highlight the attractive features available with our PPTs.
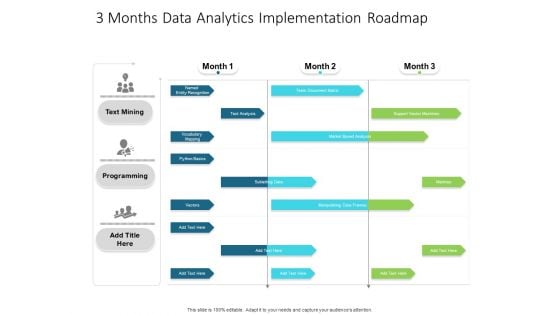
3 Months Data Analytics Implementation Roadmap Elements
Presenting our innovatively-structured 3 months data analytics implementation roadmap elements Template. Showcase your roadmap process in different formats like PDF, PNG, and JPG by clicking the download button below. This PPT design is available in both Standard Screen and Widescreen aspect ratios. It can also be easily personalized and presented with modified font size, font type, color, and shapes to measure your progress in a clear way.

3 Months Data Analytics Roadmap Structure
Introducing our 3 months data analytics roadmap structure. This PPT presentation is Google Slides compatible, therefore, you can share it easily with the collaborators for measuring the progress. Also, the presentation is available in both standard screen and widescreen aspect ratios. So edit the template design by modifying the font size, font type, color, and shapes as per your requirements. As this PPT design is fully editable it can be presented in PDF, JPG and PNG formats.
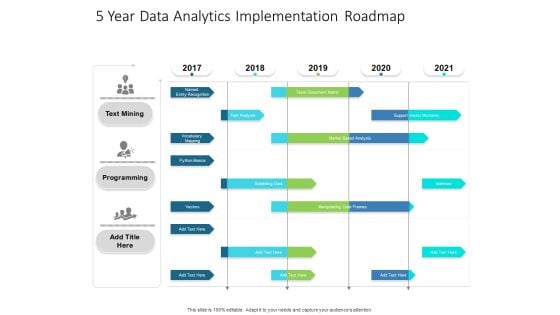
5 Year Data Analytics Implementation Roadmap Topics
Presenting our innovatively-structured 5 year data analytics implementation roadmap topics Template. Showcase your roadmap process in different formats like PDF, PNG, and JPG by clicking the download button below. This PPT design is available in both Standard Screen and Widescreen aspect ratios. It can also be easily personalized and presented with modified font size, font type, color, and shapes to measure your progress in a clear way.

5 Year Data Analytics Roadmap Infographics
Introducing our 5 year data analytics roadmap infographics. This PPT presentation is Google Slides compatible, therefore, you can share it easily with the collaborators for measuring the progress. Also, the presentation is available in both standard screen and widescreen aspect ratios. So edit the template design by modifying the font size, font type, color, and shapes as per your requirements. As this PPT design is fully editable it can be presented in PDF, JPG and PNG formats.
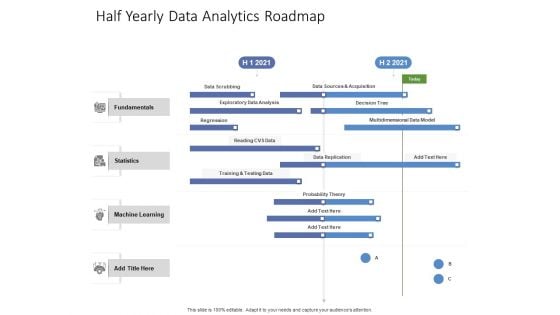
Half Yearly Data Analytics Roadmap Ideas
Presenting our innovatively-structured half yearly data analytics roadmap ideas Template. Showcase your roadmap process in different formats like PDF, PNG, and JPG by clicking the download button below. This PPT design is available in both Standard Screen and Widescreen aspect ratios. It can also be easily personalized and presented with modified font size, font type, color, and shapes to measure your progress in a clear way.
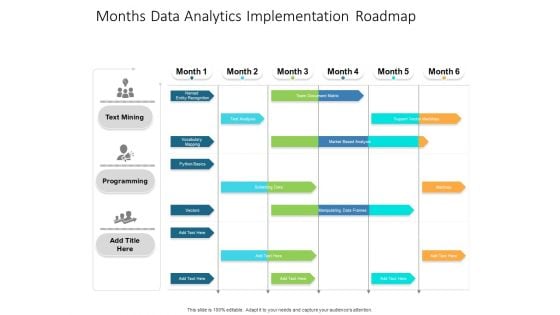
Months Data Analytics Implementation Roadmap Structure
Presenting our jaw-dropping months data analytics implementation roadmap structure. You can alternate the color, font size, font type, and shapes of this PPT layout according to your strategic process. This PPT presentation is compatible with Google Slides and is available in both standard screen and widescreen aspect ratios. You can also download this well-researched PowerPoint template design in different formats like PDF, JPG, and PNG. So utilize this visually-appealing design by clicking the download button given below.
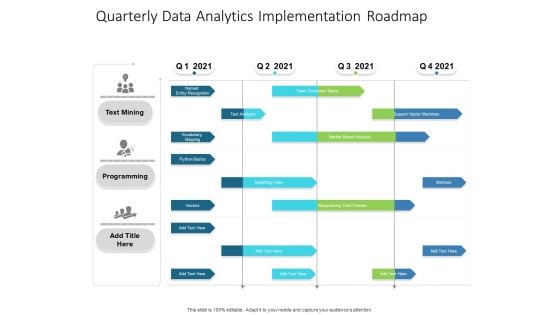
Quarterly Data Analytics Implementation Roadmap Pictures
Presenting our innovatively-structured quarterly data analytics implementation roadmap pictures Template. Showcase your roadmap process in different formats like PDF, PNG, and JPG by clicking the download button below. This PPT design is available in both Standard Screen and Widescreen aspect ratios. It can also be easily personalized and presented with modified font size, font type, color, and shapes to measure your progress in a clear way.
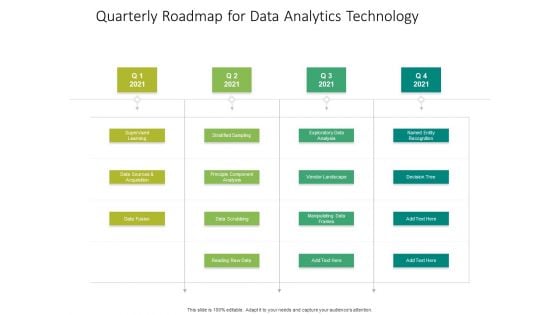
Quarterly Roadmap For Data Analytics Technology Slides
Presenting our jaw-dropping quarterly roadmap for data analytics technology slides. You can alternate the color, font size, font type, and shapes of this PPT layout according to your strategic process. This PPT presentation is compatible with Google Slides and is available in both standard screen and widescreen aspect ratios. You can also download this well-researched PowerPoint template design in different formats like PDF, JPG, and PNG. So utilize this visually-appealing design by clicking the download button given below.
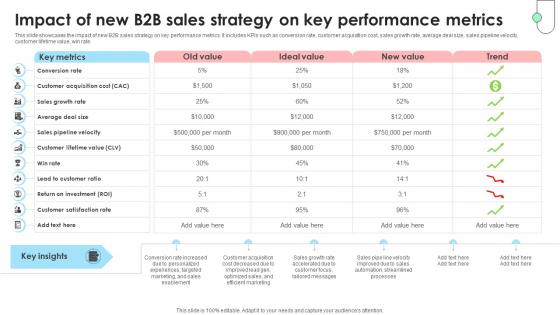
Navigating B2B Sales Impact Of New B2B Sales Strategy On Key SA SS V
This slide showcases the impact of new B2B sales strategy on key performance metrics. It includes KPIs such as conversion rate, customer acquisition cost, sales growth rate, average deal size, sales pipeline velocity, customer lifetime value, win rate. Do you know about Slidesgeeks Navigating B2B Sales Impact Of New B2B Sales Strategy On Key SA SS V These are perfect for delivering any kind od presentation. Using it, create PowerPoint presentations that communicate your ideas and engage audiences. Save time and effort by using our pre-designed presentation templates that are perfect for a wide range of topic. Our vast selection of designs covers a range of styles, from creative to business, and are all highly customizable and easy to edit. Download as a PowerPoint template or use them as Google Slides themes. This slide showcases the impact of new B2B sales strategy on key performance metrics. It includes KPIs such as conversion rate, customer acquisition cost, sales growth rate, average deal size, sales pipeline velocity, customer lifetime value, win rate.
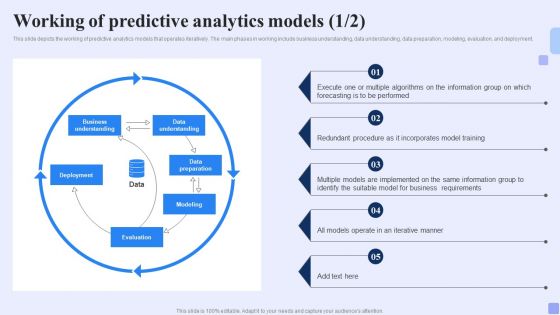
Working Of Predictive Analytics Models Forward Looking Analysis IT Elements PDF
This slide depicts the working of predictive analytics models that operates iteratively. The main phases in working include business understanding, data understanding, data preparation, modeling, evaluation, and deployment.Slidegeeks is here to make your presentations a breeze with Working Of Predictive Analytics Models Forward Looking Analysis IT Elements PDF With our easy-to-use and customizable templates, you can focus on delivering your ideas rather than worrying about formatting. With a variety of designs to choose from, you are sure to find one that suits your needs. And with animations and unique photos, illustrations, and fonts, you can make your presentation pop. So whether you are giving a sales pitch or presenting to the board, make sure to check out Slidegeeks first.
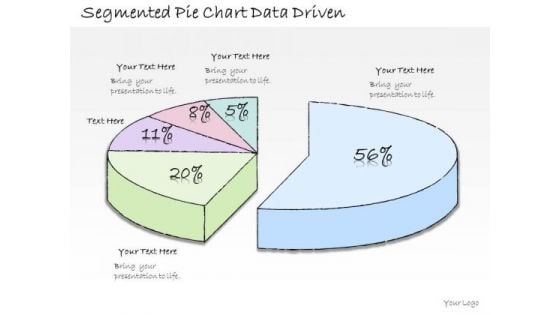
Ppt Slide Segmented Pie Chart Data Driven Business Diagrams
Dribble Away With Our PPT Slide segmented pie chart data driven business diagrams Powerpoint Templates. Score A Goal With Your Ideas. Drill It In With Our Business Plan Powerpoint Templates. Embed Your Message Into The Minds Of Your Audience.
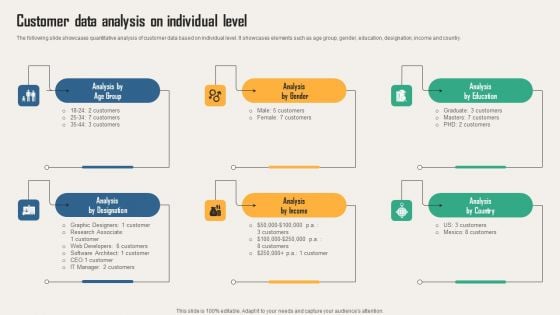
Creating Customer Personas For Customizing Customer Data Analysis On Individual Level Themes PDF
The following slide showcases quantitative analysis of customer data based on individual level. It showcases elements such as age group, gender, education, designation, income and country. From laying roadmaps to briefing everything in detail, our templates are perfect for you. You can set the stage with your presentation slides. All you have to do is download these easy-to-edit and customizable templates. Creating Customer Personas For Customizing Customer Data Analysis On Individual Level Themes PDF will help you deliver an outstanding performance that everyone would remember and praise you for. Do download this presentation today.
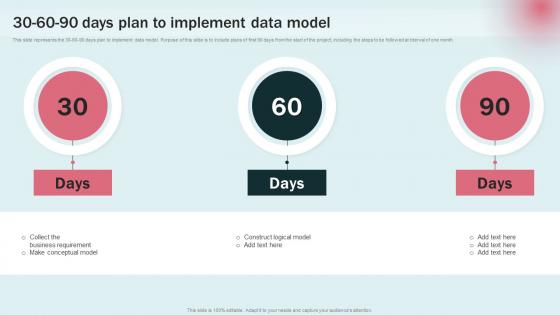
30 60 90 Days Plan To Implement Data Modeling Approaches For Modern Analytics Guidelines Pdf
This slide represents the 30 60 90 days plan to implement data model. Purpose of this slide is to include plans of first 90 days from the start of the project, including the steps to be followed at interval of one month. Find a pre designed and impeccable 30 60 90 Days Plan To Implement Data Modeling Approaches For Modern Analytics Guidelines Pdf. The templates can ace your presentation without additional effort. You can download these easy to edit presentation templates to make your presentation stand out from others. So, what are you waiting for Download the template from Slidegeeks today and give a unique touch to your presentation. This slide represents the 30 60 90 days plan to implement data model. Purpose of this slide is to include plans of first 90 days from the start of the project, including the steps to be followed at interval of one month.
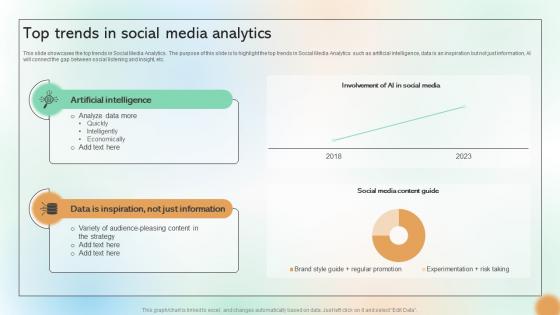
Top Trends In Social Media Analytics Cracking The Code Of Social Media
This slide showcases the top trends in Social Media Analytics. The purpose of this slide is to highlight the top trends in Social Media Analytics such as artificial intelligence, data is an inspiration but not just information, AI will connect the gap between social listening and insight, etc. Present like a pro with Top Trends In Social Media Analytics Cracking The Code Of Social Media. Create beautiful presentations together with your team, using our easy-to-use presentation slides. Share your ideas in real-time and make changes on the fly by downloading our templates. So whether you are in the office, on the go, or in a remote location, you can stay in sync with your team and present your ideas with This slide showcases the top trends in Social Media Analytics. The purpose of this slide is to highlight the top trends in Social Media Analytics such as artificial intelligence, data is an inspiration but not just information, AI will connect the gap between social listening and insight, etc.
8 Stages Concentric Data Flow Diagram Ppt Business Plan PowerPoint Templates
We present our 8 stages concentric data flow diagram ppt business plan PowerPoint templates.Present our Business PowerPoint Templates because Watching this your Audience will Grab their eyeballs, they wont even blink. Download and present our Circle Charts PowerPoint Templates because You have a driving passion to excel in your field. Our PowerPoint Templates and Slides will prove ideal vehicles for your ideas. Download our Signs PowerPoint Templates because You should Kick up a storm with our PowerPoint Templates and Slides. The heads of your listeners will swirl with your ideas. Download and present our Shapes PowerPoint Templates because Our PowerPoint Templates and Slides are aesthetically designed to attract attention. We gaurantee that they will grab all the eyeballs you need. Download our Metaphors-Visual Concepts PowerPoint Templates because Our PowerPoint Templates and Slides help you meet the demand of the Market. Just browse and pick the slides that appeal to your intuitive senses.Use these PowerPoint slides for presentations relating to radial, concentric, shine, pipe, line, environmental, circle, rendered, plastic, striped, shape, abstract, object, shiny, reflective, capsule, stripe, background, border, ecological, repetition. The prominent colors used in the PowerPoint template are Blue, Black, Gray. Get them all gung-ho with our 8 Stages Concentric Data Flow Diagram Ppt Business Plan PowerPoint Templates. Crank up their enthusiasm with with your words.
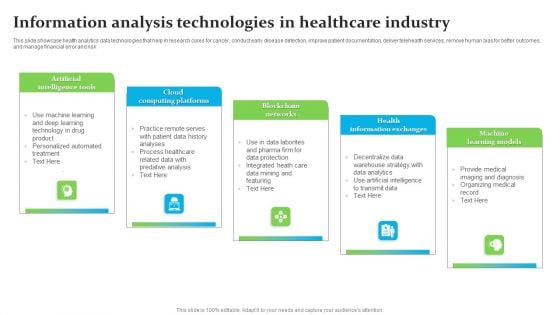
Information Analysis Technologies In Healthcare Industry Ppt Inspiration Gridlines PDF
This slide showcase health analytics data technologies that help in research cures for cancer, conduct early disease detection, improve patient documentation, deliver telehealth services, remove human bias for better outcomes, and manage financial error and risk. Presenting Information Analysis Technologies In Healthcare Industry Ppt Inspiration Gridlines PDF to dispense important information. This template comprises five stages. It also presents valuable insights into the topics including Artificial Intelligence Tools, Cloud Computing Platforms, Blockchain Networks. This is a completely customizable PowerPoint theme that can be put to use immediately. So, download it and address the topic impactfully.
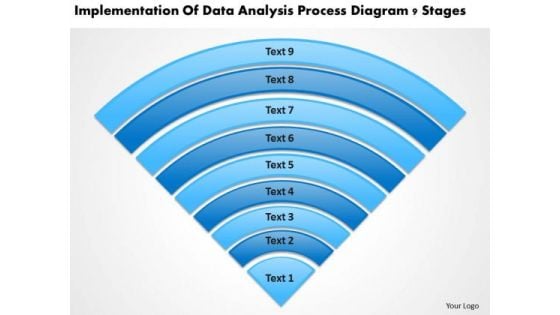
Data Analysis Process Diagram 9 Stages Help With Business Plan PowerPoint Slides
We present our data analysis process diagram 9 stages help with business plan PowerPoint Slides.Use our Computer PowerPoint Templates because Our PowerPoint Templates and Slides will let you Leave a lasting impression to your audiences. They possess an inherent longstanding recall factor. Use our Communication PowerPoint Templates because you can Break through with our PowerPoint Templates and Slides. Bring down the mental barriers of your audience. Use our Semicircles PowerPoint Templates because Our PowerPoint Templates and Slides will let your words and thoughts hit bullseye everytime. Present our Shapes PowerPoint Templates because Our PowerPoint Templates and Slides will let you meet your Deadlines. Use our Business PowerPoint Templates because Our PowerPoint Templates and Slides have the Brilliant backdrops. Guaranteed to illuminate the minds of your audience.Use these PowerPoint slides for presentations relating to Catalogue, chart, checking, choice, circle, swatch, computer, design, equipment, fan, gamma, guide, mix, object, paint, palette, pantone, paper, press, print, printout, process, profile, publishing, rainbow, round, scale, select, selection, semicircle, spectrum, system, template, typographic, typography, variation. The prominent colors used in the PowerPoint template are Blue, Gray, Black. Identify targets with our Data Analysis Process Diagram 9 Stages Help With Business Plan PowerPoint Slides. Download without worries with our money back guaranteee.

Data Processing Maturity Model With Supporting It Capabilities Themes PDF
Presenting data processing maturity model with supporting it capabilities themes pdf to dispense important information. This template comprises four stages. It also presents valuable insights into the topics including information, management, technological development. This is a completely customizable PowerPoint theme that can be put to use immediately. So, download it and address the topic impactfully.
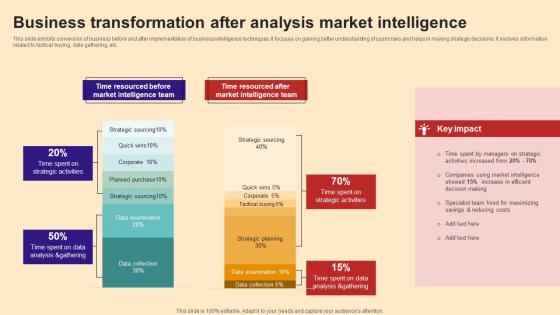
Business Transformation After Analysis Market Intelligence Demonstration Pdf
This slide exhibits conversion of business before and after implementation of business intelligence techniques. It focuses on gaining better understanding of customers and helps in making strategic decisions. It involves information related to tactical buying, data gathering, etc.Pitch your topic with ease and precision using this Business Transformation After Analysis Market Intelligence Demonstration Pdf This layout presents information on Decision Making, Managers Strategic, Activities Increased It is also available for immediate download and adjustment. So, changes can be made in the color, design, graphics or any other component to create a unique layout. This slide exhibits conversion of business before and after implementation of business intelligence techniques. It focuses on gaining better understanding of customers and helps in making strategic decisions. It involves information related to tactical buying, data gathering, etc.
Business Diagram Key With Tags For Success Planning Presentation Template
This business diagram slide has been designed with graphics of key with tags. You may use this slide to depict success planning. Download this diagram slide to make impressive presentations.
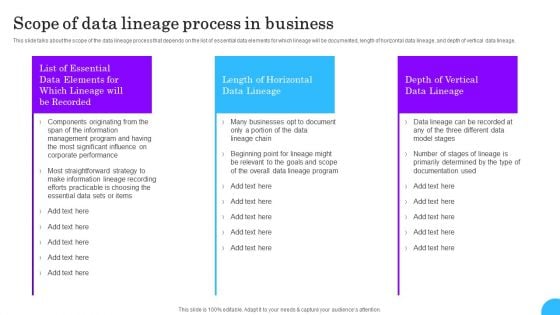
Comprehensive Analysis Of Different Data Lineage Classification Scope Of Data Lineage Process Business Ideas PDF
This slide talks about the scope of the data lineage process that depends on the list of essential data elements for which lineage will be documented, length of horizontal data lineage, and depth of vertical data lineage. Whether you have daily or monthly meetings, a brilliant presentation is necessary. Comprehensive Analysis Of Different Data Lineage Classification Scope Of Data Lineage Process Business Ideas PDF can be your best option for delivering a presentation. Represent everything in detail using Comprehensive Analysis Of Different Data Lineage Classification Scope Of Data Lineage Process Business Ideas PDF and make yourself stand out in meetings. The template is versatile and follows a structure that will cater to your requirements. All the templates prepared by Slidegeeks are easy to download and edit. Our research experts have taken care of the corporate themes as well. So, give it a try and see the results.
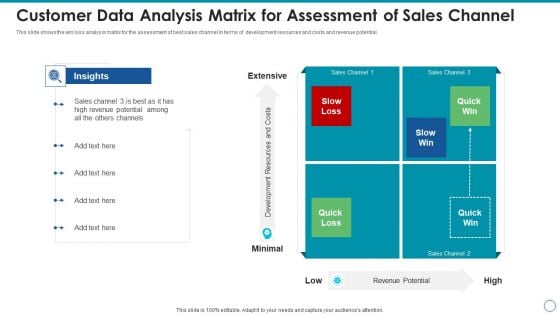
Customer Data Analysis Matrix For Assessment Of Sales Channel Template PDF
This slide shows the win loss analysis matrix for the assessment of best sales channel in terms of development resources and costs and revenue potential. Presenting customer data analysis matrix for assessment of sales channel template pdf to dispense important information. This template comprises four stages. It also presents valuable insights into the topics including customer data analysis matrix for assessment of sales channel. This is a completely customizable PowerPoint theme that can be put to use immediately. So, download it and address the topic impactfully.
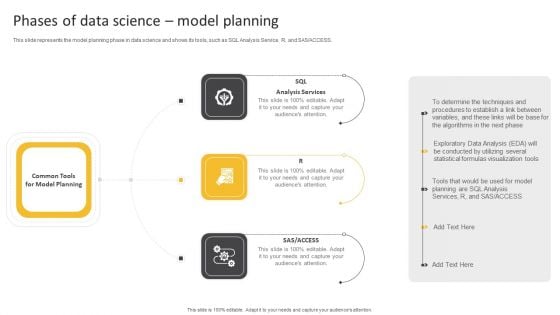
Information Science Phases Of Data Science Model Planning Ppt PowerPoint Presentation Styles Display PDF
This slide represents the model planning phase in data science and shows its tools, such as SQL Analysis Service, R, and SAS or ACCESS.This is a Information Science Phases Of Data Science Model Planning Ppt PowerPoint Presentation Styles Display PDF template with various stages. Focus and dispense information on three stages using this creative set, that comes with editable features. It contains large content boxes to add your information on topics like Determine Techniques, Procedures Establish, Statistical Formulas. You can also showcase facts, figures, and other relevant content using this PPT layout. Grab it now.
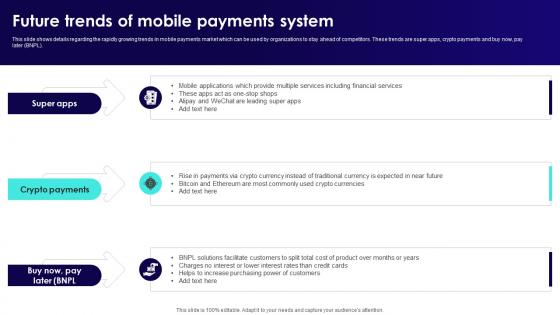
Wireless Banking To Improve Future Trends Of Mobile Payments System Fin SS V
This slide shows details regarding the rapidly growing trends in mobile payments market which can be used by organizations to stay ahead of competitors. These trends are super apps, crypto payments and buy now, pay later BNPL. Retrieve professionally designed Wireless Banking To Improve Future Trends Of Mobile Payments System Fin SS V to effectively convey your message and captivate your listeners. Save time by selecting pre-made slideshows that are appropriate for various topics, from business to educational purposes. These themes come in many different styles, from creative to corporate, and all of them are easily adjustable and can be edited quickly. Access them as PowerPoint templates or as Google Slides themes. You do not have to go on a hunt for the perfect presentation because Slidegeeks got you covered from everywhere. This slide shows details regarding the rapidly growing trends in mobile payments market which can be used by organizations to stay ahead of competitors. These trends are super apps, crypto payments and buy now, pay later BNPL.
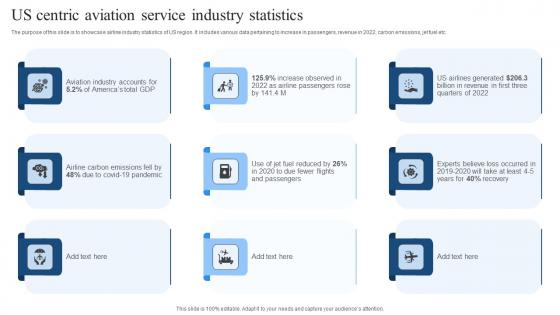
Us Centric Aviation Service Industry Statistics Diagrams Pdf
The purpose of this slide is to showcase airline industry statistics of US region. It includes various data pertaining to increase in passengers, revenue in 2022, carbon emissions, jet fuel etc. Pitch your topic with ease and precision using this Us Centric Aviation Service Industry Statistics Diagrams Pdf. This layout presents information on Carbon Emissions, Airline Passengers. It is also available for immediate download and adjustment. So, changes can be made in the color, design, graphics or any other component to create a unique layout. The purpose of this slide is to showcase airline industry statistics of US region. It includes various data pertaining to increase in passengers, revenue in 2022, carbon emissions, jet fuel etc.

Evaluating Projected Vs Actual Sales Performance Diagrams PDF
The following slide depicts the evaluation of existing sales performance to set future standards and determine opportunities for improvement. It mainly includes key performance indicators KPIs such as pipeline, forecast, attainment, gap etc. There are so many reasons you need a Evaluating Projected Vs Actual Sales Performance Diagrams PDF. The first reason is you can not spend time making everything from scratch, Thus, Slidegeeks has made presentation templates for you too. You can easily download these templates from our website easily.
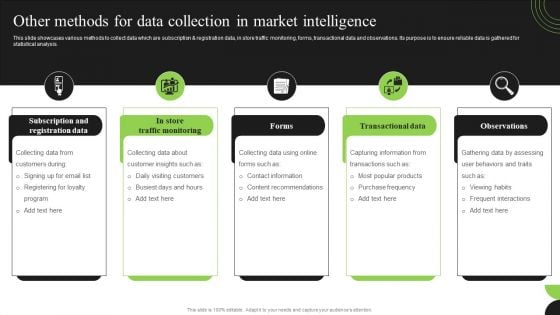
Guidebook For Executing Business Market Intelligence Other Methods For Data Collection Demonstration PDF
This slide showcases various methods to collect data which are subscription and registration data, in store traffic monitoring, forms, transactional data and observations. Its purpose is to ensure reliable data is gathered for statistical analysis. Are you searching for a Guidebook For Executing Business Market Intelligence Other Methods For Data Collection Demonstration PDF that is uncluttered, straightforward, and original Its easy to edit, and you can change the colors to suit your personal or business branding. For a presentation that expresses how much effort you have put in, this template is ideal With all of its features, including tables, diagrams, statistics, and lists, its perfect for a business plan presentation. Make your ideas more appealing with these professional slides. Download Guidebook For Executing Business Market Intelligence Other Methods For Data Collection Demonstration PDF from Slidegeeks today.
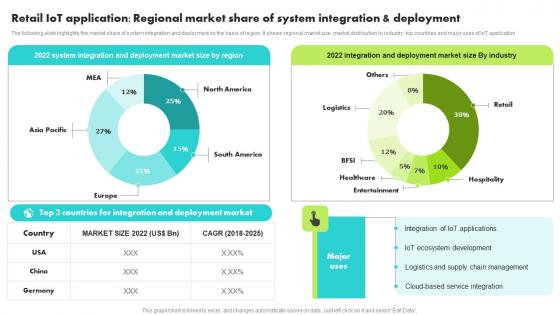
Retail IoT Application Regional Market Share System Guide For Retail IoT Solutions Analysis Pictures Pdf
The following slide highlights the market share of system integration and deployment on the basis of region. It shows regional market size, market distribution by industry, top countries and major uses of IoT application The Retail IoT Application Regional Market Share System Guide For Retail IoT Solutions Analysis Pictures Pdf is a compilation of the most recent design trends as a series of slides. It is suitable for any subject or industry presentation, containing attractive visuals and photo spots for businesses to clearly express their messages. This template contains a variety of slides for the user to input data, such as structures to contrast two elements, bullet points, and slides for written information. Slidegeeks is prepared to create an impression. The following slide highlights the market share of system integration and deployment on the basis of region. It shows regional market size, market distribution by industry, top countries and major uses of IoT application
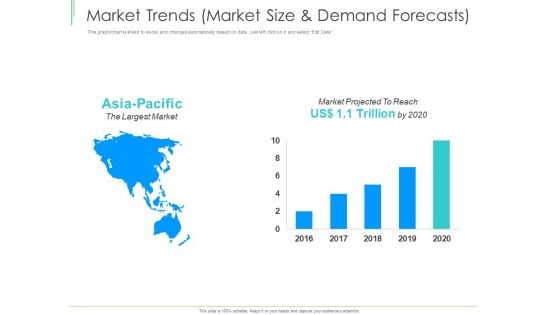
Marketing Plan Implementation Market Trends Market Size And Demand Forecasts Topics PDF
This graph or chart is linked to excel, and changes automatically based on data. Just left click on it and select Edit Data. Deliver an awe-inspiring pitch with this creative marketing plan implementation market trends market size and demand forecasts topics pdf bundle. Topics like market trends, market size and demand forecasts can be discussed with this completely editable template. It is available for immediate download depending on the needs and requirements of the user.
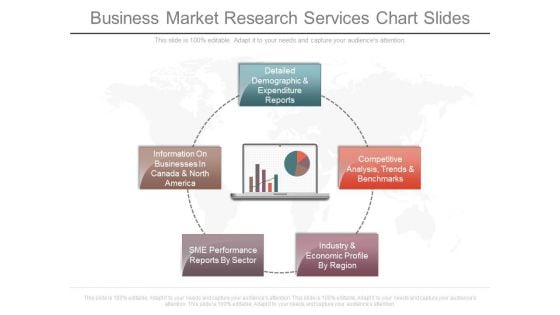
Business Market Research Services Chart Slides
This is a business market research services chart slides. This is a five stage process. The stages in this process are detailed demographic and expenditure reports, competitive analysis trends and benchmarks, industry and economic profile by region, sme performance reports by sector, information on businesses in canada and north america.
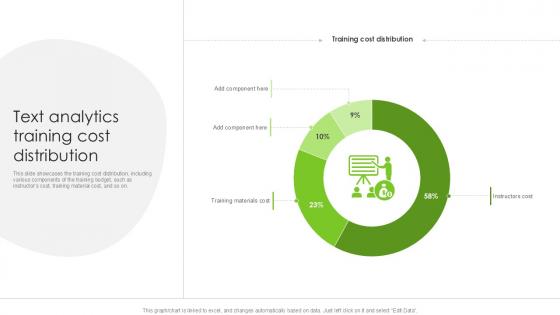
Text Analytics Training Cost Distribution PPT Sample SS
This slide showcases the training cost distribution, including various components of the training budget, such as instructors cost, training material cost, and so on. The Text Analytics Training Cost Distribution PPT Sample SS is a compilation of the most recent design trends as a series of slides. It is suitable for any subject or industry presentation, containing attractive visuals and photo spots for businesses to clearly express their messages. This template contains a variety of slides for the user to input data, such as structures to contrast two elements, bullet points, and slides for written information. Slidegeeks is prepared to create an impression. This slide showcases the training cost distribution, including various components of the training budget, such as instructors cost, training material cost, and so on.
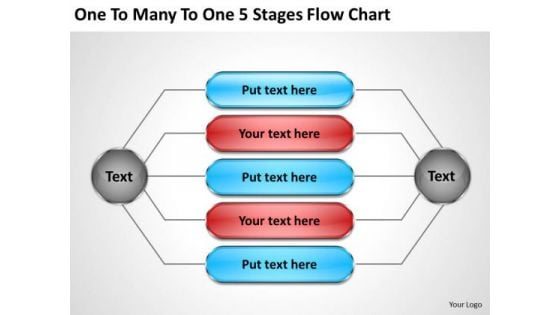
Business Entity Diagram One To Many 5 Stages Flow Chart PowerPoint Slides
We present our business entity diagram one to many 5 stages flow chart PowerPoint Slides.Download our Arrows PowerPoint Templates because You can Be the star of the show with our PowerPoint Templates and Slides. Rock the stage with your ideas. Download and present our Network Diagrams PowerPoint Templates because You can Channelise the thoughts of your team with our PowerPoint Templates and Slides. Urge them to focus on the goals you have set. Download and present our Marketing PowerPoint Templates because Our PowerPoint Templates and Slides are the chords of your song. String them along and provide the lilt to your views. Download our Business PowerPoint Templates because Our PowerPoint Templates and Slides will let you Leave a lasting impression to your audiences. They possess an inherent longstanding recall factor. Use our Shapes PowerPoint Templates because It will let you Set new benchmarks with our PowerPoint Templates and Slides. They will keep your prospects well above par.Use these PowerPoint slides for presentations relating to Arrow, Blue, Box, Brochure, Business, Button, Catalog, Chart, Circle, Company, Cross, Data, Design, Diagram, Direction, Document, Financial, Glossy, Goals, Graph, Green, Junction, Management, Market, Marketing, Model, Multicolored, Multiple, Navigation, Network, Options, Orange, Pie, Plan, Presentation, Process, Purple, Red, Results, Shiny, Six, Sphere, Statistics, Stock, Structure, Template, Vector. The prominent colors used in the PowerPoint template are Red, Blue, Gray. Finalise plans with our Business Entity Diagram One To Many 5 Stages Flow Chart PowerPoint Slides. Give the final touch to your thoughts.
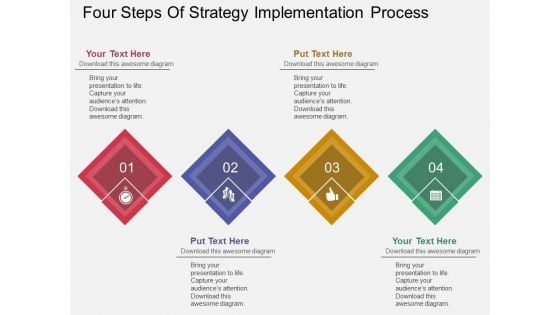
Four Steps Of Strategy Implementation Process Powerpoint Template
Our above business slide contains colorful infographic diagram. Download this template to display four steps of strategy implementation. This diagram provides an effective way of displaying information you can edit text, color, shade and style as per you need.

 Home
Home