Dashboard Icon
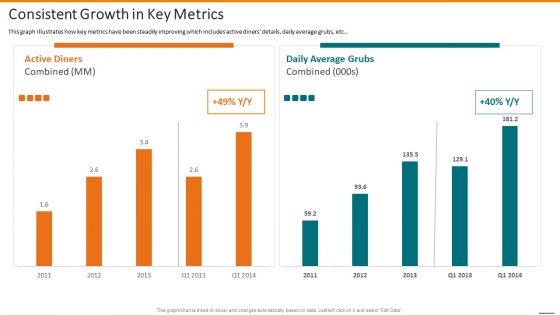
Grubhub Fund Raising Elevator Consistent Growth In Key Metrics Diagrams PDF
This graph illustrates how key metrics have been steadily improving which includes active diners details, daily average grubs, etc. Deliver and pitch your topic in the best possible manner with this grubhub fund raising elevator consistent growth in key metrics diagrams pdf. Use them to share invaluable insights on consistent growth in key metrics and impress your audience. This template can be altered and modified as per your expectations. So, grab it now.
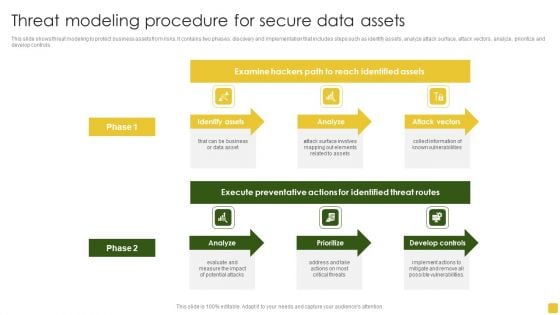
Threat Modeling Procedure For Secure Data Assets Formats PDF
This slide shows threat modeling to protect business assets from risks. It contains two phases discovery and implementation that includes steps such as identify assets, analyze attack surface, attack vectors, analyze, prioritize and develop controls. Pitch your topic with ease and precision using this Threat Modeling Procedure For Secure Data Assets Formats PDF. This layout presents information on Execute Preventative, Identified Threat, Develop Controls. It is also available for immediate download and adjustment. So, changes can be made in the color, design, graphics or any other component to create a unique layout.
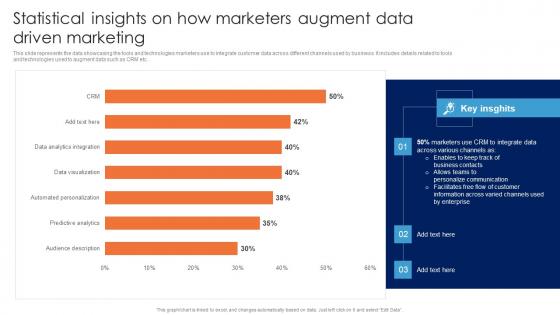
Statistical Insights On How Marketers Augment Data Driven Guide For Data Driven Advertising Portrait Pdf
This slide represents the data showcasing the tools and technologies marketers use to integrate customer data across different channels used by business. It includes details related to tools and technologies used to augment data such as CRM etc. Are you searching for a Statistical Insights On How Marketers Augment Data Driven Guide For Data Driven Advertising Portrait Pdf that is uncluttered, straightforward, and original Its easy to edit, and you can change the colors to suit your personal or business branding. For a presentation that expresses how much effort you have put in, this template is ideal. With all of its features, including tables, diagrams, statistics, and lists, its perfect for a business plan presentation. Make your ideas more appealing with these professional slides. Download Statistical Insights On How Marketers Augment Data Driven Guide For Data Driven Advertising Portrait Pdf from Slidegeeks today. This slide represents the data showcasing the tools and technologies marketers use to integrate customer data across different channels used by business. It includes details related to tools and technologies used to augment data such as CRM etc.
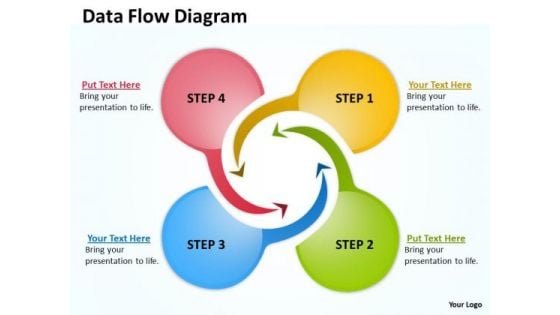
Marketing Diagram Data Flow Diagram Consulting Diagram
Open Up Doors That Lead To Success. Our Marketing_Diagram_Data_Flow_Diagram_Consulting_Diagram Powerpoint Templates Provide The Handles.
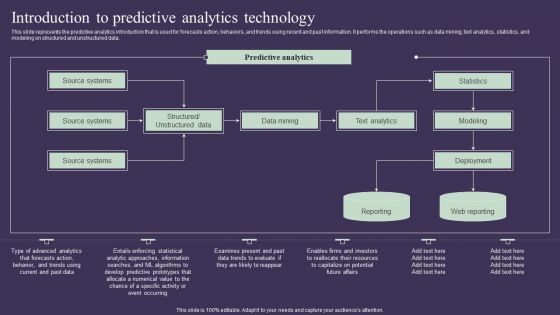
Projection Model Introduction To Predictive Analytics Technology Elements PDF
This slide represents the predictive analytics introduction that is used for forecasts action, behaviors, and trends using recent and past information. It performs the operations such as data mining, text analytics, statistics, and modeling on structured and unstructured data. Make sure to capture your audiences attention in your business displays with our gratis customizable Projection Model Introduction To Predictive Analytics Technology Elements PDF. These are great for business strategies, office conferences, capital raising or task suggestions. If you desire to acquire more customers for your tech business and ensure they stay satisfied, create your own sales presentation with these plain slides.
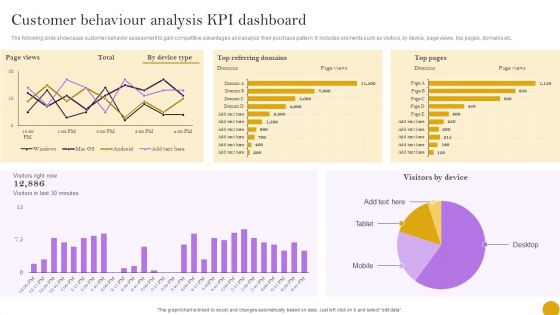
Comprehensive Customer Data Platform Guide Optimizing Promotional Initiatives Customer Behaviour Analysis KPI Brochure PDF
The following slide showcases customer behavior assessment to gain competitive advantages and analyze their purchase pattern. It includes elements such as visitors, by device, page views, top pages, domains etc. Coming up with a presentation necessitates that the majority of the effort goes into the content and the message you intend to convey. The visuals of a PowerPoint presentation can only be effective if it supplements and supports the story that is being told. Keeping this in mind our experts created Comprehensive Customer Data Platform Guide Optimizing Promotional Initiatives Customer Behaviour Analysis KPI Brochure PDF to reduce the time that goes into designing the presentation. This way, you can concentrate on the message while our designers take care of providing you with the right template for the situation.
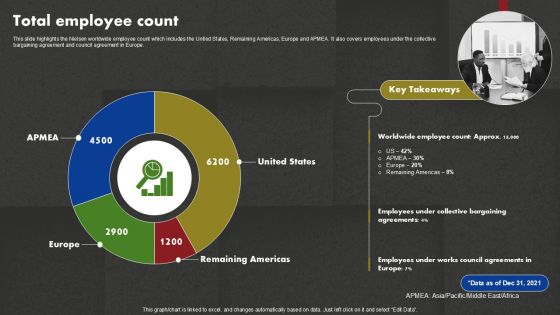
Data And Customer Analysis Company Outline Total Employee Count Designs PDF
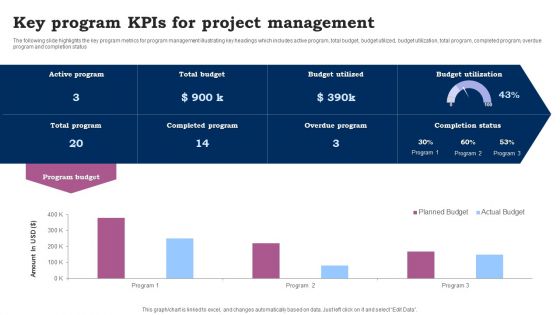
Key Program Kpis For Project Management Ppt Slides Graphic Images PDF
The following slide highlights the key program metrics for program management illustrating key headings which includes active program, total budget, budget utilized, budget utilization, total program, completed program, overdue program and completion status. Pitch your topic with ease and precision using this Key Program Kpis For Project Management Ppt Slides Graphic Images PDF. This layout presents information on Program Budget, Active Program, Total Budget. It is also available for immediate download and adjustment. So, changes can be made in the color, design, graphics or any other component to create a unique layout.
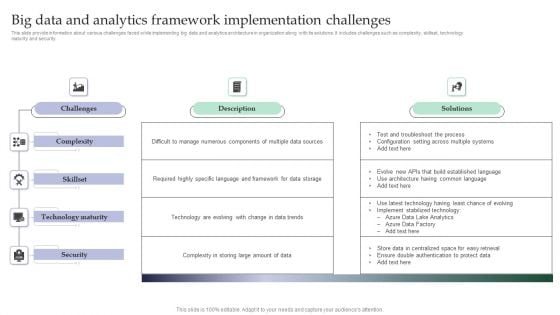
Big Data And Analytics Framework Implementation Challenges Themes PDF
This slide provide information about various challenges faced while implementing big data and analytics architecture in organization along with its solutions. It includes challenges such as complexity, skillset, technology maturity and security Pitch your topic with ease and precision using this Big Data And Analytics Framework Implementation Challenges Themes PDF. This layout presents information on Challenges, Description, Solutions . It is also available for immediate download and adjustment. So, changes can be made in the color, design, graphics or any other component to create a unique layout.
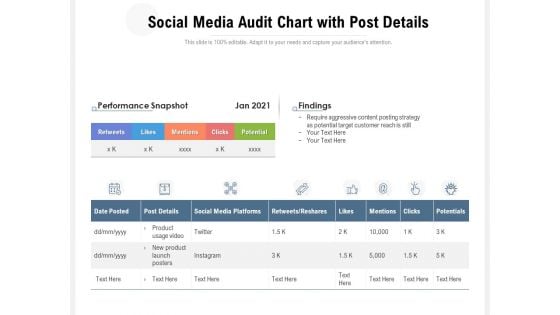
Social Media Audit Chart With Post Details Ppt PowerPoint Presentation Gallery Graphics Pictures PDF
Showcasing this set of slides titled social media audit chart with post details ppt powerpoint presentation gallery graphics pictures pdf. The topics addressed in these templates are performance snapshot, findings, product. All the content presented in this PPT design is completely editable. Download it and make adjustments in color, background, font etc. as per your unique business setting.
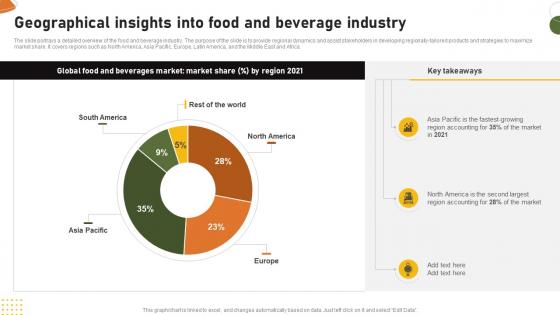
Food And Drink Industry Report Geographical Insights Into Food And Beverage Industry IR SS V
The slide portrays a detailed overview of the food and beverage industry. The purpose of the slide is to provide regional dynamics and assist stakeholders in developing regionally-tailored products and strategies to maximize market share. It covers regions such as North America, Asia Pacific, Europe, Latin America, and the Middle East and Africa. Find highly impressive Food And Drink Industry Report Geographical Insights Into Food And Beverage Industry IR SS V on Slidegeeks to deliver a meaningful presentation. You can save an ample amount of time using these presentation templates. No need to worry to prepare everything from scratch because Slidegeeks experts have already done a huge research and work for you. You need to download Food And Drink Industry Report Geographical Insights Into Food And Beverage Industry IR SS V for your upcoming presentation. All the presentation templates are 100 percent editable and you can change the color and personalize the content accordingly. Download now The slide portrays a detailed overview of the food and beverage industry. The purpose of the slide is to provide regional dynamics and assist stakeholders in developing regionally-tailored products and strategies to maximize market share. It covers regions such as North America, Asia Pacific, Europe, Latin America, and the Middle East and Africa.
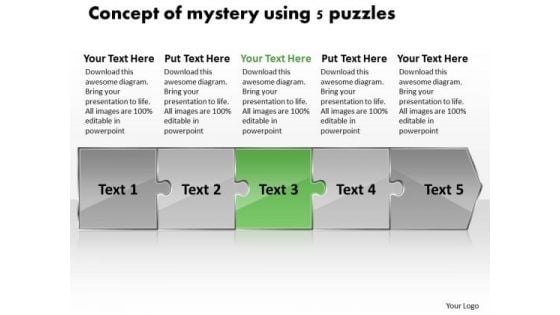
Concept Of Mystery Using 5 Puzzles Program Flowchart PowerPoint Templates
We present our concept of mystery using 5 puzzles program flowchart PowerPoint templates.Use our Puzzles or Jigsaws PowerPoint Templates because,You can Churn the wheels of the brains of your colleagues. Use our Business PowerPoint Templates because, It will demonstrate the strength of character under severe stress. Shine the torch ahead and bring the light to shine on all Use our Shapes PowerPoint Templates because, You can Transmit your passion via our creative templates. Use our Process and Flows PowerPoint Templates because,They pinpoint the core values of your organisation. Use our Abstract PowerPoint Templates because,our template will illustrate what you want to say.Use these PowerPoint slides for presentations relating to Abstract, Action, Attach, Box, Business, Center, Chain, Chart, Color, Communication, Concept, Connection, Cube, Cycle, Data, Diagram, Flow, Globe, Horizontal, Idea, Illustration, Information, Interaction, Jigsaw, Join, Link, Pieces, Process, Puzzle, Relation, Relationship, Shape, Success. The prominent colors used in the PowerPoint template are Green, Gray, Black Our Concept Of Mystery Using 5 Puzzles Program Flowchart PowerPoint Templates are specially created by professionals. They diligently strive to come up with the right vehicle for your thoughts.

Business Framework Big Data Cloud Storage PowerPoint Presentation 1
Explain the concept of big data storage on cloud service with this power point diagram slide. This diagram contains the graphic of big cloud and connected sub clouds in network. Use this image for data storage and data networking related presentations.
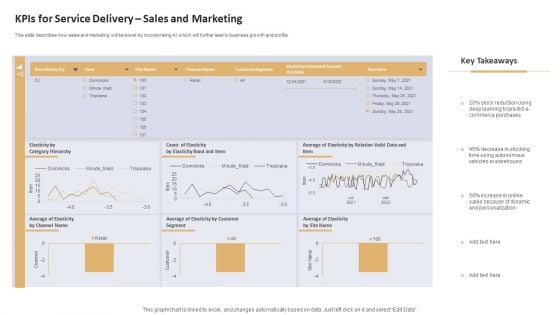
Data Processing Services Delivery Kpis For Service Delivery Sales And Marketing Summary PDF
This slide describes how sales and marketing will be boost by incorporating AI which will further lead to business growth and profits. Deliver an awe inspiring pitch with this creative Data Processing Services Delivery Kpis For Service Delivery Sales And Marketing Summary PDF bundle. Topics like Count Elasticity, Elasticity, Band and Item, Average Elasticity, Customer Segment can be discussed with this completely editable template. It is available for immediate download depending on the needs and requirements of the user.
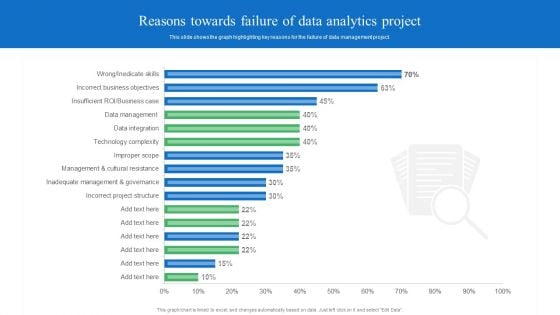
Toolkit For Data Science And Analytics Transition Reasons Towards Failure Of Data Analytics Project Background PDF
This slide shows the graph highlighting key reasons for the failure of data management project. If you are looking for a format to display your unique thoughts, then the professionally designed Toolkit For Data Science And Analytics Transition Reasons Towards Failure Of Data Analytics Project Background PDF is the one for you. You can use it as a Google Slides template or a PowerPoint template. Incorporate impressive visuals, symbols, images, and other charts. Modify or reorganize the text boxes as you desire. Experiment with shade schemes and font pairings. Alter, share or cooperate with other people on your work. Download Toolkit For Data Science And Analytics Transition Reasons Towards Failure Of Data Analytics Project Background PDF and find out how to give a successful presentation. Present a perfect display to your team and make your presentation unforgettable.
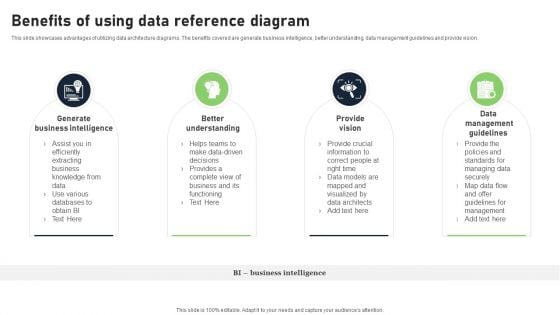
Benefits Of Using Data Reference Diagram Clipart PDF
Persuade your audience using this Benefits Of Using Data Reference Diagram Clipart PDF. This PPT design covers Four stages, thus making it a great tool to use. It also caters to a variety of topics including Generate Business Intelligence, Better Understanding, Provide Vision. Download this PPT design now to present a convincing pitch that not only emphasizes the topic but also showcases your presentation skills.
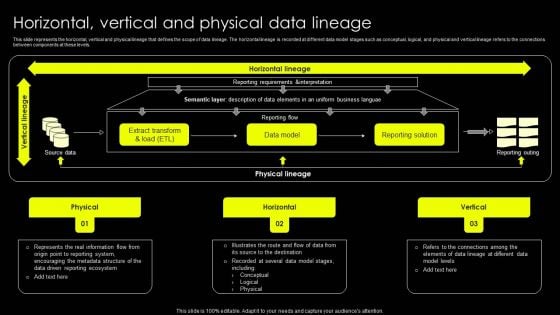
Data Lineage Implementation Horizontal Vertical And Physical Data Lineage Topics PDF
This slide represents the horizontal, vertical and physical lineage that defines the scope of data lineage. The horizontal lineage is recorded at different data model stages such as conceptual, logical, and physical and vertical lineage refers to the connections between components at these levels. Retrieve professionally designed Data Lineage Implementation Horizontal Vertical And Physical Data Lineage Topics PDF to effectively convey your message and captivate your listeners. Save time by selecting pre made slideshows that are appropriate for various topics, from business to educational purposes. These themes come in many different styles, from creative to corporate, and all of them are easily adjustable and can be edited quickly. Access them as PowerPoint templates or as Google Slides themes. You do not have to go on a hunt for the perfect presentation because Slidegeeks got you covered from everywhere.

PowerPoint Slide Layout Data Driven Bubble Chart Ppt Theme
PowerPoint Slide layout Data Driven Bubble Chart PPT Theme Business Power Points--These amazing PowerPoint pre-designed slides and PowerPoint templates have been carefully created by our team of experts to help you impress your audience. Our stunning collection of Powerpoint slides are 100% editable and can easily fit in any PowerPoint presentations. By using these animations and graphics in PowerPoint and you can easily make professional presentations. Any text can be entered at any point in the PowerPoint template or slide. Just DOWNLOAD our awesome PowerPoint templates and you are ready to go. Complete the circle with our PowerPoint Slide Layout Data Driven Bubble Chart Ppt Theme. Explore every direction with your thoughts.
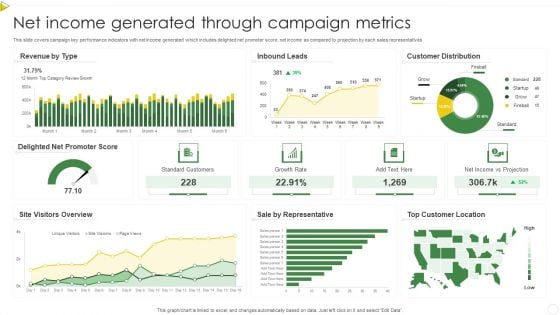
Net Income Generated Through Campaign Metrics Summary PDF
This slide covers campaign key performance indicators with net income generated which includes delighted net promoter score, net income as compared to projection by each sales representatives. Pitch your topic with ease and precision using this Net Income Generated Through Campaign Metrics Summary PDF. This layout presents information on Standard Customers, Growth Rate, Net Income. It is also available for immediate download and adjustment. So, changes can be made in the color, design, graphics or any other component to create a unique layout.
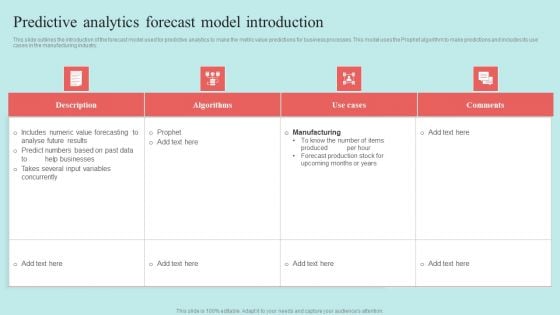
Predictive Data Model Predictive Analytics Forecast Model Introduction Themes PDF
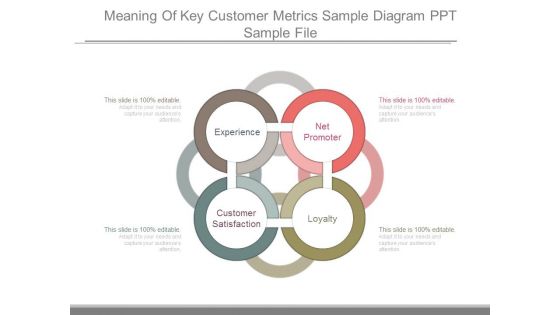
Meaning Of Key Customer Metrics Sample Diagram Ppt Sample File
This is a meaning of key customer metrics sample diagram ppt sample file. This is a four stage process. The stages in this process are net promoter, loyalty, customer satisfaction, experience.
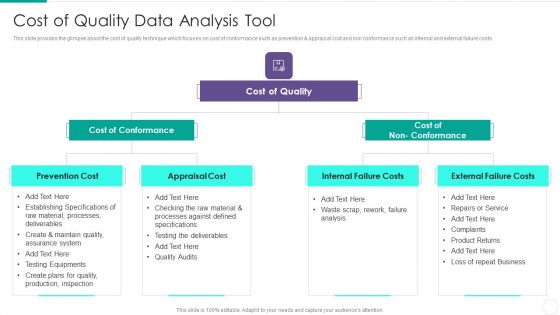
Quantitative Risk Assessment Cost Of Quality Data Analysis Tool Graphics PDF
Presenting Quantitative Risk Assessment Cost Of Quality Data Analysis Tool Graphics PDF to provide visual cues and insights. Share and navigate important information on three stages that need your due attention. This template can be used to pitch topics like Cost Of Conformance, Cost Of Quality, Internal Failure Costs, External Failure Costs, Appraisal Cost. In addtion, this PPT design contains high resolution images, graphics, etc, that are easily editable and available for immediate download.
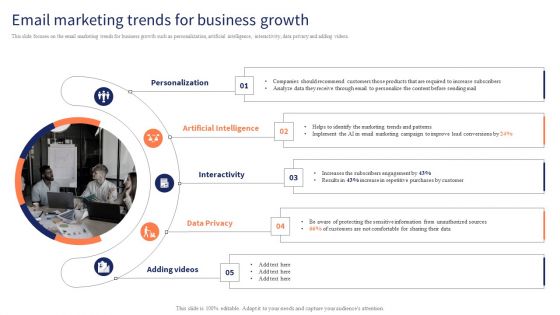
Optimizing Digital Channels To Enhance Marketing Strategy Email Marketing Trends For Business Growth Themes PDF
This slide focuses on the email marketing trends for business growth such as personalization, artificial intelligence, interactivity, data privacy and adding videos. There are so many reasons you need a Optimizing Digital Channels To Enhance Marketing Strategy Email Marketing Trends For Business Growth Themes PDF. The first reason is you can not spend time making everything from scratch, Thus, Slidegeeks has made presentation templates for you too. You can easily download these templates from our website easily.
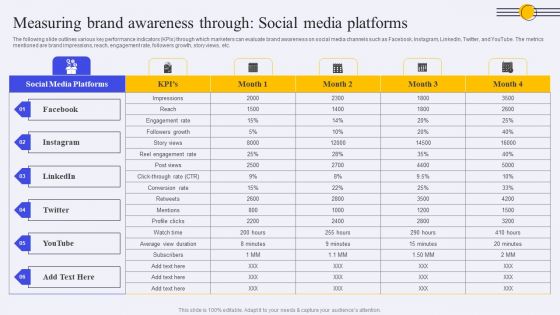
Measuring Brand Awareness Through Social Media Platforms Ppt PowerPoint Presentation Diagram Graph Charts PDF
The following slide outlines various key performance indicators KPIs through which marketers can evaluate brand awareness on social media channels such as Facebook, Instagram, LinkedIn, Twitter, and YouTube. The metrics mentioned are brand impressions, reach, engagement rate, followers growth, story views, etc. The best PPT templates are a great way to save time, energy, and resources. Slidegeeks have 100 percent editable powerpoint slides making them incredibly versatile. With these quality presentation templates, you can create a captivating and memorable presentation by combining visually appealing slides and effectively communicating your message. Download Measuring Brand Awareness Through Social Media Platforms Ppt PowerPoint Presentation Diagram Graph Charts PDF from Slidegeeks and deliver a wonderful presentation.

Business Diagram Three Staged Circular Data Text Boxes PowerPoint Template
Graphic of three staged circular text boxes are used to craft this power point template. This PPT diagram contains the concept of data representation. Display marketing and business oriented data in any presentation with this professional PPT.
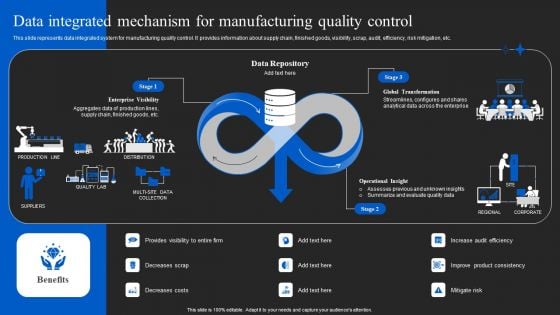
Automated Quality Control In Manufacturing Data Integrated Mechanism For Manufacturing Themes PDF
This slide represents data integrated system for manufacturing quality control. It provides information about supply chain, finished goods, visibility, scrap, audit, efficiency, risk mitigation, etc. Create an editable Automated Quality Control In Manufacturing Data Integrated Mechanism For Manufacturing Themes PDF that communicates your idea and engages your audience. Whether you are presenting a business or an educational presentation, pre designed presentation templates help save time. Automated Quality Control In Manufacturing Data Integrated Mechanism For Manufacturing Themes PDF is highly customizable and very easy to edit, covering many different styles from creative to business presentations. Slidegeeks has creative team members who have crafted amazing templates. So, go and get them without any delay.
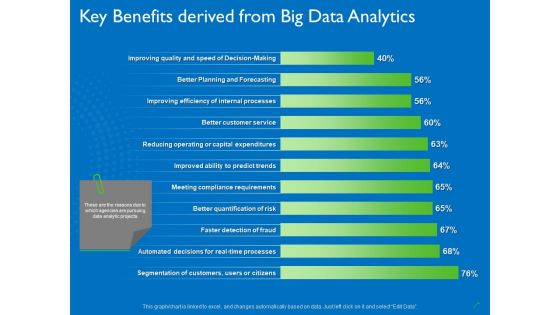
Transforming Big Data Analytics To Knowledge Key Benefits Derived From Big Data Analytics Introduction PDF
Deliver an awe inspiring pitch with this creative transforming big data analytics to knowledge key benefits derived from big data analytics introduction pdf bundle. Topics like service, processes, efficiency, planning, decision making can be discussed with this completely editable template. It is available for immediate download depending on the needs and requirements of the user.
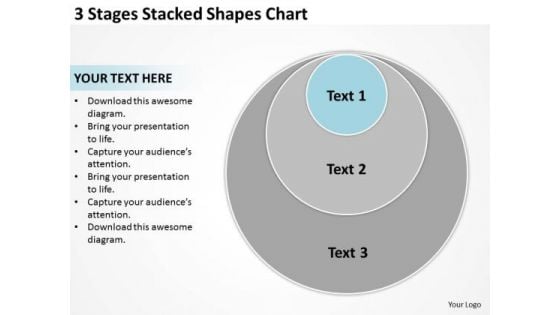
3 Stages Stacked Shapes Chart Business Plan PowerPoint Slides
We present our 3 stages stacked shapes chart business plan PowerPoint Slides.Download our Business PowerPoint Templates because They will Put the wind in your sails. Skim smoothly over the choppy waters of the market. Use our Venn Diagrams PowerPoint Templates because Our PowerPoint Templates and Slides will give you great value for your money. Be assured of finding the best projection to highlight your words. Use our Layers PowerPoint Templates because Our PowerPoint Templates and Slides are effectively colour coded to prioritise your plans They automatically highlight the sequence of events you desire. Use our Circle Charts PowerPoint Templates because Our PowerPoint Templates and Slides will let Your superior ideas hit the target always and everytime. Download and present our Shapes PowerPoint Templates because Our PowerPoint Templates and Slides will let you Hit the right notes. Watch your audience start singing to your tune.Use these PowerPoint slides for presentations relating to diagram, process, business, graphic, design, ideas, model, data, chart, project, schema, corporate, implementation, tag, plan, engineering, concept, vector, success, symbol, stack, circle, guide, work flow, development, shape, team, management, cycle, steps, illustration, system, strategy, objects, phase, professional, organization, implement, background, image, detail, structure, product. The prominent colors used in the PowerPoint template are Blue light, Gray, White. Our 3 Stages Stacked Shapes Chart Business Plan PowerPoint Slides create presentations that blow your audience away. With our money back guarantee you have nothing to lose.
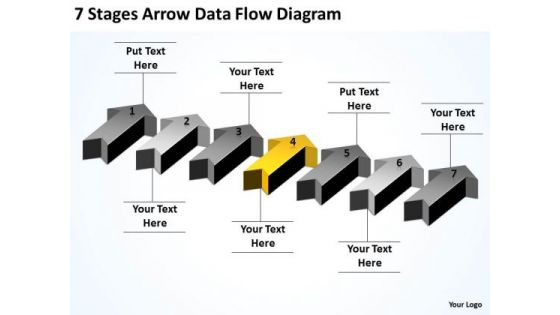
Advantage Of Parallel Processing 7 Stages Arrow Data Flow Diagram PowerPoint Slides
We present our advantage of parallel processing 7 stages arrow data flow diagram PowerPoint Slides.Download and present our Flow Charts PowerPoint Templates because Our PowerPoint Templates and Slides are conceived by a dedicated team. Use them and give form to your wondrous ideas. Download and present our Process and Flows PowerPoint Templates because Our PowerPoint Templates and Slides offer you the needful to organise your thoughts. Use them to list out your views in a logical sequence. Download and present our Arrows PowerPoint Templates because You can Channelise the thoughts of your team with our PowerPoint Templates and Slides. Urge them to focus on the goals you have set. Present our Marketing PowerPoint Templates because Our PowerPoint Templates and Slides will let your words and thoughts hit bullseye everytime. Use our Business PowerPoint Templates because Our PowerPoint Templates and Slides help you pinpoint your timelines. Highlight the reasons for your deadlines with their use.Use these PowerPoint slides for presentations relating to Arrow, completed, completion, concept, confirmation,design, flow, four, graphic, illustration, indication, indicator, information, layout, measurement, modern, number, one, order, phase, pointer, process, progress, purple, reflection, scale, send, set, shape, sign, two, violet, web, web design, websites, work flow. The prominent colors used in the PowerPoint template are Yellow, Gray, Black. The feedback we get is that our advantage of parallel processing 7 stages arrow data flow diagram PowerPoint Slides have awesome images to get your point across. Professionals tell us our flow PowerPoint templates and PPT Slides are designed to make your presentations professional. Use our advantage of parallel processing 7 stages arrow data flow diagram PowerPoint Slides have awesome images to get your point across. Presenters tell us our design PowerPoint templates and PPT Slides will make the presenter successul in his career/life. You can be sure our advantage of parallel processing 7 stages arrow data flow diagram PowerPoint Slides will make you look like a winner. PowerPoint presentation experts tell us our four PowerPoint templates and PPT Slides will help them to explain complicated concepts. Our Advantage Of Parallel Processing 7 Stages Arrow Data Flow Diagram PowerPoint Slides get you a promotion. With our money back guarantee you have nothing to lose.
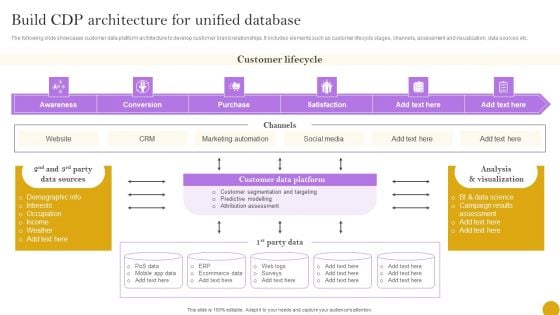
Comprehensive Customer Data Platform Guide Optimizing Promotional Initiatives Build CDP Architecture Unified Themes PDF
The following slide showcases customer data platform architecture to develop customer brand relationships. It includes elements such as customer lifecycle stages, channels, assessment and visualization, data sources etc. Find highly impressive Comprehensive Customer Data Platform Guide Optimizing Promotional Initiatives Build CDP Architecture Unified Themes PDF on Slidegeeks to deliver a meaningful presentation. You can save an ample amount of time using these presentation templates. No need to worry to prepare everything from scratch because Slidegeeks experts have already done a huge research and work for you. You need to download Comprehensive Customer Data Platform Guide Optimizing Promotional Initiatives Build CDP Architecture Unified Themes PDF for your upcoming presentation. All the presentation templates are 100 percent editable and you can change the color and personalize the content accordingly. Download now.
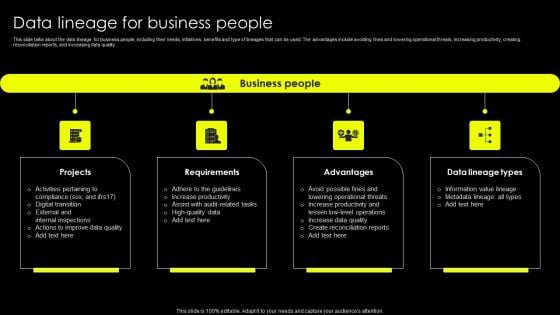
Data Lineage Implementation Data Lineage For Business People Microsoft PDF
This slide talks about the data lineage for business people, including their needs, initiatives, benefits and type of lineages that can be used. The advantages include avoiding fines and lowering operational threats, increasing productivity, creating reconciliation reports, and increasing data quality. If you are looking for a format to display your unique thoughts, then the professionally designed Data Lineage Implementation Data Lineage For Business People Microsoft PDF is the one for you. You can use it as a Google Slides template or a PowerPoint template. Incorporate impressive visuals, symbols, images, and other charts. Modify or reorganize the text boxes as you desire. Experiment with shade schemes and font pairings. Alter, share or cooperate with other people on your work. Download Data Lineage Implementation Data Lineage For Business People Microsoft PDF and find out how to give a successful presentation. Present a perfect display to your team and make your presentation unforgettable.
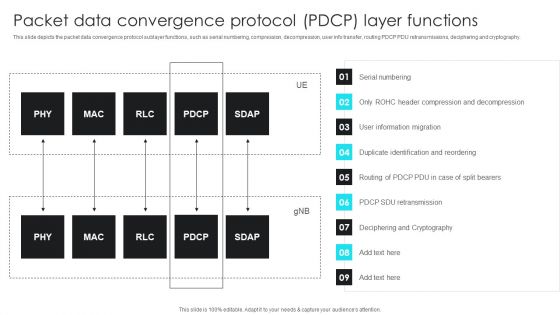
5G Network Operations Packet Data Convergence Protocol PDCP Layer Functions Themes PDF
This slide depicts the packet data convergence protocol sublayer functions, such as serial numbering, compression, decompression, user info transfer, routing PDCP PDU retransmissions, deciphering and cryptography. The 5G Network Operations Packet Data Convergence Protocol PDCP Layer Functions Themes PDF is a compilation of the most recent design trends as a series of slides. It is suitable for any subject or industry presentation, containing attractive visuals and photo spots for businesses to clearly express their messages. This template contains a variety of slides for the user to input data, such as structures to contrast two elements, bullet points, and slides for written information. Slidegeeks is prepared to create an impression.
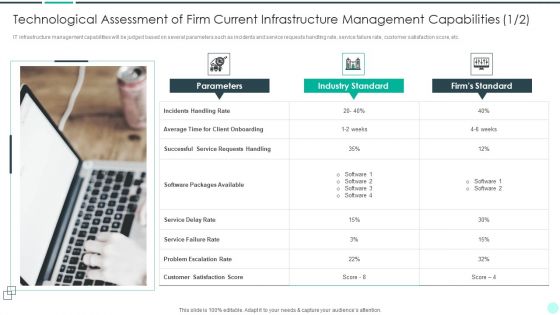
Executing Advance Data Analytics At Workspace Technological Assessment Themes PDF
IT infrastructure management capabilities will be judged based on several parameters such as incidents and service requests handling rate, service failure rate, customer satisfaction score, etc. This is a executing advance data analytics at workspace technological assessment themes pdf template with various stages. Focus and dispense information on four stages using this creative set, that comes with editable features. It contains large content boxes to add your information on topics like technological assessment of firm current infrastructure management capabilities. You can also showcase facts, figures, and other relevant content using this PPT layout. Grab it now.
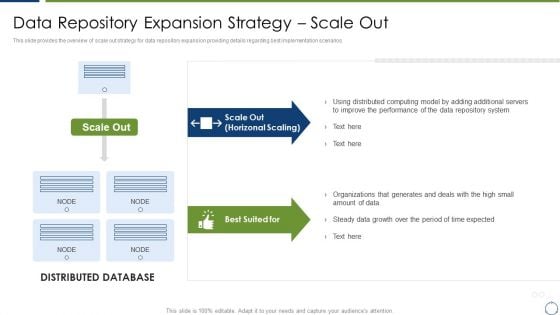
Horizontal Scaling Technique For Information Data Repository Expansion Strategy Scale Out Themes PDF
This slide provides the overview of scale out strategy for data repository expansion providing details regarding best implementation scenarios.Deliver and pitch your topic in the best possible manner with this Horizontal Scaling Technique For Information Data Repository Expansion Strategy Scale Out Themes PDF Use them to share invaluable insights on Distributed Computing, Improve The Performance, Repository System and impress your audience. This template can be altered and modified as per your expectations. So, grab it now.
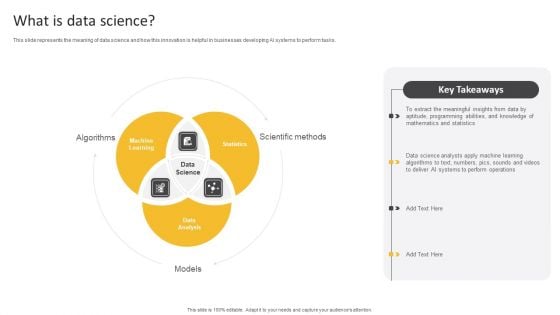
Information Science What Is Data Science Ppt PowerPoint Presentation Inspiration Themes PDF
This slide represents the meaning of data science and how this innovation is helpful in businesses developing AI systems to perform tasks.Deliver an awe inspiring pitch with this creative Information Science What Is Data Science Ppt PowerPoint Presentation Inspiration Themes PDF bundle. Topics like Machine Learning, Scientific Methods, Aptitude Programming can be discussed with this completely editable template. It is available for immediate download depending on the needs and requirements of the user.
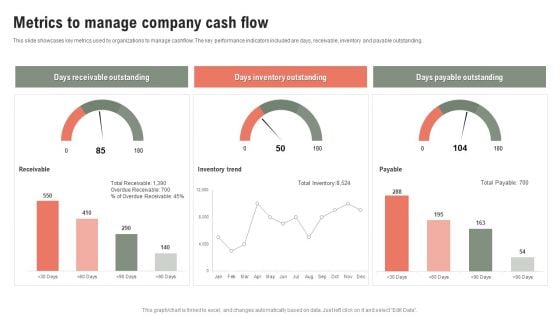
Metrics To Manage Company Cash Flow Ppt Model Gridlines PDF
This slide showcases key metrics used by organizations to manage cashflow. The key performance indicators included are days, receivable, inventory and payable outstanding. Pitch your topic with ease and precision using this Metrics To Manage Company Cash Flow Ppt Model Gridlines PDF. This layout presents information on Days Receivable Outstanding, Days Inventory Outstanding, Days Payable Outstanding. It is also available for immediate download and adjustment. So, changes can be made in the color, design, graphics or any other component to create a unique layout.
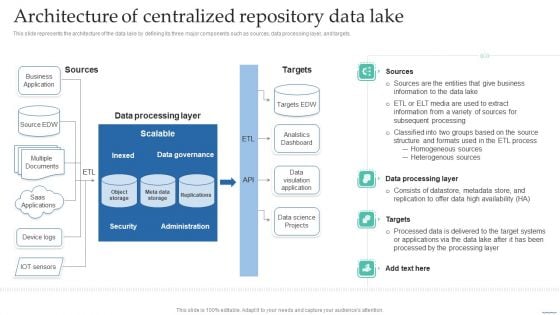
Architecture Of Centralized Repository Data Lake Data Lake Creation With Hadoop Cluster Portrait PDF
This slide represents the architecture of the data lake by defining its three major components such as sources, data processing layer, and targets.Are you searching for a Architecture Of Centralized Repository Data Lake Data Lake Creation With Hadoop Cluster Portrait PDF that is uncluttered, straightforward, and original Its easy to edit, and you can change the colors to suit your personal or business branding. For a presentation that expresses how much effort you ve put in, this template is ideal With all of its features, including tables, diagrams, statistics, and lists, its perfect for a business plan presentation. Make your ideas more appealing with these professional slides. Download Architecture Of Centralized Repository Data Lake Data Lake Creation With Hadoop Cluster Portrait PDF from Slidegeeks today.
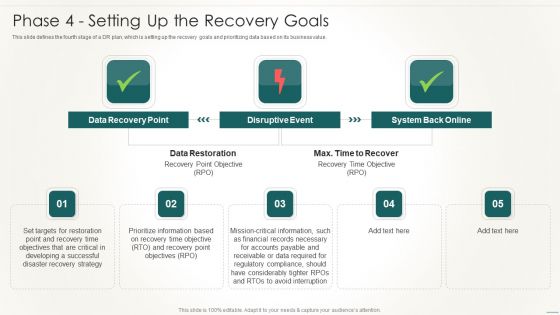
Information Technology Disaster Resilience Plan Phase 4 Setting Up The Recovery Goals Infographics PDF
This slide defines the fourth stage of a DR plan, which is setting up the recovery goals and prioritizing data based on its business value.Deliver and pitch your topic in the best possible manner with this Information Technology Disaster Resilience Plan Phase 4 Setting Up The Recovery Goals Infographics PDF. Use them to share invaluable insights on Data Recovery, Disruptive Event, System Back and impress your audience. This template can be altered and modified as per your expectations. So, grab it now.
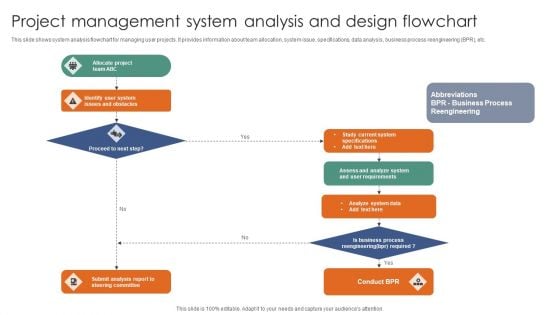
Project Management System Analysis And Design Flowchart Ppt Professional Graphic Images PDF
This slide shows system analysis flowchart for managing user projects. It provides information about team allocation, system issue, specifications, data analysis, business process reengineering BPR, etc. Persuade your audience using this Project Management System Analysis And Design Flowchart Ppt Professional Graphic Images PDF. This PPT design covers one stages, thus making it a great tool to use. It also caters to a variety of topics including Submit Analysis Report, Steering Committee, Conduct BPR, Analyze System Data . Download this PPT design now to present a convincing pitch that not only emphasizes the topic but also showcases your presentation skills.

Predictive Analytics For Empowering Roadmap For Predictive Analytics Model Inspiration Pdf
This slide represents the roadmap for predictive analytics model development, including the steps to be performed in the process, such as highlighting and formulating a problem, data preparation, information exploration, transforming and choosing, making, validating, and so on. Do you know about Slidesgeeks Predictive Analytics For Empowering Roadmap For Predictive Analytics Model Inspiration Pdf These are perfect for delivering any kind od presentation. Using it, create PowerPoint presentations that communicate your ideas and engage audiences. Save time and effort by using our pre-designed presentation templates that are perfect for a wide range of topic. Our vast selection of designs covers a range of styles, from creative to business, and are all highly customizable and easy to edit. Download as a PowerPoint template or use them as Google Slides themes. This slide represents the roadmap for predictive analytics model development, including the steps to be performed in the process, such as highlighting and formulating a problem, data preparation, information exploration, transforming and choosing, making, validating, and so on.
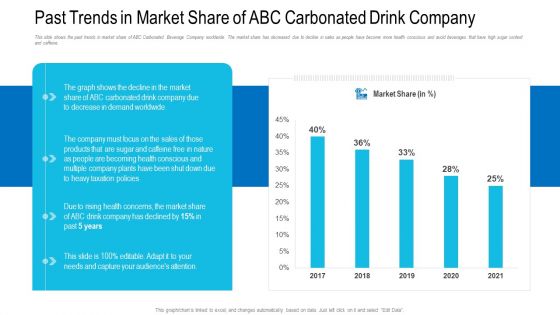
Past Trends In Market Share Of ABC Carbonated Drink Company Ppt Diagram Graph Charts PDF
This slide shows the past trends in market share of ABC Carbonated Beverage Company worldwide. The market share has decreased due to decline in sales as people have become more health conscious and avoid beverages that have high sugar content and caffeine. Deliver an awe inspiring pitch with this creative past trends in market share of abc carbonated drink company ppt diagram graph charts pdf bundle. Topics like past trends in market share of abc carbonated drink company can be discussed with this completely editable template. It is available for immediate download depending on the needs and requirements of the user.
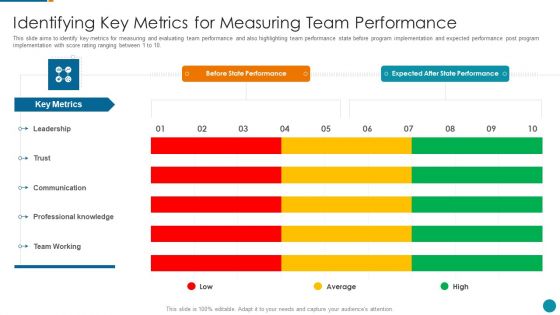
Strategic Procedure To Improve Employee Efficiency Identifying Key Metrics For Measuring Diagrams PDF
This slide aims to identify key metrics for measuring and evaluating team performance and also highlighting team performance state before program implementation and expected performance post program implementation with score rating ranging between 1 to 10.Deliver and pitch your topic in the best possible manner with this strategic procedure to improve employee efficiency identifying key metrics for measuring diagrams pdf Use them to share invaluable insights on expected after state performance, professional knowledge, communication and impress your audience. This template can be altered and modified as per your expectations. So, grab it now.
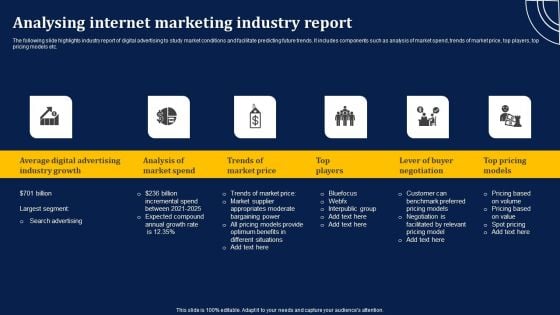
Analysing Internet Marketing Industry Report Designs PDF
The following slide highlights industry report of digital advertising to study market conditions and facilitate predicting future trends. It includes components such as analysis of market spend, trends of market price, top players, top pricing models etc. Presenting Analysing Internet Marketing Industry Report Designs PDF to dispense important information. This template comprises five stages. It also presents valuable insights into the topics including Average Digital Advertising, Analysis Market Spend, Trends Market Price . This is a completely customizable PowerPoint theme that can be put to use immediately. So, download it and address the topic impactfully.
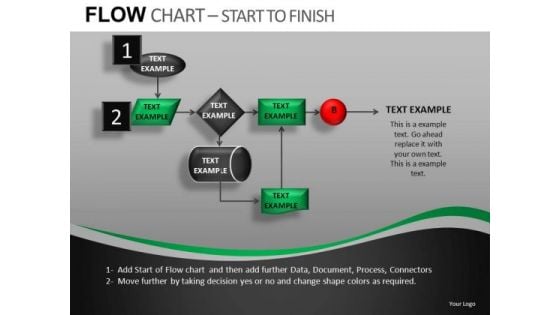
Ppt Slides Flow Charts Diagrams For PowerPoint
PPT Slides Flow Charts Diagrams for PowerPoint-These high quality powerpoint pre-designed slides and powerpoint templates have been carefully created by our professional team to help you impress your audience. All slides have been created and are 100% editable in powerpoint. Each and every property of any graphic - color, size, orientation, shading, outline etc. can be modified to help you build an effective powerpoint presentation. Any text can be entered at any point in the powerpoint template or slide. Simply DOWNLOAD, TYPE and PRESENT!These PowerPoint Presentation slides can be used for themes relating to--Business, businessman, chain, chart, communication, community, company, concept, connection, contact, corporate, creativity, data, database, diagram, draw, drawing, education, executive, flow, flowchart, global, graphic, group, illustration, internet, isolated, job, manager, meeting, net, network, networking, office, organization, people, person, plan, presentation, relationship, screen, social, structure, success, team, teamwork, web, white, work, writing Well begun is half done. Get a dream beginning with our Ppt Slides Flow Charts Diagrams For PowerPoint.
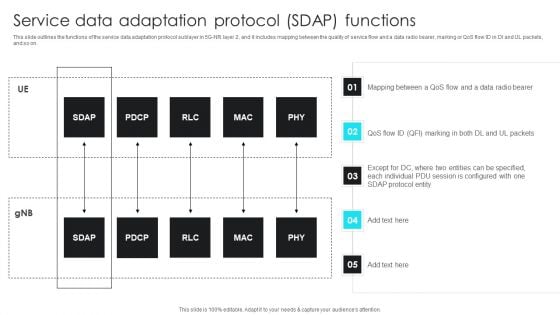
5G Network Operations Service Data Adaptation Protocol SDAP Functions Themes PDF
This slide outlines the functions of the service data adaptation protocol sublayer in 5G-NR layer 2, and it includes mapping between the quality of service flow and a data radio bearer, marking or QoS flow ID in Dl and UL packets, and so on. This 5G Network Operations Service Data Adaptation Protocol SDAP Functions Themes PDF from Slidegeeks makes it easy to present information on your topic with precision. It provides customization options, so you can make changes to the colors, design, graphics, or any other component to create a unique layout. It is also available for immediate download, so you can begin using it right away. Slidegeeks has done good research to ensure that you have everything you need to make your presentation stand out. Make a name out there for a brilliant performance.
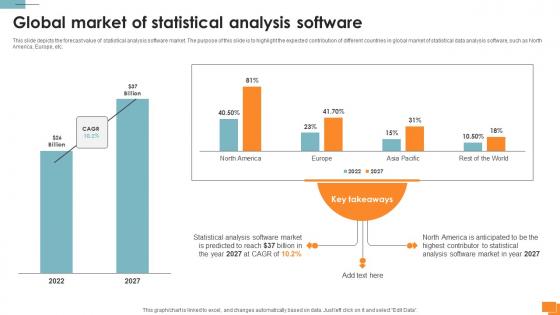
Statistical Tools For Evidence Global Market Of Statistical Analysis Software
This slide depicts the forecast value of statistical analysis software market. The purpose of this slide is to highlight the expected contribution of different countries in global market of statistical data analysis software, such as North America, Europe, etc. This modern and well-arranged Statistical Tools For Evidence Global Market Of Statistical Analysis Software provides lots of creative possibilities. It is very simple to customize and edit with the Powerpoint Software. Just drag and drop your pictures into the shapes. All facets of this template can be edited with Powerpoint, no extra software is necessary. Add your own material, put your images in the places assigned for them, adjust the colors, and then you can show your slides to the world, with an animated slide included. This slide depicts the forecast value of statistical analysis software market. The purpose of this slide is to highlight the expected contribution of different countries in global market of statistical data analysis software, such as North America, Europe, etc.
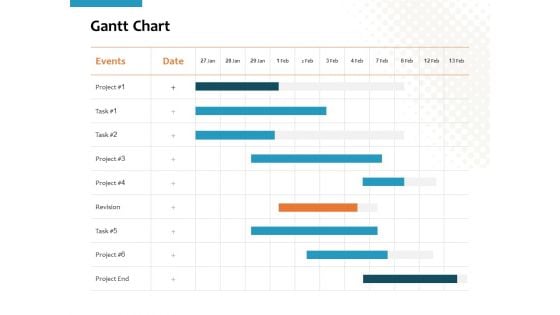
Gantt Chart Ppt PowerPoint Presentation Slides Themes
Make a highly optimized project management report using this content-ready Gantt Chart PPT Diagram. Effortless yet very clear, this layout proves a useful tool to present the professional details of a task or activity. Showcase the activities and allotted time to the business executives with this Gantt Chart PowerPoint theme. List down the column tasks in various timeframes and the activities associated with each of them here. Further, plot time allocation for various tasks, monitor their actual time and make comparisons to interpret the final progress with this well-structured Gantt Chart Excel Template. You can add all the significant details of a particular project in this chart and showcase it to all the project members so that they can participate in the overall development. Not only this but also our PPT template can help you showcase the work breakdown structure of your project.

Business Diagram Three Colored Banners For Data Representation Presentation Template
Three colored banners are used to craft this power point template slide. This PPT slide contains the concept of data representation. Use this PPT slide for your business and management related presentations.
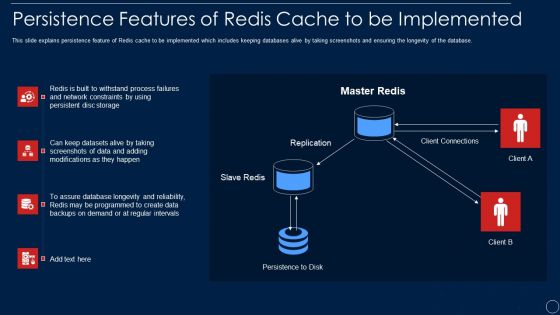
Redis Cache Data Structure IT Persistence Features Of Redis Cache To Be Implemented Themes PDF
This slide explains persistence feature of Redis cache to be implemented which includes keeping databases alive by taking screenshots and ensuring the longevity of the database. Deliver and pitch your topic in the best possible manner with this redis cache data structure it persistence features of redis cache to be implemented themes pdf. Use them to share invaluable insights on database, network and impress your audience. This template can be altered and modified as per your expectations. So, grab it now.
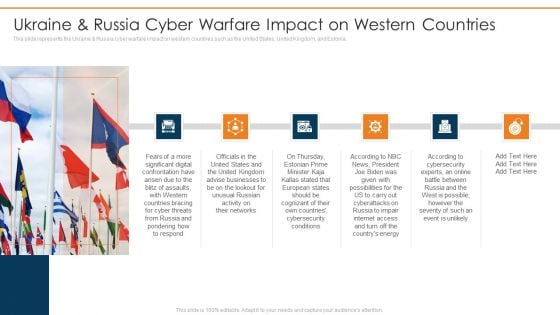
Data Wiper Spyware Attack Ukraine And Russia Cyber Warfare Impact On Western Countries Themes PDF
This slide represents the Ukraine and Russia cyber warfare impact on western countries such as the United States, United Kingdom, and Estonia.Deliver an awe inspiring pitch with this creative data wiper spyware attack ukraine and russia cyber warfare impact on western countries themes pdf bundle. Topics like united kingdom advise, businesses lookout for unusual, russian activity can be discussed with this completely editable template. It is available for immediate download depending on the needs and requirements of the user.
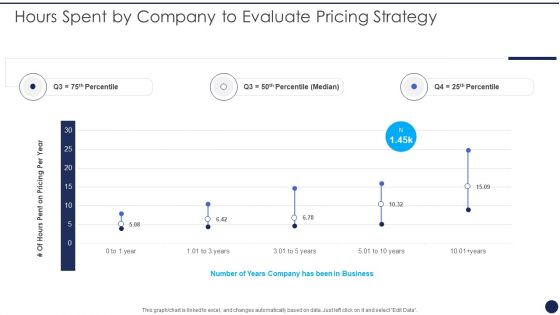
Hours Spent By Company To Evaluate Pricing Strategy Product Pricing Strategies Analysis Themes PDF
This graph or chart is linked to excel, and changes automatically based on data. Just left click on it and select Edit Data. Deliver and pitch your topic in the best possible manner with this Hours Spent By Company To Evaluate Pricing Strategy Product Pricing Strategies Analysis Themes PDF. Use them to share invaluable insights on Pricing Per Year, Number Years Business and impress your audience. This template can be altered and modified as per your expectations. So, grab it now.
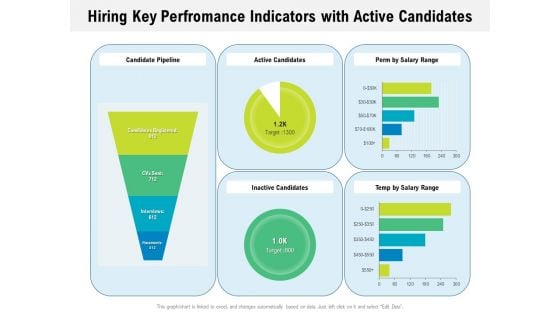
Hiring Key Perfromance Indicators With Active Candidates Ppt PowerPoint Presentation File Microsoft PDF
Presenting this set of slides with name hiring key performance indicators with active candidates ppt powerpoint presentation file microsoft pdf. The topics discussed in these slides are candidate pipeline, active candidates, perm by salary range, inactive candidates, temp by salary range. This is a completely editable PowerPoint presentation and is available for immediate download. Download now and impress your audience.
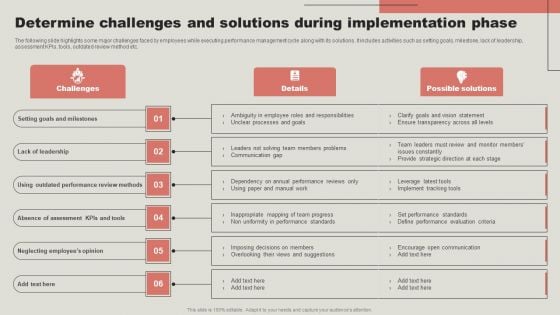
Determine Challenges And Solutions During Implementation Phase Infographics PDF
The following slide highlights some major challenges faced by employees while executing performance management cycle along with its solutions. It includes activities such as setting goals, milestone, lack of leadership, assessment KPIs, tools, outdated review method etc. This Determine Challenges And Solutions During Implementation Phase Infographics PDF from Slidegeeks makes it easy to present information on your topic with precision. It provides customization options, so you can make changes to the colors, design, graphics, or any other component to create a unique layout. It is also available for immediate download, so you can begin using it right away. Slidegeeks has done good research to ensure that you have everything you need to make your presentation stand out. Make a name out there for a brilliant performance.
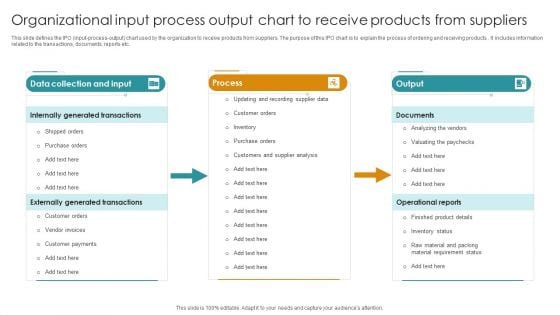
Organizational Input Process Output Chart To Receive Products From Suppliers Topics PDF
This slide defines the IPO input-process-output chart used by the organization to receive products from suppliers. The purpose of this IPO chart is to explain the process of ordering and receiving products . It includes information related to the transactions, documents, reports etc. Pitch your topic with ease and precision using this Organizational Input Process Output Chart To Receive Products From Suppliers Topics PDF. This layout presents information on Data Collection And Input, Process, Output. It is also available for immediate download and adjustment. So, changes can be made in the color, design, graphics or any other component to create a unique layout.
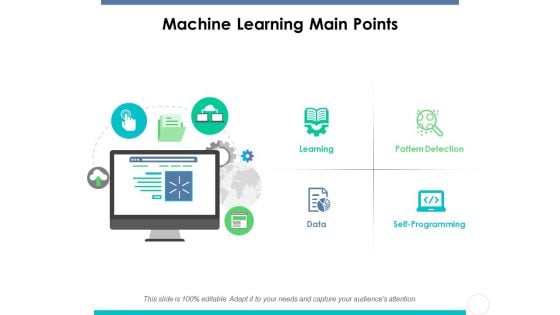
Machine Learning Main Points Ppt PowerPoint Presentation Diagram Graph Charts
This is a machine learning main points ppt powerpoint presentation diagram graph charts. This is a four stages process. The stages in this process are learning, pattern detection, programming, data, machine learning main points.
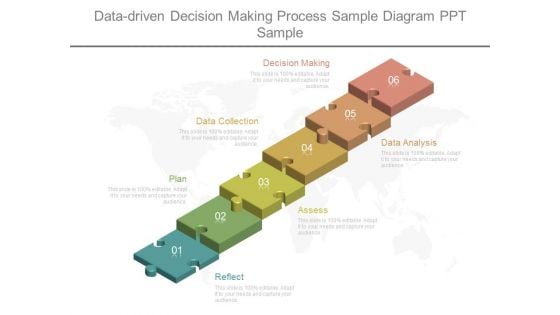
Data Driven Decision Making Process Sample Diagram Ppt Sample
This is a data driven decision making process sample diagram ppt sample. This is a six stage process. The stages in this process are decision making, data collection, plan, reflect, assess, data analysis.
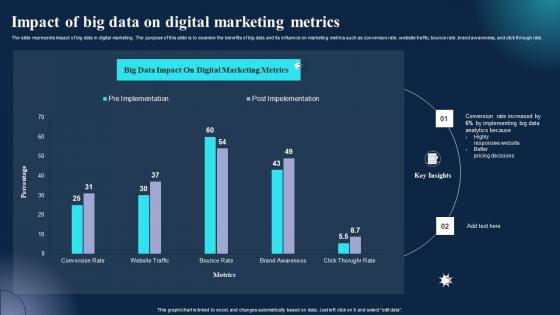
Impact Of Big Data On Digital Marketing Metrics Information Pdf
The slide represents impact of big data in digital marketing. The purpose of this slide is to examine the benefits of big data and its influence on marketing metrics such as conversion rate, website traffic, bounce rate, brand awareness, and click through rate. Pitch your topic with ease and precision using this Impact Of Big Data On Digital Marketing Metrics Information Pdf. This layout presents information on Marketing Metrics, Pricing Decisions, Impact. It is also available for immediate download and adjustment. So, changes can be made in the color, design, graphics or any other component to create a unique layout. The slide represents impact of big data in digital marketing. The purpose of this slide is to examine the benefits of big data and its influence on marketing metrics such as conversion rate, website traffic, bounce rate, brand awareness, and click through rate.
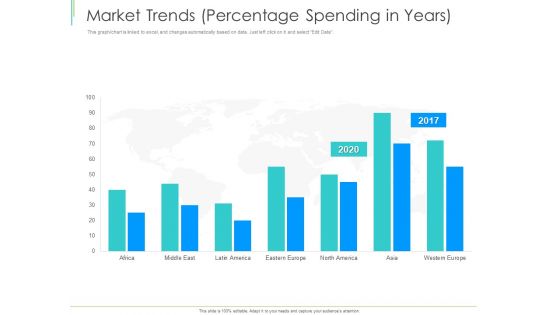
Marketing Plan Implementation Market Trends Percentage Spending In Years Demonstration PDF
This graph or chart is linked to excel, and changes automatically based on data. Just left click on it and select Edit Data. Deliver an awe-inspiring pitch with this creative marketing plan implementation market trends percentage spending in years demonstration pdf bundle. Topics like market trends, percentage spending in years can be discussed with this completely editable template. It is available for immediate download depending on the needs and requirements of the user.
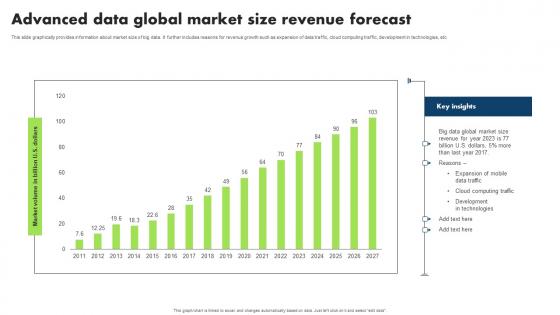
Advanced Data Global Market Size Revenue Forecast Microsoft Pdf
This slide graphically provides information about market size of big data. It further includes reasons for revenue growth such as expansion of data traffic, cloud computing traffic, development in technologies, etc Showcasing this set of slides titled Advanced Data Global Market Size Revenue Forecast Microsoft Pdf. The topics addressed in these templates are Expansion Mobile Data Traffic, Cloud Computing Traffic, Development Technologies. All the content presented in this PPT design is completely editable. Download it and make adjustments in color, background, font etc. as per your unique business setting. This slide graphically provides information about market size of big data. It further includes reasons for revenue growth such as expansion of data traffic, cloud computing traffic, development in technologies, etc
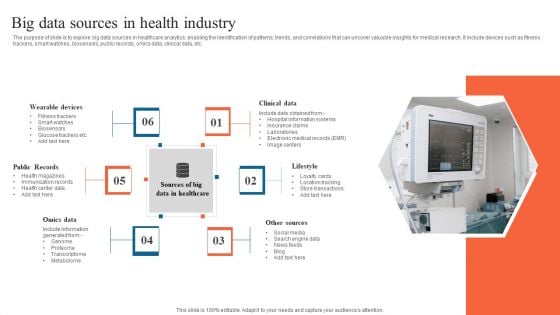
Big Data Sources In Health Industry Professional PDF
The purpose of slide is to explore big data sources in healthcare analytics, enabling the identification of patterns, trends, and correlations that can uncover valuable insights for medical research. It include devices such as fitness trackers, smart watches, biosensors, public records, omics data, clinical data, etc. Presenting Big Data Sources In Health Industry Professional PDF to dispense important information. This template comprises six stages. It also presents valuable insights into the topics including Clinical Data, Lifestyle, Other Sources. This is a completely customizable PowerPoint theme that can be put to use immediately. So, download it and address the topic impactfully.

 Home
Home