Dashboard Icon
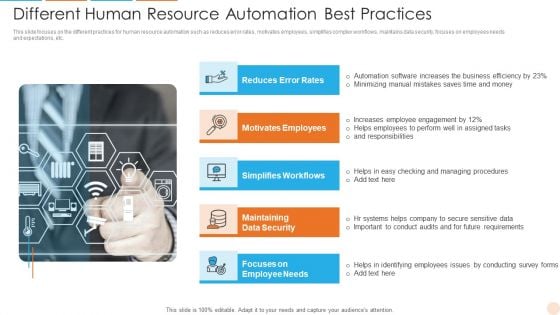
Different Human Resource Automation Best Practices Themes PDF
This slide focuses on the different practices for human resource automation such as reduces error rates, motivates employees, simplifies complex workflows, maintains data security, focuses on employees needs and expectations, etc. Persuade your audience using this Different Human Resource Automation Best Practices Themes PDF. This PPT design covers four stages, thus making it a great tool to use. It also caters to a variety of topics including Reduces Error Rates, Motivates Employees, Maintaining Data Security. Download this PPT design now to present a convincing pitch that not only emphasizes the topic but also showcases your presentation skills.
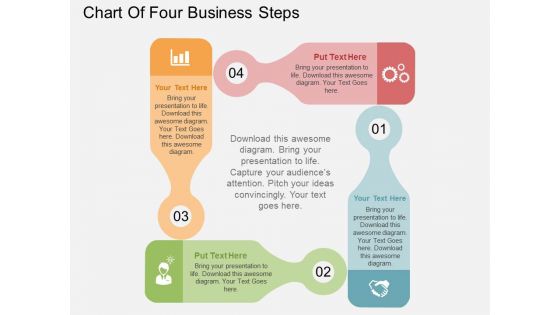
Chart Of Four Business Steps Powerpoint Templates
This business diagram displays flow of four business steps. This editable slide is suitable to present growth management. Use this diagram for business and finance related topics and display complete data analysis in your presentation.
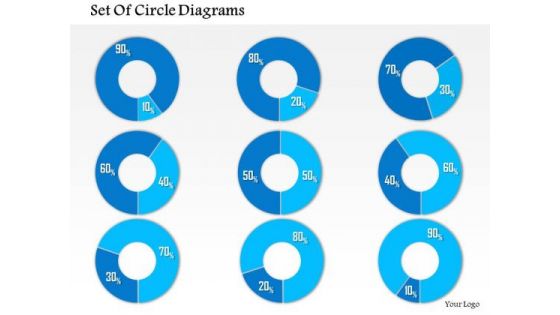
Business Framework 10 Percent To 90 Percent PowerPoint Presentation
This business diagram has been designed with graphic of multiple pie graphs. This diagram slide contains the concept of result analysis with percentage values. Use this diagram to present and compare data in an impressive manner
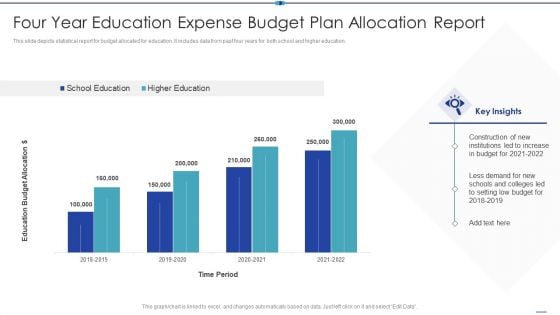
Four Year Education Expense Budget Plan Allocation Report Sample PDF
This slide depicts statistical report for budget allocated for education. It includes data from past four years for both school and higher education.Pitch your topic with ease and precision using this Four Year Education Expense Budget Plan Allocation Report Sample PDF This layout presents information on Institutions Increase, Less Demand, Education Budget It is also available for immediate download and adjustment. So, changes can be made in the color, design, graphics or any other component to create a unique layout.
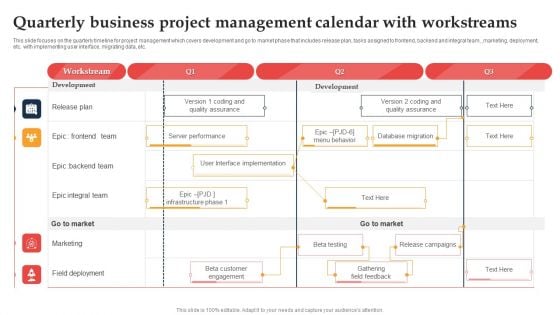
Quarterly Business Project Management Calendar With Workstreams Ppt Ideas Influencers PDF
This slide focuses on the quarterly timeline for project management which covers development and go to market phase that includes release plan, tasks assigned to frontend, backend and integral team, ,marketing, deployment, etc. with implementing user interface, migrating data, etc. Pitch your topic with ease and precision using this Quarterly Business Project Management Calendar With Workstreams Ppt Ideas Influencers PDF. This layout presents information on Release Plan, Workstream, Development. It is also available for immediate download and adjustment. So, changes can be made in the color, design, graphics or any other component to create a unique layout.
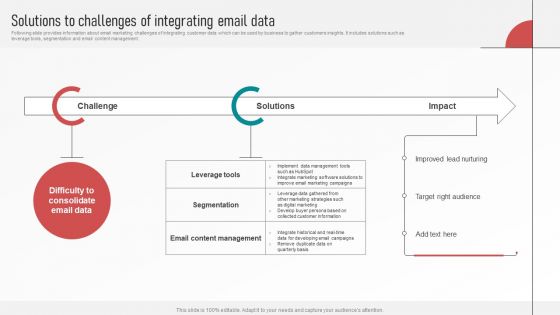
Customer Retention With Email Advertising Campaign Plan Solutions To Challenges Of Integrating Email Data Clipart PDF
Following slide provides information about email marketing challenges of integrating customer data which can be used by business to gather customers insights. It includes solutions such as leverage tools, segmentation and email content management. Are you searching for a Customer Retention With Email Advertising Campaign Plan Solutions To Challenges Of Integrating Email Data Clipart PDF that is uncluttered, straightforward, and original Its easy to edit, and you can change the colors to suit your personal or business branding. For a presentation that expresses how much effort you have put in, this template is ideal. With all of its features, including tables, diagrams, statistics, and lists, its perfect for a business plan presentation. Make your ideas more appealing with these professional slides. Download Customer Retention With Email Advertising Campaign Plan Solutions To Challenges Of Integrating Email Data Clipart PDF from Slidegeeks today.
Tabs For Tracking Mortgage Application Status In Progress Themes PDF
The following slide highlights loan status in progress tracking utilizing tabs facilitating managers to monitor application. It includes tabs such as application snapshot, loan information, declared income and expenses, documents and activities etc. Presenting Tabs For Tracking Mortgage Application Status In Progress Themes PDF to dispense important information. This template comprises five stages. It also presents valuable insights into the topics including Application Snapshot, Loan Information, Declared Income Expenses . This is a completely customizable PowerPoint theme that can be put to use immediately. So, download it and address the topic impactfully.
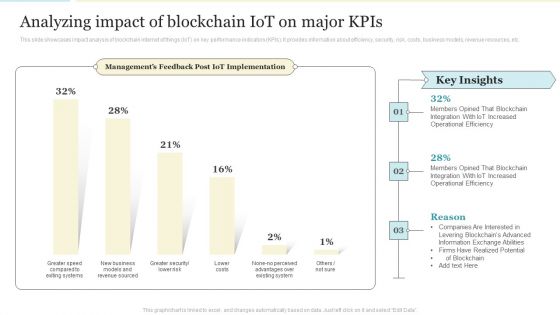
Analyzing Impact Of Blockchain Iot On Major Kpis Formats PDF
This slide showcases impact analysis of blockchain internet of things IoT on key performance indicators KPIs. It provides information about efficiency, security, risk, costs, business models, revenue resources, etc. Deliver an awe inspiring pitch with this creative Analyzing Impact Of Blockchain Iot On Major Kpis Formats PDF bundle. Topics like Operational Efficiency, Information, Existing System can be discussed with this completely editable template. It is available for immediate download depending on the needs and requirements of the user.
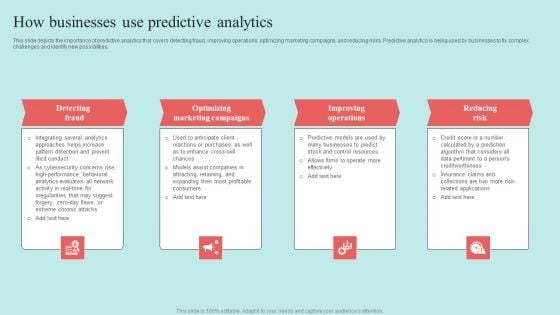
Predictive Data Model How Businesses Use Predictive Analytics Topics PDF
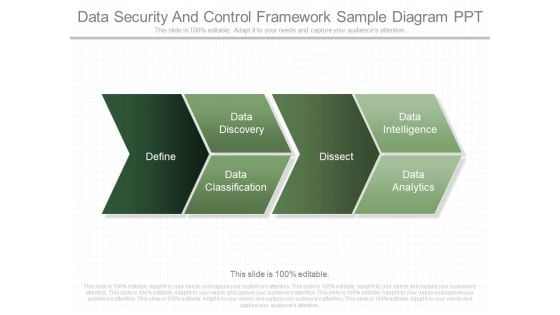
Data Security And Control Framework Sample Diagram Ppt
This is a data security and control framework sample diagram ppt. This is a four stage process. The stages in this process are define, data classification, data discovery, dissect, data intelligence, data analytics.
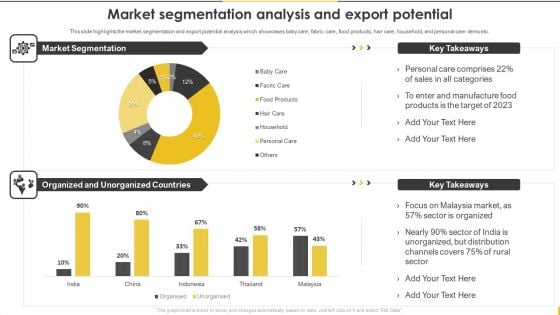
Customer Goods Production Market Segmentation Analysis And Export Potential Download PDF
This slide highlights the market segmentation and export potential analysis which showcases baby care, fabric care, food products, hair care, household, and personal care items etc. The Customer Goods Production Market Segmentation Analysis And Export Potential Download PDF is a compilation of the most recent design trends as a series of slides. It is suitable for any subject or industry presentation, containing attractive visuals and photo spots for businesses to clearly express their messages. This template contains a variety of slides for the user to input data, such as structures to contrast two elements, bullet points, and slides for written information. Slidegeeks is prepared to create an impression.
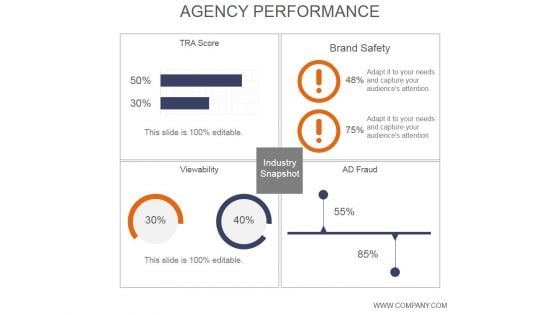
Agency Performance Ppt PowerPoint Presentation Layout
This is a agency performance ppt powerpoint presentation layout. This is a four stage process. The stages in this process are tra score, viewability, industry snapshot, brand safety, ad fraud.
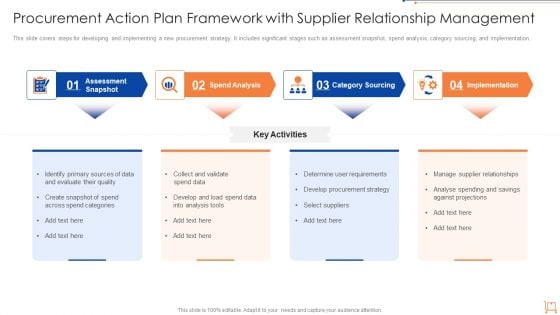
Procurement Action Plan Framework With Supplier Relationship Management Themes PDF
This slide covers steps for developing and implementing a new procurement strategy. It includes significant stages such as assessment snapshot, spend analysis, category sourcing, and implementation. Persuade your audience using this procurement action plan framework with supplier relationship management themes pdf. This PPT design covers four stages, thus making it a great tool to use. It also caters to a variety of topics including assessment snapshot, spend analysis, category sourcing, implementation. Download this PPT design now to present a convincing pitch that not only emphasizes the topic but also showcases your presentation skills.
Presentation Of BPO Data Through Chart Ppt Pictures Design Inspiration PDF
Pitch your topic with ease and precision using this presentation of bpo data through chart ppt pictures design inspiration pdf. This layout presents information on presentation of bpo data through chart. It is also available for immediate download and adjustment. So, changes can be made in the color, design, graphics or any other component to create a unique layout.
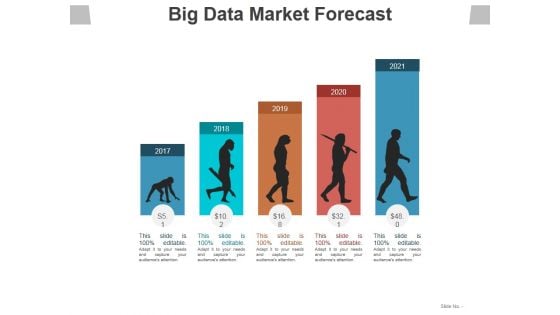
Big Data Market Forecast Ppt PowerPoint Presentation Ideas Information
This is a big data market forecast ppt powerpoint presentation ideas information. This is a five stage process. The stages in this process are years, planning, growth, business, marketing.
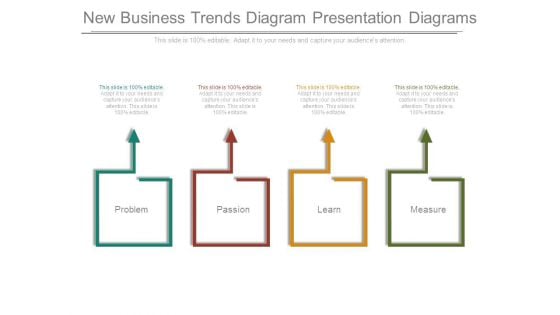
New Business Trends Diagram Presentation Diagrams
This is a new business trends diagram presentation diagrams. This is a four stage process. The stages in this process are problem, passion, learn, measure.
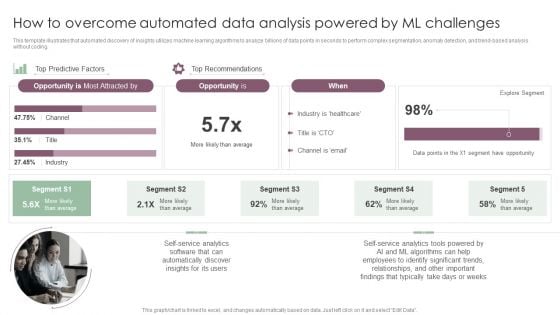
Information Analysis And BI Playbook How To Overcome Automated Data Analysis Powered By Ml Challenges Clipart PDF
This template illustrates that automated discovery of insights utilizes machine learning algorithms to analyze billions of data points in seconds to perform complex segmentation, anomaly detection, and trend-based analysis without coding. Make sure to capture your audiences attention in your business displays with our gratis customizable Information Analysis And BI Playbook How To Overcome Automated Data Analysis Powered By Ml Challenges Clipart PDF. These are great for business strategies, office conferences, capital raising or task suggestions. If you desire to acquire more customers for your tech business and ensure they stay satisfied, create your own sales presentation with these plain slides.
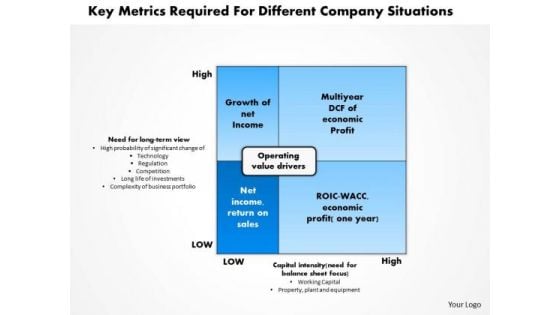
Business Diagram Key Metrics Required For Different Company Situations PowerPoint Ppt Presentation
Get The Domestics Right With Our Business Diagram Key Metrics Required For Different Company Situations PowerPoint PPT Presentation PowerPoint Templates. Create The Base For Thoughts To Grow. Do Away With Dogmatic Approaches. Establish The Value Of Reason With Our Business PowerPoint Templates.
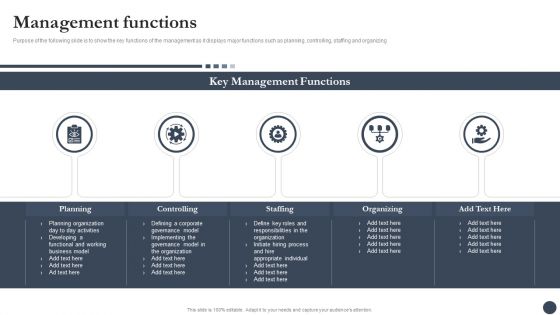
Strategic Playbook For Enterprise Administration Management Functions Themes PDF
This is a Strategic Playbook For Enterprise Administration Management Functions Themes PDF template with various stages. Focus and dispense information on three stages using this creative set, that comes with editable features. It contains large content boxes to add your information on topics like Magnifying Glass. You can also showcase facts, figures, and other relevant content using this PPT layout. Grab it now.
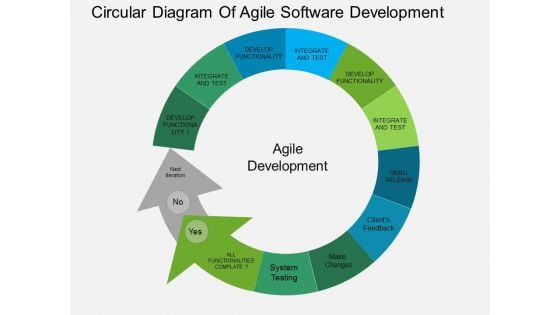
Circular Diagram Of Agile Software Development Powerpoint Templates
This PowerPoint template has been designed with circular diagram This diagram is a data visualization tool that gives you a simple way to present statistical information. This slide helps your audience examine and interpret the data you present.
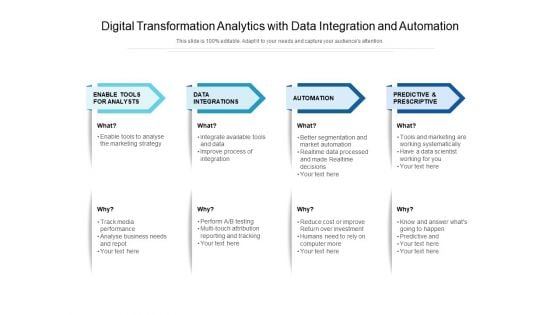
Digital Transformation Analytics With Data Integration And Automation Ppt PowerPoint Presentation File Diagrams PDF
Presenting this set of slides with name digital transformation analytics with data integration and automation ppt powerpoint presentation file diagrams pdf. This is a four stage process. The stages in this process are integrations, automation, prescriptive. This is a completely editable PowerPoint presentation and is available for immediate download. Download now and impress your audience.
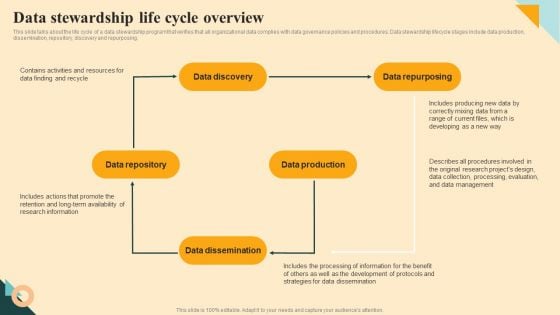
Data Stewardship Life Cycle Overview Demonstration PDF
This slide talks about the life cycle of a data stewardship program that verifies that all organizational data complies with data governance policies and procedures. Data stewardship lifecycle stages include data production, dissemination, repository, discovery and repurposing. If you are looking for a format to display your unique thoughts, then the professionally designed Data Stewardship Life Cycle Overview Demonstration PDF is the one for you. You can use it as a Google Slides template or a PowerPoint template. Incorporate impressive visuals, symbols, images, and other charts. Modify or reorganize the text boxes as you desire. Experiment with shade schemes and font pairings. Alter, share or cooperate with other people on your work. Download Data Stewardship Life Cycle Overview Demonstration PDF and find out how to give a successful presentation. Present a perfect display to your team and make your presentation unforgettable.
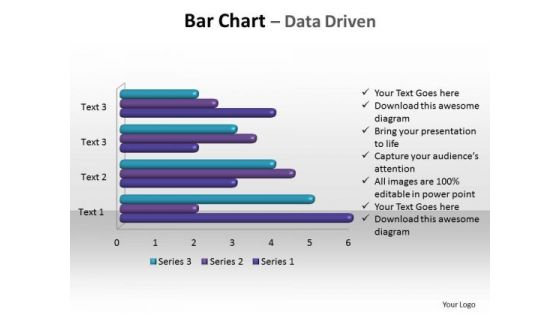
Business Sales PowerPoint Templates Business Bar Chart Data Driven Ppt Slides
Business Sales PowerPoint Templates Business bar chart data driven PPT Slides-This PowerPoint d Editable Data-Driven Chart is for visualizing your figures and data. Business Sales PowerPoint Templates Business bar chart data driven PPT Slides-This ppt can be used for concepts relating to-Chat, Illustration, data driven, figures, charts and Graphs. Set the audience alight with our Business Sales PowerPoint Templates Business Bar Chart Data Driven Ppt Slides. You will come up with a cracker of an idea.
Booting Brand Image By Tracking KPI Metrics Diagrams PDF
This slide consists of key performance indicators to be used by mangers to track the brand awareness . Key metrices covered are content reach, brand mention, blog shares, search volume data, repeat purchase and organic traffic. Showcasing this set of slides titled Booting Brand Image By Tracking KPI Metrics Diagrams PDF. The topics addressed in these templates are Content Reach, Brand Mentions, Blog Shares. All the content presented in this PPT design is completely editable. Download it and make adjustments in color, background, font etc. as per your unique business setting.

Employer Branding Equity Structure Key Phases Formats PDF
The following slide showcases employer branding framework with key phases that are audit and analysis, EVP strategy development, testing and approval, alignment, communication and management and metrics. Persuade your audience using this Employer Branding Equity Structure Key Phases Formats PDF. This PPT design covers five stages, thus making it a great tool to use. It also caters to a variety of topics including Audit And Analysis, Alignment And Communication, Management And Metrics. Download this PPT design now to present a convincing pitch that not only emphasizes the topic but also showcases your presentation skills.
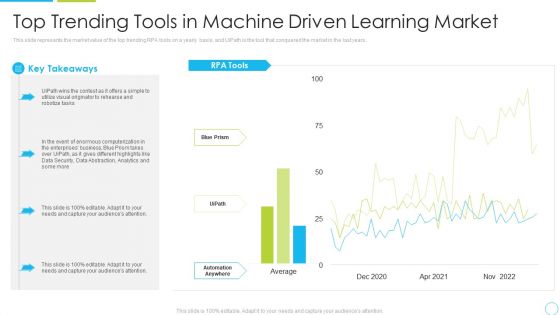
Top Trending Tools In Machine Driven Learning Market Ppt Pictures Example PDF
This slide represents the market value of the top trending RPA tools on a yearly basis, and UiPath is the tool that conquered the market in the last years. Deliver an awe inspiring pitch with this creative top trending tools in machine driven learning market ppt pictures example pdf bundle. Topics like analytics, enterprises, data security can be discussed with this completely editable template. It is available for immediate download depending on the needs and requirements of the user.
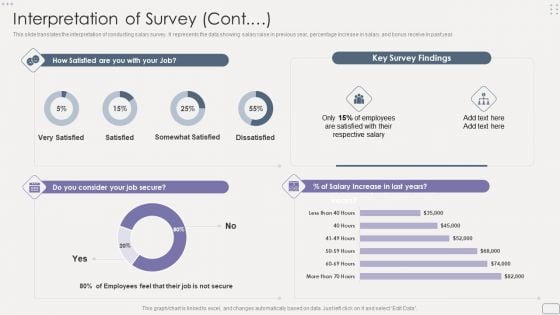
Income Assessment Report Interpretation Of Survey Contd Portrait PDF
This slide translates the interpretation of conducting salary survey. It represents the data showing salary raise in previous year, percentage increase in salary, and bonus receive in past year.Deliver and pitch your topic in the best possible manner with this Income Assessment Report Interpretation Of Survey Contd Portrait PDF. Use them to share invaluable insights on Increment Criteria, Projected Increment, Middle Management and impress your audience. This template can be altered and modified as per your expectations. So, grab it now.
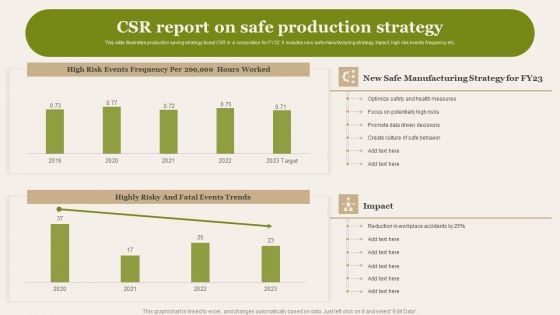
CSR Report On Safe Production Strategy Demonstration PDF
This slide illustrates production saving strategy boost CSR in a corporation for FY22. It includes new safe manufacturing strategy, impact, high risk events frequency etc. Showcasing this set of slides titled CSR Report On Safe Production Strategy Demonstration PDF. The topics addressed in these templates are Optimize Safety, Potentially High Risks, Promote Data Driven Decisions. All the content presented in this PPT design is completely editable. Download it and make adjustments in color, background, font etc. as per your unique business setting.
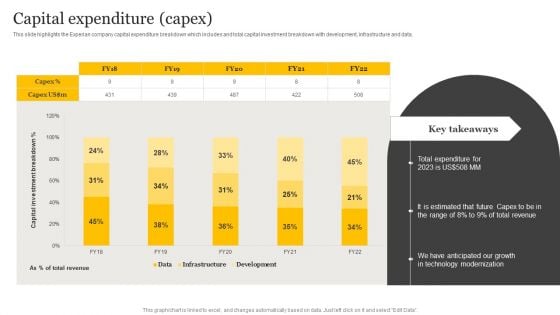
Customer Credit Reporting Company Outline Capital Expenditure Capex Designs PDF
This slide highlights the Experian company capital expenditure breakdown which includes and total capital investment breakdown with development, infrastructure and data. There are so many reasons you need a Customer Credit Reporting Company Outline Capital Expenditure Capex Designs PDF. The first reason is you cannot spend time making everything from scratch, Thus, Slidegeeks has made presentation templates for you too. You can easily download these templates from our website easily.
Product Repositioning KPI Monitoring And Tracking Ppt PowerPoint Presentation File Infographic Template PDF
This slide highlights the key performance indicator of product repositioning which includes product sales, product demand in the market, position in the market and social media channels growth rate. If you are looking for a format to display your unique thoughts, then the professionally designed Product Repositioning KPI Monitoring And Tracking Ppt PowerPoint Presentation File Infographic Template PDF is the one for you. You can use it as a Google Slides template or a PowerPoint template. Incorporate impressive visuals, symbols, images, and other charts. Modify or reorganize the text boxes as you desire. Experiment with shade schemes and font pairings. Alter, share or cooperate with other people on your work. Download Product Repositioning KPI Monitoring And Tracking Ppt PowerPoint Presentation File Infographic Template PDF and find out how to give a successful presentation. Present a perfect display to your team and make your presentation unforgettable.
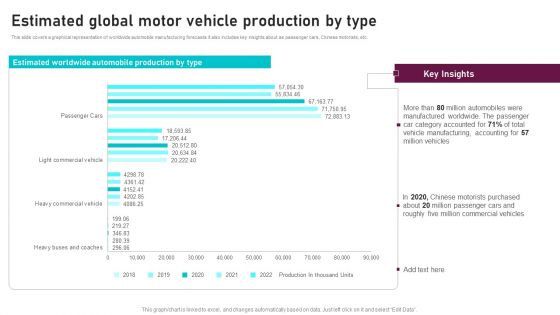
Estimated Global Motor Vehicle Production By Type Global Automotive Manufacturing Market Analysis Information PDF
This slide covers a graphical representation of worldwide automobile manufacturing forecasts. It also includes key insights about as passenger cars, Chinese motorists, etc. The Estimated Global Motor Vehicle Production By Type Global Automotive Manufacturing Market Analysis Information PDF is a compilation of the most recent design trends as a series of slides. It is suitable for any subject or industry presentation, containing attractive visuals and photo spots for businesses to clearly express their messages. This template contains a variety of slides for the user to input data, such as structures to contrast two elements, bullet points, and slides for written information. Slidegeeks is prepared to create an impression.
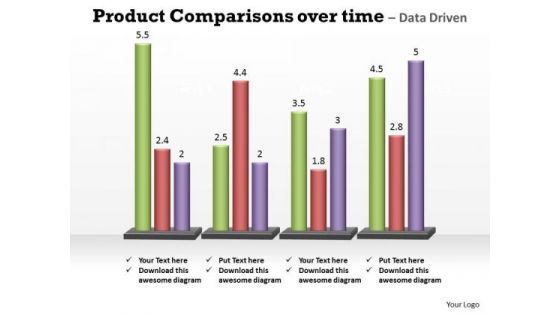
Business Marketing PowerPoint Templates Business Product Comparisons Over Time Ppt Slides
Business Marketing PowerPoint Templates Business product comparisons over time PPT Slides--This chart is useful for showing data changes over a period of time or for illustrating comparisons among items. -Business Marketing PowerPoint Templates Business product comparison over time PPT Slides-This ppt can be used for concepts relating to-chart,, graph, growth, investment, , market, percentage, , presentation report, results, statistics, stock, success and business. Continue growing with our Business Marketing PowerPoint Templates Business Product Comparisons Over Time Ppt Slides. Download without worries with our money back guaranteee.
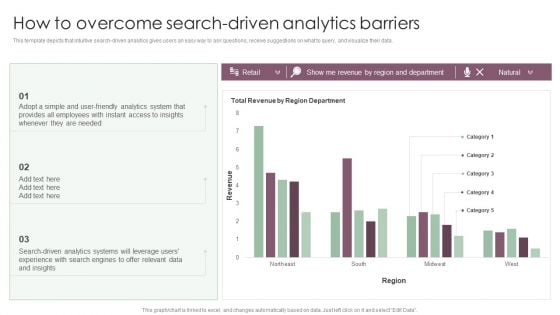
Information Analysis And BI Playbook How To Overcome Search Driven Analytics Barriers Formats PDF
This template depicts that intuitive search driven analytics gives users an easy way to ask questions, receive suggestions on what to query, and visualize their data. Coming up with a presentation necessitates that the majority of the effort goes into the content and the message you intend to convey. The visuals of a PowerPoint presentation can only be effective if it supplements and supports the story that is being told. Keeping this in mind our experts created Information Analysis And BI Playbook How To Overcome Search Driven Analytics Barriers Formats PDF to reduce the time that goes into designing the presentation. This way, you can concentrate on the message while our designers take care of providing you with the right template for the situation.
Data Analysis Planning Circle Ppt PowerPoint Presentation Complete Deck
Share a great deal of information on the topic by deploying this data analysis planning circle ppt powerpoint presentation complete deck. Support your ideas and thought process with this prefabricated set. It includes a set of sixteen slides, all fully modifiable and editable. Each slide can be restructured and induced with the information and content of your choice. You can add or remove large content boxes as well, to make this PPT slideshow more personalized. Its high-quality graphics and visuals help in presenting a well-coordinated pitch. This PPT template is also a resourceful tool to take visual cues from and implement the best ideas to help your business grow and expand. The main attraction of this well-formulated deck is that everything is editable, giving you the freedom to adjust it to your liking and choice. Changes can be made in the background and theme as well to deliver an outstanding pitch. Therefore, click on the download button now to gain full access to this multifunctional set.
Data Analysis Plan Business Circles Ppt PowerPoint Presentation Complete Deck
Share a great deal of information on the topic by deploying this data analysis plan business circles ppt powerpoint presentation complete deck. Support your ideas and thought process with this prefabricated set. It includes a set of twelve slides, all fully modifiable and editable. Each slide can be restructured and induced with the information and content of your choice. You can add or remove large content boxes as well, to make this PPT slideshow more personalized. Its high-quality graphics and visuals help in presenting a well-coordinated pitch. This PPT template is also a resourceful tool to take visual cues from and implement the best ideas to help your business grow and expand. The main attraction of this well-formulated deck is that everything is editable, giving you the freedom to adjust it to your liking and choice. Changes can be made in the background and theme as well to deliver an outstanding pitch. Therefore, click on the download button now to gain full access to this multifunctional set.
Inward And Outward Data Analysis Ppt PowerPoint Presentation Complete Deck
Share a great deal of information on the topic by deploying this inward and outward data analysis ppt powerpoint presentation complete deck. Support your ideas and thought process with this prefabricated set. It includes a set of twelve slides, all fully modifiable and editable. Each slide can be restructured and induced with the information and content of your choice. You can add or remove large content boxes as well, to make this PPT slideshow more personalized. Its high-quality graphics and visuals help in presenting a well-coordinated pitch. This PPT template is also a resourceful tool to take visual cues from and implement the best ideas to help your business grow and expand. The main attraction of this well-formulated deck is that everything is editable, giving you the freedom to adjust it to your liking and choice. Changes can be made in the background and theme as well to deliver an outstanding pitch. Therefore, click on the download button now to gain full access to this multifunctional set.
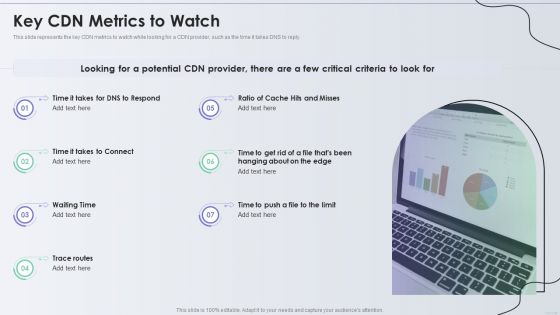
Distribution Network Key CDN Metrics To Watch Themes PDF
This slide represents the key CDN metrics to watch while looking for a CDN provider, such as the time it takes DNS to reply. Presenting Distribution Network Key CDN Metrics To Watch Themes PDF to provide visual cues and insights. Share and navigate important information on seven stages that need your due attention. This template can be used to pitch topics like Key Cdn Metrics, Potential. In addtion, this PPT design contains high resolution images, graphics, etc, that are easily editable and available for immediate download.
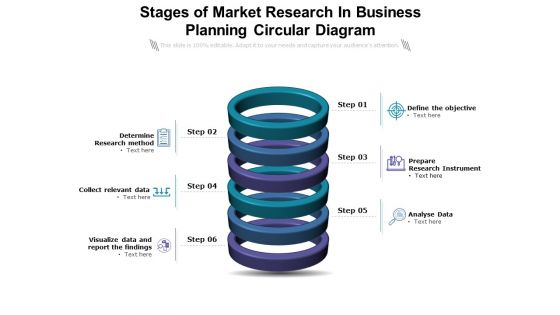
Stages Of Market Research In Business Planning Circular Diagram Ppt PowerPoint Presentation Styles Gridlines PDF
Presenting this set of slides with name stages of market research in business planning circular diagram ppt powerpoint presentation styles gridlines pdf. This is a six stage process. The stages in this process are determine research method, collect relevant data, visualize data and report the findings, define the objective, prepare research instrument, analyse data. This is a completely editable PowerPoint presentation and is available for immediate download. Download now and impress your audience.
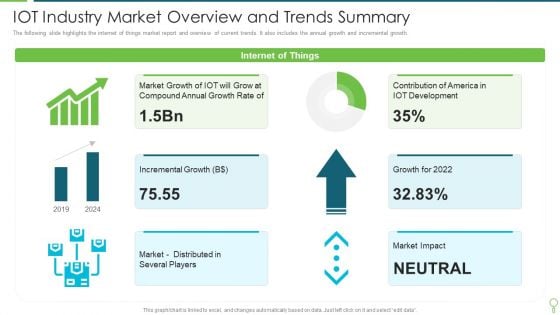
IOT Industry Market Overview And Trends Summary Brochure PDF
The following slide highlights the internet of things market report and overview of current trends. It also includes the annual growth and incremental growth. Showcasing this set of slides titled IOT Industry Market Overview And Trends Summary Brochure PDF. The topics addressed in these templates are Growth, Market, Development. All the content presented in this PPT design is completely editable. Download it and make adjustments in color, background, font etc. as per your unique business setting.
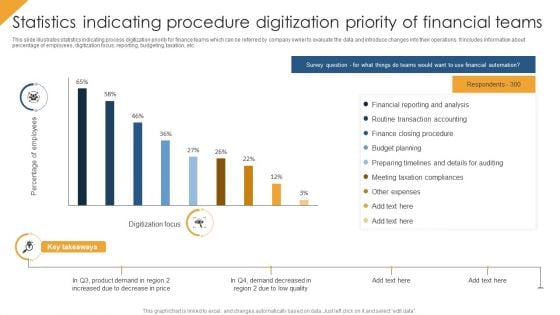
Statistics Indicating Procedure Digitization Priority Of Financial Teams Themes PDF
This slide illustrates statistics indicating process digitization priority for finance teams which can be referred by company owner to evaluate the data and introduce changes into their operations. It includes information about percentage of employees, digitization focus, reporting, budgeting, taxation, etc. Showcasing this set of slides titled Statistics Indicating Procedure Digitization Priority Of Financial Teams Themes PDF. The topics addressed in these templates are Budget Planning, Financial Reporting And Analysis, Other Expenses. All the content presented in this PPT design is completely editable. Download it and make adjustments in color, background, font etc. as per your unique business setting.
Input Process Output Chart For Analyzing And Collecting Data Download PDF
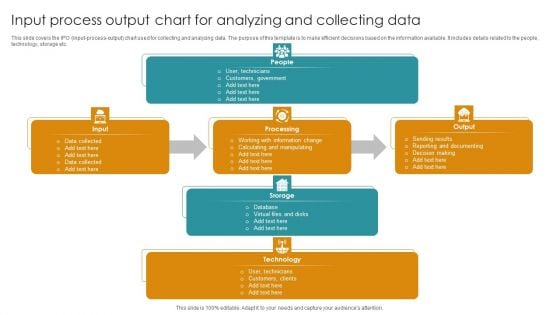
This slide covers the IPO input-process-output chart used for collecting and analyzing data. The purpose of this template is to make efficient decisions based on the information available. It includes details related to the people, technology, storage etc. Showcasing this set of slides titled Input Process Output Chart For Analyzing And Collecting Data Download PDF. The topics addressed in these templates are People, Storage, Technology. All the content presented in this PPT design is completely editable. Download it and make adjustments in color, background, font etc. as per your unique business setting.
Business Audit Committee Workflow Chart Ppt PowerPoint Presentation Gallery Graphics Example PDF
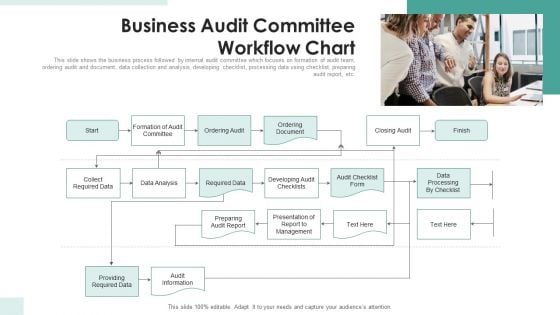
This slide shows the business process followed by internal audit committee which focuses on formation of audit team, ordering audit and document, data collection and analysis, developing checklist, processing data using checklist, preparing audit report, etc. Persuade your audience using this business audit committee workflow chart ppt powerpoint presentation gallery graphics example pdf. This PPT design covers one stages, thus making it a great tool to use. It also caters to a variety of topics including data analysis, management, data processing. Download this PPT design now to present a convincing pitch that not only emphasizes the topic but also showcases your presentation skills.

Scorecard Table With Kpi PowerPoint Presentation Template
Brace Yourself, Arm Your Thoughts. Prepare For The Hustle With Our Scorecard Table With KPI PowerPoint Presentation Template Powerpoint Templates. Generate Ecstasy With Our Marketing Plan Powerpoint Templates. Your Thoughts Will Delight Your Audience.
New Trends In Project Management Powerpoint Templates
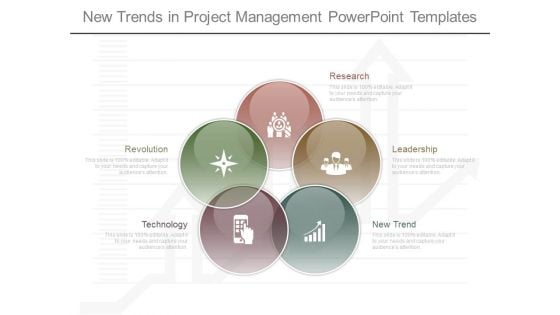
This is a new trends in project management powerpoint templates. This is a five stage process. The stages in this process are research, leadership, new trend, technology, revolution.
Sales Revenue Improvement Presentation Examples
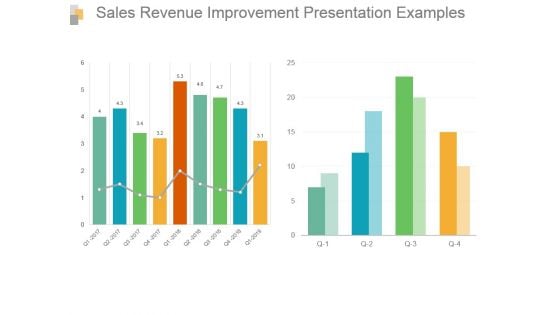
This is a sales revenue improvement presentation examples. This is a two stage process. The stages in this process are bar graph, growth, sales, data, analysis.
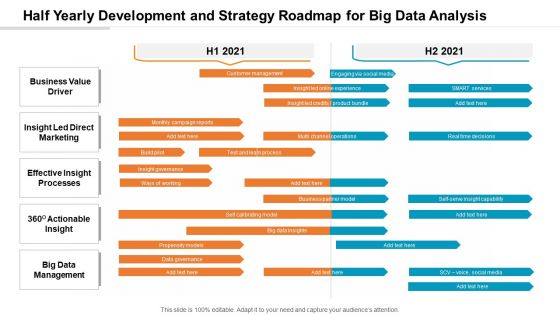
Half Yearly Development And Strategy Roadmap For Big Data Analysis Ideas
Presenting our innovatively-structured half yearly development and strategy roadmap for big data analysis ideas Template. Showcase your roadmap process in different formats like PDF, PNG, and JPG by clicking the download button below. This PPT design is available in both Standard Screen and Widescreen aspect ratios. It can also be easily personalized and presented with modified font size, font type, color, and shapes to measure your progress in a clear way.
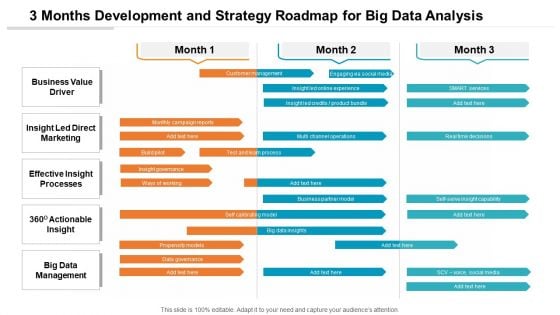
3 Months Development And Strategy Roadmap For Big Data Analysis Background
Presenting our innovatively-structured 3 months development and strategy roadmap for big data analysis background Template. Showcase your roadmap process in different formats like PDF, PNG, and JPG by clicking the download button below. This PPT design is available in both Standard Screen and Widescreen aspect ratios. It can also be easily personalized and presented with modified font size, font type, color, and shapes to measure your progress in a clear way.
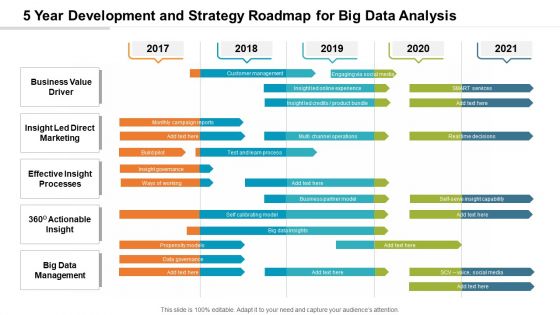
5 Year Development And Strategy Roadmap For Big Data Analysis Elements
Presenting our innovatively-structured 5 year development and strategy roadmap for big data analysis elements Template. Showcase your roadmap process in different formats like PDF, PNG, and JPG by clicking the download button below. This PPT design is available in both Standard Screen and Widescreen aspect ratios. It can also be easily personalized and presented with modified font size, font type, color, and shapes to measure your progress in a clear way.
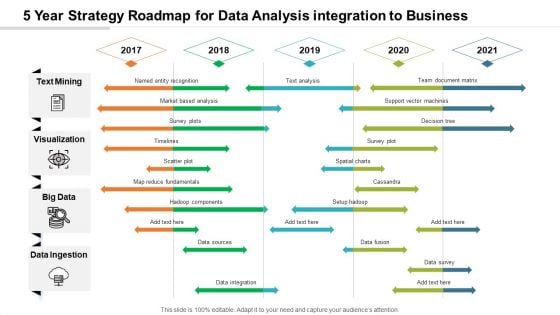
5 Year Strategy Roadmap For Data Analysis Integration To Business Pictures
Introducing our 5 year strategy roadmap for data analysis integration to business pictures. This PPT presentation is Google Slides compatible, therefore, you can share it easily with the collaborators for measuring the progress. Also, the presentation is available in both standard screen and widescreen aspect ratios. So edit the template design by modifying the font size, font type, color, and shapes as per your requirements. As this PPT design is fully editable it can be presented in PDF, JPG and PNG formats.
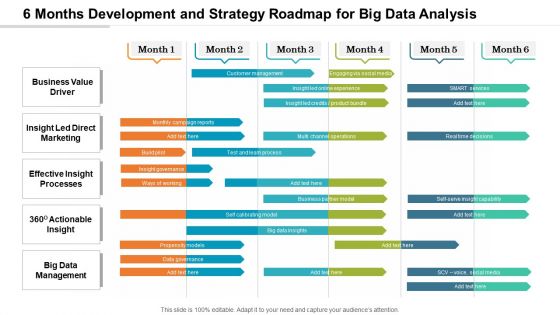
6 Months Development And Strategy Roadmap For Big Data Analysis Graphics
Presenting our innovatively-structured 6 months development and strategy roadmap for big data analysis graphics Template. Showcase your roadmap process in different formats like PDF, PNG, and JPG by clicking the download button below. This PPT design is available in both Standard Screen and Widescreen aspect ratios. It can also be easily personalized and presented with modified font size, font type, color, and shapes to measure your progress in a clear way.
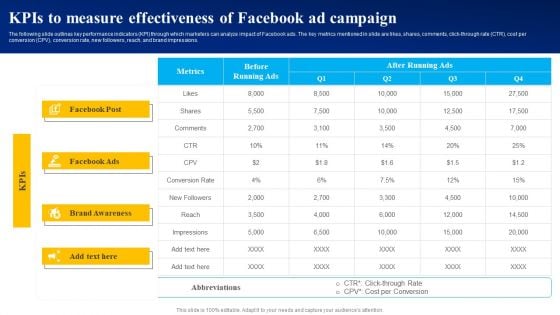
Kpis To Measure Effectiveness Of Facebook Ad Campaign Ppt PowerPoint Presentation File Diagrams PDF
The following slide outlines key performance indicators KPI through which marketers can analyze impact of Facebook ads. The key metrics mentioned in slide are likes, shares, comments, click-through rate CTR, cost per conversion CPV, conversion rate, new followers, reach, and brand impressions. Do you have to make sure that everyone on your team knows about any specific topic I yes, then you should give Kpis To Measure Effectiveness Of Facebook Ad Campaign Ppt PowerPoint Presentation File Diagrams PDF a try. Our experts have put a lot of knowledge and effort into creating this impeccable Kpis To Measure Effectiveness Of Facebook Ad Campaign Ppt PowerPoint Presentation File Diagrams PDF. You can use this template for your upcoming presentations, as the slides are perfect to represent even the tiniest detail. You can download these templates from the Slidegeeks website and these are easy to edit. So grab these today.
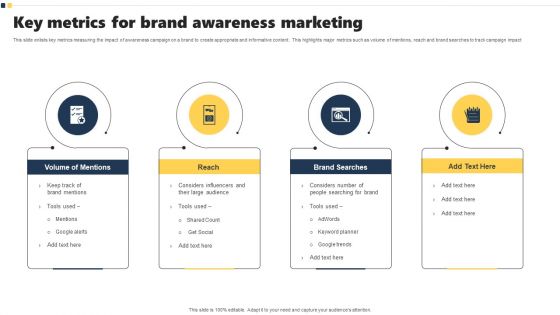
Key Metrics For Brand Awareness Marketing Diagrams PDF
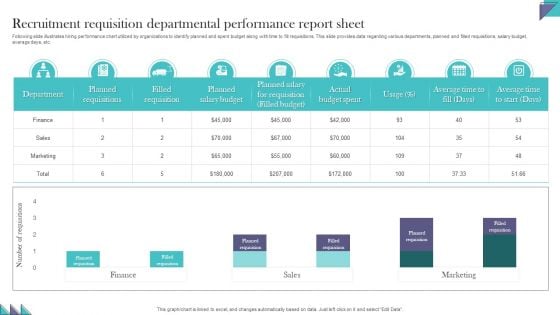
Recruitment Requisition Departmental Performance Report Sheet Demonstration PDF
Following slide illustrates hiring performance chart utilized by organizations to identify planned and spent budget along with time to fill requisitions. This slide provides data regarding various departments, planned and filled requisitions, salary budget, average days, etc. Pitch your topic with ease and precision using this Recruitment Requisition Departmental Performance Report Sheet Demonstration PDF. This layout presents information on Recruitment Requisition, Departmental Performance, Report Sheet. It is also available for immediate download and adjustment. So, changes can be made in the color, design, graphics or any other component to create a unique layout.
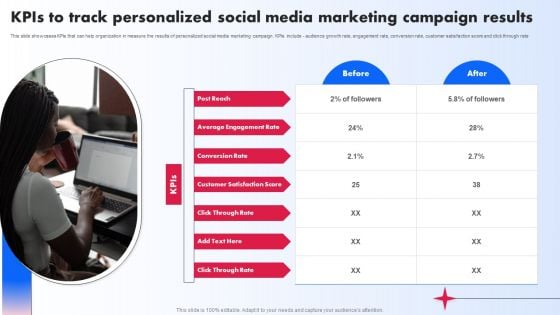
Kpis To Track Personalized Social Media Marketing Campaign Results Ppt PowerPoint Presentation Diagram Images PDF
This slide showcases KPIs that can help organization in measure the results of personalized social media marketing campaign. KPIs include audience growth rate, engagement rate, conversion rate, customer satisfaction score and click through rate. The Kpis To Track Personalized Social Media Marketing Campaign Results Ppt PowerPoint Presentation Diagram Images PDF is a compilation of the most recent design trends as a series of slides. It is suitable for any subject or industry presentation, containing attractive visuals and photo spots for businesses to clearly express their messages. This template contains a variety of slides for the user to input data, such as structures to contrast two elements, bullet points, and slides for written information. Slidegeeks is prepared to create an impression.
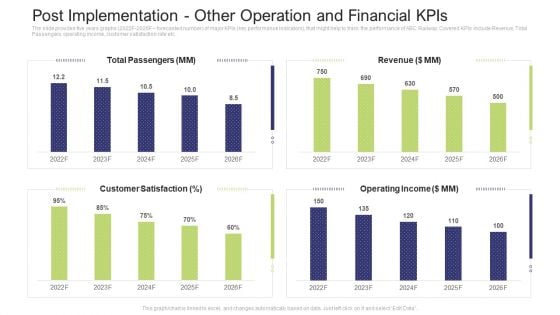
Post Implementation Other Operation And Financial Kpis Summary PDF
The slide provides five years graphs 2022F to 2026F forecasted number of major KPIs key performance indicators, that might help to track the performance of ABC Railway. Covered KPIs include Revenue, Total Passengers, operating income, customer satisfaction rate etc.Deliver and pitch your topic in the best possible manner with this post implementation other operation and financial KPIs summary pdf. Use them to share invaluable insights on total passengers, operating income, revenue, 2022 to 2026 and impress your audience. This template can be altered and modified as per your expectations. So, grab it now.
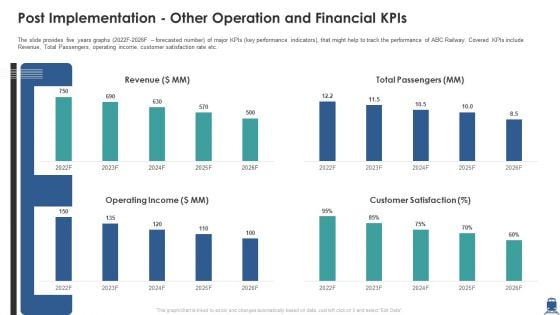
Post Implementation Other Operation And Financial Kpis Inspiration PDF
The slide provides five years graphs 2022F-2026F forecasted number of major KPIs key performance indicators, that might help to track the performance of ABC Railway. Covered KPIs include Revenue, Total Passengers, operating income, customer satisfaction rate etc. Deliver and pitch your topic in the best possible manner with this post implementation other operation and financial kpis inspiration pdf. Use them to share invaluable insights on revenue, operating income, customer satisfaction and impress your audience. This template can be altered and modified as per your expectations. So, grab it now.
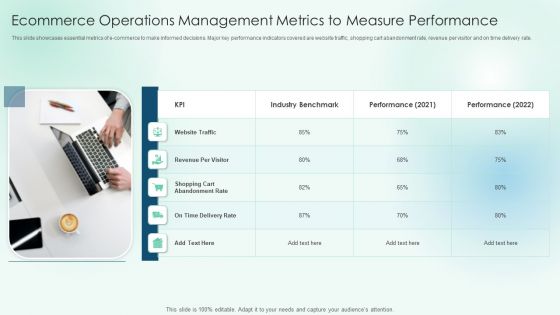
Ecommerce Operations Management Metrics To Measure Performance Professional PDF
This slide showcases essential metrics of e-commerce to make informed decisions. Major key performance indicators covered are website traffic, shopping cart abandonment rate, revenue per visitor and on time delivery rate. Presenting Ecommerce Operations Management Metrics To Measure Performance Professional PDF to dispense important information. This template comprises one stage. It also presents valuable insights into the topics including Abandonment Rate, Industry Benchmark, Performance. This is a completely customizable PowerPoint theme that can be put to use immediately. So, download it and address the topic impactfully.
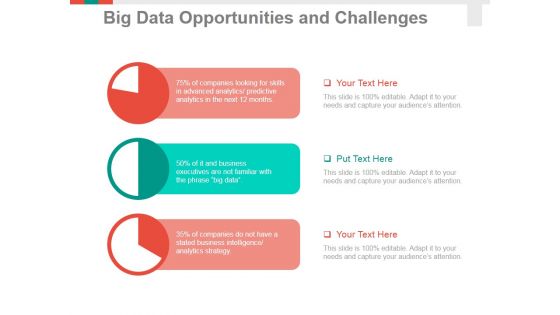
Big Data Opportunities And Challenges Template 1 Ppt PowerPoint Presentation Infographic Template Summary
This is a big data opportunities and challenges template 1 ppt powerpoint presentation infographic template summary. This is a three stage process. The stages in this process are business, pie chart, finance, marketing, analysis, strategy.
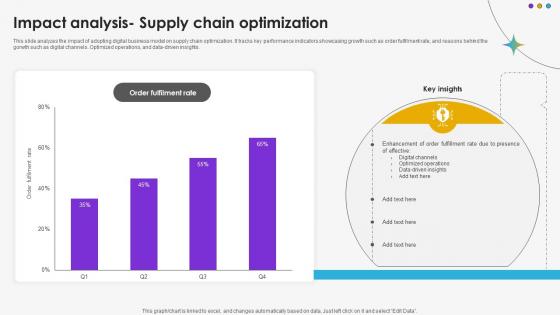
Impact Analysis Supply Chain Optimization DT SS V
This slide analyzes the impact of adopting digital business model on supply chain optimization. It tracks key performance indicators showcasing growth such as order fulfilment rate, and reasons behind the gorwth such as digital channels. Optimized operations, and data-driven insights.Whether you have daily or monthly meetings, a brilliant presentation is necessary. Impact Analysis Supply Chain Optimization DT SS V can be your best option for delivering a presentation. Represent everything in detail using Impact Analysis Supply Chain Optimization DT SS V and make yourself stand out in meetings. The template is versatile and follows a structure that will cater to your requirements. All the templates prepared by Slidegeeks are easy to download and edit. Our research experts have taken care of the corporate themes as well. So, give it a try and see the results. This slide analyzes the impact of adopting digital business model on supply chain optimization. It tracks key performance indicators showcasing growth such as order fulfilment rate, and reasons behind the gorwth such as digital channels. Optimized operations, and data-driven insights.
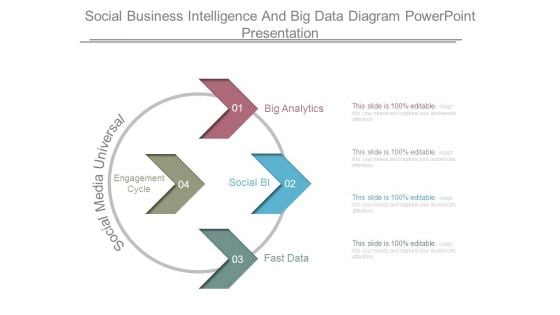
Social Business Intelligence And Big Data Diagram Powerpoint Presentation
This is a social business intelligence and big data diagram powerpoint presentation. This is a four stage process. The stages in this process are big analytics, social bi, fast data, social media universal, engagement cycle.

 Home
Home