Dashboard Stock Market
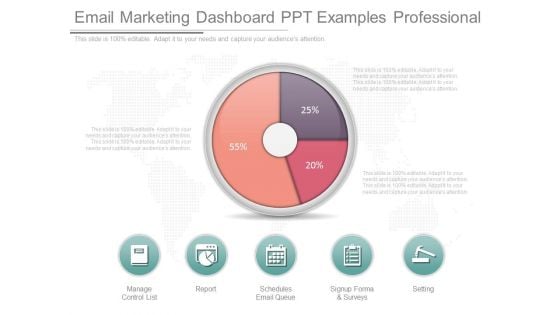
Email Marketing Dashboard Ppt Examples Professional
This is a email marketing dashboard ppt examples professional. This is a three stage process. The stages in this process are manage control list, report, schedules email queue, signup forma and surveys, setting.
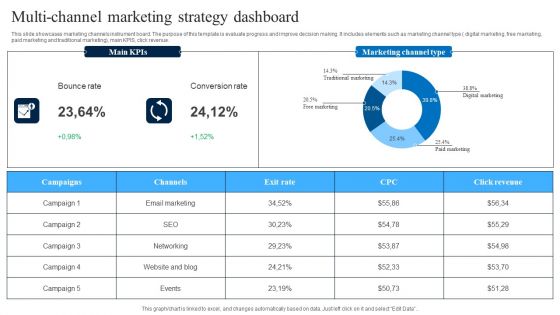
Multi Channel Marketing Strategy Dashboard Slides PDF
This slide showcases marketing channels instrument board. The purpose of this template is evaluate progress and improve decision making. It includes elements such as marketing channel type digital marketing, free marketing, paid marketing and traditional marketing, main KPIS, click revenue. Pitch your topic with ease and precision using this Multi Channel Marketing Strategy Dashboard Slides PDF. This layout presents information on Bounce Rate, Conversion Rate, Marketing Channel Type. It is also available for immediate download and adjustment. So, changes can be made in the color, design, graphics or any other component to create a unique layout.
Stock Market Research Report Ppt PowerPoint Presentation Complete Deck With Slides
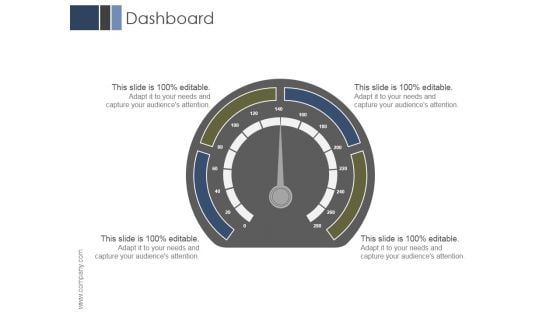
Dashboard Ppt PowerPoint Presentation Graphics
This is a dashboard ppt powerpoint presentation graphics. This is a four stage process. The stages in this process are business, marketing, management, dashboard, analysis.
Dashboard Ppt PowerPoint Presentation Portfolio
This is a dashboard ppt powerpoint presentation portfolio. This is a four stage process. The stages in this process are business, marketing, management, dashboard, finance.
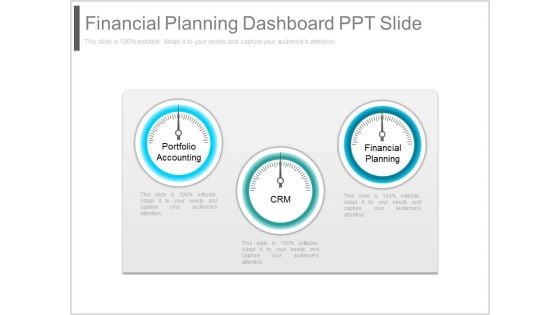
Financial Planning Dashboard Ppt Slide
This is a financial planning dashboard ppt slide. This is a three stage process. The stages in this process are portfolio accounting, crm, financial planning.
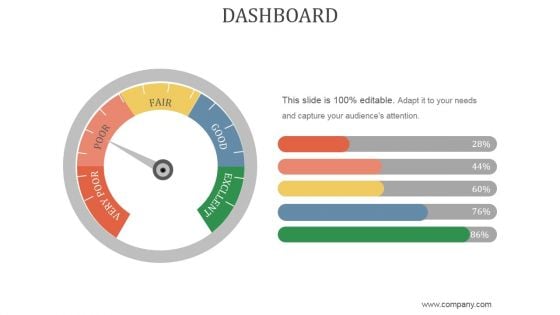
Dashboard Ppt PowerPoint Presentation Shapes
This is a dashboard ppt powerpoint presentation shapes. This is a five stage process. The stages in this process are very poor, poor, fair, good, excllent.

Financial Dashboard Examples Ppt Templates
This is a financial dashboard examples ppt templates. This is a four stage process. The stages in this process are income distribution, cogs distributions, expense distributions, profit and loss.
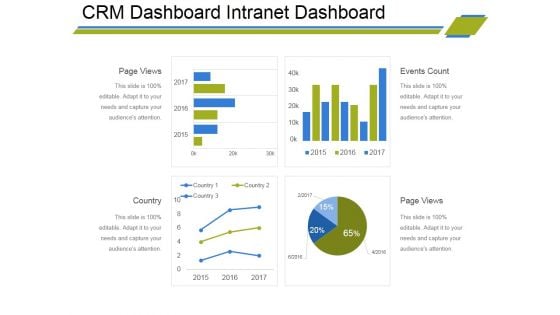
Crm Dashboard Intranet Dashboard Ppt PowerPoint Presentation Ideas Images
This is a crm dashboard intranet dashboard ppt powerpoint presentation ideas images. This is a four stage process. The stages in this process are page views, country, page views, events count.
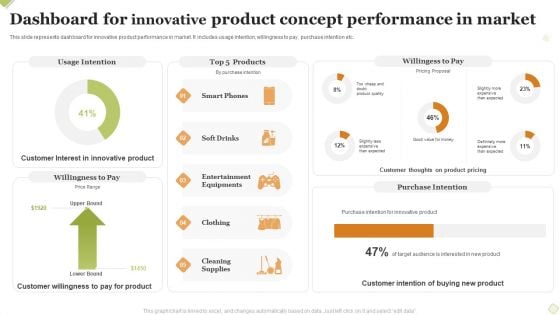
Dashboard For Innovative Product Concept Performance In Market Formats PDF
This slide represents dashboard for innovative product performance in market. It includes usage intention, willingness to pay, purchase intention etc. Pitch your topic with ease and precision using this Dashboard For Innovative Product Concept Performance In Market Formats PDF This layout presents information on Usage Intention, Willingess To Pay, Purchase Intention . It is also available for immediate download and adjustment. So, changes can be made in the color, design, graphics or any other component to create a unique layout.
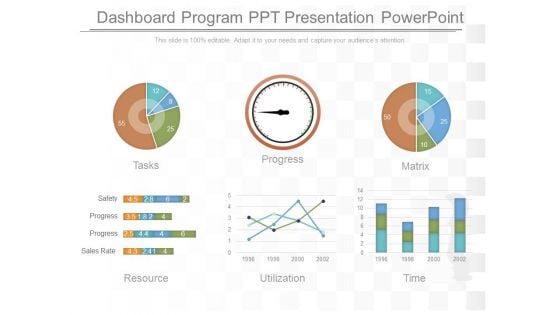
Dashboard Program Ppt Presentation Powerpoint
This is a dashboard program ppt presentation powerpoint. This is a six stage process. The stages in this process are tasks, progress, matrix, resource, utilization, time, safety, progress, sales rate.
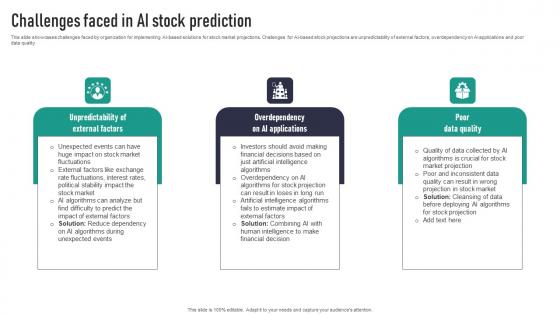
Challenges Faced In AI Stock Prediction Clipart Pdf
This slide showcases challenges faced by organization for implementing AI-based solutions for stock market projections. Challenges for AI-based stock projections are unpredictability of external factors, overdependency on AI applications and poor data quality. If your project calls for a presentation, then Slidegeeks is your go-to partner because we have professionally designed, easy-to-edit templates that are perfect for any presentation. After downloading, you can easily edit Challenges Faced In AI Stock Prediction Clipart Pdf and make the changes accordingly. You can rearrange slides or fill them with different images. Check out all the handy templates This slide showcases challenges faced by organization for implementing AI-based solutions for stock market projections. Challenges for AI-based stock projections are unpredictability of external factors, overdependency on AI applications and poor data quality.
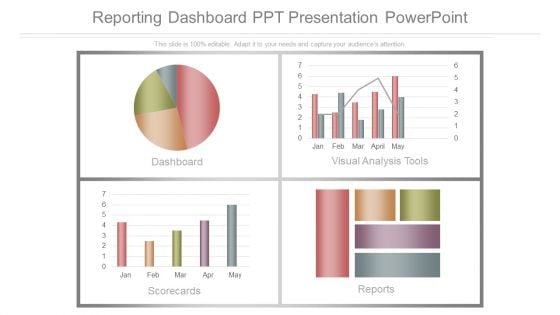
Reporting Dashboard Ppt Presentation Powerpoint
This is a reporting dashboard ppt presentation powerpoint. This is a four stage process. The stages in this process are dashboard, visual analysis tools, scorecards, reports.
Dashboard Ppt PowerPoint Presentation Infographics
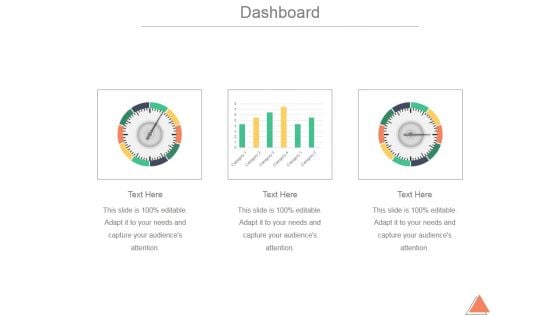
This is a dashboard ppt powerpoint presentation infographics. This is a three stage process. The stages in this process are business, marketing, dashboard, analysis, finance.
Corporate Dashboard Template Presentation Portfolio
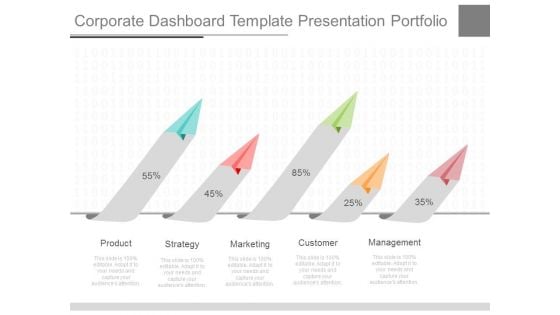
This is a corporate dashboard template presentation portfolio. This is a five stage process. The stages in this process are product, strategy, marketing, customer, management.
Dashboard Analytics Diagram Presentation Powerpoint
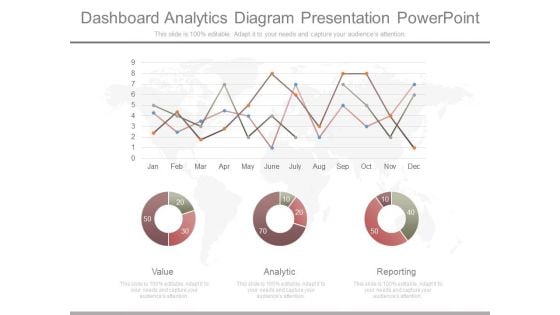
This is a dashboard analytics diagram presentation powerpoint. This is a three stage process. The stages in this process are value, analytic, reporting.
Dashboard Visualization Ppt Presentation Powerpoint
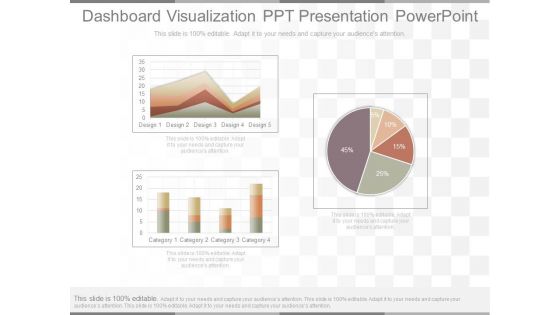
This is a dashboard visualization ppt presentation powerpoint. This is a three stage process. The stages in this process are design, category.
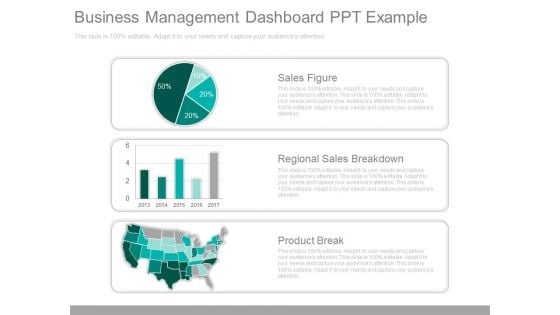
Business Management Dashboard Ppt Example
This is a business management dashboard ppt example. This is a three stage process. The stages in this process are sales figure, regional sales breakdown, product break.
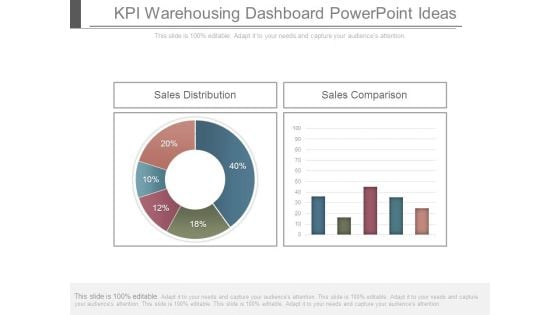
Kpi Warehousing Dashboard Powerpoint Ideas
This is a kpi warehousing dashboard powerpoint ideas. This is a two stage process. The stages in this process are sales distribution, sales comparison.
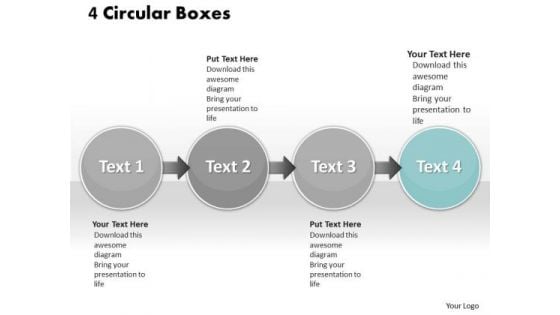
Ppt Four Interconnected Stock Exchange Text Circles PowerPoint Templates
PPT four interconnected stock exchange text circles PowerPoint Templates-Use this graphical approach to represent global business issues such as financial data, stock market Exchange, increase in sales, corporate presentations and more. It Signifies common, comprehensive, extensive, global, international, multinational, omnipresent, planetary, ubiquitous, universal etc.-PPT four interconnected stock exchange text circles PowerPoint Templates-Analysis, Arrow, Background, Backlink, Circle, Code, Content, Diagram, Engine, Illustration, Keyword, Optimization, Offpage, Process, Search, Template, Tracking, Unpage, Violet, Visitor, Become the crowd favourite with our Ppt Four Interconnected Stock Exchange Text Circles PowerPoint Templates. Get them all clamouring for you.

Dashboard Report Ppt Powerpoint Ideas
This is a dashboard report ppt powerpoint ideas. This is a six stage process. The stages in this process are sales vs quotes, target for week, the sales, inventory, revenue.
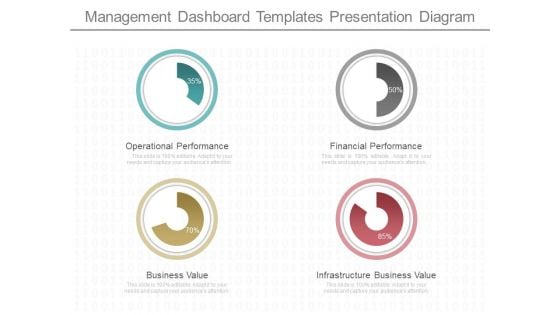
Management Dashboard Templates Presentation Diagram
This is a management dashboard templates presentation diagram. This is a four stage process. The stages in this process are operational performance, business value, financial performance, infrastructure business value.
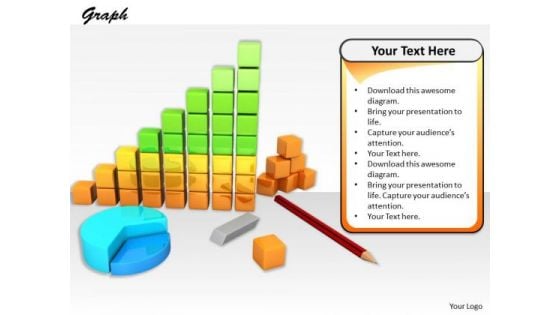
Stock Photo Design Of Business Reports And Charts PowerPoint Slide
This image slide has been professionally designed to give complete look to your business presentations. This image is designed with graphics of business reports and charts. Use this image in marketing and sales related presentations.
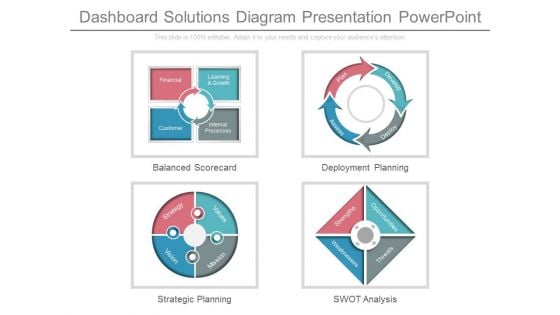
Dashboard Solutions Diagram Presentation Powerpoint
This is a dashboard solutions diagram presentation powerpoint. This is a four stage process. The stages in this process are financial, learning and growth, customer, internal processes, balanced scorecard, values, mission, strategy, vision, strategic planning, plan, develop, assess, deploy, deployment planning, strengths, opportunities, weaknesses, threats, swot analysis.
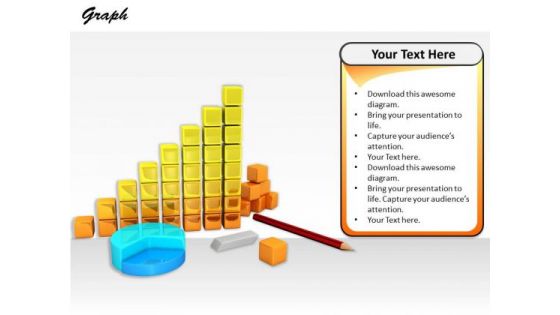
Stock Photo Illustration Of Business Reports And Diagrams PowerPoint Slide
The above slide displays image of business charts and reports. Use this professionally designed image to make your message to be spread in a more effective manner. This can add up spice to corporate displays.
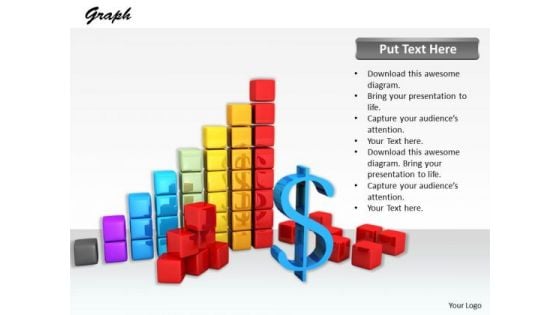
Stock Photo Design Of Financial Charts And Reports PowerPoint Slide
This image slide has been professionally designed to give complete look to your business presentations. This image is designed with graphics of business reports and charts. Use this image in marketing and sales related presentations.
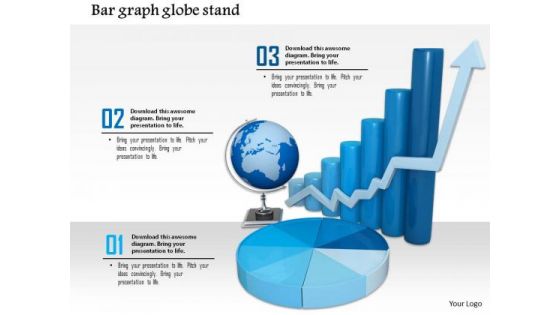
Stock Photo Graphics For Business Reports And Charts PowerPoint Slide
This image contains graphics of business reports and charts. Download this image for business and sales presentations where you have to focus on financial growth. Dazzle the audience with your thoughts.
Stock Photo Card Board Download Arrow Icon PowerPoint Slide
This image slide is designed with cardboard and download arrow. This image contains the graphic of download icon with cardboard depicting downloading and storage of data. Use this image to make outstanding presentations.
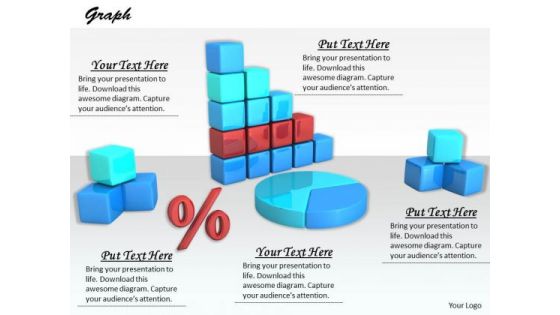
Stock Photo Graphics Of Business Reports And Charts PowerPoint Slide
The above slide displays an image of business charts and reports. Use this professionally designed image to make your message to be spread in a more effective manner. This can add up spice to corporate displays.
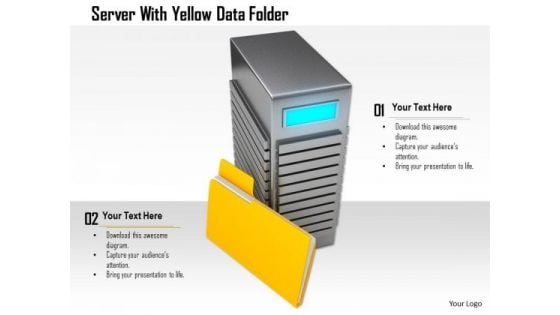
Stock Photo Server With Yellow Data Folder PowerPoint Slide
This image slide displays yellow folder with computer server for technology. This image slide has been designed with graphic of computer servers with yellow data folder on white background. Use this image, in your presentations to express views on client server, computing, data storage and backup. This image will enhance the quality of your presentations.
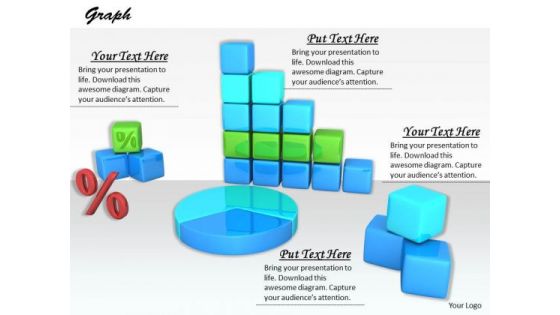
Stock Photo Design For Graphical Representations Of Data PowerPoint Slide
The above image contains a graphic of charts and graphs. Use this professional image in business or sales related presentations. It helps you to explain your plans in all earnest to your colleagues and raise the bar for all.
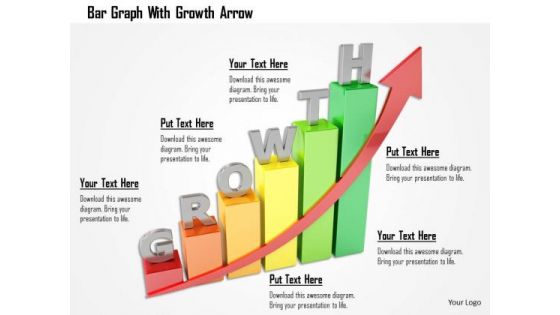
Stock Photo Bar Graph With Growth Arrow PowerPoint Slide
This creative image displays design of Bar Graph with Growth Arrow. This image has been designed to depict business on an Upward Trend. Create an impact with this quality image and make professional presentations.
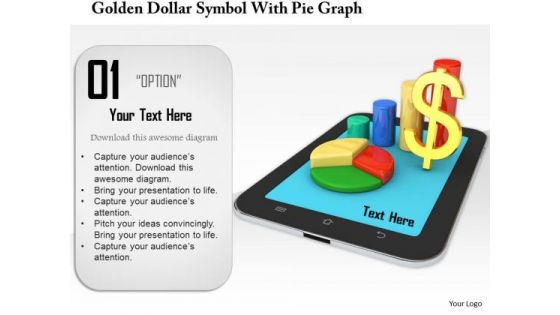
Stock Photo Golden Dollar Symbol With Pie Graph PowerPoint Slide
This Power Point template has been crafted with graphic of golden dollar symbol and pie chart on a tablet. Display the concept of financial data analysis with this image. Use this image to present financial reports in business presentations.

Stock Photo Books With Laptop For E Learning PowerPoint Slide
Our above image displays books moving towards laptop. This image display concept of data storage and technology. Above image provides the ideal backdrop to make attractive presentations.
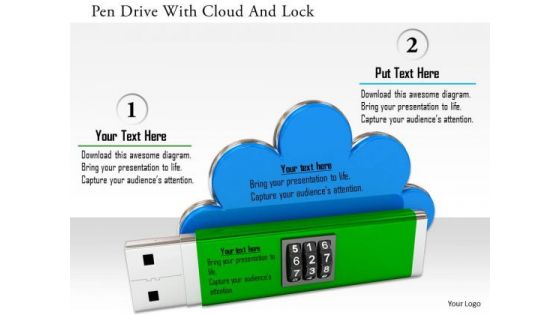
Stock Photo Pen Drive With Cloud And Lock PowerPoint Slide
Graphic of pen drive with cloud and lock has been used to craft this power point image template. This image contains the concept of data safety and cloud technology. Use this image for your data and cloud related topics in any presentation.
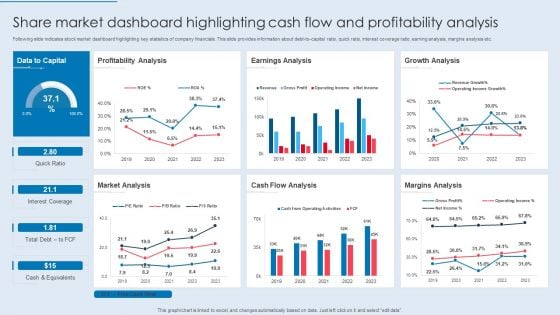
Share Market Dashboard Highlighting Cash Flow And Profitability Analysis Information PDF
Following slide indicates stock market dashboard highlighting key statistics of company financials. This slide provides information about debt-to-capital ratio, quick ratio, interest coverage ratio, earning analysis, margins analysis etc. Showcasing this set of slides titled Share Market Dashboard Highlighting Cash Flow And Profitability Analysis Information PDF. The topics addressed in these templates are Profitability Analysis, Earnings Analysis, Growth Analysis. All the content presented in this PPT design is completely editable. Download it and make adjustments in color, background, font etc. as per your unique business setting.
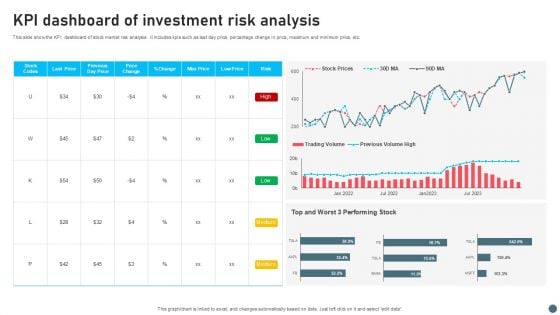
Kpi Dashboard Of Investment Risk Analysis Introduction PDF

Marketing Management Dashboard Marketing Ppt PowerPoint Presentation Slides Graphics
This is a marketing management dashboard marketing ppt powerpoint presentation slides graphics. This is a three stage process. The stages in this process are finance, marketing, management, investment, analysis.
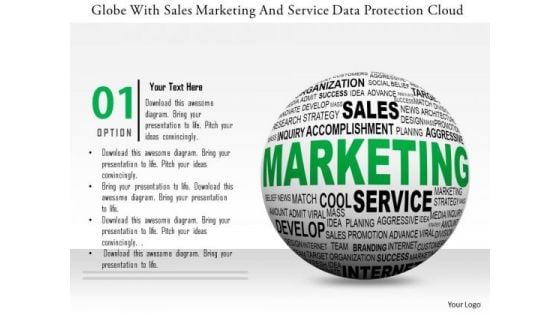
Stock Photo Globe With Sales Marketing And Service Data Protection Cloud PowerPoint Slide
This power point template has been designed with graphic of globe and cloud. This image template contains the concept of global sales and marketing service with cloud technology. Use this image template for global business related presentations.
Stock Market Upward Trends Graph With Dollar Sign And Arrow Up Ppt PowerPoint Presentation Professional Graphics Download
This is a stock market upward trends graph with dollar sign and arrow up ppt powerpoint presentation professional graphics download. This is a four stage process. The stages in this process are stock market, financial markets, bull market.
Stock Market Survey Reporting With Pie Chat And Bar Graph Ppt PowerPoint Presentation Infographic Template Example 2015
This is a stock market survey reporting with pie chat and bar graph ppt powerpoint presentation infographic template example 2015. This is a three stage process. The stages in this process are stock market, financial markets, bull market.
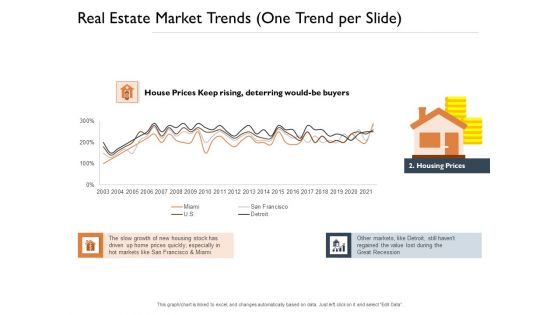
Freehold Property Business Plan Real Estate Market Trends One Trend Per Slide Stock Ppt PowerPoint Presentation Model Outline PDF
Presenting this set of slides with name freehold property business plan real estate market trends one trend per slide stock ppt powerpoint presentation model outline pdf. The topics discussed in these slides are growth, markets, prices. This is a completely editable PowerPoint presentation and is available for immediate download. Download now and impress your audience.
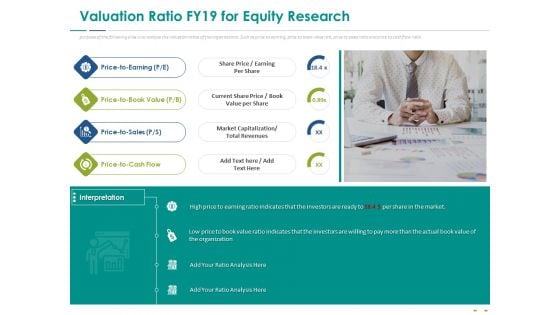
Stock Market Research Report Valuation Ratio FY19 For Equity Research Ppt PowerPoint Presentation Model Background Images PDF
The purpose of the following slide is to analyze the valuation ratios of the organizations. Such as price to earning, price to book value rati, price to sales ratio and price to cash flow ratio. Presenting stock market research report valuation ratio fy19 for equity research ppt powerpoint presentation model background images pdf to provide visual cues and insights. Share and navigate important information on four stages that need your due attention. This template can be used to pitch topics like rice to earning, price to book value, price to sale, price to cash flow. In addition, this PPT design contains high-resolution images, graphics, etc, that are easily editable and available for immediate download.
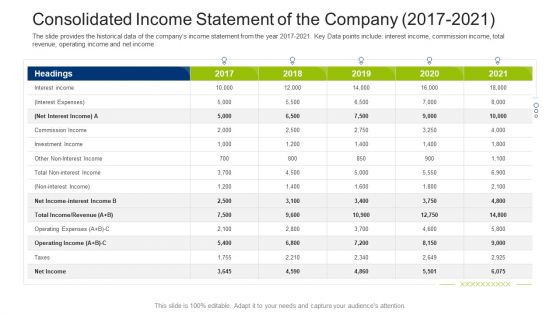
Investment Fundraising Pitch Deck From Stock Market Consolidated Income Statement Of The Company 2017 2021 Graphics PDF
The slide provides the historical data of the companys income statement from the year 2015-2021. Key Data points include interest income, commission income, total revenue, operating income and net income. Deliver an awe inspiring pitch with this creative investment fundraising pitch deck from stock market consolidated income statement of the company 2017 2021 graphics pdf bundle. Topics like interest income, operating income, investment income, commission income can be discussed with this completely editable template. It is available for immediate download depending on the needs and requirements of the user.
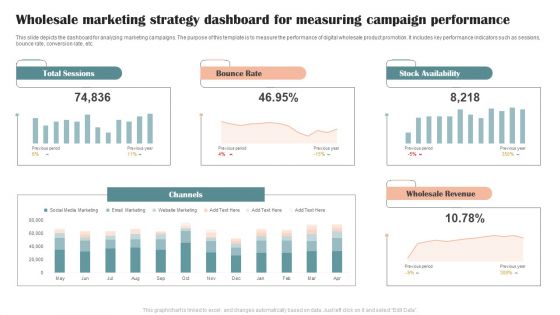
Wholesale Marketing Strategy Dashboard For Measuring Campaign Performance Graphics PDF
This slide depicts the dashboard for analyzing marketing campaigns. The purpose of this template is to measure the performance of digital wholesale product promotion. It includes key performance indicators such as sessions, bounce rate, conversion rate, etc. Showcasing this set of slides titled Wholesale Marketing Strategy Dashboard For Measuring Campaign Performance Graphics PDF. The topics addressed in these templates are Total Sessions, Bounce Rate, Stock Availability. All the content presented in this PPT design is completely editable. Download it and make adjustments in color, background, font etc. as per your unique business setting.
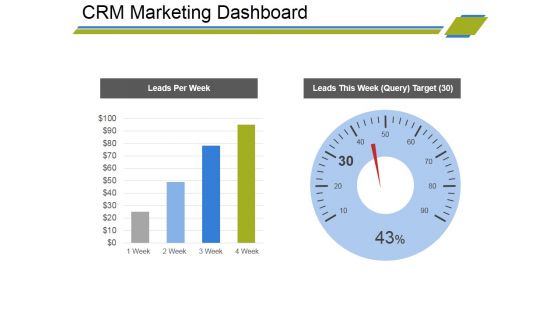
Crm Marketing Dashboard Ppt PowerPoint Presentation Gallery Tips
This is a crm marketing dashboard ppt powerpoint presentation gallery tips. This is a two stage process. The stages in this process are leads per week, leads this week.
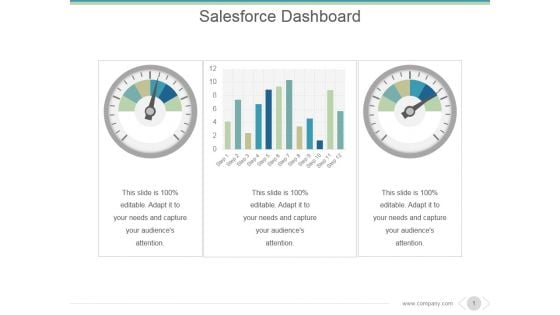
Salesforce Dashboard Ppt PowerPoint Presentation Summary
This is a salesforce dashboard ppt powerpoint presentation summary. This is a two stage process. The stages in this process are business, marketing, dashboard, graph, speedometer.
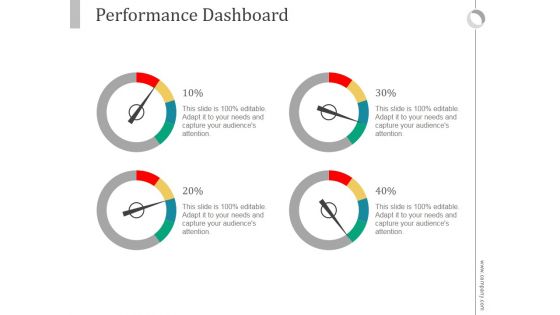
Performance Dashboard Ppt PowerPoint Presentation Background Image
This is a performance dashboard ppt powerpoint presentation background image. This is a four stage process. The stages in this process are business, marketing, management, dashboard, finance.
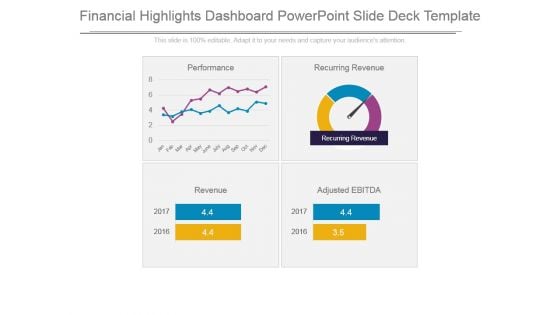
Financial Highlights Dashboard Powerpoint Slide Deck Template
This is a financial highlights dashboard powerpoint slide deck template. This is a four stage process. The stages in this process are recurring revenue, performance, revenue, adjusted ebitda.

Three Dashboard For Financial Reporting Ppt Summary
This is a three dashboard for financial reporting ppt summary. This is a three stage process. The stages in this process are business, marketing, speed, dashboard, meter.
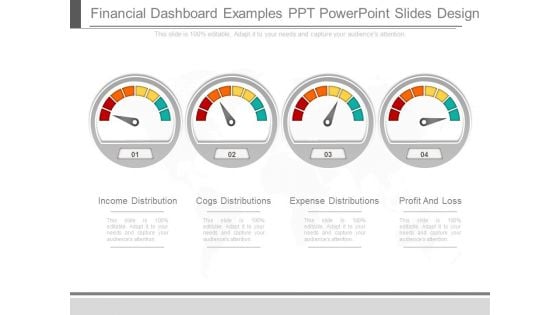
Financial Dashboard Examples Ppt Powerpoint Slides Design
This is a financial dashboard examples ppt powerpoint slides design. This is a four stage process. The stages in this process are income distribution, cogs distributions, expense distributions, profit and loss.
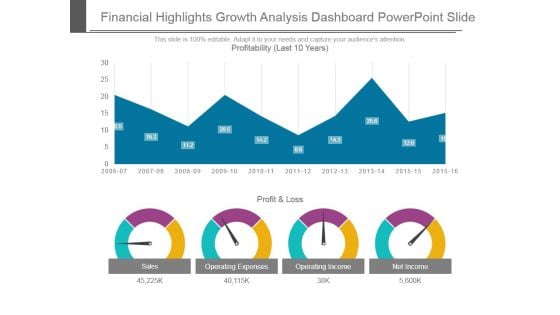
Financial Highlights Growth Analysis Dashboard Powerpoint Slide
This is a financial highlights growth analysis dashboard powerpoint slide. This is a four stage process. The stages in this process are profit and loss, sales, operating expenses, operating income, net income, profitability.
Crm Marketing Dashboard Ppt PowerPoint Presentation Icon Graphic Tips
This is a crm marketing dashboard ppt powerpoint presentation icon graphic tips. This is a two stage process. The stages in this process are leads per week, leads this week.
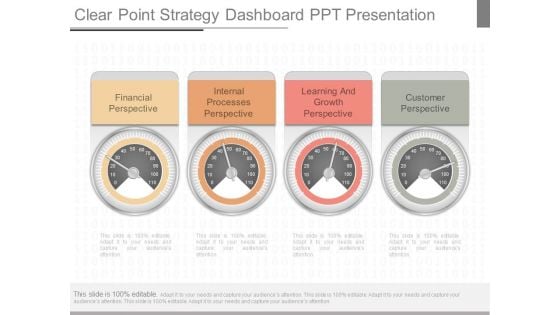
Clear Point Strategy Dashboard Ppt Presentation
This is a clear point strategy dashboard ppt presentation. This is a four stage process. The stages in this process are financial perspective, internal processes perspective, learning and growth perspective, customer perspective.
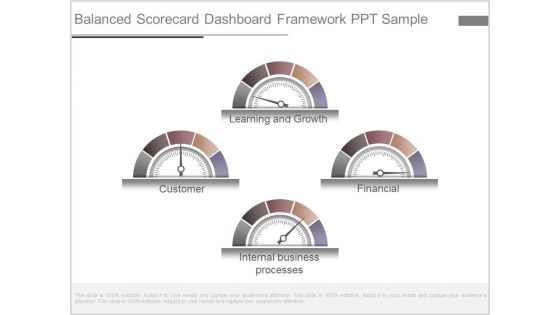
Balanced Scorecard Dashboard Framework Ppt Sample
This is a balanced scorecard dashboard framework ppt sample. This is a four stage process. The stages in this process are learning and growth, financial, internal business processes, customer.
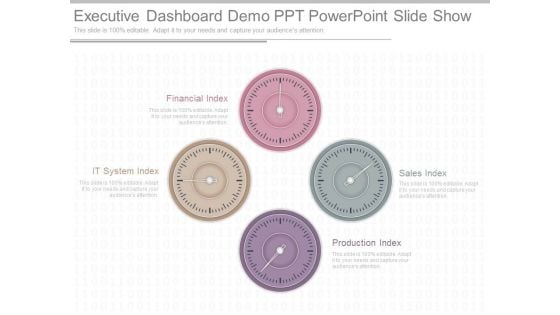
Executive Dashboard Demo Ppt Powerpoint Slide Show
This is a executive dashboard demo ppt powerpoint slide show. This is a four stage process. The stages in this process are financial index, it system index, production index, sales index.
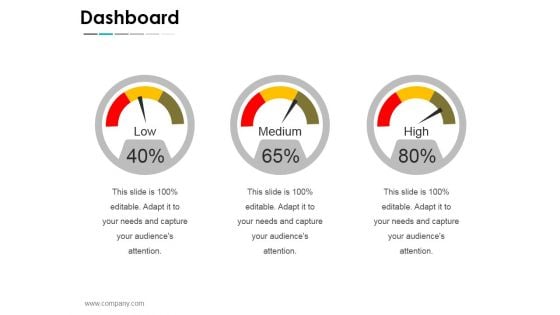
Dashboard Ppt PowerPoint Presentation Layouts Graphics Pictures
This is a dashboard ppt powerpoint presentation layouts graphics pictures. This is a three stage process. The stages in this process are business, strategy, analysis, planning, dashboard.
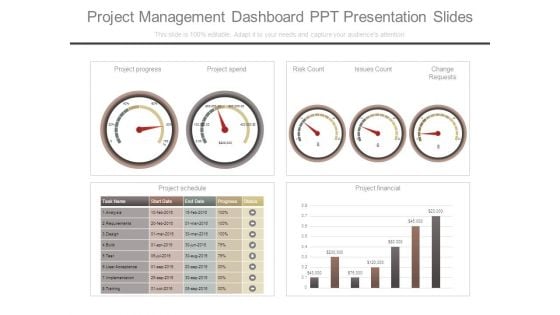
Project Management Dashboard Ppt Presentation Slides
This is a project management dashboard ppt presentation slides. This is a four stage process. The stages in this process are project progress, project spend, risk count, issues count, change requests, project schedule, project financial, task name, start date, end date, progress, status, analysis, requirements, design, build, test, user acceptance, implementation, training.
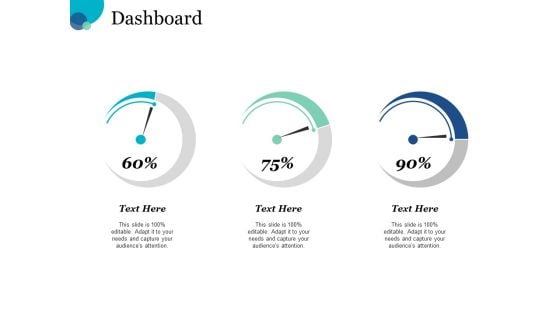
Dashboard Financial Ppt PowerPoint Presentation File Gridlines
This is a dashboard financial ppt powerpoint presentation file gridlines. This is a three stage process. The stages in this process are business, management, planning, strategy, marketing.
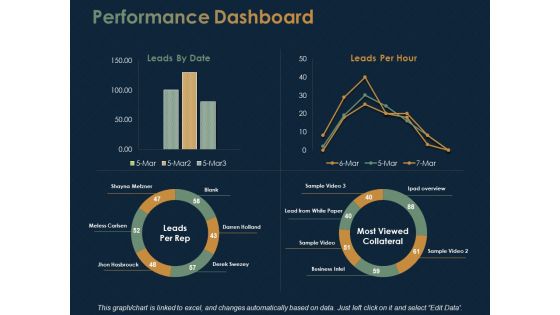
Performance Dashboard Marketing Ppt PowerPoint Presentation Show Microsoft
This is a performance dashboard marketing ppt powerpoint presentation show microsoft. This is a four stage process. The stages in this process are finance, marketing, analysis, business, investment.


 Continue with Email

 Home
Home


