Dashboard Stock Market
Consumer Lead Generation Process Enhanced Lead Performance Tracking Dashboard Portrait PDF
This slide covers the KPI dashboard for tracking improved lead management system performance. It includes metrics such as visitors, social media followers, email subscribers, organic leads, etc. Slidegeeks is here to make your presentations a breeze with Consumer Lead Generation Process Enhanced Lead Performance Tracking Dashboard Portrait PDF With our easy-to-use and customizable templates, you can focus on delivering your ideas rather than worrying about formatting. With a variety of designs to choose from, youre sure to find one that suits your needs. And with animations and unique photos, illustrations, and fonts, you can make your presentation pop. So whether youre giving a sales pitch or presenting to the board, make sure to check out Slidegeeks first.
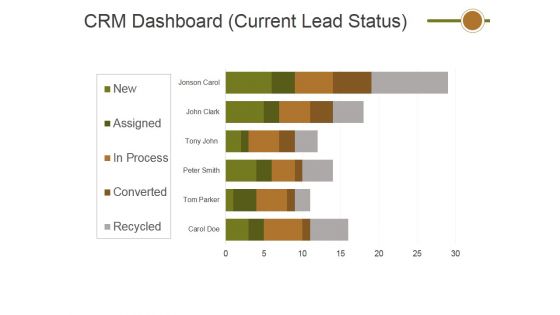
Crm Dashboard Current Lead Status Ppt PowerPoint Presentation Show Slide Portrait
This is a crm dashboard current lead status ppt powerpoint presentation show slide portrait. This is a six stage process. The stages in this process are crm dashboard, current lead status, business, marketing.
Optimizing AI Strategies To Improve Financial Services Digital Media Tracking Dashboard Professional PDF
This slide covers the digital marketing dashboard along with the lead breakdown, google analytics traffic, and social media channels. Do you know about Slidesgeeks Optimizing AI Strategies To Improve Financial Services Digital Media Tracking Dashboard Professional PDF These are perfect for delivering any kind od presentation. Using it, create PowerPoint presentations that communicate your ideas and engage audiences. Save time and effort by using our pre designed presentation templates that are perfect for a wide range of topic. Our vast selection of designs covers a range of styles, from creative to business, and are all highly customizable and easy to edit. Download as a PowerPoint template or use them as Google Slides themes.
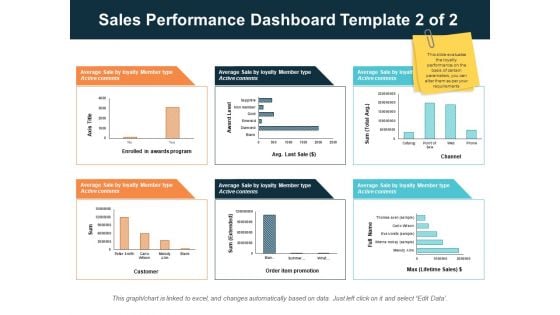
Sales Performance Dashboard Template 2 Of 2 Ppt PowerPoint Presentation Infographics Design Inspiration
This is a sales performance dashboard template 2 of 2 ppt powerpoint presentation infographics design inspiration. This is a three stage process. The stages in this process are finance, management, strategy, analysis, marketing.
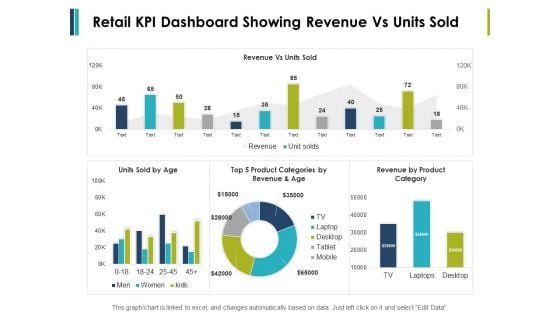
Retail Kpi Dashboard Showing Revenue Vs Units Sold Ppt PowerPoint Presentation File Formats
This is a retail kpi dashboard showing revenue vs units sold ppt powerpoint presentation file formats. This is a three stage process. The stages in this process are finance, marketing, management, investment, analysis.
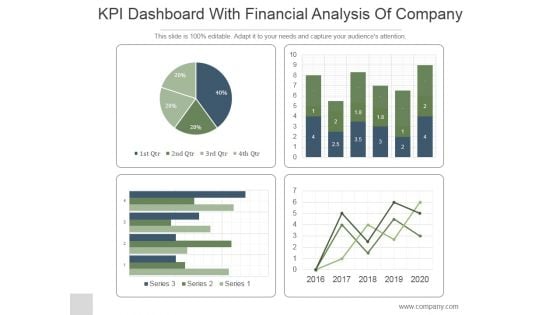
KPI Dashboard With Financial Analysis Of Company Ppt PowerPoint Presentation Backgrounds
This is a kpi dashboard with financial analysis of company ppt powerpoint presentation backgrounds. This is a four stage process. The stages in this process are business, strategy, marketing, line graph, finance.

Retail KPI Dashboard Showing Revenue Vs Units Sold Ppt PowerPoint Presentation Professional Smartart
This is a retail kpi dashboard showing revenue vs units sold ppt powerpoint presentation professional smartart. This is a four stage process. The stages in this process are finance, analysis, business, investment, marketing.
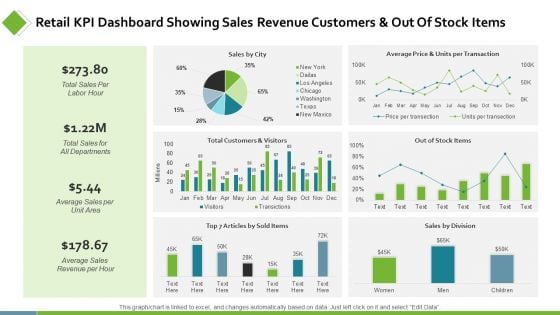
Retail KPI Dashboard Showing Sales Revenue Customers Ppt PowerPoint Presentation Show Background Designs
This is a retail kpi dashboard showing sales revenue customers ppt powerpoint presentation show background designs. This is a six stage process. The stages in this process are finance, analysis, business, investment, marketing.
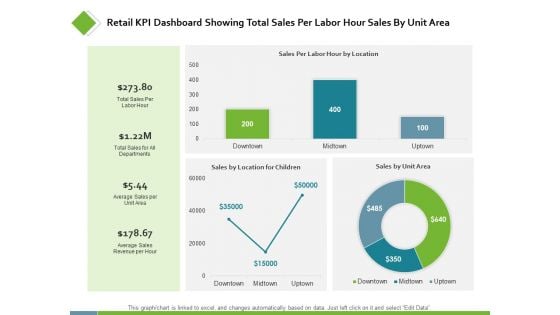
Retail KPI Dashboard Showing Total Sales Per Labor Ppt PowerPoint Presentation Styles Examples
This is a retail kpi dashboard showing total sales per labor ppt powerpoint presentation styles examples. This is a three stage process. The stages in this process are finance, analysis, business, investment, marketing.
Dashboard With Four Business Factors Ppt PowerPoint Presentation Icon Slides PDF
Presenting this set of slides with name dashboard with four business factors ppt powerpoint presentation icon slides pdf. The topics discussed in these slides are financial, customers, learning and growth, marketing. This is a completely editable PowerPoint presentation and is available for immediate download. Download now and impress your audience.
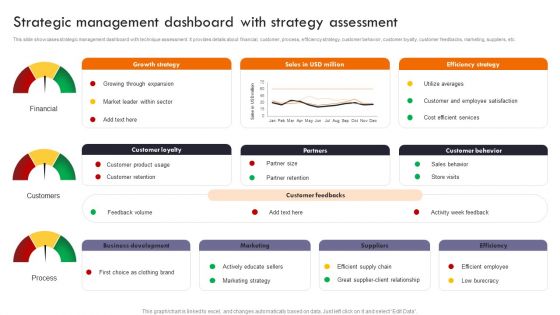
Gaining Competitive Edge Strategic Management Dashboard With Strategy Assessment Sample PDF
This slide showcases strategic management dashboard with technique assessment. It provides details about financial, customer, process, efficiency strategy, customer behavior, customer loyalty, customer feedbacks, marketing, suppliers, etc. The Gaining Competitive Edge Strategic Management Dashboard With Strategy Assessment Sample PDF is a compilation of the most recent design trends as a series of slides. It is suitable for any subject or industry presentation, containing attractive visuals and photo spots for businesses to clearly express their messages. This template contains a variety of slides for the user to input data, such as structures to contrast two elements, bullet points, and slides for written information. Slidegeeks is prepared to create an impression.
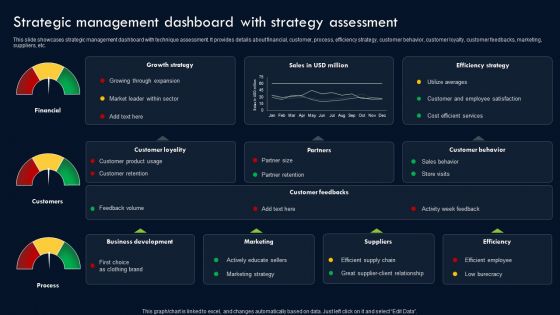
Transforming Sustainability Into Competitive Strategic Management Dashboard With Strategy Assessment Summary PDF
This slide showcases strategic management dashboard with technique assessment. It provides details about financial, customer, process, efficiency strategy, customer behavior, customer loyalty, customer feedbacks, marketing, suppliers, etc. From laying roadmaps to briefing everything in detail, our templates are perfect for you. You can set the stage with your presentation slides. All you have to do is download these easy-to-edit and customizable templates. Transforming Sustainability Into Competitive Strategic Management Dashboard With Strategy Assessment Summary PDF will help you deliver an outstanding performance that everyone would remember and praise you for. Do download this presentation today.
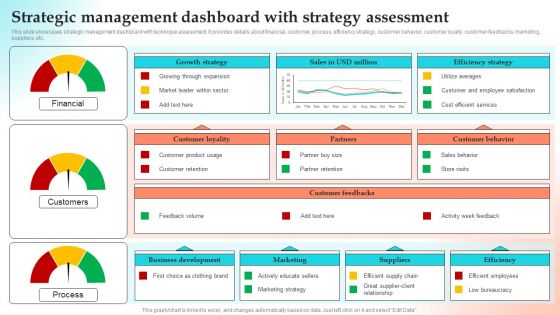
Implementing Strategies To Gain Competitive Advantage Strategic Management Dashboard With Strategy Assessment Inspiration PDF
This slide showcases strategic management dashboard with technique assessment. It provides details about financial, customer, process, efficiency strategy, customer behavior, customer loyalty, customer feedbacks, marketing, suppliers, etc. From laying roadmaps to briefing everything in detail, our templates are perfect for you. You can set the stage with your presentation slides. All you have to do is download these easy to edit and customizable templates. Implementing Strategies To Gain Competitive Advantage Strategic Management Dashboard With Strategy Assessment Inspiration PDF will help you deliver an outstanding performance that everyone would remember and praise you for. Do download this presentation today.
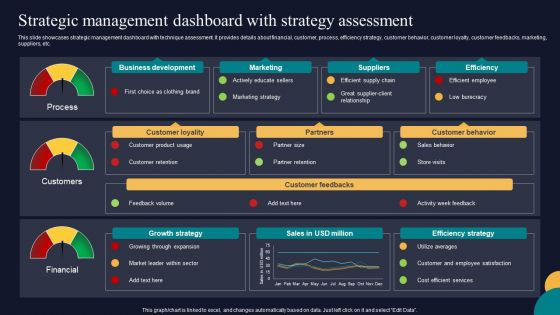
Strategic Management Dashboard With Strategy Assessment Tactics To Gain Sustainable Competitive Edge Pictures PDF
This slide showcases strategic management dashboard with technique assessment. It provides details about financial, customer, process, efficiency strategy, customer behavior, customer loyalty, customer feedbacks, marketing, suppliers, etc. Formulating a presentation can take up a lot of effort and time, so the content and message should always be the primary focus. The visuals of the PowerPoint can enhance the presenters message, so our Strategic Management Dashboard With Strategy Assessment Tactics To Gain Sustainable Competitive Edge Pictures PDF was created to help save time. Instead of worrying about the design, the presenter can concentrate on the message while our designers work on creating the ideal templates for whatever situation is needed. Slidegeeks has experts for everything from amazing designs to valuable content, we have put everything into Strategic Management Dashboard With Strategy Assessment Tactics To Gain Sustainable Competitive Edge Pictures PDF.
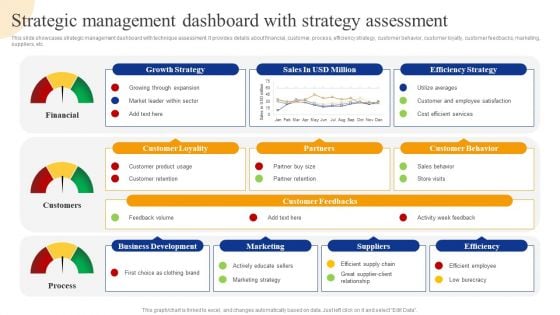
Strategic Management Dashboard With Strategy Assessment Strategic Management For Competitive Portrait PDF
This slide showcases strategic management dashboard with technique assessment. It provides details about financial, customer, process, efficiency strategy, customer behavior, customer loyalty, customer feedbacks, marketing, suppliers, etc. Do you know about Slidesgeeks Strategic Management Dashboard With Strategy Assessment Strategic Management For Competitive Portrait PDF These are perfect for delivering any kind od presentation. Using it, create PowerPoint presentations that communicate your ideas and engage audiences. Save time and effort by using our pre-designed presentation templates that are perfect for a wide range of topic. Our vast selection of designs covers a range of styles, from creative to business, and are all highly customizable and easy to edit. Download as a PowerPoint template or use them as Google Slides themes.
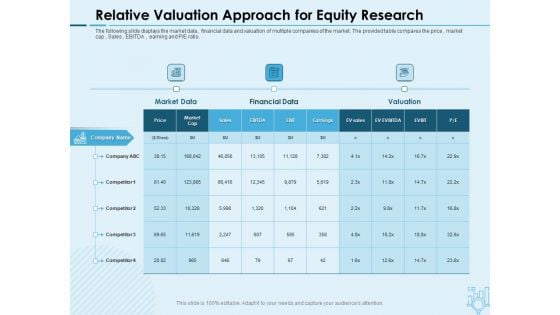
Assessing Stocks In Financial Market Relative Valuation Approach For Equity Research Ppt PowerPoint Presentation Ideas Graphics Tutorials PDF
Presenting this set of slides with name assessing stocks in financial market relative valuation approach for equity research ppt powerpoint presentation ideas graphics tutorials pdf. This is a three stage process. The stages in this process are market data, financial data, valuation. This is a completely editable PowerPoint presentation and is available for immediate download. Download now and impress your audience.
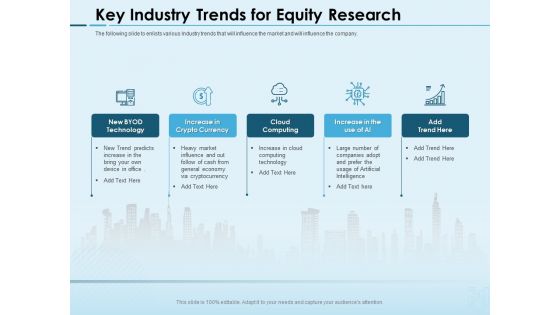
Assessing Stocks In Financial Market Key Industry Trends For Equity Research Ppt PowerPoint Presentation Show Templates PDF
Presenting this set of slides with name assessing stocks in financial market key industry trends for equity research ppt powerpoint presentation show templates pdf. This is a five stage process. The stages in this process are byod technology, increase in crypto currency, cloud, computing, increase ai. This is a completely editable PowerPoint presentation and is available for immediate download. Download now and impress your audience.
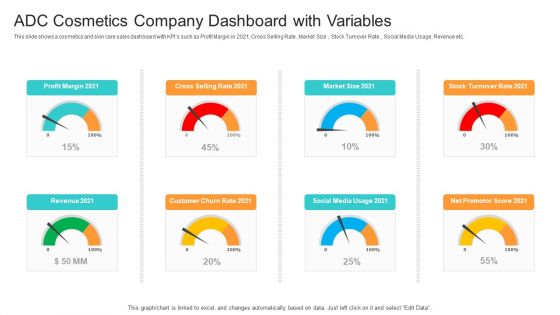
Utilization Of Current Techniques To Improve Efficiency Case Competition ADC Cosmetics Company Dashboard With Variables Diagrams PDF
This slide shows a cosmetics and skin care sales dashboard with KPIs such as Profit Margin in 2021, Cross Selling Rate , Market Size , Stock Turnover Rate , Social Media Usage, Revenue etc.Deliver and pitch your topic in the best possible manner with this utilization of current techniques to improve efficiency case competition adc cosmetics company dashboard with variables diagrams pdf. Use them to share invaluable insights on profit margin 2021, cross selling rate 2021, social media usage 2021 and impress your audience. This template can be altered and modified as per your expectations. So, grab it now.
Raising Stocks Business PowerPoint Templates And PowerPoint Backgrounds 0811
Microsoft PowerPoint Template and Background with stock market positive trend Recruit leaders with our Raising Stocks Business PowerPoint Templates And PowerPoint Backgrounds 0811. Download without worries with our money back guaranteee.
Raising Stocks Business PowerPoint Themes And PowerPoint Slides 0811
Microsoft PowerPoint Theme and Slide with stock market positive trend Book you place at the top with our Raising Stocks Business PowerPoint Themes And PowerPoint Slides 0811. You will come out on top.
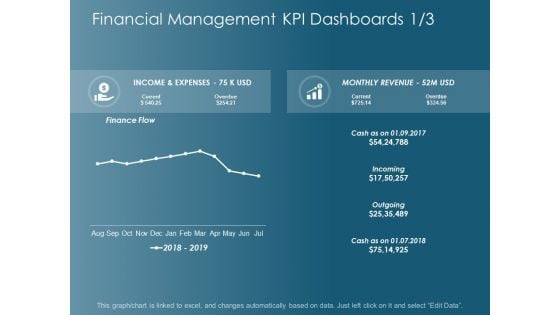
Financial Management Kpi Dashboards Marketing Ppt Powerpoint Presentation Inspiration Microsoft
This is a financial management kpi dashboards marketing ppt powerpoint presentation inspiration microsoft. This is a one stage process. The stages in this process are finance, marketing, management, investment, analysis.
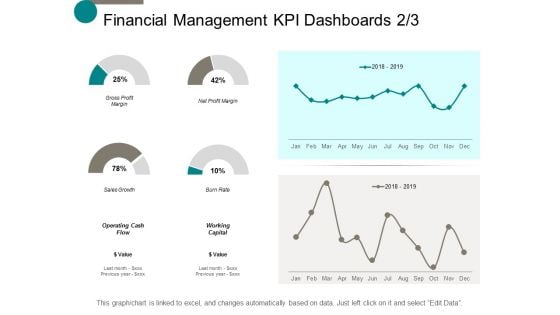
Financial Management Kpi Dashboards Marketing Ppt Powerpoint Presentation Infographics Outline
This is a financial management kpi dashboards marketing ppt powerpoint presentation infographics outline. This is a six stage process. The stages in this process are finance, marketing, management, investment, analysis.
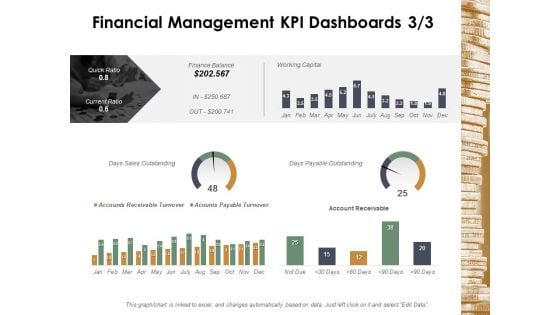
Financial Management Kpi Dashboards Marketing Ppt Powerpoint Presentation Professional Portrait
This is a financial management kpi dashboards marketing ppt powerpoint presentation professional portrait. This is a six stage process. The stages in this process are finance, marketing, management, investment, analysis.
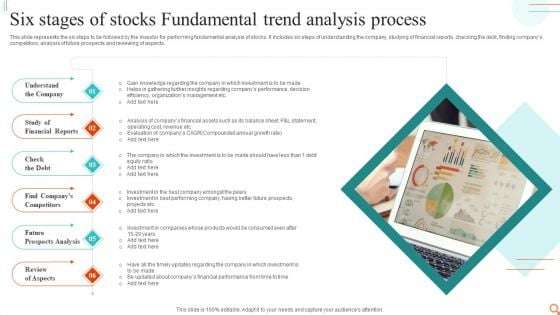
Six Stages Of Stocks Fundamental Trend Analysis Process Sample PDF
This slide represents the six steps to be followed by the investor for performing fundamental analysis of stocks. It includes six steps of understanding the company, studying of financial reports, checking the debt, finding companys competitors, analysis of future prospects and reviewing of aspects.Persuade your audience using this Six Stages Of Stocks Fundamental Trend Analysis Process Sample PDF. This PPT design covers six stages, thus making it a great tool to use. It also caters to a variety of topics including Financial Reports, Companys Competitors, Prospects Analysis. Download this PPT design now to present a convincing pitch that not only emphasizes the topic but also showcases your presentation skills.
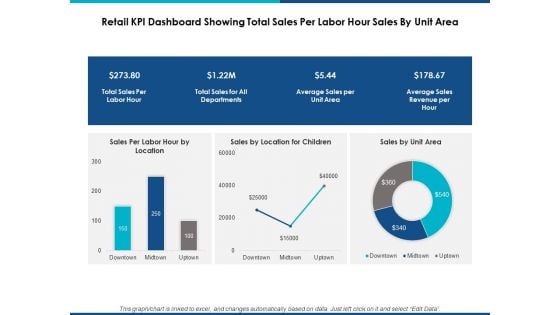
Retail Kpi Dashboard Showing Total Sales Per Labor Hour Sales By Unit Area Ppt Powerpoint Presentation Show Graphic Tips
This is a retail kpi dashboard showing total sales per labor hour sales by unit area ppt powerpoint presentation show graphic tips. This is a three stage process. The stages in this process are finance, marketing, management, investment, analysis.
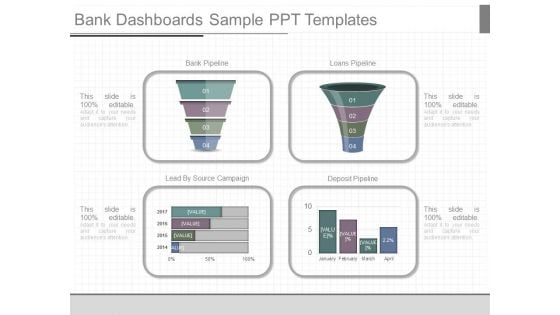
Bank Dashboards Sample Ppt Templates
This is a bank dashboards sample ppt templates. This is a four stage process. The stages in this process are bank pipeline, loans pipeline, lead by source campaign, deposit pipeline, january, february, march, april.
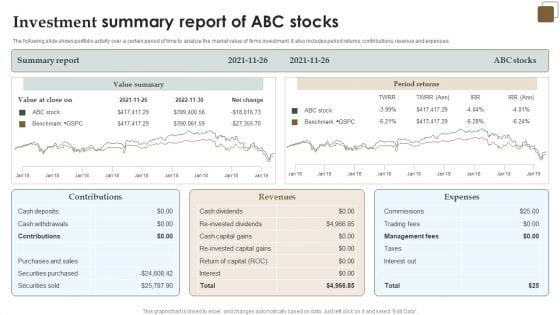
Investment Summary Report Of ABC Stocks Introduction PDF
The following slide shows portfolio activity over a certain period of time to analyze the market value of firms investment. It also includes period returns, contributions, revenue and expenses. Pitch your topic with ease and precision using this Investment Summary Report Of ABC Stocks Introduction PDF. This layout presents information on Summary Report, Value Summary, Revenues, Expenses. It is also available for immediate download and adjustment. So, changes can be made in the color, design, graphics or any other component to create a unique layout.
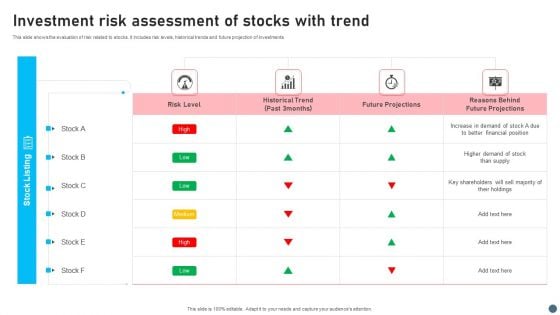
Investment Risk Assessment Of Stocks With Trend Structure PDF
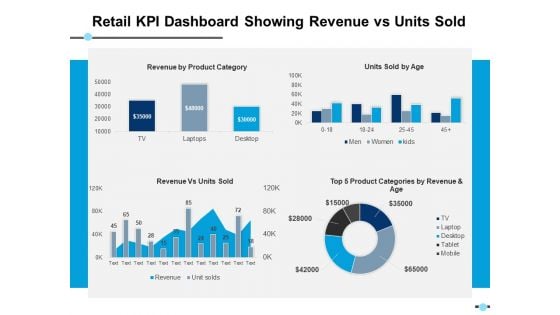
Retail Kpi Dashboard Showing Revenue Vs Units Sold Top 5 Product Categories Ppt PowerPoint Presentation Layouts Designs Download
This is a retail kpi dashboard showing revenue vs units sold top 5 product categories ppt powerpoint presentation layouts designs download. This is a four stage process. The stages in this process are finance, strategy, analysis, marketing.
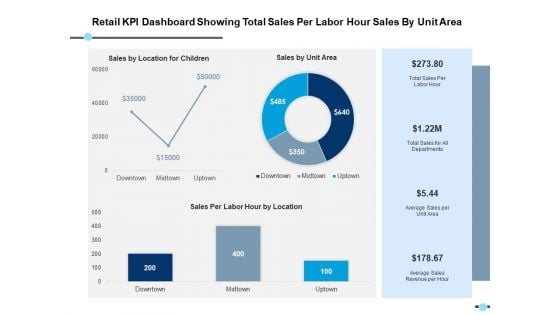
Retail Kpi Dashboard Showing Total Sales Per Labor Hour Sales By Unit Area Ppt PowerPoint Presentation Model Format
This is a retail kpi dashboard showing total sales per labor hour sales by unit area ppt powerpoint presentation model format. This is a three stage process. The stages in this process are finance, strategy, analysis, marketing.
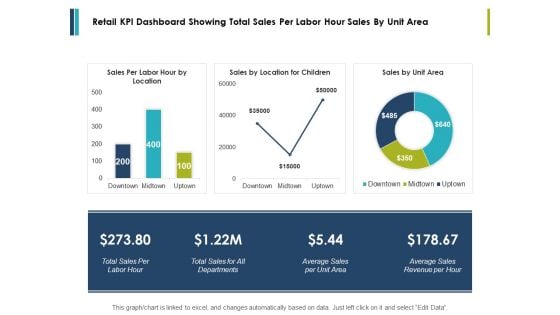
Retail Kpi Dashboard Showing Total Sales Per Labor Hour Sales By Unit Area Ppt PowerPoint Presentation Styles Influencers
This is a retail kpi dashboard showing total sales per labor hour sales by unit area ppt powerpoint presentation styles influencers. This is a three stage process. The stages in this process are finance, marketing, management, investment, analysis.
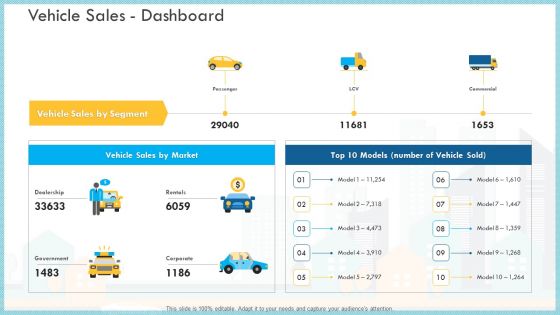
Loss Of Income And Financials Decline In An Automobile Organization Case Study Vehicle Sales Dashboard Infographics PDF
Deliver an awe-inspiring pitch with this creative loss of income and financials decline in an automobile organization case study vehicle sales dashboard infographics pdf bundle. Topics like vehicle sales by segment, vehicle sales by market, government can be discussed with this completely editable template. It is available for immediate download depending on the needs and requirements of the user.

Business Company Dashboards Ppt Powerpoint Slide Show
This is a business company dashboards ppt powerpoint slide show. This is a four stage process. The stages in this process are presentation, finance, management, business, strategy, success.
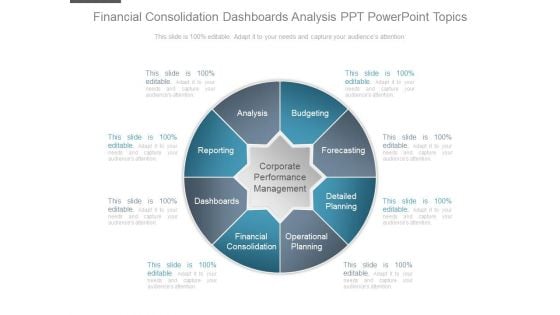
Financial Consolidation Dashboards Analysis Ppt Powerpoint Topics
This is a financial consolidation dashboards analysis ppt powerpoint topics. This is a eight stage process. The stages in this process are corporate performance management, budgeting, forecasting, detailed planning, operational planning, financial consolidation, dashboards, reporting, analysis.
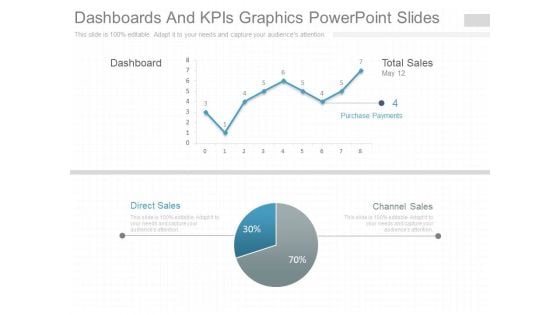
Dashboards And Kpis Graphics Powerpoint Slides
This is a dashboards and kpis graphics powerpoint slides. This is a two stage process. The stages in this process are dashboard, total sales, channel sales, direct sales, purchase payments.
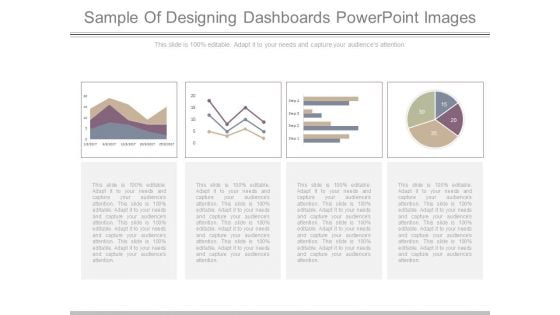
Sample Of Designing Dashboards Powerpoint Images
This is a sample of designing dashboards powerpoint images. This is a four stage process. The stages in this process are finance, growth business, marketing, success.
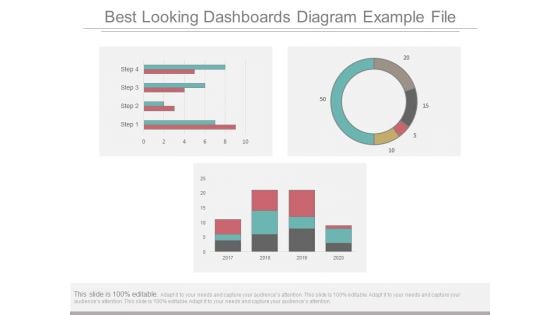
Best Looking Dashboards Diagram Example File
This is a best looking dashboards diagram example file. This is a three stage process. The stages in this process are business, marketing, finance, presentation, management.
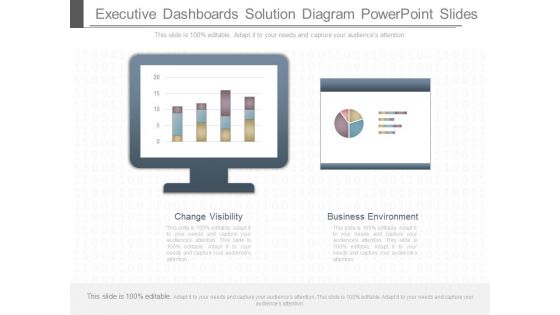
Executive Dashboards Solution Diagram Powerpoint Slides
This is a executive dashboards solution diagram powerpoint slides. This is a two stage process. The stages in this process are change visibility, business environment.
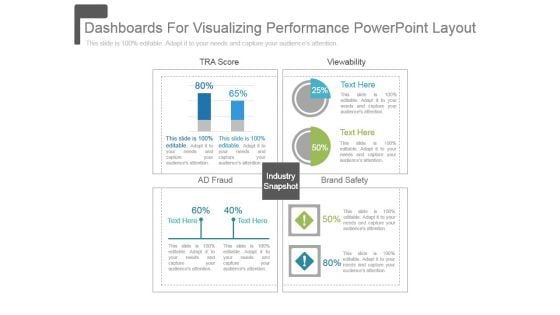
Dashboards For Visualizing Performance Powerpoint Layout
This is a dashboards for visualizing performance powerpoint layout. This is a four stage process. The stages in this process are tra score, view ability, ad fraud, brand safety, industry snapshot.
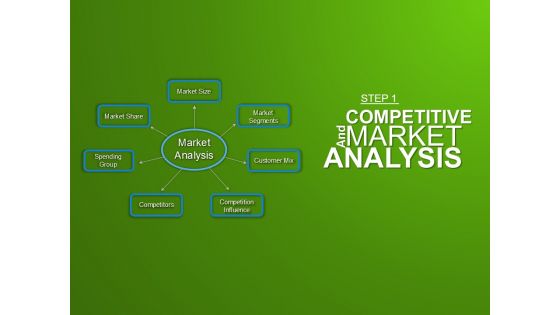
Market Ppt PowerPoint Presentation Graphics
This is a market ppt powerpoint presentation graphics. This is a two stage process. The stages in this process are market trends, location, growth, strategy, business, analysis.
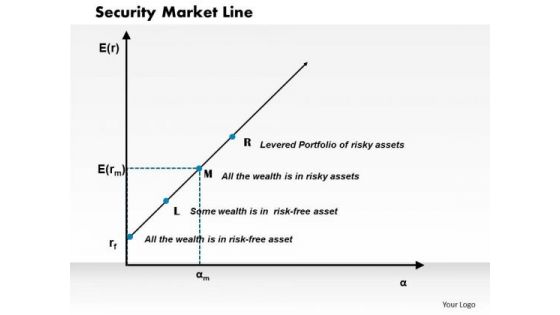
Business Framework Security Market Line PowerPoint Presentation
This diagram displays graph of security market line. You can use line graph to plot changes in data over time, such as monthly revenue and earnings changes or daily changes in stock market prices.
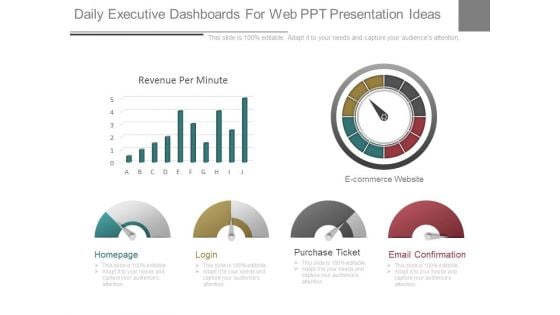
Daily Executive Dashboards For Web Ppt Presentation Ideas
This is a daily executive dashboards for web ppt presentation ideas. This is a six stage process. The stages in this process are homepage, login, purchase ticket, email confirmation, ecommerce website, revenue per minute.
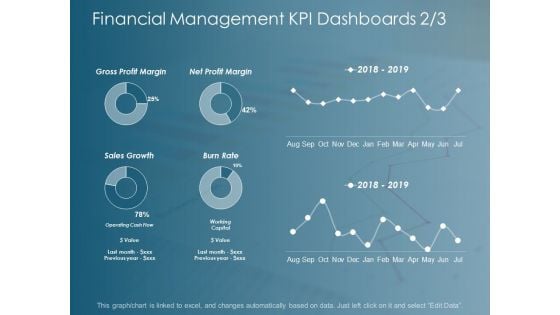
Financial Management Kpi Dashboards Business Ppt Powerpoint Presentation Inspiration Designs
This is a financial management kpi dashboards business ppt powerpoint presentation inspiration designs. This is a six stage process. The stages in this process are finance, marketing, management, investment, analysis.
Team Manager Administration KPI Metrics And Dashboards Microsoft Pdf
This is a team manager administration kpi metrics and dashboards microsoft pdf. template with various stages. Focus and dispense information on two stages using this creative set, that comes with editable features. It contains large content boxes to add your information on topics like kpi metrics, dashboard metrics. You can also showcase facts, figures, and other relevant content using this PPT layout. Grab it now.
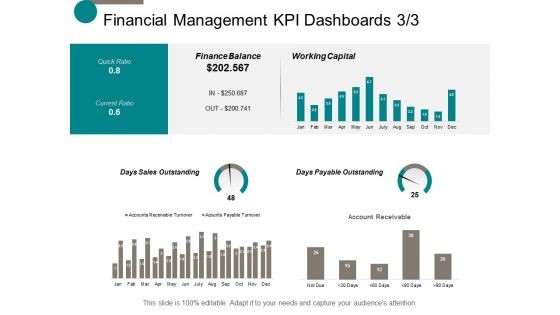
Financial Management Kpi Dashboards Finance Ppt Powerpoint Presentation Ideas Brochure
This is a financial management kpi dashboards finance ppt powerpoint presentation ideas brochure. This is a six stage process. The stages in this process are finance, marketing, management, investment, analysis.
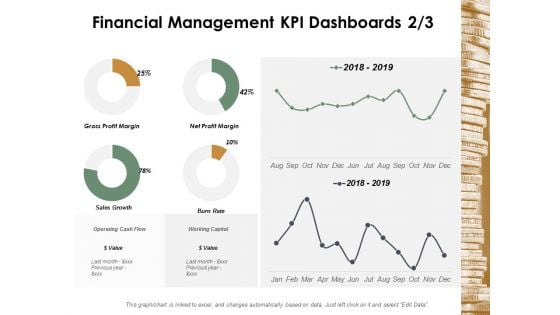
Financial Management Kpi Dashboards Management Ppt Powerpoint Presentation Slides Tips
This is a financial management kpi dashboards management ppt powerpoint presentation slides tips. This is a six stage process. The stages in this process are finance, marketing, management, investment, analysis.
Inventory Delivery On Time Dashboards Ppt PowerPoint Presentation Icon Template
This is a inventory delivery on time dashboards ppt powerpoint presentation icon template. This is a three stage process. The stages in this process are finance, marketing, management, investment, analysis.
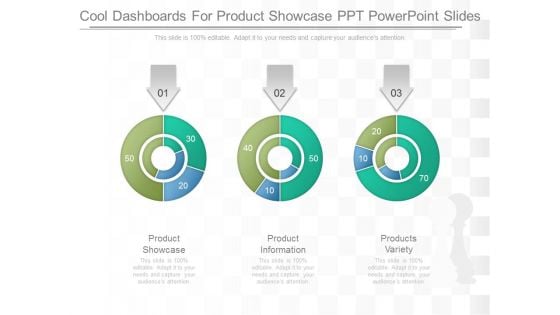
Cool Dashboards For Product Showcase Ppt Powerpoint Slides
This is a cool dashboards for product showcase ppt powerpoint slides. This is a three stage process. The stages in this process are product showcase, product information, products variety.
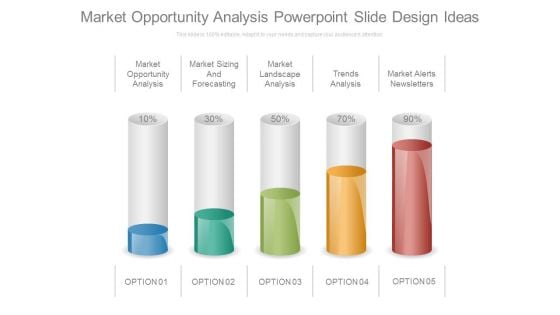
Market Opportunity Analysis Powerpoint Slide Design Ideas
This is a market opportunity analysis powerpoint slide design ideas. This is a five stage process. The stages in this process are market opportunity analysis, market sizing and forecasting, market landscape analysis, trends analysis, market alerts newsletters.
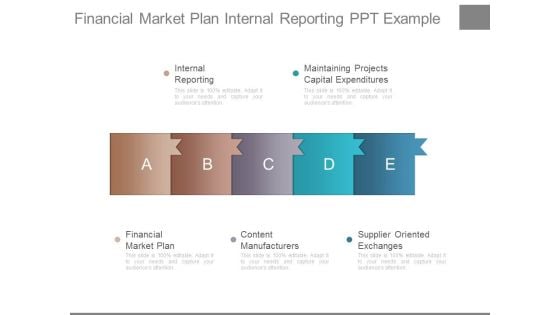
Financial Market Plan Internal Reporting Ppt Example
This is a financial market plan internal reporting ppt example. This is a five stage process. The stages in this process are internal reporting, maintaining projects capital expenditures, financial market plan, content manufacturers, supplier oriented exchanges.
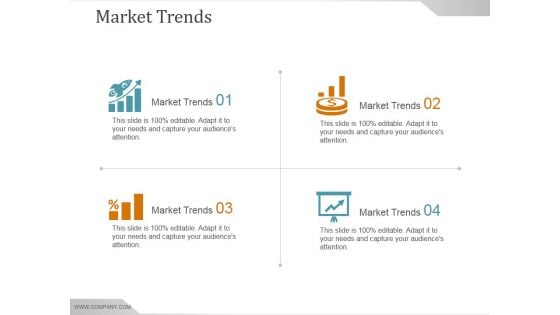
Market Trends Ppt PowerPoint Presentation Backgrounds
This is a market trends ppt powerpoint presentation backgrounds. This is a four stage process. The stages in this process are market trends, icon, finance, planning, business.
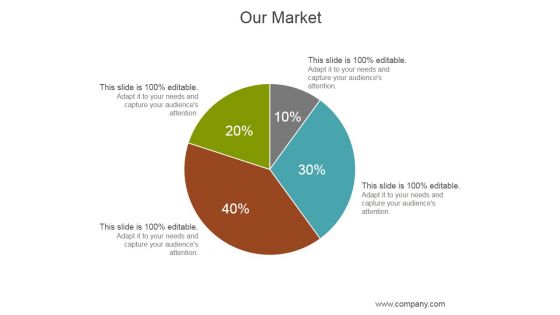
Our Market Ppt PowerPoint Presentation Deck
This is a our market ppt powerpoint presentation deck. This is a four stage process. The stages in this process are business, marketing, management, finance, analysis.
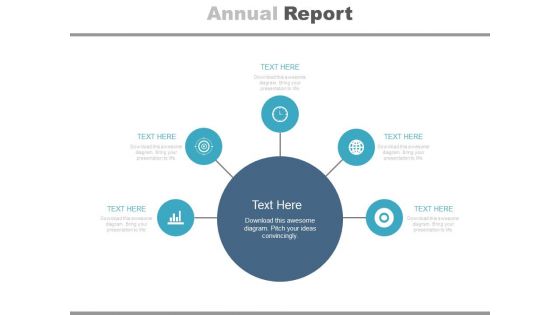
Diagram For Market Research Analysis Powerpoint Slides
This PowerPoint template has been designed with circular infographic diagram. It can be used to display steps for market research and also for financial data analysis. You can download finance PowerPoint template to prepare awesome presentations.
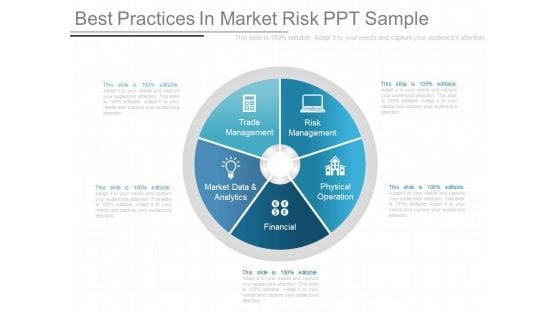
Best Practices In Market Risk Ppt Sample
This is a best practices in market risk ppt sample. This is a five stage process. The stages in this process are trade management, risk management, physical operation, financial, market data and analytics.
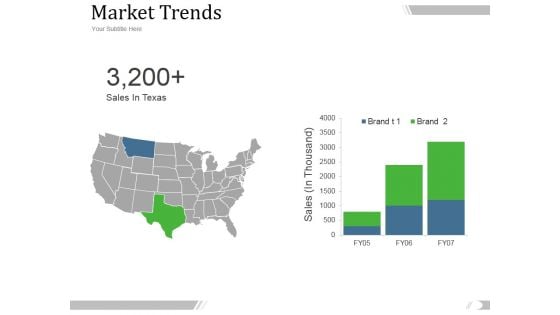
Market Trends Ppt PowerPoint Presentation Sample
This is a market trends ppt powerpoint presentation sample. This is a two stage process. The stages in this process are sales in taxes, sales in thousand, brand, fy.
Customer Financial Market Trends Icon Topics PDF
Persuade your audience using this Customer Financial Market Trends Icon Topics PDF. This PPT design covers three stages, thus making it a great tool to use. It also caters to a variety of topics including Customer Financial, Market, Trends. Download this PPT design now to present a convincing pitch that not only emphasizes the topic but also showcases your presentation skills.
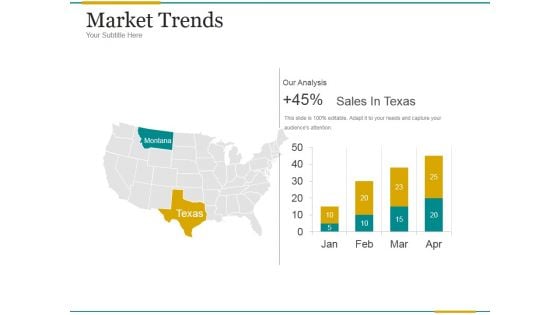
Market Trends Ppt PowerPoint Presentation Samples
This is a market trends ppt powerpoint presentation samples. This is a two stage process. The stages in this process are montana, our analysis, sales in texas.
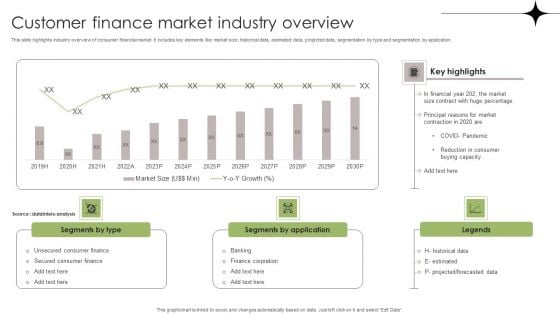
Customer Finance Market Industry Overview Clipart PDF
This slide highlights industry overview of consumer financial market. It includes key elements like market size, historical data, estimated data, projected data, segmentation by type and segmentation by application. Showcasing this set of slides titled Customer Finance Market Industry Overview Clipart PDF. The topics addressed in these templates are Consumer Finance, Historical Data, Pandemic. All the content presented in this PPT design is completely editable. Download it and make adjustments in color, background, font etc. as per your unique business setting.
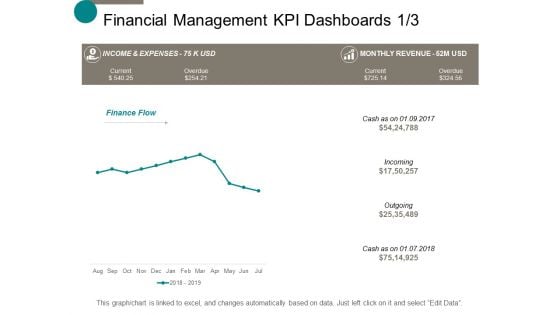
Financial Management Kpi Dashboards Business Ppt Powerpoint Presentation Show Gridlines
This is a financial management kpi dashboards business ppt powerpoint presentation show gridlines. This is a four stage process. The stages in this process are finance, marketing, management, investment, analysis.
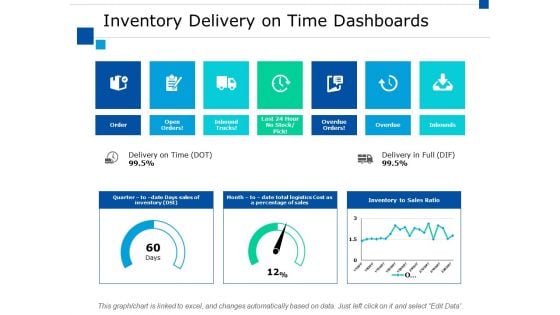
Inventory Delivery On Time Dashboards Ppt PowerPoint Presentation Slides Download
This is a inventory delivery on time dashboards ppt powerpoint presentation slides download. This is a seven stage process. The stages in this process are finance, marketing, management, investment, analysis.


 Continue with Email

 Home
Home


