Dashboard Stock Market
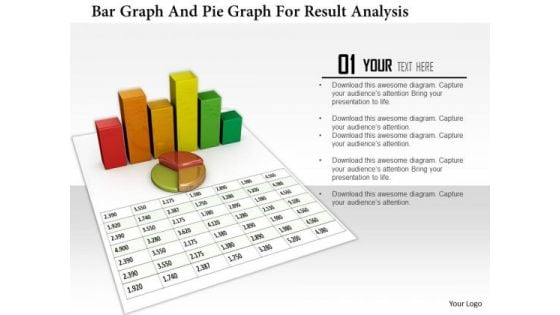
Stock Photo Bar Graph And Pie Graph For Result Analysis PowerPoint Slide
3D business graphs have been used to design this PowerPoint template. This Image slide is suitable to make business reports and charts. This slide can be used for business and marketing presentations.
Stock Photo Red Upload Arrow On Blue Cloud Icon PowerPoint Slide
This technical image slide has been designed with graphic of red upload arrow on cloud. This image slide explains the concept of data upload techniques with in the cloud service. Use this image slide for cloud computing related presentations.
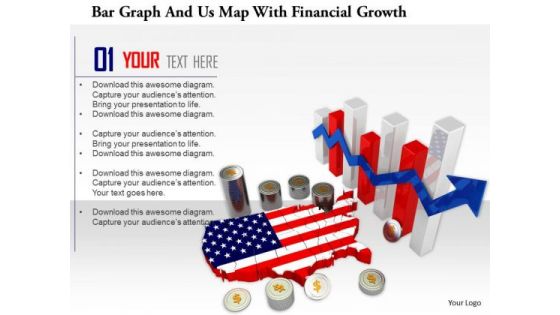
Stock Photo Bar Graph And Us Map With Financial Growth PowerPoint Slide
This image displays American map with business graph in background. This image slide contains the concept of American economy, business growth and reports. Use this amazing slide to make professional presentations.
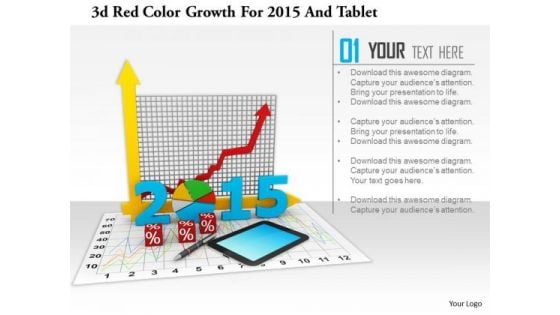
Stock Photo 3d Red Color Growth For 2015 And Tablet PowerPoint Slide
This image slide has graphics of financial charts and reports. This contains bar graph and pie chart to present business reports. Build an innovative presentation using this professional image slide.
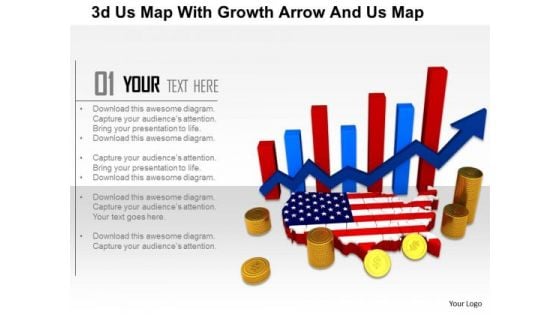
Stock Photo 3d Us Map With Growth Arrow And Us Map PowerPoint Slide
This image displays American map with business graph in background. This image slide contains the concept of American economy, business growth and reports. Use this amazing slide to make professional presentations.
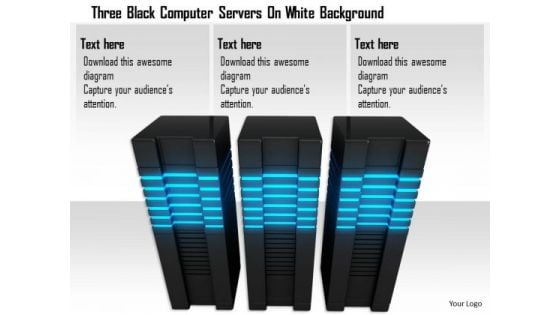
Stock Photo Three Black Computer Servers On White Background PowerPoint Slide
This image slide displays 3d black computer servers. This image has been designed with graphic of black computer servers with blue lights on white background. Use this image to express views on client server, data storage and backup. This image will enhance the quality of your presentations.
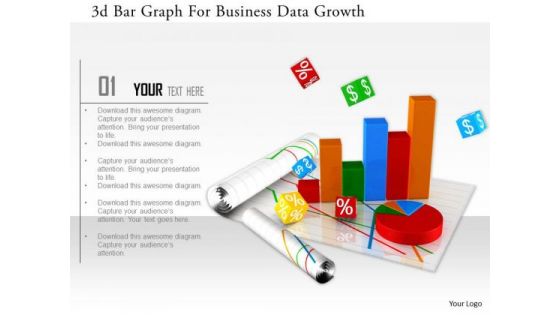
Stock Photo 3d Bar Graph For Business Data Growth Image Graphics For PowerPoint Slide
This image slide has graphics of financial charts and reports. This contains bar graph and pie chart to present business reports. Build an innovative presentations using this professional image slide.
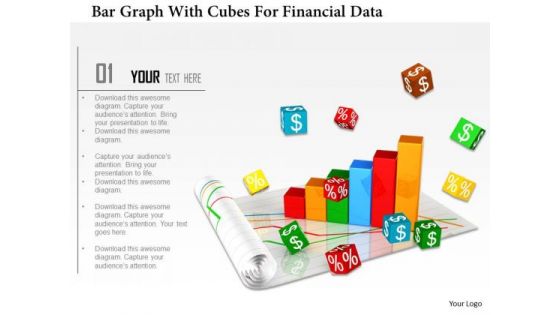
Stock Photo Bar Graph With Cubes For Financial Data PowerPoint Slide
Graphic of bar graph and cubes are used to decorate this image template. This PPT contains the concept of financial data analysis. Use this PPT for finance and business related presentations.
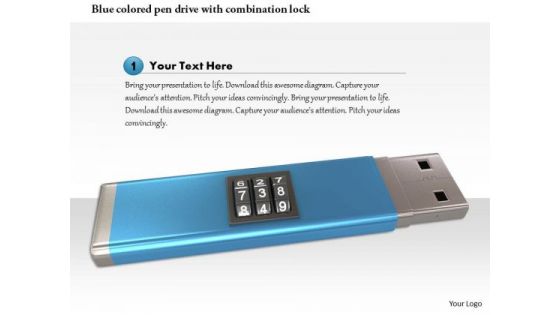
Stock Photo Blue Colored Pen Drive With Combination Lock PowerPoint Slide
Graphic of blue colored pen drive and combination lock has been used to design this power point template. This PPT contains the concept of data security and data technology. Use this PPT for your business and marketing related presentations.
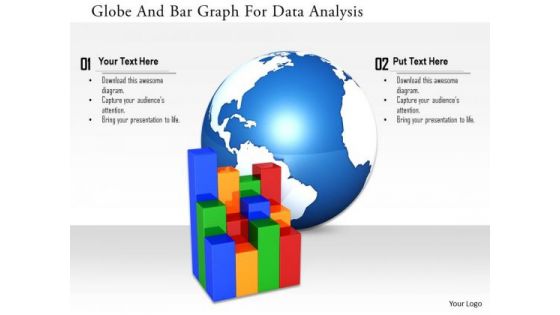
Stock Photo Globe And Bar Graph For Data Analysis Image Graphics For PowerPoint Slide
This image slide has been designed with business graph with globe in background. This image slide represents topics like global business, economic growth. This image will enhance the quality of your presentations.
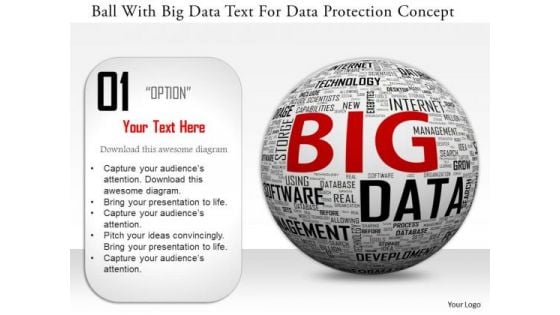
Stock Photo Ball With Big Data Text For Data Protection Concept PowerPoint Slide
Graphic of ball with big data text has been used to craft this power point template. This image template contains the concept of data protection. Use this image for data security related topics in any presentation.
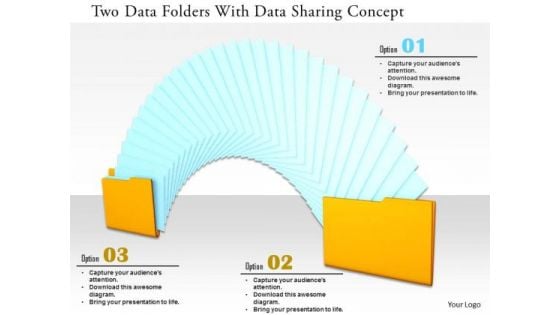
Stock Photo Two Data Folders With Data Sharing Concept PowerPoint Slide
This power point image template has been designed with graphic of two data folders. This PPT contains the concept of data sharing. This PPT can be used for data and technology related presentations.
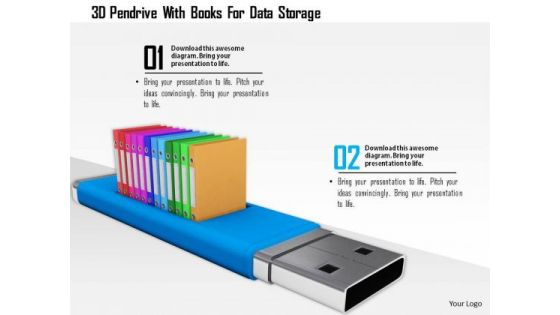
Stock Photo 3d Pendrive With Books For Data Storage PowerPoint Slide
This power point image template has been crafted with graphic of 3d pen drive and books. This PPT contains the concept of data storage. Use this image for your business data storage related topics in any presentations.
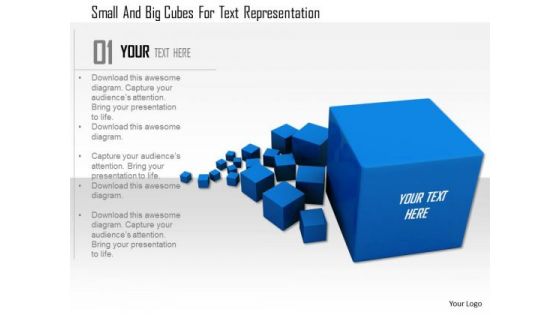
Stock Photo Small And Big Cubes For Text Representation PowerPoint Slide
This Power Point template has been crafted with graphic of cubes. This image slide contains the concept data representations. Use this editable image slide for your business and marketing related topics and to impress your viewers.
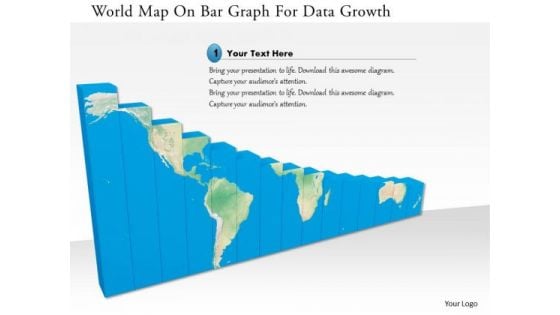
Stock Photo World Map On Bar Graph For Data Growth Image Graphics For PowerPoint Slide
This image is designed with blue graph with world map printed on it. This conceptual image portrays the concepts of global business and global economy. This image slide will help you express your views to target audience.
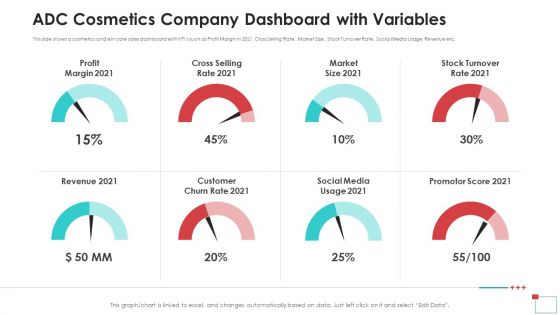
ADC Cosmetics Company Dashboard With Variables Introduction PDF
This slide shows a cosmetics and skin care sales dashboard with KPIs such as Profit Margin in 2021, Cross Selling Rate, Market Size, Stock Turnover Rate, Social Media Usage, Revenue etc. Presenting adc cosmetics company dashboard with variables introduction pdf to provide visual cues and insights. Share and navigate important information on eight stages that need your due attention. This template can be used to pitch topics like profit margin, revenue, market size, social media, promotor score. In addition, this PPT design contains high-resolution images, graphics, etc, that are easily editable and available for immediate download.
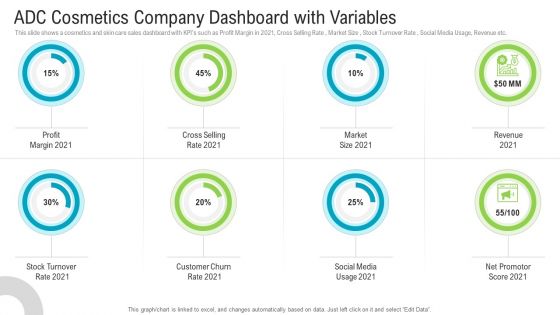
ADC Cosmetics Company Dashboard With Variables Summary PDF
This slide shows a cosmetics and skin care sales dashboard with KPIs such as Profit Margin in 2021, Cross Selling Rate , Market Size , Stock Turnover Rate , Social Media Usage, Revenue etc. Presenting adc cosmetics company dashboard with variables summary pdf to provide visual cues and insights. Share and navigate important information on eight stages that need your due attention. This template can be used to pitch topics like profit margin, cross selling rate, market size, revenue, stock turnover rate. In addtion, this PPT design contains high resolution images, graphics, etc, that are easily editable and available for immediate download.
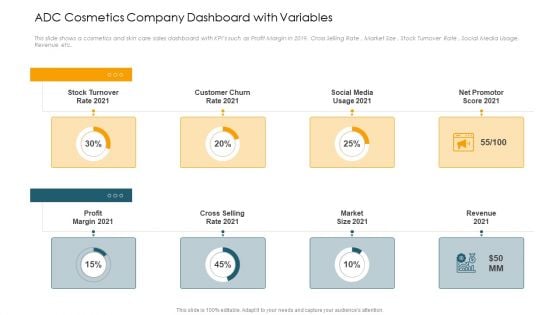
ADC Cosmetics Company Dashboard With Variables Ppt Backgrounds PDF
This slide shows a cosmetics and skin care sales dashboard with KPIs such as Profit Margin in 2019, Cross Selling Rate , Market Size , Stock Turnover Rate , Social Media Usage, Revenue etc.Presenting adc cosmetics company dashboard with variables ppt backgrounds pdf. to provide visual cues and insights. Share and navigate important information on eight stages that need your due attention. This template can be used to pitch topics like stock turnover rate 2021, social media usage 2021, net promotor score 2021. In addtion, this PPT design contains high resolution images, graphics, etc, that are easily editable and available for immediate download.
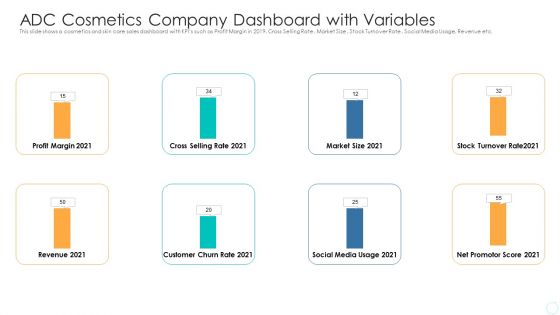
ADC Cosmetics Company Dashboard With Variables Formats PDF
This slide shows a cosmetics and skin care sales dashboard with KPIs such as Profit Margin in 2021, Cross Selling Rate , Market Size, Stock Turnover Rate , Social Media Usage, Revenue etc. Deliver an awe-inspiring pitch with this creative adc cosmetics company dashboard with variables formats pdf bundle. Topics like profit margin, cross selling rate, market size, revenue, social media can be discussed with this completely editable template. It is available for immediate download depending on the needs and requirements of the user.

Dashboard Ppt PowerPoint Presentation Introduction Ppt PowerPoint Presentation Pictures
This is a dashboard ppt powerpoint presentation introduction ppt powerpoint presentation pictures. This is a three stage process. The stages in this process are business, strategy, marketing, success, dashboard.
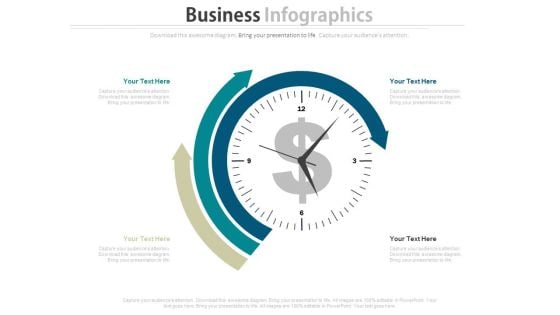
Dashboard Diagram For Finance And Strategic Analysis Powerpoint Slides
This PowerPoint template display graphics of clock with arrows around it and dollar symbol in center. You may use this PPT slide for financial and strategic analysis. This dashboard slide may useful for multilevel status report creation and approval process.
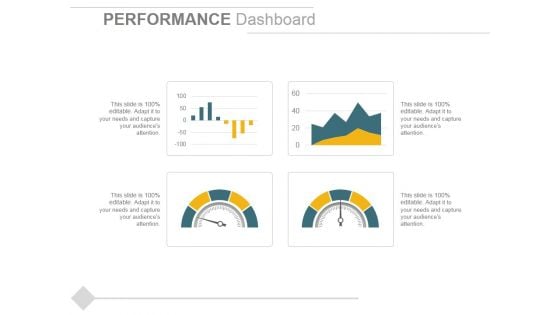
Performance Dashboard Template 2 Ppt PowerPoint Presentation Show Backgrounds
This is a performance dashboard template 2 ppt powerpoint presentation show backgrounds. This is a four stage process. The stages in this process are performance dashboard, business, marketing, management, finance.
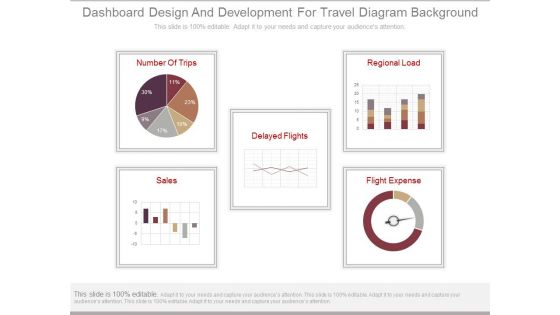
Dashboard Design And Development For Travel Diagram Background
This is a dashboard design and development for travel diagram background. This is a five stage process. The stages in this process are number of trips, sales, delayed flights, regional load, flight expense.
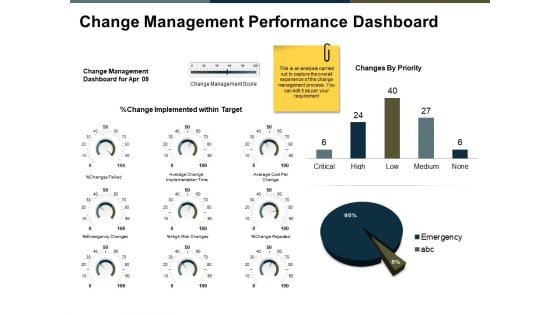
Change Management Performance Dashboard Ppt PowerPoint Presentation Professional Portrait
This is a change management performance dashboard ppt powerpoint presentation professional portrait. This is a three stage process. The stages in this process are finance, marketing, analysis, business, investment.
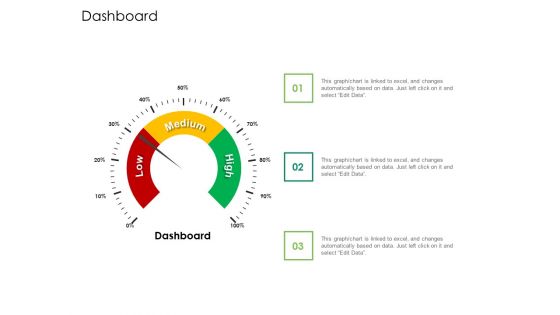
Global Financial Catastrophe 2008 Dashboard Ppt Inspiration Template PDF
Deliver an awe inspiring pitch with this creative global financial catastrophe 2008 dashboard ppt inspiration template pdf bundle. Topics like dashboard can be discussed with this completely editable template. It is available for immediate download depending on the needs and requirements of the user.
Performance Dashboard Management Ppt PowerPoint Presentation Icon Themes
This is a performance dashboard management ppt powerpoint presentation icon themes. This is a four stage process. The stages in this process are finance, marketing, analysis, business, investment.
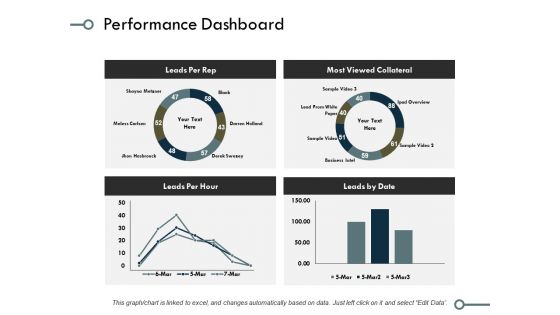
Performance Dashboard Ppt PowerPoint Presentation Model Graphics Example
This is a performance dashboard ppt powerpoint presentation model graphics example. This is a four stage process. The stages in this process are finance, marketing, analysis, business, investment.
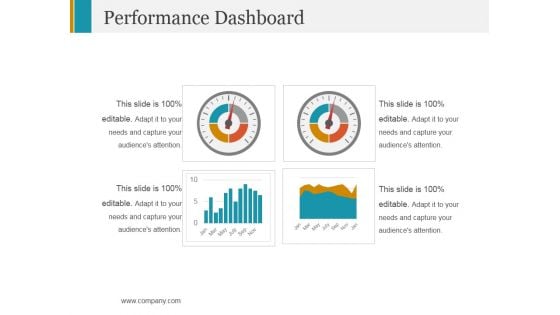
Performance Dashboard Template 2 Ppt PowerPoint Presentation Model Format
This is a performance dashboard template 2 ppt powerpoint presentation model format. This is a four stage process. The stages in this process are dashboard, finance, business, marketing.
Project Financial Risk Evaluation Dashboard Icon Summary PDF
Persuade your audience using this project financial risk evaluation dashboard icon summary pdf This PPT design covers four stages, thus making it a great tool to use. It also caters to a variety of topics including project financial risk evaluation dashboard icon Download this PPT design now to present a convincing pitch that not only emphasizes the topic but also showcases your presentation skills.
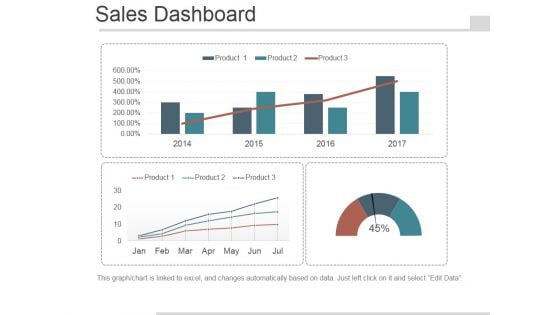
Sales Dashboard Slide Template 1 Ppt PowerPoint Presentation Layouts
This is a sales dashboard slide template 1 ppt powerpoint presentation layouts. This is a three stage process. The stages in this process are business, marketing, product, year.
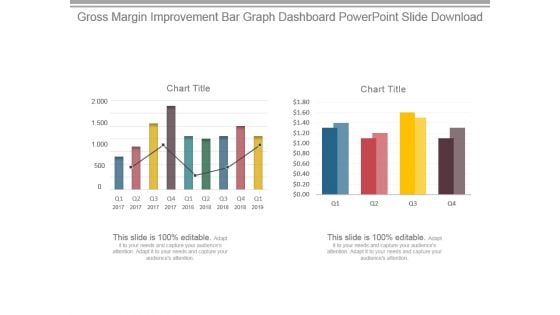
Gross Margin Improvement Bar Graph Dashboard Powerpoint Slide Download
This is a gross margin improvement bar graph dashboard powerpoint slide download. This is a two stage process. The stages in this process are chart title.
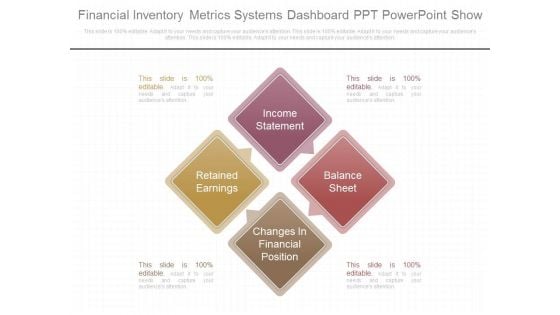
Financial Inventory Metrics Systems Dashboard Ppt Powerpoint Show
This is a financial inventory metrics systems dashboard ppt powerpoint show. This is a four stage process. The stages in this process are income statement, retained earnings, balance sheet, changes in financial position.
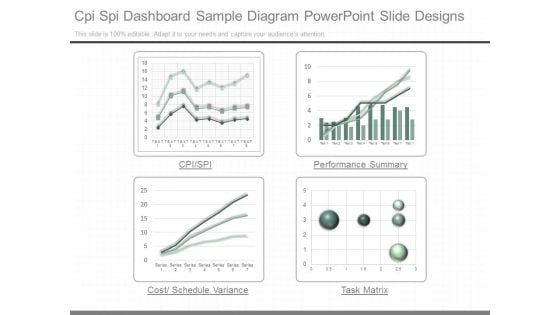
Cpi Spi Dashboard Sample Diagram Powerpoint Slide Designs
This is a cpi spi dashboard sample diagram powerpoint slide designs. This is a four stage process. The stages in this process are cpi spi, performance summary, cost schedule variance, task matrix.
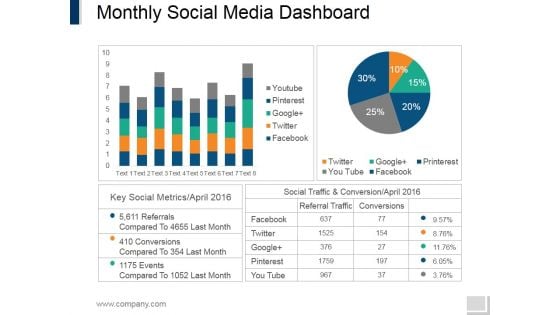
Monthly Social Media Dashboard Ppt PowerPoint Presentation Gallery Templates
This is a monthly social media dashboard ppt powerpoint presentation gallery templates. This is a four stage process. The stages in this process are facebook, twitter, google, pinterest, you tube.
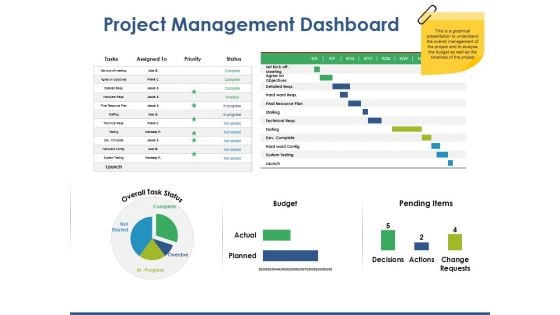
Project Management Dashboard Ppt PowerPoint Presentation Model Outline
This is a project management dashboard ppt powerpoint presentation model outline. This is a three stage process. The stages in this process are finance, business, analysis, marketing, management.

Sales Performance Dashboard Ppt PowerPoint Presentation Gallery Outline
This is a sales performance dashboard ppt powerpoint presentation gallery outline. This is a three stage process. The stages in this process are finance, marketing, management, investment, analysis.
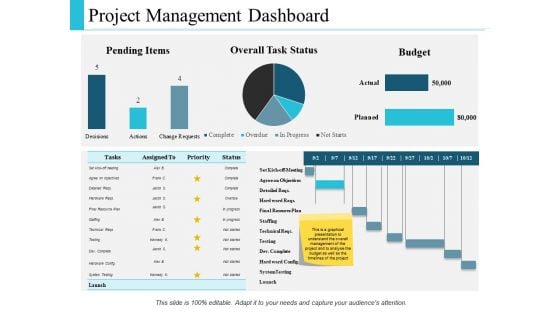
Project Management Dashboard Ppt PowerPoint Presentation Show Portrait
This is a project management dashboard ppt powerpoint presentation show portrait. This is a three stage process. The stages in this process are finance, marketing, management, investment, analysis.
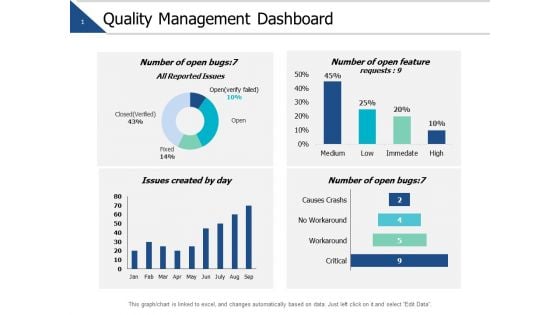
Quality Management Dashboard Ppt PowerPoint Presentation Outline Influencers
This is a quality management dashboard ppt powerpoint presentation outline influencers. This is a four stage process. The stages in this process are finance, marketing, management, investment, analysis.
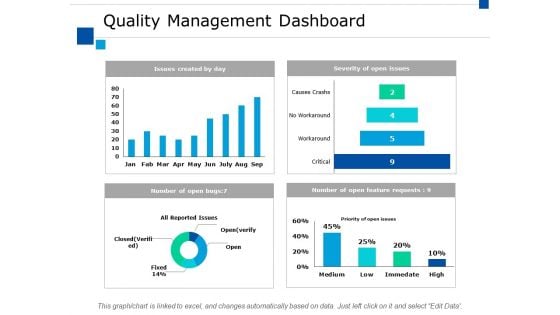
Quality Management Dashboard Ppt PowerPoint Presentation File Diagrams
This is a quality management dashboard ppt powerpoint presentation file diagrams. This is a four stage process. The stages in this process are finance, marketing, management, investment, analysis.
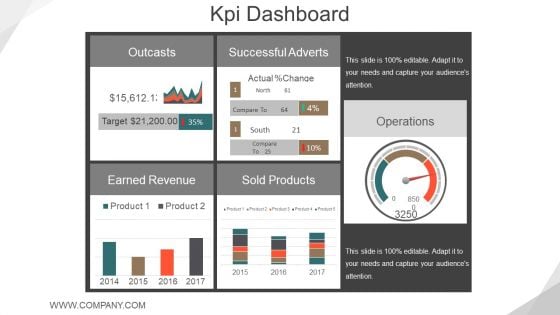
Kpi Dashboard Ppt PowerPoint Presentation Infographic Template Grid
This is a kpi dashboard ppt powerpoint presentation infographic template grid. This is a five stage process. The stages in this process are outcasts, successful adverts, operations.
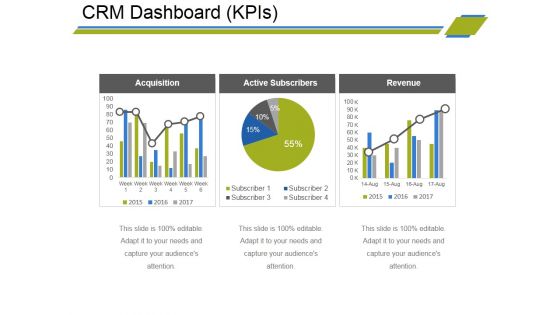
Crm Dashboard Kpis Ppt PowerPoint Presentation Inspiration Brochure
This is a crm dashboard kpis ppt powerpoint presentation inspiration brochure. This is a three stage process. The stages in this process are acquisition, active subscribers, revenue.
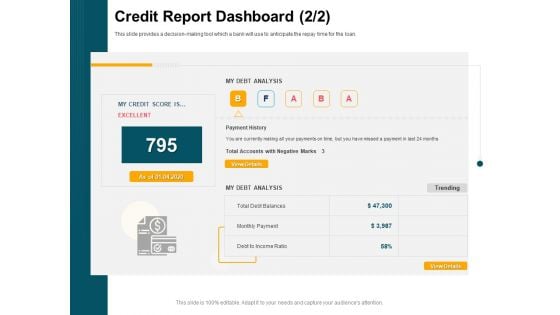
Consumer Lending Procedure Credit Report Dashboard Ppt Ideas Portrait PDF
Presenting this set of slides with name consumer lending procedure credit report dashboard ppt ideas portrait pdf. This is a one stage process. The stages in this process are credit report dashboard. This is a completely editable PowerPoint presentation and is available for immediate download. Download now and impress your audience.
Pharmaceutical Management KPI Metrics And Dashboard Ppt File Professional PDF
Presenting pharmaceutical management kpi metrics and dashboard ppt file professional pdf to provide visual cues and insights. Share and navigate important information on two stages that need your due attention. This template can be used to pitch topics like kpi metrics, kpi dashboards. In addition, this PPT design contains high-resolution images, graphics, etc, that are easily editable and available for immediate download.
International Logistics KPI Carrier Dashboard Icon Ppt Icon Gallery PDF
Presenting International Logistics KPI Carrier Dashboard Icon Ppt Icon Gallery PDF to dispense important information. This template comprises four stages. It also presents valuable insights into the topics including International Logistics, KPI Carrier, Dashboard Icon. This is a completely customizable PowerPoint theme that can be put to use immediately. So, download it and address the topic impactfully.
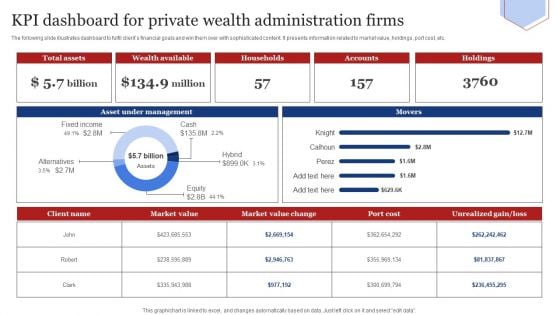
KPI Dashboard For Private Wealth Administration Firms Mockup PDF
The following slide illustrates dashboard to fulfil clients financial goals and win them over with sophisticated content. It presents information related to market value, holdings, port cost, etc. Showcasing this set of slides titled KPI Dashboard For Private Wealth Administration Firms Mockup PDF. The topics addressed in these templates are KPI Dashboard, Private Wealth Administration Firms. All the content presented in this PPT design is completely editable. Download it and make adjustments in color, background, font etc. as per your unique business setting.
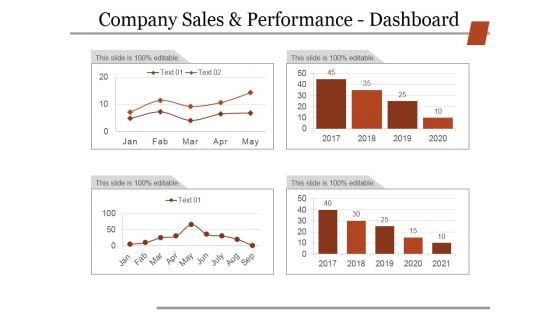
Company Sales And Performance Dashboard Ppt PowerPoint Presentation Slides Grid
This is a company sales and performance dashboard ppt powerpoint presentation slides grid. This is a four stage process. The stages in this process are business, strategy, marketing, finance, analysis.
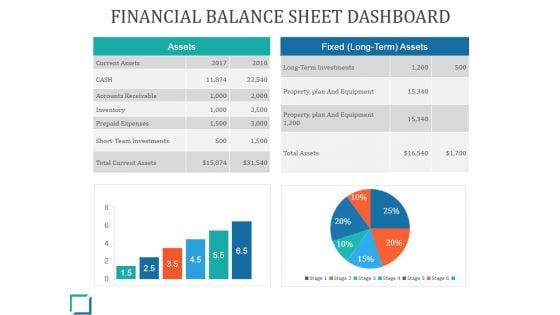
Financial Balance Sheet Dashboard Ppt PowerPoint Presentation Background Image
This is a financial balance sheet dashboard ppt powerpoint presentation background image. This is a two stage process. The stages in this process are current assets, cash, inventory, prepaid expenses, total assets.
Key Business Metrics Dashboard Ppt Powerpoint Presentation Icon Graphics Design
This is a key business metrics dashboard ppt powerpoint presentation icon graphics design. This is a five stage process. The stages in this process are finance, marketing, management, investment, analysis.
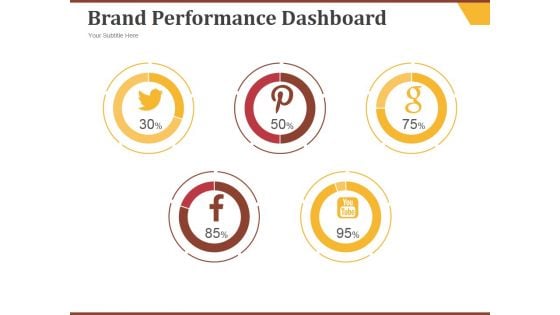
Brand Performance Dashboard Template 2 Ppt PowerPoint Presentation Template
This is a brand performance dashboard template 2 ppt powerpoint presentation template. This is a five stage process. The stages in this process are marketing, business, social, icons, management.
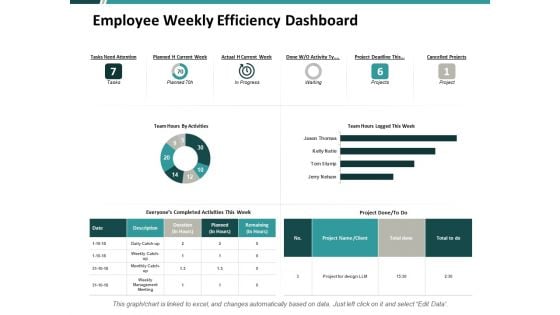
Employee Weekly Efficiency Dashboard Ppt PowerPoint Presentation Portfolio Show
This is a employee weekly efficiency dashboard ppt powerpoint presentation portfolio show. This is a three stage process. The stages in this process are financial, minimum, maximum, marketing, strategy.
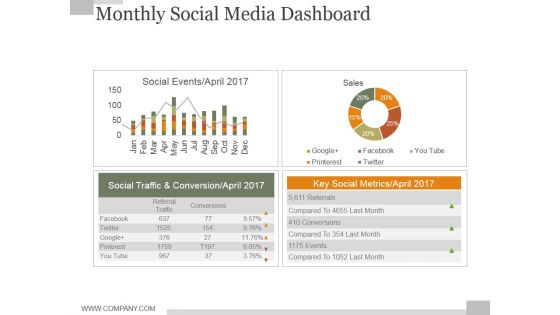
Monthly Social Media Dashboard Ppt PowerPoint Presentation Background Designs
This is a monthly social media dashboard ppt powerpoint presentation background designs. This is a four stage process. The stages in this process are business, finance, marketing, strategy, analysis, success.
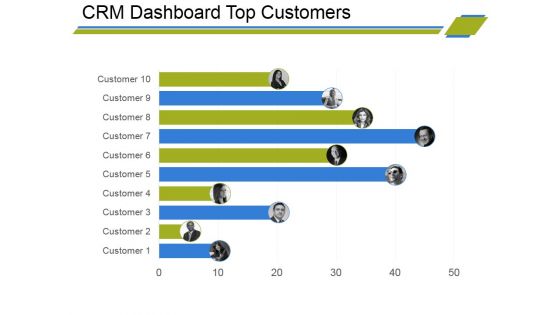
Crm Dashboard Top Customers Ppt PowerPoint Presentation Styles Designs
This is a crm dashboard top customers ppt powerpoint presentation styles designs. This is a ten stage process. The stages in this process are business, customer, finance, bar graph, marketing, strategy, analysis.
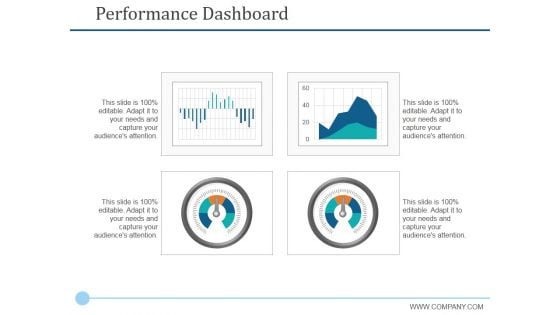
Performance Dashboard Template 2 Ppt PowerPoint Presentation Styles Graphics Tutorials
This is a performance dashboard template 2 ppt powerpoint presentation styles graphics tutorials. This is a four stage process. The stages in this process are finance, business, marketing, management.
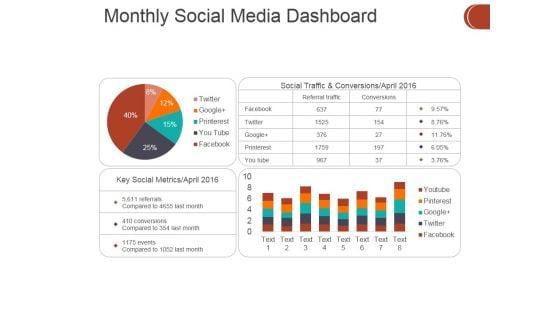
Monthly Social Media Dashboard Ppt PowerPoint Presentation Show Picture
This is a monthly social media dashboard ppt powerpoint presentation show picture. This is a four stage process. The stages in this process are business, finance, marketing, analysis, investment.
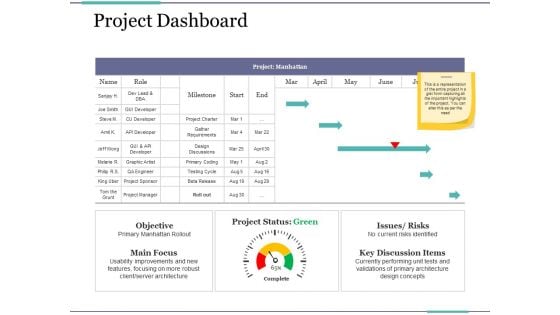
Project Dashboard Ppt PowerPoint Presentation Ideas Graphic Tips
This is a project dashboard ppt powerpoint presentation ideas graphic tips. This is a one stage process. The stages in this process are business, marketing, objective, main focus, issues risks, key discussion items.
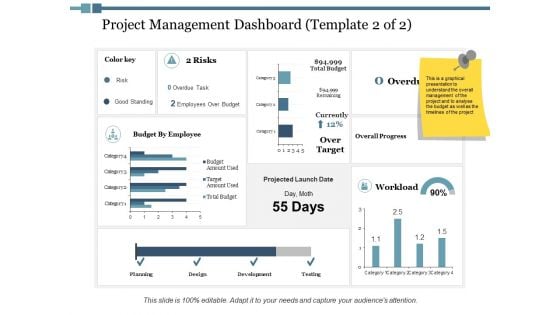
Project Management Dashboard Workload Ppt PowerPoint Presentation Inspiration Show
This is a project management dashboard workload ppt powerpoint presentation inspiration show. This is a four stage process. The stages in this process are finance, marketing, management, investment, analysis.
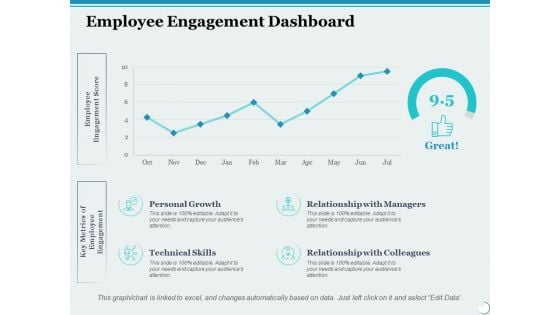
Employee Engagement Dashboard Ppt PowerPoint Presentation Inspiration Format
This is a employee engagement dashboard ppt powerpoint presentation inspiration format. This is a four stage process. The stages in this process are personal growth, relationship with managers, business, management, marketing.

Loyalty Program Performance Dashboard Ppt Powerpoint Presentation Professional Templates
This is a loyalty program performance dashboard ppt powerpoint presentation professional templates. This is a six stage process. The stages in this process are finance, marketing, management, investment, analysis.
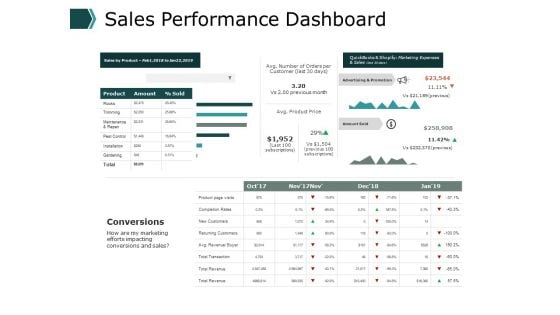
Sales Performance Dashboard Business Ppt PowerPoint Presentation Pictures Visuals
This is a sales performance dashboard business ppt powerpoint presentation pictures visuals . This is a three stage process. The stages in this process are finance, marketing, management, investment, analysis.

Inventory And Logistics Dashboard Ppt PowerPoint Presentation Gallery Clipart
This is a inventory and logistics dashboard ppt powerpoint presentation gallery clipart. This is a four stage process. The stages in this process are finance, marketing, management, investment, analysis.


 Continue with Email

 Home
Home


