Dashboard Stock Market
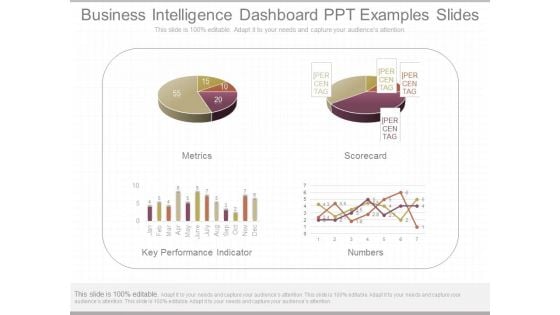
Business Intelligence Dashboard Ppt Examples Slides
This is a business intelligence dashboard ppt examples slides. This is a four stage process. The stages in this process are metrics, scorecard, key performance indicator, numbers.
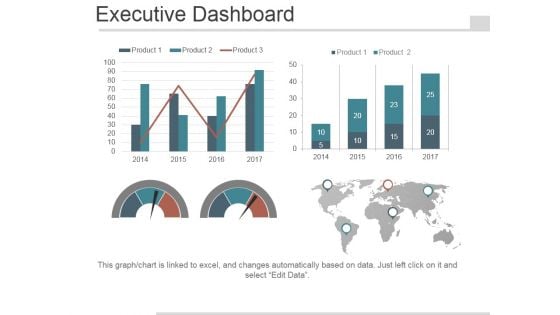
Executive Dashboard Ppt PowerPoint Presentation Visuals
This is a executive dashboard ppt powerpoint presentation visuals. This is a four stage process. The stages in this process are product, finance, management, arrows.
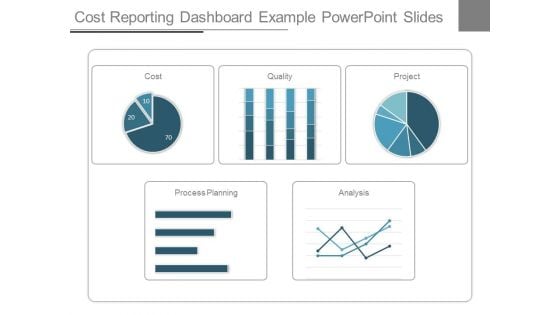
Cost Reporting Dashboard Example Powerpoint Slides
This is a cost reporting dashboard example powerpoint slides. This is a five stage process. The stages in this process are cost, quality, project, process planning, analysis.
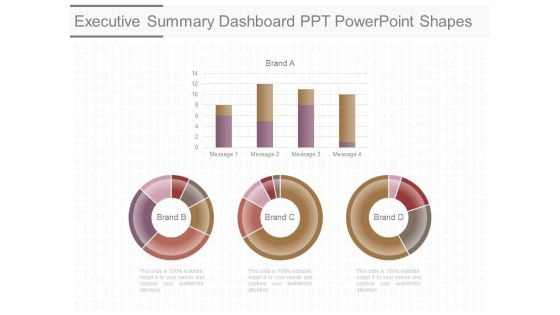
Executive Summary Dashboard Ppt Powerpoint Shapes
This is a executive summary dashboard ppt powerpoint shapes. This is a four stage process. The stages in this process are brand b, brand c, brand d.
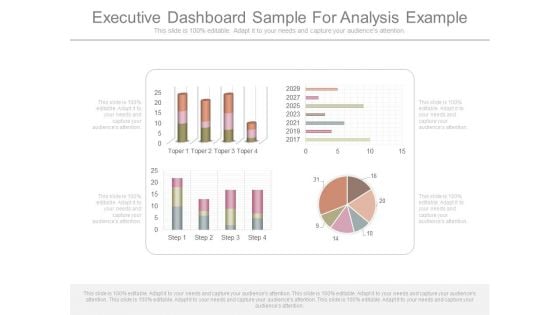
Executive Dashboard Sample For Analysis Example
This is a executive dashboard sample for analysis example. This is a four stage process. The stages in this process are topper, step.
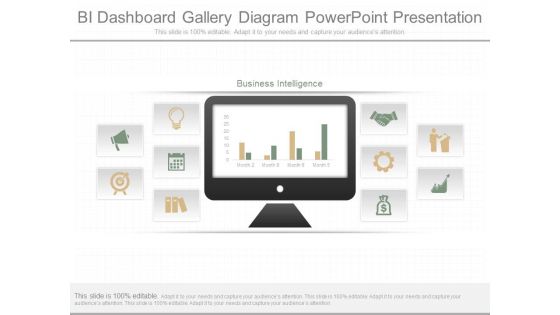
Bi Dashboard Gallery Diagram Powerpoint Presentation
This is a bi dashboard gallery diagram powerpoint presentation. This is a four stage process. The stages in this process are business intelligence, month.
Dashboard Ppt PowerPoint Presentation Icon Model
This is a dashboard ppt powerpoint presentation icon model. This is a four stage process. The stages in this process are percentage, finance, business, donut.
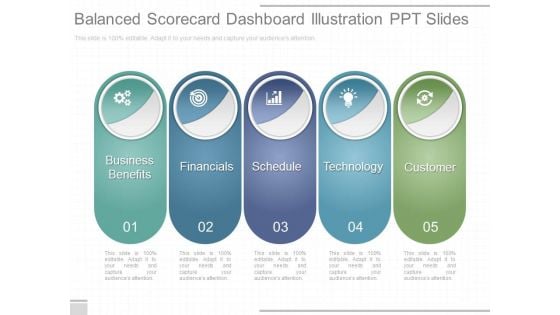
Balanced Scorecard Dashboard Illustration Ppt Slides
This is a balanced scorecard dashboard illustration ppt slides. This is a five stage process. The stages in this process are business benefits, financials, schedule, technology, customer.
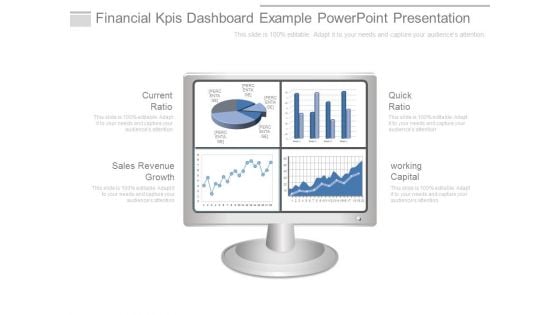
Financial Kpis Dashboard Example Powerpoint Presentation
This is a financial kpis dashboard example powerpoint presentation. This is a four stage process. The stages in this process are current ratio, sales revenue growth, quick ratio, working capital.
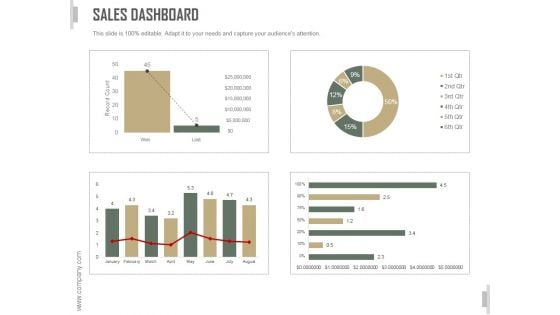
Sales Dashboard Slide Ppt PowerPoint Presentation Template
This is a sales dashboard slide ppt powerpoint presentation template. This is a three stage process. The stages in this process are business, strategy, marketing, analysis, bar graph, growth strategy.
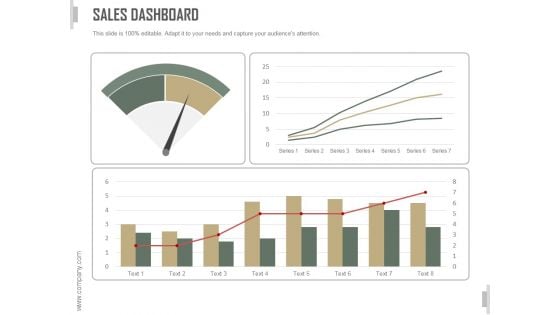
Sales Dashboard Ppt PowerPoint Presentation Design Templates
This is a sales dashboard ppt powerpoint presentation design templates. This is a four stage process. The stages in this process are business, strategy, marketing, analysis, bar graph, growth strategy.
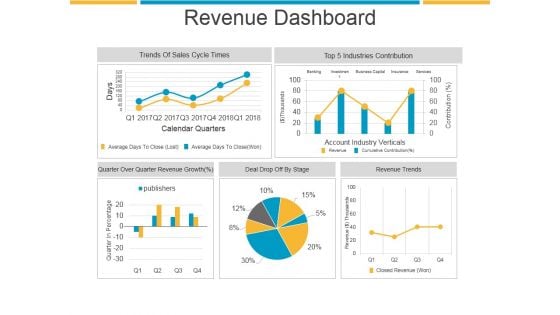
Revenue Dashboard Ppt PowerPoint Presentation Sample
This is a revenue dashboard ppt powerpoint presentation sample. This is a five stage process. The stages in this process are trends of sales cycle times, industries contribution, revenue trends, deal drop off by stage.
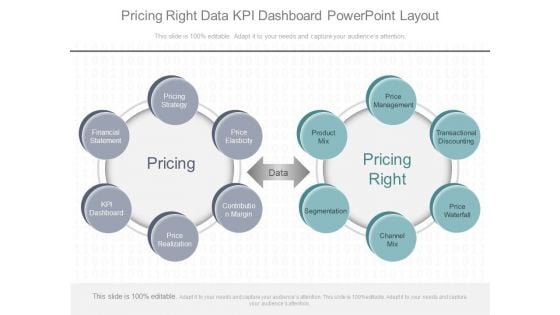
Pricing Right Data Kpi Dashboard Powerpoint Layout
This is a pricing right data kpi dashboard powerpoint layout. This is a two stage process. The stages in this process are price management, transactional discounting, price waterfall, channel mix, segmentation, product mix, price elasticity, contribution margin, price realization, kpi dashboard, financial statement, pricing, data, pricing right.
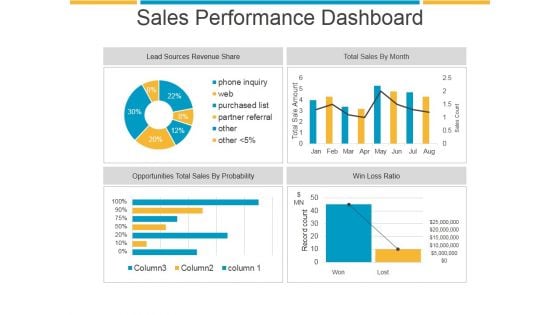
Sales Performance Dashboard Ppt PowerPoint Presentation Show
This is a sales performance dashboard ppt powerpoint presentation show. This is a four stage process. The stages in this process are lead sources revenue share, total sales by month, opportunities total sales by probability, win loss ratio.
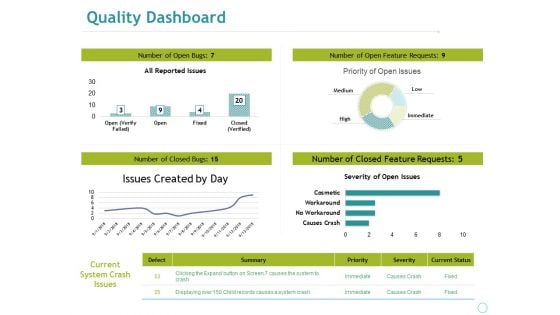
Quality Dashboard Ppt PowerPoint Presentation File Guide
This is a quality dashboard ppt powerpoint presentation file guide. This is a four stage process. The stages in this process are business, marketing, all reported issues, issues created by day, severity of open issues.

Agency Performance Dashboard Sample Of Ppt
This is a agency performance dashboard sample of ppt. This is a four stage process. The stages in this process are tra score, brand safety, view ability, ad fraud, industry snapshot.
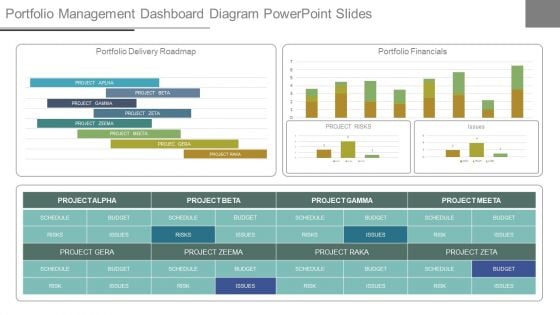
Portfolio Management Dashboard Diagram Powerpoint Slides
This is a portfolio management dashboard diagram powerpoint slides. This is a three stage process. The stages in this process are portfolio delivery roadmap, portfolio financials, project alpha, project beeta, project gama, project zeta, project zeema, schedule, risks, issues, budget.
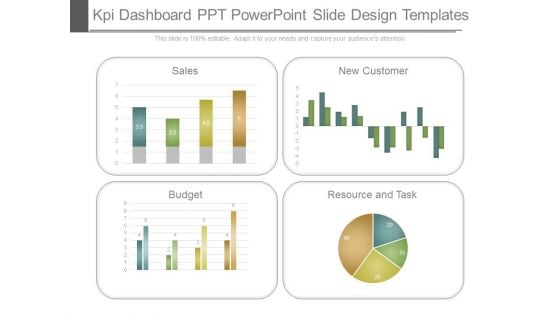
Kpi Dashboard Ppt Powerpoint Slide Design Templates
This is a kpi dashboard ppt powerpoint slide design templates. This is a four stage process. The stages in this process are sales, new customer, budget, resource and task.
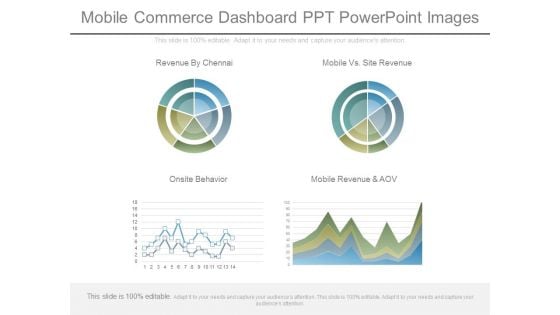
Mobile Commerce Dashboard Ppt Powerpoint Images
This is a mobile commerce dashboard ppt powerpoint images. This is a four stage process. The stages in this process are revenue by chennai, mobile vs site revenue, onsite behavior, mobile revenue and aov.
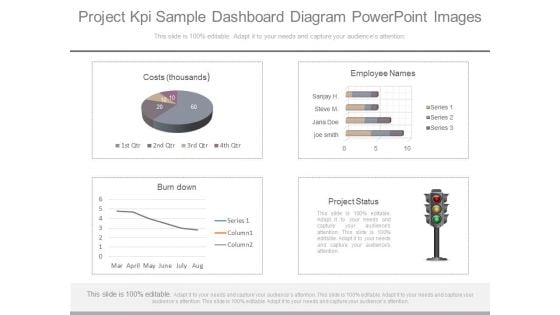
Project Kpi Sample Dashboard Diagram Powerpoint Images
This is a project kpi sample dashboard diagram powerpoint images. This is a four stage process. The stages in this process are costs thousands, employee names, burndown, project status.
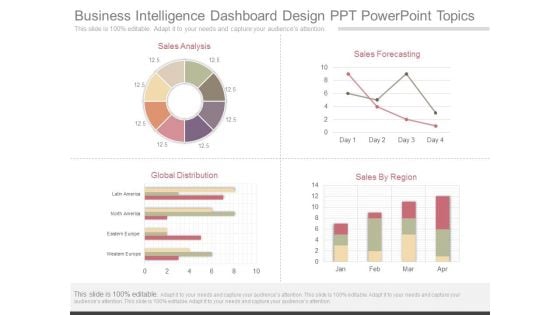
Business Intelligence Dashboard Design Ppt Powerpoint Topics
This is a business intelligence dashboard design ppt powerpoint topics. This is a four stage process. The stages in this process are sales analysis, sales forecasting, global distribution, sales by region, latin america, north america, eastern europe, western europe.
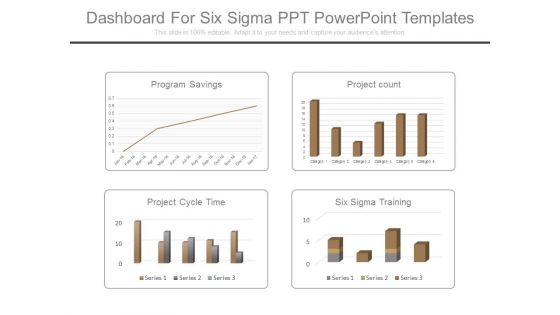
Dashboard For Six Sigma Ppt Powerpoint Templates
This is a dashboard for six sigma ppt powerpoint templates. This is a four stage process. The stages in this process are program savings, project count, project cycle time, six sigma training.

Email Program Dashboard Ppt Powerpoint Slides
This is a email program dashboard ppt powerpoint slides. This is a four stage process. The stages in this process are send test, clicks, clicks to open, summary, admin, administrator, chris, hssadmin.
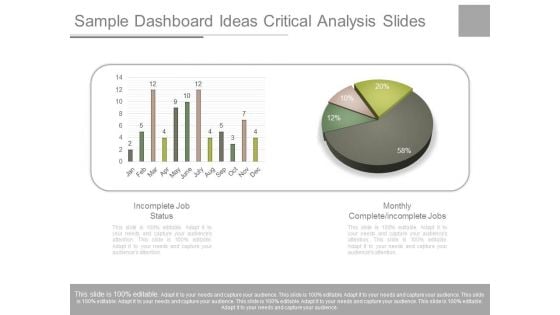
Sample Dashboard Ideas Critical Analysis Slides
This is a sample dashboard ideas critical analysis slides. This is a two stage process. The stages in this process are incomplete job status, monthly complete incomplete jobs, jan feb, mar, apr, may, june, july, aug, sep, oct, nov, dec.
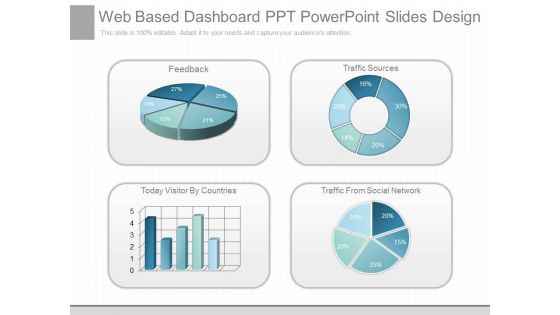
Web Based Dashboard Ppt Powerpoint Slides Design
This is a web based dashboard ppt powerpoint slides design. This is a four stage process. The stages in this process are feedback, traffic sources, today visitor by countries, traffic from social network.
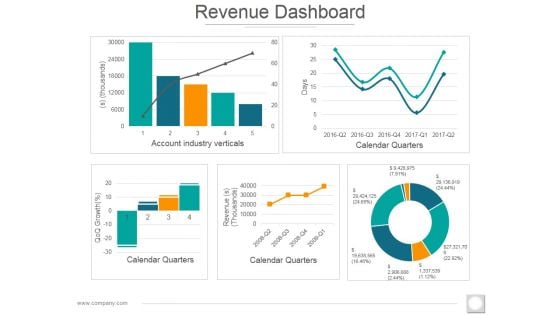
Revenue Dashboard Ppt PowerPoint Presentation Professional Microsoft
This is a revenue dashboard ppt powerpoint presentation professional microsoft. This is a five stage process. The stages in this process are account industry verticals, calendar quarters, revenue thousand, thousands.

Clear Point Community Dashboard Example Ppt Slide
This is a clear point community dashboard example ppt slide. This is a four stage process. The stages in this process are internal perspective, learning and growth, financial perspective, customer perspective.
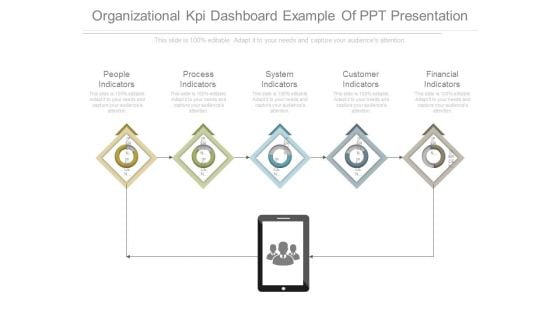
Organizational Kpi Dashboard Example Of Ppt Presentation
This is a organizational kpi dashboard example of ppt presentation. This is a five stage process. The stages in this process are people indicators, process indicators, system indicators, customer indicators, financial indicators.
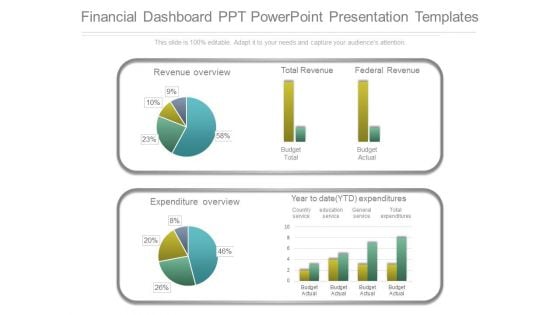
Financial Dashboard Ppt Powerpoint Presentation Templates
This is a financial dashboard ppt powerpoint presentation templates. This is a two stage process. The stages in this process are revenue overview, total revenue, federal revenue, budget total, budget actual, expenditure overview, year to date ytd expenditures, country service, education service, general service, total expenditures.
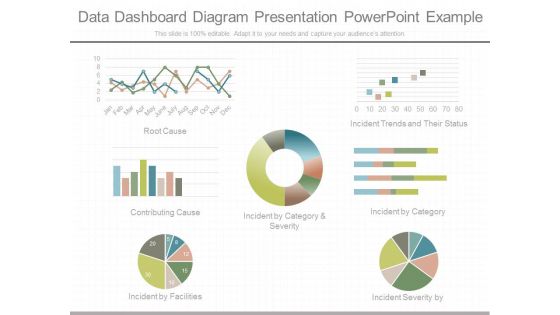
Data Dashboard Diagram Presentation Powerpoint Example
This is a data dashboard diagram presentation powerpoint example. This is a seven stage process. The stages in this process are root cause, incident trends and their status, contributing cause, incident by category and severity, incident by category, incident by facilities, incident severity by.

Balance Scorecard Index Dashboard Ppt Slides
This is a balance scorecard index dashboard ppt slides. This is a one stage process. The stages in this process are sales by month, gross revenue, customer retention, executive scorecard, measures, status, trend, financial, option, customer, internal processes, learning and growth.
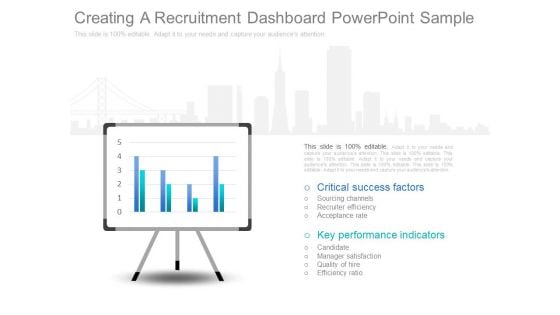
Creating A Recruitment Dashboard Powerpoint Sample
This is a creating a recruitment dashboard powerpoint sample. This is a two stage process. The stages in this process are critical success factors, sourcing channels, recruiter efficiency, acceptance rate, key performance indicators, candidate, manager satisfaction, quality of hire, efficiency ratio.
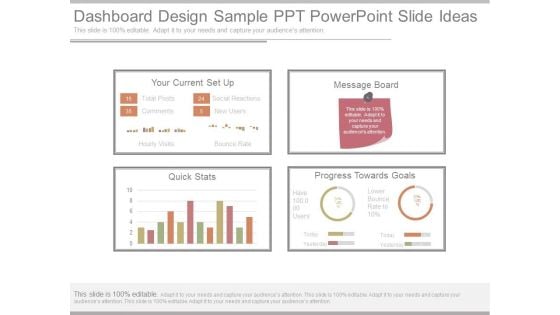
Dashboard Design Sample Ppt Powerpoint Slide Ideas
This is a dashboard design sample ppt powerpoint slide ideas. This is a four stage process. The stages in this process are your current setup, message board, quick stats, progress towards goals, total posts, comments, social reactions, new users, hourly visits, bounce rate.
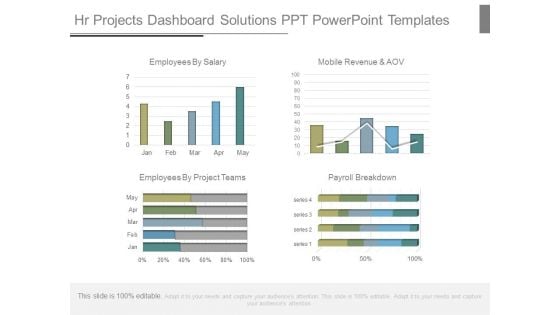
Hr Projects Dashboard Solutions Ppt Powerpoint Templates
This is a hr projects dashboard solutions ppt powerpoint templates. This is a four stage process. The stages in this process are employees by salary, mobile revenue and aov, employees by project teams, payroll breakdown, jan, feb, mar, apr, may, series.
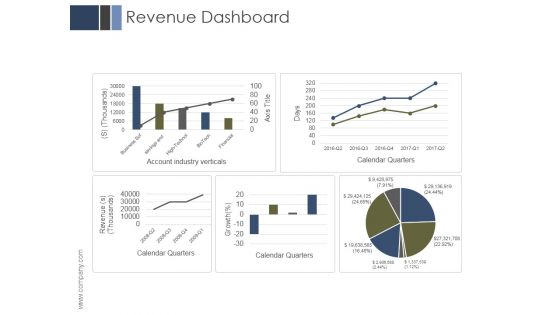
Revenue Dashboard Ppt PowerPoint Presentation Files
This is a revenue dashboard ppt powerpoint presentation files. This is a five stage process. The stages in this process are business, marketing, management, revenue, dashboard.
Dashboard Ppt PowerPoint Presentation Inspiration Icons
This is a dashboard ppt powerpoint presentation inspiration icons. This is a four stage process. The stages in this process are business, marketing, finance, planning, analysis.
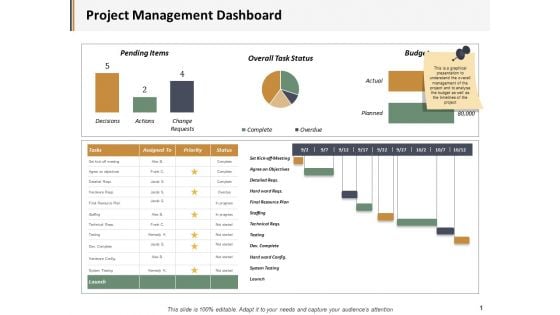
Project Management Dashboard Ppt PowerPoint Presentation Deck
This is a project management dashboard ppt powerpoint presentation deck. This is a five stage process. The stages in this process are business, management, marketing, percentage, product.
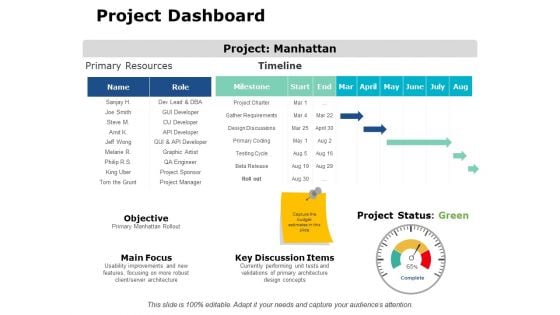
Project Dashboard Ppt PowerPoint Presentation Show Themes
This is a project dashboard ppt powerpoint presentation show themes. This is a eleven stage process. The stages in this process are finance, analysis, business, investment, marketing.
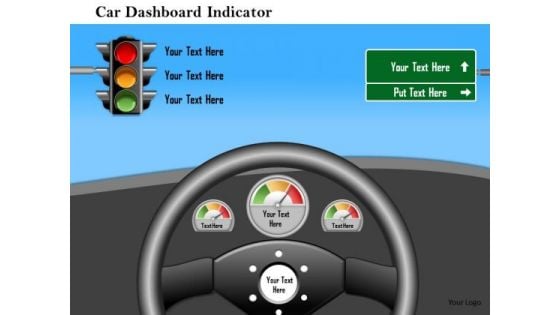
Business Framework Car Dashboard Indicator PowerPoint Presentation
Define the concept of target achievement and success with this exclusive PPT slide. To display this concept we have used graphic of target board and dart. This PPT slide also defines the concept of bull's eye condition. Use this PPT for business and marketing target related presentations.
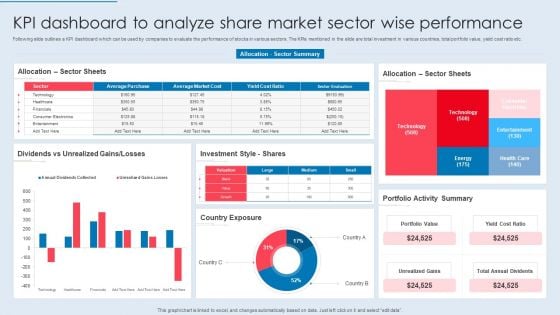
KPI Dashboard To Analyze Share Market Sector Wise Performance Summary PDF
Following slide outlines a KPI dashboard which can be used by companies to evaluate the performance of stocks in various sectors. The KPIs mentioned in the slide are total investment in various countries, total portfolio value, yield cost ratio etc. Pitch your topic with ease and precision using this KPI Dashboard To Analyze Share Market Sector Wise Performance Summary PDF. This layout presents information on Sector Sheets, Dividends Vs Unrealized, Investment Style. It is also available for immediate download and adjustment. So, changes can be made in the color, design, graphics or any other component to create a unique layout.

Market Entry Strategy Clubs Industry Analytics Dashboard For Gym Health And Fitness Clubs Summary PDF
This slide covers the Key performance indicators for analysing social media platforms, email campaigns and website performance. Presenting market entry strategy clubs industry analytics dashboard for gym health and fitness clubs summary pdf to provide visual cues and insights. Share and navigate important information on seven stages that need your due attention. This template can be used to pitch topics like Analytics Dashboard for Gym Health and Fitness Clubs. In addtion, this PPT design contains high-resolution images, graphics, etc, that are easily editable and available for immediate download.
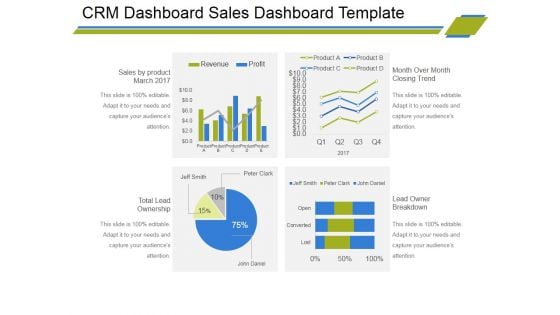
Crm Dashboard Sales Dashboard Template Ppt PowerPoint Presentation Portfolio Master Slide
This is a crm dashboard sales dashboard template ppt powerpoint presentation portfolio master slide. This is a four stage process. The stages in this process are sales by product march, total lead ownership, month over month closing trend, lead owner breakdown.
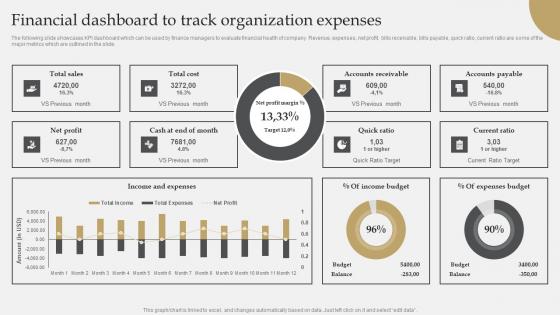
IT Industry Market Research Financial Dashboard To Track Organization Expenses Introduction Pdf
The following slide showcases KPI dashboard which can be used by finance managers to evaluate financial health of company. Revenue, expenses, net profit, bills receivable, bills payable, quick ratio, current ratio are some of the major metrics which are outlined in the slide. Present like a pro with IT Industry Market Research Financial Dashboard To Track Organization Expenses Introduction Pdf Create beautiful presentations together with your team, using our easy-to-use presentation slides. Share your ideas in real-time and make changes on the fly by downloading our templates. So whether you are in the office, on the go, or in a remote location, you can stay in sync with your team and present your ideas with confidence. With Slidegeeks presentation got a whole lot easier. Grab these presentations today. The following slide showcases KPI dashboard which can be used by finance managers to evaluate financial health of company. Revenue, expenses, net profit, bills receivable, bills payable, quick ratio, current ratio are some of the major metrics which are outlined in the slide.

Asset Assessment Dashboard With Cash Flow And Market Value Summary PDF
This slide illustrates asset valuation dashboard with key financial metrics. It provides information about cash flow, market value, intrinsic value, assumptions, market cap, discount rate, etc.Showcasing this set of slides titled Asset Assessment Dashboard With Cash Flow And Market Value Summary PDF. The topics addressed in these templates are Discount Rate, Capital Expenditure, Market Capitalization. All the content presented in this PPT design is completely editable. Download it and make adjustments in color, background, font etc. as per your unique business setting.
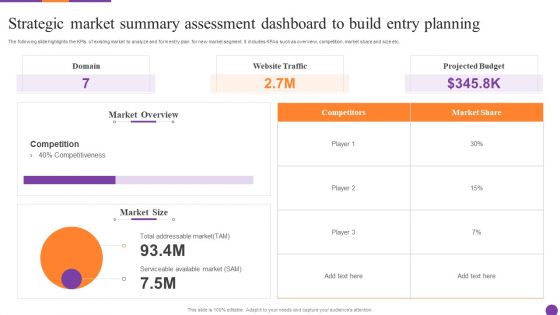
Strategic Market Summary Assessment Dashboard To Build Entry Planning Ppt Layouts Background Image PDF
The following slide highlights the KPIs of existing market to analyze and form entry plan for new market segment. It includes KPAs such as overview, competition, market share and size etc. Persuade your audience using this Strategic Market Summary Assessment Dashboard To Build Entry Planning Ppt Layouts Background Image PDF. This PPT design covers one stages, thus making it a great tool to use. It also caters to a variety of topics including Market Overview, Website Traffic, Projected Budget. Download this PPT design now to present a convincing pitch that not only emphasizes the topic but also showcases your presentation skills.
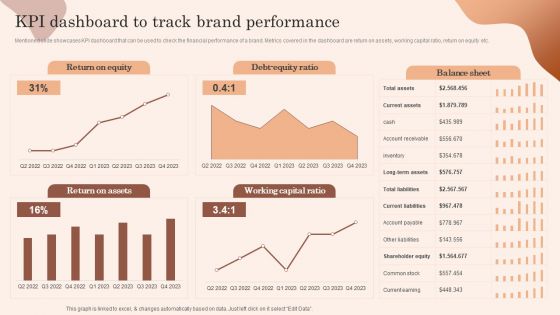
Building Market Brand Leadership Strategies Kpi Dashboard To Track Brand Performance Designs PDF
Mentioned slide showcases KPI dashboard that can be used to check the financial performance of a brand. Metrics covered in the dashboard are return on assets, working capital ratio, return on equity etc. There are so many reasons you need a Building Market Brand Leadership Strategies Kpi Dashboard To Track Brand Performance Designs PDF. The first reason is you cannot spend time making everything from scratch, Thus, Slidegeeks has made presentation templates for you too. You can easily download these templates from our website easily.
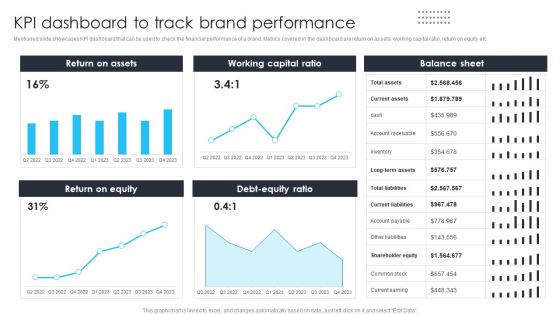
Building Brand Leadership Strategy To Dominate The Market KPI Dashboard To Track Brand Performance Formats PDF
Mentioned slide showcases KPI dashboard that can be used to check the financial performance of a brand. Metrics covered in the dashboard are return on assets, working capital ratio, return on equity etc.This Building Brand Leadership Strategy To Dominate The Market KPI Dashboard To Track Brand Performance Formats PDF is perfect for any presentation, be it in front of clients or colleagues. It is a versatile and stylish solution for organizing your meetings. The Building Brand Leadership Strategy To Dominate The Market KPI Dashboard To Track Brand Performance Formats PDF features a modern design for your presentation meetings. The adjustable and customizable slides provide unlimited possibilities for acing up your presentation. Slidegeeks has done all the homework before launching the product for you. So, dont wait, grab the presentation templates today
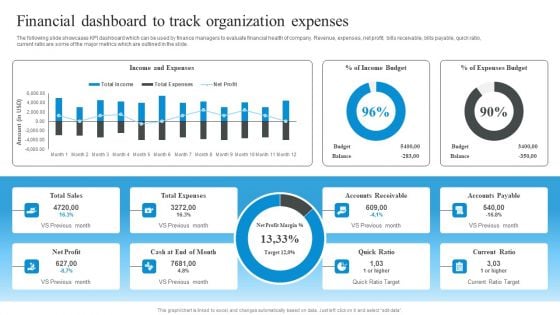
Market Evaluation Of IT Industry Financial Dashboard To Track Organization Expenses Clipart PDF
The following slide showcases KPI dashboard which can be used by finance managers to evaluate financial health of company. Revenue, expenses, net profit, bills receivable, bills payable, quick ratio, current ratio are some of the major metrics which are outlined in the slide. Do you have an important presentation coming up Are you looking for something that will make your presentation stand out from the rest Look no further than Market Evaluation Of IT Industry Financial Dashboard To Track Organization Expenses Clipart PDF. With our professional designs, you can trust that your presentation will pop and make delivering it a smooth process. And with Slidegeeks, you can trust that your presentation will be unique and memorable. So why wait Grab Market Evaluation Of IT Industry Financial Dashboard To Track Organization Expenses Clipart PDF today and make your presentation stand out from the rest.
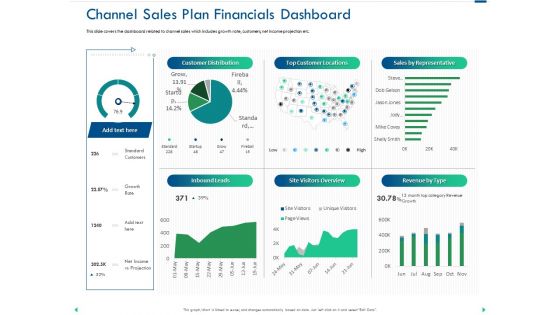
Channel Sales Taking Your Product To Market Channel Sales Plan Financials Dashboard Graphics PDF
Presenting this set of slides with name channel sales taking your product to market channel sales plan financials dashboard graphics pdf. The topics discussed in these slides are distribution, sales, representative, locations, revenue. This is a completely editable PowerPoint presentation and is available for immediate download. Download now and impress your audience.
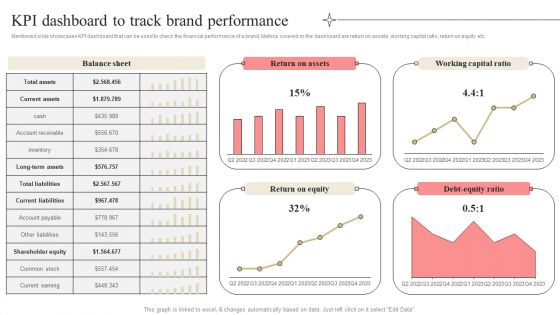
Developing Market Leading Businesses KPI Dashboard To Track Brand Performance Summary PDF
Mentioned slide showcases KPI dashboard that can be used to check the financial performance of a brand. Metrics covered in the dashboard are return on assets, working capital ratio, return on equity etc. Coming up with a presentation necessitates that the majority of the effort goes into the content and the message you intend to convey. The visuals of a PowerPoint presentation can only be effective if it supplements and supports the story that is being told. Keeping this in mind our experts created Developing Market Leading Businesses KPI Dashboard To Track Brand Performance Summary PDF to reduce the time that goes into designing the presentation. This way, you can concentrate on the message while our designers take care of providing you with the right template for the situation.
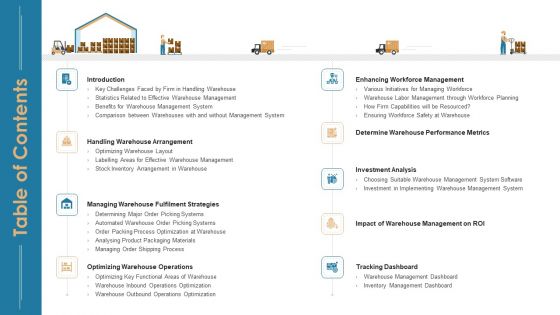
Stock Repository Management For Inventory Control Table Of Contents Ppt Infographics Example Topics PDF
Deliver an awe inspiring pitch with this creative stock repository management for inventory control table of contents ppt infographics example topics pdf bundle. Topics like optimizing warehouse operations, tracking dashboard, investment analysis can be discussed with this completely editable template. It is available for immediate download depending on the needs and requirements of the user.
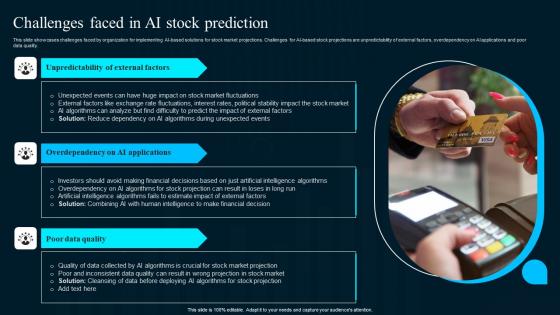
Challenges Faced In Ai Stock Prediction Artificial Intelligence Applications Ideas Pdf
This slide showcases challenges faced by organization for implementing AI-based solutions for stock market projections. Challenges for AI-based stock projections are unpredictability of external factors, overdependency on AI applications and poor data quality.Boost your pitch with our creative Challenges Faced In Ai Stock Prediction Artificial Intelligence Applications Ideas Pdf. Deliver an awe-inspiring pitch that will mesmerize everyone. Using these presentation templates you will surely catch everyones attention. You can browse the ppts collection on our website. We have researchers who are experts at creating the right content for the templates. So you do not have to invest time in any additional work. Just grab the template now and use them. This slide showcases challenges faced by organization for implementing AI based solutions for stock market projections. Challenges for AI based stock projections are unpredictability of external factors, overdependency on AI applications and poor data quality.
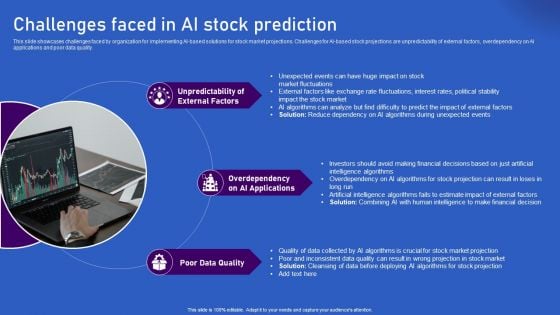
Ways Artificial Intelligence Is Transforming Finance Sector Challenges Faced In AI Stock Prediction Inspiration PDF
This slide showcases challenges faced by organization for implementing AI-based solutions for stock market projections. Challenges for AI-based stock projections are unpredictability of external factors, overdependency on AI applications and poor data quality. Do you have an important presentation coming up Are you looking for something that will make your presentation stand out from the rest Look no further than Ways Artificial Intelligence Is Transforming Finance Sector Challenges Faced In AI Stock Prediction Inspiration PDF. With our professional designs, you can trust that your presentation will pop and make delivering it a smooth process. And with Slidegeeks, you can trust that your presentation will be unique and memorable. So why wait Grab Ways Artificial Intelligence Is Transforming Finance Sector Challenges Faced In AI Stock Prediction Inspiration PDF today and make your presentation stand out from the rest.
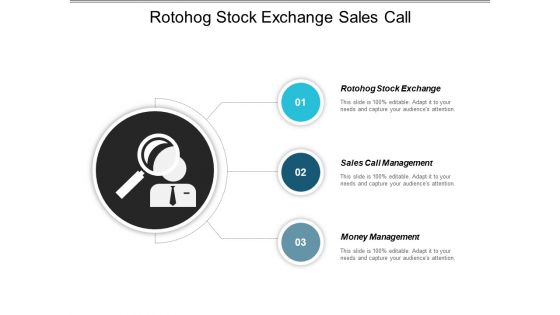
Roto Hog Stock Exchange Sales Call Management Money Management Ppt PowerPoint Presentation Gallery Graphics Design
This is a roto hog stock exchange sales call management money management ppt powerpoint presentation gallery graphics design. This is a three stage process. The stages in this process are roto hog stock exchange, sales call management, money management.
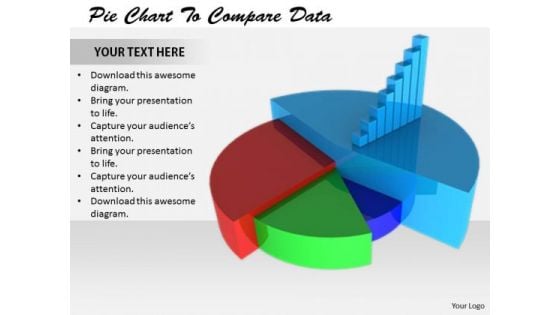
Stock Photo Corporate Business Strategy Pie Chart To Compare Data Best
Our stock photo corporate business strategy pie chart to compare data best ensure the force is with you. They enhance the energy in you. Our marketing help ideas come into force. They encourage the audience to commence action.
Stock Audit Report Vector Icon Ppt Powerpoint Presentation Styles Example Introduction
Presenting this set of slides with name stock audit report vector icon ppt powerpoint presentation styles example introduction. This is a one stage process. The stages in this process are logistics icon, international delivery, cargo truck. This is a completely editable PowerPoint presentation and is available for immediate download. Download now and impress your audience.
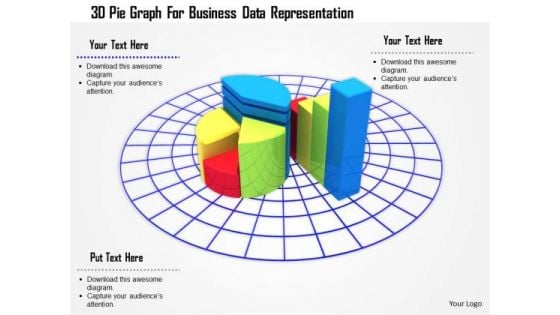
Stock Photo 3d Pie Graph For Business Data Representation PowerPoint Slide
3D business graph has been used to design this PowerPoint template. This Image slide is suitable to make business reports and charts. This slide can be used for business and marketing presentations.
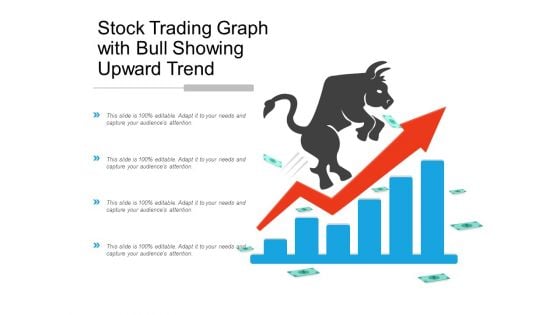
Stock Trading Graph With Bull Showing Upward Trend Ppt Powerpoint Presentation Pictures Outfit
This is a stock trading graph with bull showing upward trend ppt powerpoint presentation pictures outfit. This is a four stage process. The stages in this process are stock market, financial market, bull market.
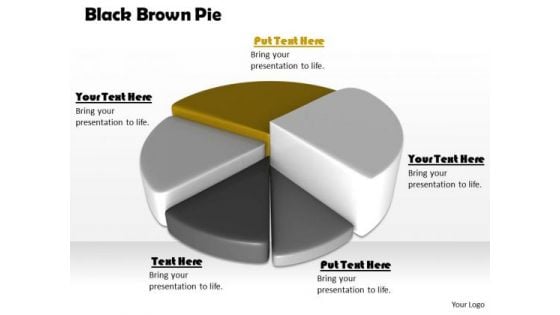
Stock Photo Black Brown Pie Chart For Business Result PowerPoint Slide
This high quality image is designed with pie chart. Use this image to make business reports. Use this outstanding image in presentations relating to data analysis and reports. Go ahead and add charm to your presentations.
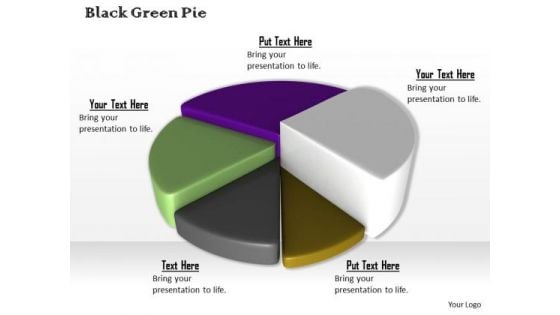
Stock Photo Colorful 3d Pie Chart For Business Result PowerPoint Slide
This high quality image is designed with pie chart. Use this image to make business reports. Use this outstanding image in presentations relating to data analysis and reports. Go ahead and add charm to your presentations.


 Continue with Email

 Home
Home


