Dashboards
Data Warehousing And Data Mining Applications In Banks And Financial Institutions AI SS V
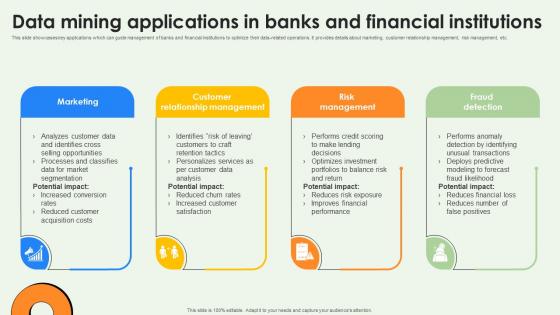
This slide showcases key applications which can guide management of banks and financial institutions to optimize their data-related operations. It provides details about marketing, customer relationship management, risk management, etc. Here you can discover an assortment of the finest PowerPoint and Google Slides templates. With these templates, you can create presentations for a variety of purposes while simultaneously providing your audience with an eye-catching visual experience. Download Data Warehousing And Data Mining Applications In Banks And Financial Institutions AI SS V to deliver an impeccable presentation. These templates will make your job of preparing presentations much quicker, yet still, maintain a high level of quality. Slidegeeks has experienced researchers who prepare these templates and write high-quality content for you. Later on, you can personalize the content by editing the Data Warehousing And Data Mining Applications In Banks And Financial Institutions AI SS V. This slide showcases key applications which can guide management of banks and financial institutions to optimize their data-related operations. It provides details about marketing, customer relationship management, risk management, etc.
Social Platforms Data Analysis Marketing Global Trends Statistical Data Rules PDF
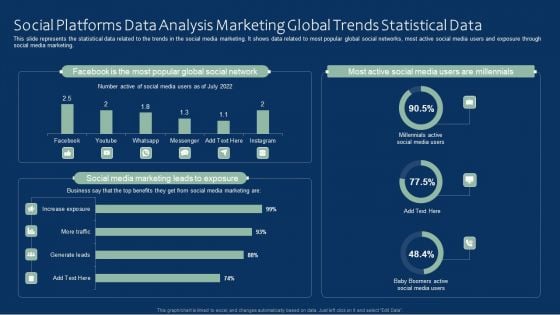
This slide represents the statistical data related to the trends in the social media marketing. It shows data related to most popular global social networks, most active social media users and exposure through social media marketing. Pitch your topic with ease and precision using this Social Platforms Data Analysis Marketing Global Trends Statistical Data Rules PDF. This layout presents information on Social Platforms Data Analysis, Marketing Global, Trends Statistical Data. It is also available for immediate download and adjustment. So, changes can be made in the color, design, graphics or any other component to create a unique layout.
Freelance Content Marketing Key Performance Indicator Metrics Slides PDF
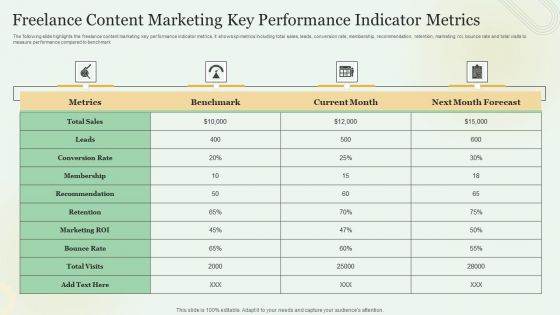
The following slide highlights the freelance content marketing key performance indicator metrics. It shows kpi metrics including total sales, leads, conversion rate, membership, recommendation, retention, marketing roi, bounce rate and total visits to measure performance compared to benchmark. Pitch your topic with ease and precision using this Freelance Content Marketing Key Performance Indicator Metrics Slides PDF. This layout presents information on Total Sales, Conversion Rate, Bounce Rate. It is also available for immediate download and adjustment. So, changes can be made in the color, design, graphics or any other component to create a unique layout.
Statistical Data Analysis Process Data Description Ppt Example
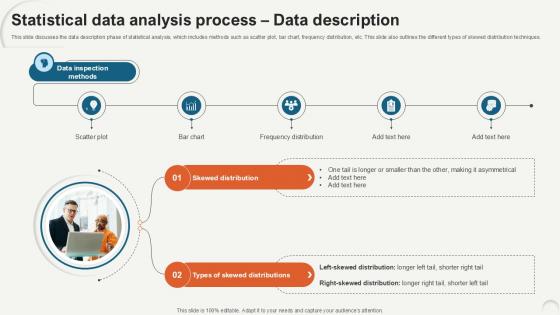
This slide discusses the data description phase of statistical analysis, which includes methods such as scatter plot, bar chart, frequency distribution, etc. This slide also outlines the different types of skewed distribution techniques. Create an editable Statistical Data Analysis Process Data Description Ppt Example that communicates your idea and engages your audience. Whether you are presenting a business or an educational presentation, pre-designed presentation templates help save time. Statistical Data Analysis Process Data Description Ppt Example is highly customizable and very easy to edit, covering many different styles from creative to business presentations. Slidegeeks has creative team members who have crafted amazing templates. So, go and get them without any delay. This slide discusses the data description phase of statistical analysis, which includes methods such as scatter plot, bar chart, frequency distribution, etc. This slide also outlines the different types of skewed distribution techniques.
Success Metrics For Data Analytics Speculation Business Analysis Modification Toolkit Icons PDF
This slide shows the key success factors for evaluating the success of data analytics program. The foremost key metrics includes discovery, insights, outcomes and actions.Presenting Success Metrics For Data Analytics Speculation Business Analysis Modification Toolkit Icons PDF to provide visual cues and insights. Share and navigate important information on four stages that need your due attention. This template can be used to pitch topics like Observations Information, Generate Insights, Keys Success. In addtion, this PPT design contains high resolution images, graphics, etc, that are easily editable and available for immediate download.

Data Management With Augmented Technologies Workflows Using Artificial Intelligence Information Pdf
The following slide highlights workflow of augmented data management utilizing artificial intelligence responding to real time changes in markets. It includes components such as preparing augmented data, share operational findings and identify patterns in data and building models. Pitch your topic with ease and precision using this Data Management With Augmented Technologies Workflows Using Artificial Intelligence Information Pdf. This layout presents information on Preparing Augmented Data, Share Operational Findings, Identify Patterns. It is also available for immediate download and adjustment. So, changes can be made in the color, design, graphics or any other component to create a unique layout. The following slide highlights workflow of augmented data management utilizing artificial intelligence responding to real time changes in markets. It includes components such as preparing augmented data, share operational findings and identify patterns in data and building models.

Five Ways To Maximize Digital Marketing Efficiency Ppt PowerPoint Presentation Summary Brochure
Presenting this set of slides with name five ways to maximize digital marketing efficiency ppt powerpoint presentation summary brochure. The topics discussed in these slides are data sources, database management, marketing. This is a completely editable PowerPoint presentation and is available for immediate download. Download now and impress your audience.
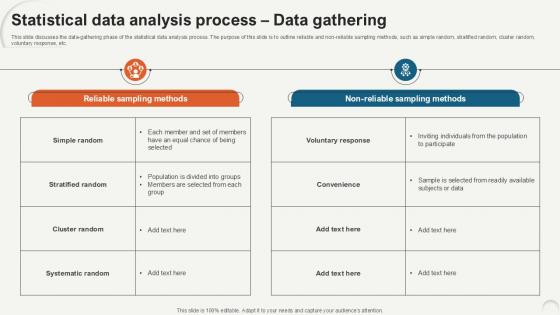
Statistical Data Analysis Process Data Gathering Ppt Example
This slide discusses the data-gathering phase of the statistical data analysis process. The purpose of this slide is to outline reliable and non-reliable sampling methods, such as simple random, stratified random, cluster random, voluntary response, etc. Slidegeeks is one of the best resources for PowerPoint templates. You can download easily and regulate Statistical Data Analysis Process Data Gathering Ppt Example for your personal presentations from our wonderful collection. A few clicks is all it takes to discover and get the most relevant and appropriate templates. Use our Templates to add a unique zing and appeal to your presentation and meetings. All the slides are easy to edit and you can use them even for advertisement purposes. This slide discusses the data-gathering phase of the statistical data analysis process. The purpose of this slide is to outline reliable and non-reliable sampling methods, such as simple random, stratified random, cluster random, voluntary response, etc.
File Transfer Data Management Vector Icon Ppt PowerPoint Presentation File Graphic Images
Presenting this set of slides with name file transfer data management vector icon ppt powerpoint presentation file graphic images. The topics discussed in these slides are data sources, database management, marketing. This is a completely editable PowerPoint presentation and is available for immediate download. Download now and impress your audience.
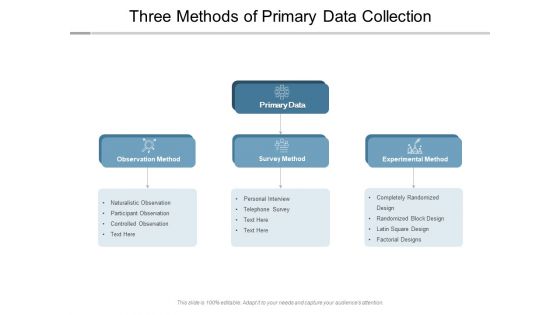
Three Methods Of Primary Data Collection Ppt PowerPoint Presentation Infographics Graphics Design
Presenting this set of slides with name three methods of primary data collection ppt powerpoint presentation infographics graphics design. The topics discussed in these slides are data sources, database management, marketing. This is a completely editable PowerPoint presentation and is available for immediate download. Download now and impress your audience.
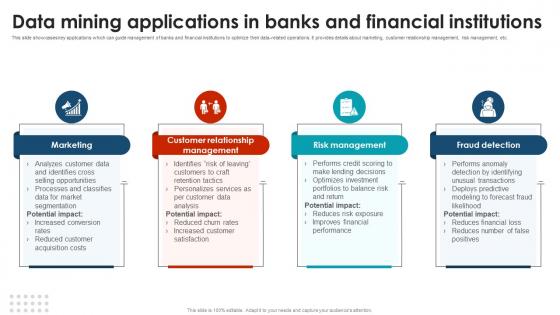
Data Mining Applications In Banks And Financial Using Data Mining Tools To Optimize Processes AI SS V
This slide showcases key applications which can guide management of banks and financial institutions to optimize their data-related operations. It provides details about marketing, customer relationship management, risk management, etc. Whether you have daily or monthly meetings, a brilliant presentation is necessary. Data Mining Applications In Banks And Financial Using Data Mining Tools To Optimize Processes AI SS V can be your best option for delivering a presentation. Represent everything in detail using Data Mining Applications In Banks And Financial Using Data Mining Tools To Optimize Processes AI SS V and make yourself stand out in meetings. The template is versatile and follows a structure that will cater to your requirements. All the templates prepared by Slidegeeks are easy to download and edit. Our research experts have taken care of the corporate themes as well. So, give it a try and see the results. This slide showcases key applications which can guide management of banks and financial institutions to optimize their data-related operations. It provides details about marketing, customer relationship management, risk management, etc.
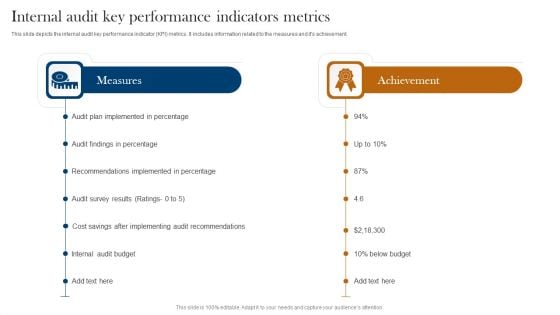
Internal Audit Key Performance Indicators Metrics Inspiration PDF
This slide depicts the internal audit key performance indicator KPI metrics. It includes information related to the measures and its achievement. Persuade your audience using this Internal Audit Key Performance Indicators Metrics Inspiration PDF. This PPT design covers two stages, thus making it a great tool to use. It also caters to a variety of topics including Measures, Achievement, Audit Findings Percentage. Download this PPT design now to present a convincing pitch that not only emphasizes the topic but also showcases your presentation skills.
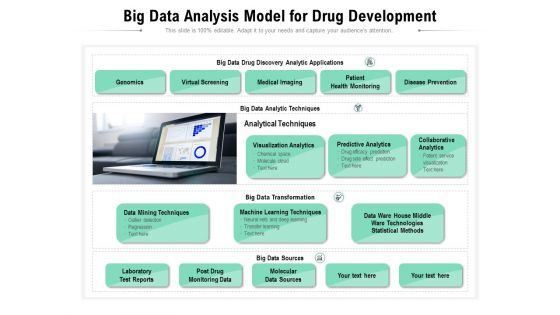
Big Data Analysis Model For Drug Development Ppt PowerPoint Presentation Show Vector PDF
Presenting this set of slides with name big data analysis model for drug development ppt powerpoint presentation show vector pdf. This is a four stage process. The stages in this process are genomics, virtual screening, medical imaging, patient health monitoring, disease prevention, data mining techniques, machine learning techniques, big data sources, laboratory test reports, molecular, data sources. This is a completely editable PowerPoint presentation and is available for immediate download. Download now and impress your audience.
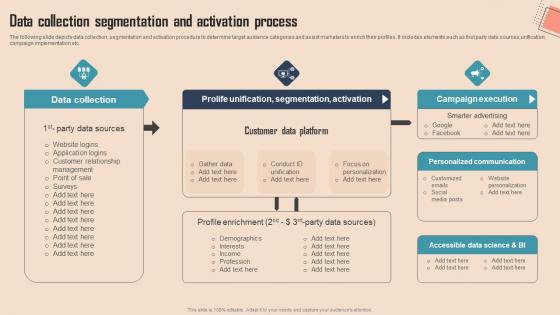
Data Collection Segmentation And Comprehensive CDP Guide For Promoters Structure Pdf
The following slide depicts data collection, segmentation and activation procedure to determine target audience categories and assist marketers to enrich their profiles. It includes elements such as first party data sources,unification, campaign implementation etc.Do you have an important presentation coming up Are you looking for something that will make your presentation stand out from the rest Look no further than Data Collection Segmentation And Comprehensive CDP Guide For Promoters Structure Pdf. With our professional designs, you can trust that your presentation will pop and make delivering it a smooth process. And with Slidegeeks, you can trust that your presentation will be unique and memorable. So why wait Grab XXXXXXXXXXXXXX today and make your presentation stand out from the rest. The following slide depicts data collection, segmentation and activation procedure to determine target audience categories and assist marketers to enrich their profiles. It includes elements such as first party data sources,unification, campaign implementation etc.
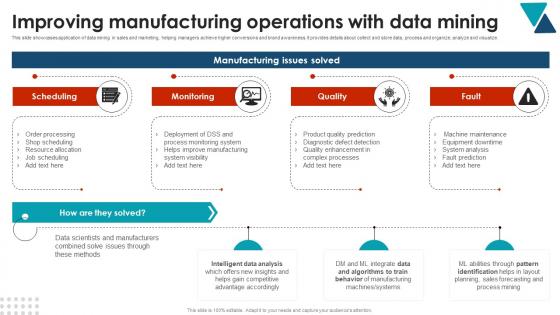
Improving Manufacturing Operations With Using Data Mining Tools To Optimize Processes AI SS V
This slide showcases application of data mining in sales and marketing, helping managers achieve higher conversions and brand awareness. It provides details about collect and store data, process and organize, analyze and visualize. Welcome to our selection of the Improving Manufacturing Operations With Using Data Mining Tools To Optimize Processes AI SS V. These are designed to help you showcase your creativity and bring your sphere to life. Planning and Innovation are essential for any business that is just starting out. This collection contains the designs that you need for your everyday presentations. All of our PowerPoints are 100Percent editable, so you can customize them to suit your needs. This multi-purpose template can be used in various situations. Grab these presentation templates today. This slide showcases application of data mining in sales and marketing, helping managers achieve higher conversions and brand awareness. It provides details about collect and store data, process and organize, analyze and visualize.
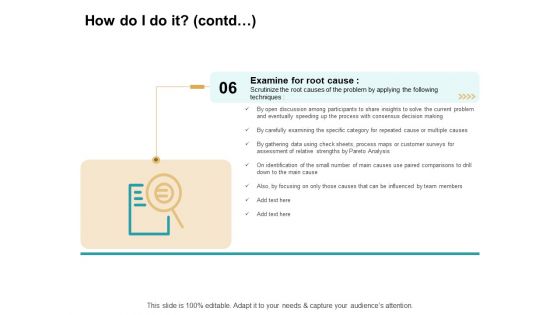
Cause And Effect For Business Problem Solution How Do I Do It Contd Gathering Background PDF
This is a cause and effect for business problem solution how do i do it contd gathering background pdf template with various stages. Focus and dispense information on one stages using this creative set, that comes with editable features. It contains large content boxes to add your information on topics like techniques, decision making, comparisons, analysis. You can also showcase facts, figures, and other relevant content using this PPT layout. Grab it now.
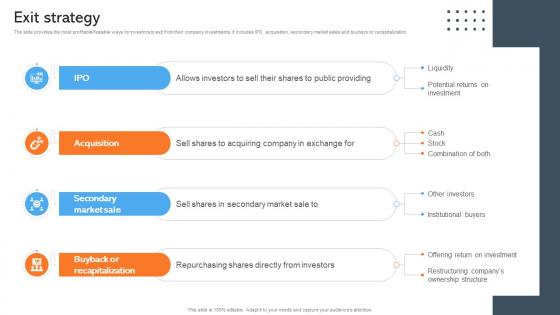
Exit Strategy Data Management Company Investor Funding Pitch Deck
The slide provides the most profitable or feasible ways for investors to exit from their company investments. It includes IPO, acquisition, secondary market sales and buyback or recapitalization. From laying roadmaps to briefing everything in detail, our templates are perfect for you. You can set the stage with your presentation slides. All you have to do is download these easy-to-edit and customizable templates. Exit Strategy Data Management Company Investor Funding Pitch Deck will help you deliver an outstanding performance that everyone would remember and praise you for. Do download this presentation today. The slide provides the most profitable or feasible ways for investors to exit from their company investments. It includes IPO, acquisition, secondary market sales and buyback or recapitalization.
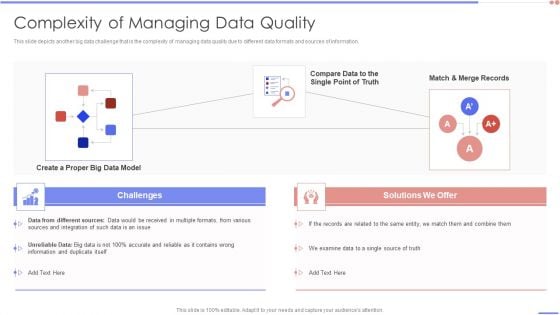
Data Analytics Management Complexity Of Managing Data Quality Summary PDF
This slide depicts another big data challenge that is the complexity of managing data quality due to different data formats and sources of information.Deliver an awe inspiring pitch with this creative Data Analytics Management Complexity Of Managing Data Quality Summary PDF bundle. Topics like Received In Multiple, Accurate Reliable, Information Duplicate can be discussed with this completely editable template. It is available for immediate download depending on the needs and requirements of the user.
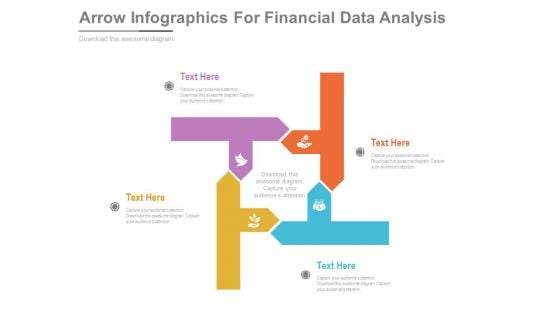
Arrow Infographics For Financial Data Analysis Powerpoint Template
This PowerPoint slide contains diagram of arrows infographic. This professional slide helps to exhibit financial data analysis for business growth. Use this PowerPoint template to make impressive presentations.
Employee Performance Evaluation Budgeting Icon Infographics Pdf
Pitch your topic with ease and precision using this Employee Performance Evaluation Budgeting Icon Infographics Pdf This layout presents information on Employee Performance, Evaluation Budgeting Icon It is also available for immediate download and adjustment. So, changes can be made in the color, design, graphics or any other component to create a unique layout. Our Employee Performance Evaluation Budgeting Icon Infographics Pdf are topically designed to provide an attractive backdrop to any subject. Use them to look like a presentation pro.
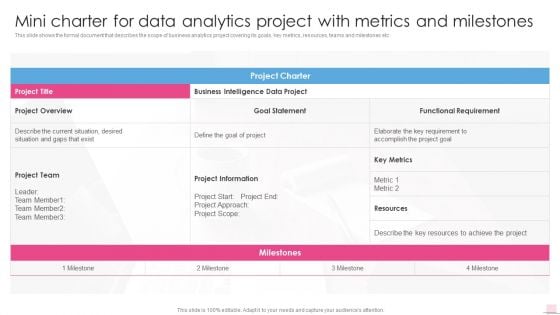
Mini Charter For Data Analytics Project With Metrics Business Analysis Modification Toolkit Infographics PDF
This slide shows the formal document that describes the scope of business analytics project covering its goals, key metrics, resources, teams and milestones etc.Deliver and pitch your topic in the best possible manner with this Mini Charter For Data Analytics Project With Metrics Business Analysis Modification Toolkit Infographics PDF. Use them to share invaluable insights on Business Intelligence, Functional Requirement, Project Information and impress your audience. This template can be altered and modified as per your expectations. So, grab it now.
Using GPT 4 For Generating Data Driven Insights Ppt Infographic Template Slide Portrait Pdf
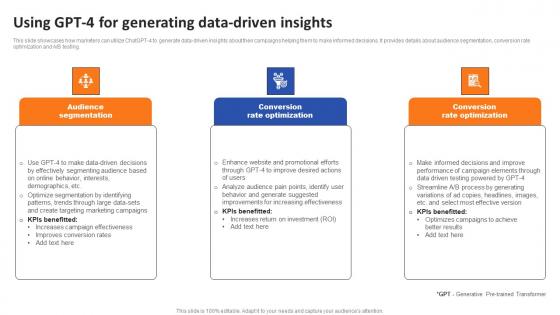
This slide showcases how marketers can utilize ChatGPT-4 to generate data-driven insights about their campaigns helping them to make informed decisions. It provides details about audience segmentation, conversion rate optimization and A OR B testing. Boost your pitch with our creative Using GPT 4 For Generating Data Driven Insights Ppt Infographic Template Slide Portrait Pdf. Deliver an awe-inspiring pitch that will mesmerize everyone. Using these presentation templates you will surely catch everyones attention. You can browse the ppts collection on our website. We have researchers who are experts at creating the right content for the templates. So you do not have to invest time in any additional work. Just grab the template now and use them. This slide showcases how marketers can utilize ChatGPT-4 to generate data-driven insights about their campaigns helping them to make informed decisions. It provides details about audience segmentation, conversion rate optimization and A OR B testing.
Comparative Analysis Of Data Quality Procedure Tools Mockup Pdf
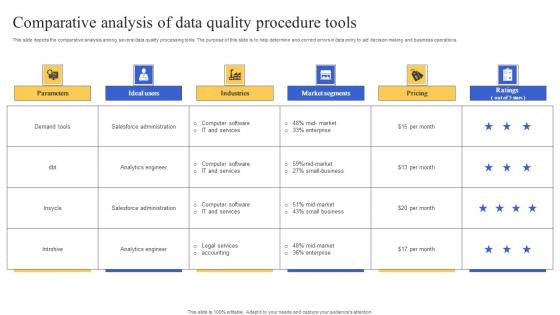
This slide depicts the comparative analysis among several data quality processing tools. The purpose of this slide is to help determine and correct errors in data entry to aid decision making and business operations. Pitch your topic with ease and precision using this Comparative Analysis Of Data Quality Procedure Tools Mockup Pdf. This layout presents information on Comparative Analysis, Data Quality Procedure Tools, Decision Making, Business Operations. It is also available for immediate download and adjustment. So, changes can be made in the color, design, graphics or any other component to create a unique layout. This slide depicts the comparative analysis among several data quality processing tools. The purpose of this slide is to help determine and correct errors in data entry to aid decision making and business operations.
Pyramid Showing Key Performance Indicators Of Human Resource Department KPI Ppt PowerPoint Presentation Infographics Samples PDF
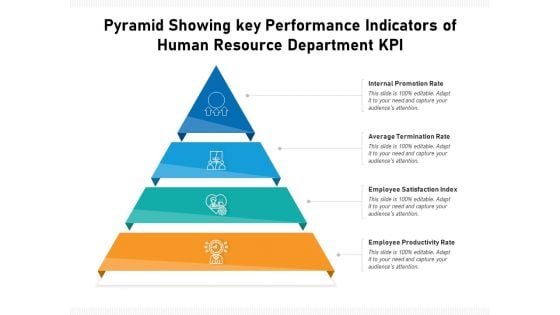
Persuade your audience using this pyramid showing key performance indicators of human resource department kpi ppt powerpoint presentation infographics samples pdf. This PPT design covers four stages, thus making it a great tool to use. It also caters to a variety of topics including internal promotion rate, average termination rate, employee satisfaction index, employee productivity rate. Download this PPT design now to present a convincing pitch that not only emphasizes the topic but also showcases your presentation skills.
Key Skills For Better Work Performance Powerpoint Shapes
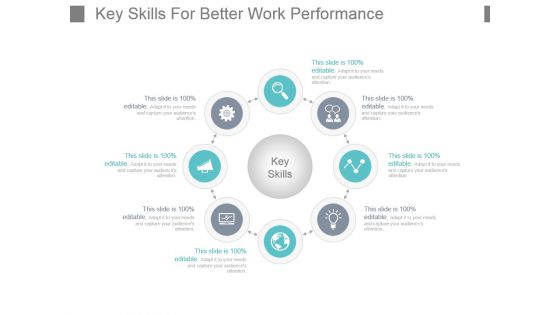
This is a key skills for better work performance powerpoint shapes. This is a four stage process. The stages in this process are key skills, flow, process, circle, icons.
Text Mining Structure Showcasing Data Analysis Icon Microsoft Pdf
Showcasing this set of slides titled Text Mining Structure Showcasing Data Analysis Icon Microsoft Pdf. The topics addressed in these templates are Text Mining Structure, Showcasing Data Analysis Icon. All the content presented in this PPT design is completely editable. Download it and make adjustments in color, background, font etc. as per your unique business setting. Our Text Mining Structure Showcasing Data Analysis Icon Microsoft Pdf are topically designed to provide an attractive backdrop to any subject. Use them to look like a presentation pro.
Data Analysis In Powerpoint And Google Slides Cpb
Presenting our innovatively designed set of slides titled Data Analysis In Powerpoint And Google Slides Cpb. This completely editable PowerPoint graphic exhibits Data Analysis that will help you convey the message impactfully. It can be accessed with Google Slides and is available in both standard screen and widescreen aspect ratios. Apart from this, you can download this well structured PowerPoint template design in different formats like PDF, JPG, and PNG. So, click the download button now to gain full access to this PPT design. Our Data Analysis In Powerpoint And Google Slides Cpb are topically designed to provide an attractive backdrop to any subject. Use them to look like a presentation pro.
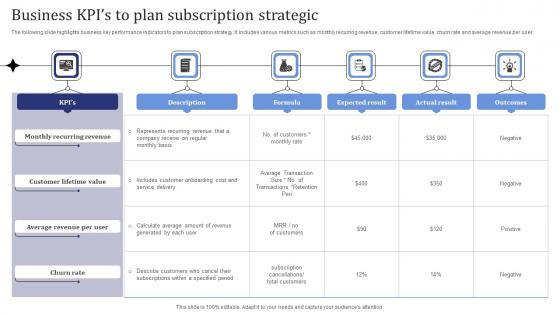
Business Kpis To Plan Subscription Strategic Pictures Pdf
The following slide highlights business key performance indicators to plan subscription strategy. It includes various metrics such as monthly recurring revenue, customer lifetime value, churn rate and average revenue per user. Showcasing this set of slides titled Business Kpis To Plan Subscription Strategic Pictures Pdf. The topics addressed in these templates are Monthly Recurring Revenue, Customer Lifetime Value, Churn Rate. All the content presented in this PPT design is completely editable. Download it and make adjustments in color, background, font etc. as per your unique business setting. The following slide highlights business key performance indicators to plan subscription strategy. It includes various metrics such as monthly recurring revenue, customer lifetime value, churn rate and average revenue per user.
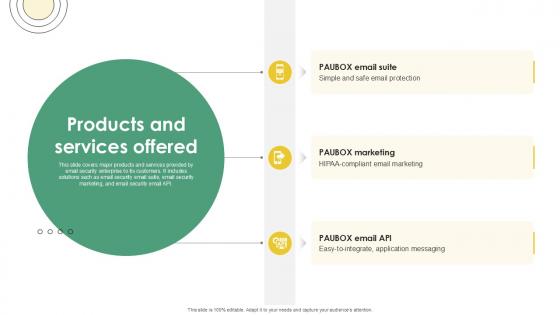
Products And Services Offered Email And Data Protection Platform Capital Funding Pitch Deck PPT Slide
This slide covers major products and services provided by email security enterprise to its customers. It includes solutions such as email security email suite, email security marketing, and email security email API. Coming up with a presentation necessitates that the majority of the effort goes into the content and the message you intend to convey. The visuals of a PowerPoint presentation can only be effective if it supplements and supports the story that is being told. Keeping this in mind our experts created Products And Services Offered Email And Data Protection Platform Capital Funding Pitch Deck PPT Slide to reduce the time that goes into designing the presentation. This way, you can concentrate on the message while our designers take care of providing you with the right template for the situation. This slide covers major products and services provided by email security enterprise to its customers. It includes solutions such as email security email suite, email security marketing, and email security email API.
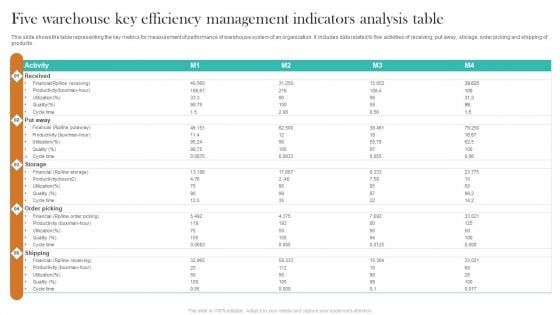
Five Warehouse Key Efficiency Management Indicators Analysis Table Demonstration PDF
This slide shows the table representing the key metrics for measurement of performance of warehouse system of an organization. It includes data related to five activities of receiving, put away, storage, order picking and shipping of products. Showcasing this set of slides titled Five Warehouse Key Efficiency Management Indicators Analysis Table Demonstration PDF. The topics addressed in these templates are Activity, Received, Storage. All the content presented in this PPT design is completely editable. Download it and make adjustments in color, background, font etc. as per your unique business setting.
IT Security Analysis Icon With Magnifying Glass Introduction PDF
Presenting IT Security Analysis Icon With Magnifying Glass Introduction PDF to dispense important information. This template comprises three stages. It also presents valuable insights into the topics including IT Security Analysis Icon, Magnifying Glass. This is a completely customizable PowerPoint theme that can be put to use immediately. So, download it and address the topic impactfully.
Macro Environmental Level Threat Detection And Analysis Icon Demonstration PDF
Presenting Macro Environmental Level Threat Detection And Analysis Icon Demonstration PDF to dispense important information. This template comprises three stages. It also presents valuable insights into the topics including Macro Environmental, Level Threat, Detection And Analysis. This is a completely customizable PowerPoint theme that can be put to use immediately. So, download it and address the topic impactfully.

Marketers Guide To Data Analysis Optimization Introduction To SEO Analytics For Improving Websites Organic Structure PDF
This slide covers an overview of search engine optimization analytics. It also includes steps to perform website SEO analytics, such as checking the speed of your website, identifying your key competitors, analyzing best-performing pages, performing a competition backlink profile analysis, etc. The Marketers Guide To Data Analysis Optimization Introduction To SEO Analytics For Improving Websites Organic Structure PDF is a compilation of the most recent design trends as a series of slides. It is suitable for any subject or industry presentation, containing attractive visuals and photo spots for businesses to clearly express their messages. This template contains a variety of slides for the user to input data, such as structures to contrast two elements, bullet points, and slides for written information. Slidegeeks is prepared to create an impression.

Data Lake Architecture Future Of Data Analysis Key Concepts Of Data Lake Architecture Professional PDF
This slide depicts the key concepts of data lake, including data ingestion, data exploration, data lineage, data storage, data auditing, data discovery, data quality and so on.Presenting Data Lake Architecture Future Of Data Analysis Key Concepts Of Data Lake Architecture Professional PDF to provide visual cues and insights. Share and navigate important information on ten stages that need your due attention. This template can be used to pitch topics like Data Ingestion, Data Exploration, Data Lineage. In addtion, this PPT design contains high resolution images, graphics, etc, that are easily editable and available for immediate download.
Human Resource Management Analysis And Audit System Icon Infographics PDF
Persuade your audience using this Human Resource Management Analysis And Audit System Icon Infographics PDF. This PPT design covers three sstages, thus making it a great tool to use. It also caters to a variety of topics including Human Resource Management, Analysis And Audit System Icon. Download this PPT design now to present a convincing pitch that not only emphasizes the topic but also showcases your presentation skills.
Statistical Analysis Procedure To Identify Problem Icon Guidelines PDF
Persuade your audience using this Statistical Analysis Procedure To Identify Problem Icon Guidelines PDF. This PPT design covers three stages, thus making it a great tool to use. It also caters to a variety of topics including Statistical Analysis Procedure, Identify Problem Icon. Download this PPT design now to present a convincing pitch that not only emphasizes the topic but also showcases your presentation skills.
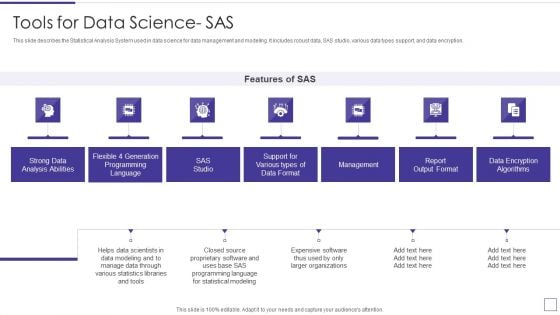
Data Mining Implementation Tools For Data Science SAS Template PDF
This slide describes the Statistical Analysis System used in data science for data management and modeling. It includes robust data, SAS studio, various data types support, and data encryption.This is a data mining implementation tools for data science sas template pdf template with various stages. Focus and dispense information on seven stages using this creative set, that comes with editable features. It contains large content boxes to add your information on topics like strong data analysis abilities, report output format, data encryption algorithms You can also showcase facts, figures, and other relevant content using this PPT layout. Grab it now.
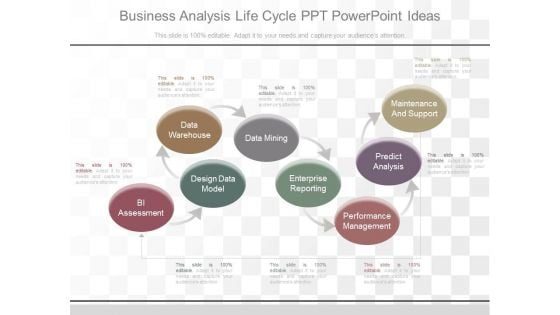
Business Analysis Life Cycle Ppt Powerpoint Ideas
This is a business analysis life cycle ppt powerpoint ideas. This is a eight stage process. The stages in this process are bi assessment, design data model, data warehouse, data mining, enterprise reporting, performance management, predict analysis, maintenance and support.
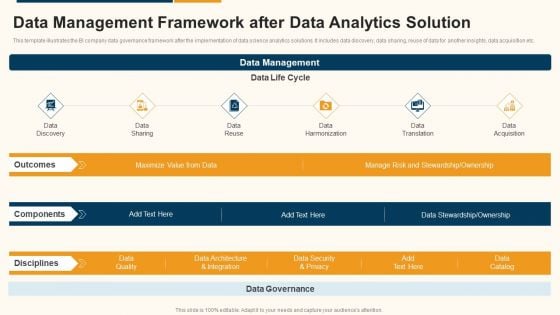
Data Interpretation And Analysis Playbook Data Management Framework After Data Analytics Solution Structure PDF
This template illustrates the BI company data governance framework after the implementation of data science analytics solutions. It includes data discovery, data sharing, reuse of data for another insights, data acquisition etc. This is a data interpretation and analysis playbook data management framework after data analytics solution structure pdf template with various stages. Focus and dispense information on six stages using this creative set, that comes with editable features. It contains large content boxes to add your information on topics like data discovery, data sharing, data reuse, data harmonization, data translation, data acquisition. You can also showcase facts, figures, and other relevant content using this PPT layout. Grab it now.
EV Performance Metrics Icon In Automotive Industry Infographics Pdf

Net Promoter Score Data Analysis Ppt Powerpoint Slides
This is a net promoter score data analysis ppt powerpoint slides. This is a ten stage process. The stages in this process are very willing, neutral, not at all willing, promoters, passives, detractors, net promoter score, percentage promoters, minus, percentage detractors.
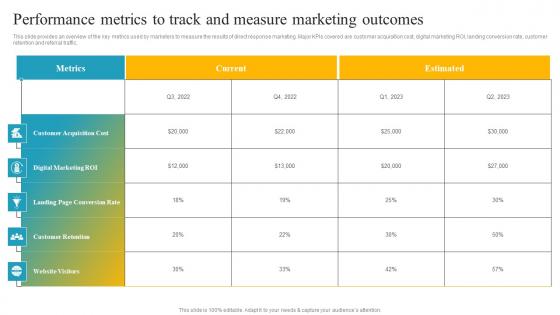
Effective Customer Engagement With Direct Response Performance Metrics To Track Infographics Pdf
This slide provides an overview of the key metrics used by marketers to measure the results of direct response marketing. Major KPIs covered are customer acquisition cost, digital marketing ROI, landing conversion rate, customer retention and referral traffic. The Effective Customer Engagement With Direct Response Performance Metrics To Track Infographics Pdf is a compilation of the most recent design trends as a series of slides. It is suitable for any subject or industry presentation, containing attractive visuals and photo spots for businesses to clearly express their messages. This template contains a variety of slides for the user to input data, such as structures to contrast two elements, bullet points, and slides for written information. Slidegeeks is prepared to create an impression. This slide provides an overview of the key metrics used by marketers to measure the results of direct response marketing. Major KPIs covered are customer acquisition cost, digital marketing ROI, landing conversion rate, customer retention and referral traffic.
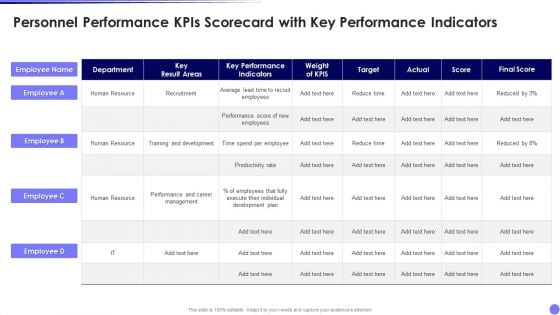
Personnel Performance Kpis Scorecard With Key Performance Indicators Designs PDF
Pitch your topic with ease and precision using this Personnel Performance Kpis Scorecard With Key Performance Indicators Designs PDF. This layout presents information on Key Performance Indicators, Target, Final Score, Employee. It is also available for immediate download and adjustment. So, changes can be made in the color, design, graphics or any other component to create a unique layout.
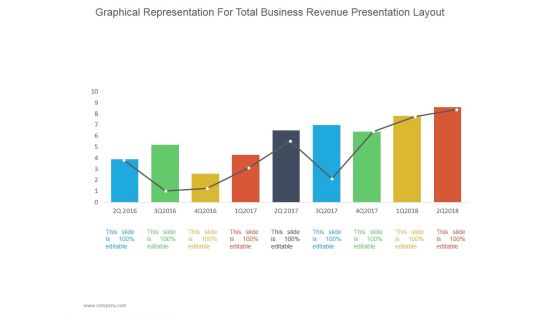
Graphical Representation For Total Business Revenue Ppt PowerPoint Presentation Diagrams
This is a graphical representation for total business revenue ppt powerpoint presentation diagrams. This is a nine stage process. The stages in this process are business, strategy, line chart, bar graph, marketing, management.
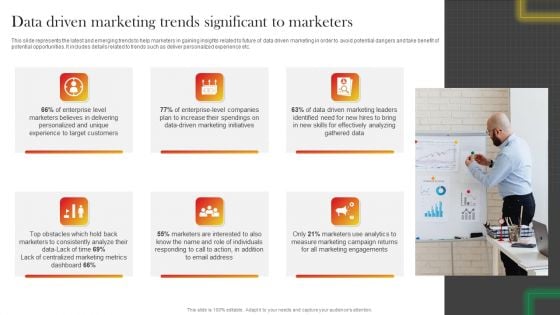
Data Driven Marketing Trends Significant To Marketers Graphics PDF
This slide represents the latest and emerging trends to help marketers in gaining insights related to future of data driven marketing in order to avoid potential dangers and take benefit of potential opportunities. It includes details related to trends such as deliver personalized experience etc. Formulating a presentation can take up a lot of effort and time, so the content and message should always be the primary focus. The visuals of the PowerPoint can enhance the presenters message, so our Data Driven Marketing Trends Significant To Marketers Graphics PDF was created to help save time. Instead of worrying about the design, the presenter can concentrate on the message while our designers work on creating the ideal templates for whatever situation is needed. Slidegeeks has experts for everything from amazing designs to valuable content, we have put everything into Data Driven Marketing Trends Significant To Marketers Graphics PDF
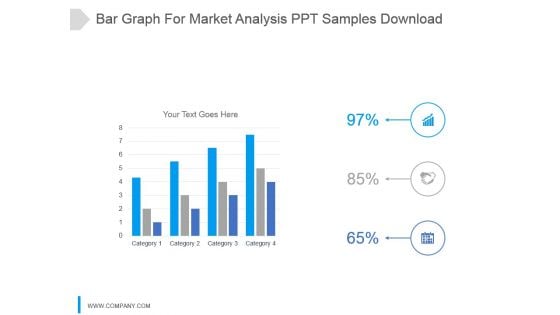
Bar Graph For Market Analysis Ppt Samples Download
This is a bar graph for market analysis ppt samples download. This is a four stage process. The stages in this process are category.

Margin Analysis Ppt PowerPoint Presentation Outline Files Cpb
This is a margin analysis ppt powerpoint presentation outline files cpb. This is a five stage process. The stages in this process are margin analysis.
Three Key Candidate Acquisition Metrics Ppt PowerPoint Presentation Gallery Layout
Presenting this set of slides with name three key candidate acquisition metrics ppt powerpoint presentation gallery layout. This is a three stage process. The stages in this process are three key candidate acquisition metrics. This is a completely editable PowerPoint presentation and is available for immediate download. Download now and impress your audience.
Data Identification And Information Analysis Vector Icon Ppt PowerPoint Presentation Gallery Example PDF
Presenting data identification and information analysis vector icon ppt powerpoint presentation gallery example pdf to dispense important information. This template comprises three stages. It also presents valuable insights into the topics including data identification and information analysis vector icon. This is a completely customizable PowerPoint theme that can be put to use immediately. So, download it and address the topic impactfully.
Data Research And Analysis Vector Icon Ppt PowerPoint Presentation Icon Background Image PDF
Presenting data research and analysis vector icon ppt powerpoint presentation icon background image pdf to dispense important information. This template comprises three stages. It also presents valuable insights into the topics including data research and analysis vector icon. This is a completely customizable PowerPoint theme that can be put to use immediately. So, download it and address the topic impactfully.
Vector Showing Data Quality Analysis Method Icon Ppt PowerPoint Presentation Icon Show PDF
Presenting vector showing data quality analysis method icon ppt powerpoint presentation icon show pdf to dispense important information. This template comprises three stages. It also presents valuable insights into the topics including vector showing data quality analysis method icon. This is a completely customizable PowerPoint theme that can be put to use immediately. So, download it and address the topic impactfully.
Mobile Data Analysis Vector Ppt PowerPoint Presentation Icon Slide
This is a mobile data analysis vector ppt powerpoint presentation icon slide. This is a four stage process. The stages in this process are mobile analytics, mobile tracking, mobile web analytics.
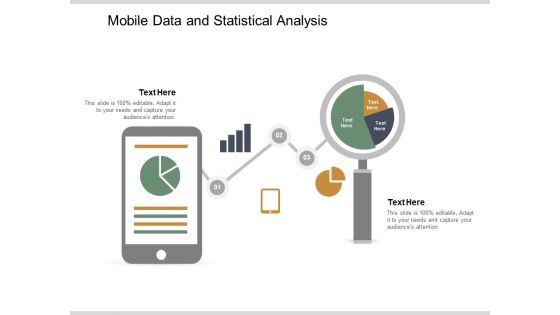
Mobile Data And Statistical Analysis Ppt PowerPoint Presentation Slides Portrait
This is a mobile data and statistical analysis ppt powerpoint presentation slides portrait. This is a two stage process. The stages in this process are mobile analytics, mobile tracking, mobile web analytics.
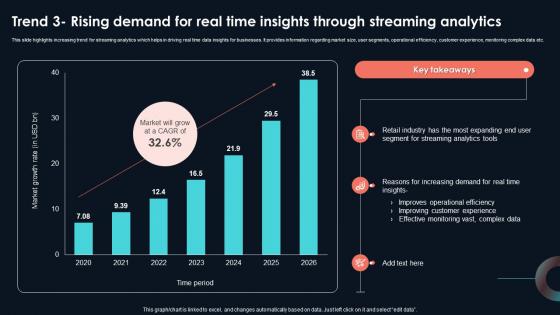
Trend 3 Rising Demand For Real Time Insights Developing Strategic Insights Using Big Data Analytics SS V
This slide highlights increasing trend for streaming analytics which helps in driving real time data insights for businesses. It provides information regarding market size, user segments, operational efficiency, customer experience, monitoring complex data etc. Take your projects to the next level with our ultimate collection of Trend 3 Rising Demand For Real Time Insights Developing Strategic Insights Using Big Data Analytics SS V. Slidegeeks has designed a range of layouts that are perfect for representing task or activity duration, keeping track of all your deadlines at a glance. Tailor these designs to your exact needs and give them a truly corporate look with your own brand colors they will make your projects stand out from the rest This slide highlights increasing trend for streaming analytics which helps in driving real time data insights for businesses. It provides information regarding market size, user segments, operational efficiency, customer experience, monitoring complex data etc.
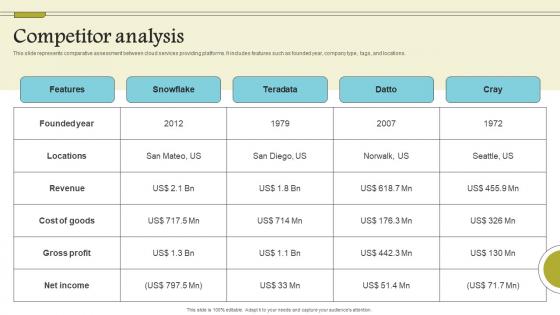
Competitor Analysis Cloud Data Computing Company Fund Raising Topics PDF
This slide represents comparative assessment between cloud services providing platforms. It includes features such as founded year, company type, tags, and locations. Want to ace your presentation in front of a live audience Our Competitor Analysis Cloud Data Computing Company Fund Raising Topics PDF can help you do that by engaging all the users towards you. Slidegeeks experts have put their efforts and expertise into creating these impeccable powerpoint presentations so that you can communicate your ideas clearly. Moreover, all the templates are customizable, and easy-to-edit and downloadable. Use these for both personal and commercial use. This slide represents comparative assessment between cloud services providing platforms. It includes features such as founded year, company type, tags, and locations.
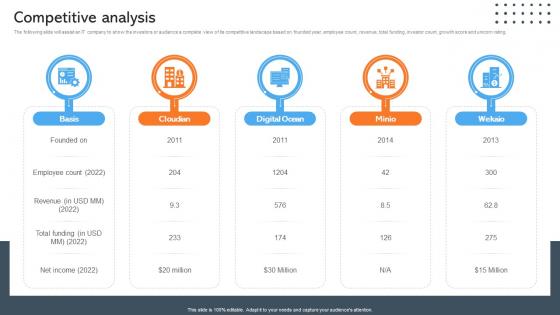
Competitive Analysis Data Management Company Investor Funding Pitch Deck
The following slide will assist an IT company to show the investors or audience a complete view of its competitive landscape based on founded year, employee count, revenue, total funding, investor count, growth score and unicorn rating. Want to ace your presentation in front of a live audience Our Competitive Analysis Data Management Company Investor Funding Pitch Deck can help you do that by engaging all the users towards you. Slidegeeks experts have put their efforts and expertise into creating these impeccable powerpoint presentations so that you can communicate your ideas clearly. Moreover, all the templates are customizable, and easy-to-edit and downloadable. Use these for both personal and commercial use. The following slide will assist an IT company to show the investors or audience a complete view of its competitive landscape based on founded year, employee count, revenue, total funding, investor count, growth score and unicorn rating.
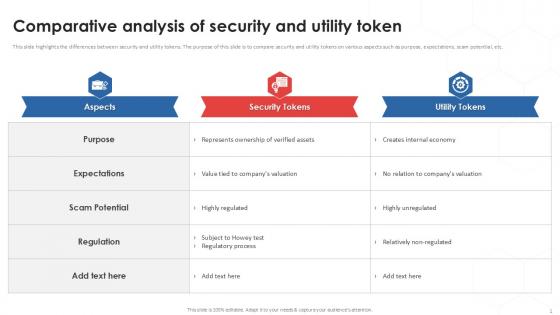
Comparative Analysis Of Tokenization Strategies For Data Security PPT Template
This slide highlights the differences between security and utility tokens. The purpose of this slide is to compare security and utility tokens on various aspects such as purpose, expectations, scam potential, etc. Find a pre-designed and impeccable Comparative Analysis Of Tokenization Strategies For Data Security PPT Template. The templates can ace your presentation without additional effort. You can download these easy-to-edit presentation templates to make your presentation stand out from others. So, what are you waiting for Download the template from Slidegeeks today and give a unique touch to your presentation. This slide highlights the differences between security and utility tokens. The purpose of this slide is to compare security and utility tokens on various aspects such as purpose, expectations, scam potential, etc.
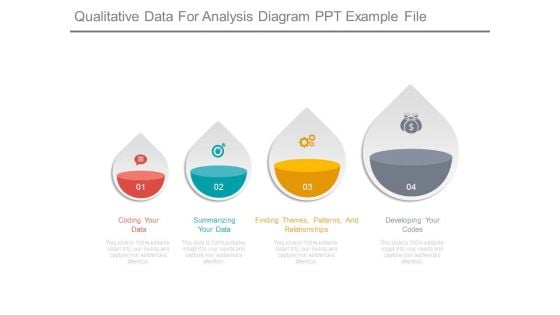
Qualitative Data For Analysis Diagram Ppt Example File
This is a qualitative data for analysis diagram ppt example file. This is a four stage process. The stages in this process are coding your data, summarizing your data, finding themes, patterns, and relationships, developing your codes.
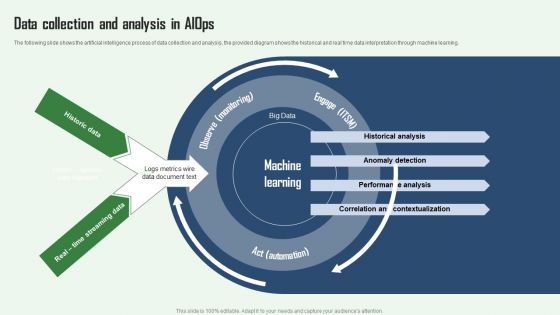
Aiops Integration Summary Report Data Collection And Analysis In Aiops Slides PDF
The following slide shows the artificial intelligence process of data collection and analysis, the provided diagram shows the historical and real time data interpretation through machine learning. Want to ace your presentation in front of a live audience Our Aiops Integration Summary Report Data Collection And Analysis In Aiops Slides PDF can help you do that by engaging all the users towards you. Slidegeeks experts have put their efforts and expertise into creating these impeccable powerpoint presentations so that you can communicate your ideas clearly. Moreover, all the templates are customizable, and easy to edit and downloadable. Use these for both personal and commercial use.
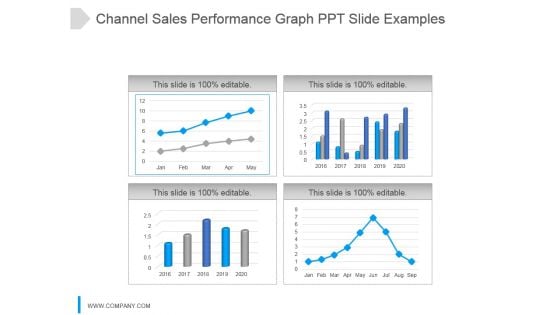
Channel Sales Performance Graph Ppt Slide Examples
This is a channel sales performance graph ppt slide examples. This is a four stage process. The stages in this process are jan, feb, mar, apr, may, jun, jul, aug, sep.


 Continue with Email

 Home
Home


