Dashboards
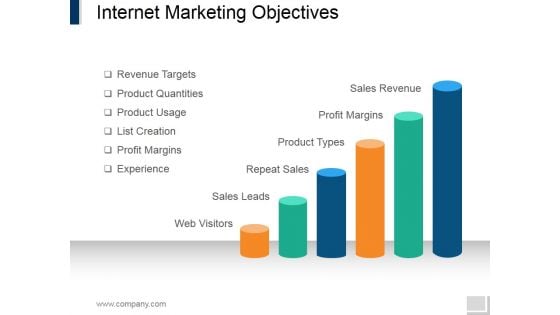
Internet Marketing Objectives Ppt PowerPoint Presentation Summary Portrait
This is a internet marketing objectives ppt powerpoint presentation summary portrait. This is a six stage process. The stages in this process are sales revenue, profit margins, product types, repeat sales, sales leads, web visitors.
Financial Tactical And Strategic Analysis Planning Icon Ideas PDF
Persuade your audience using this Financial Tactical And Strategic Analysis Planning Icon Ideas PDF. This PPT design covers three stages, thus making it a great tool to use. It also caters to a variety of topics including Financial Analysis, Tactical Planning, Icon. Download this PPT design now to present a convincing pitch that not only emphasizes the topic but also showcases your presentation skills.
Assessment Of Stakeholder Analysis And Management Icon Demonstration PDF
Presenting Assessment Of Stakeholder Analysis And Management Icon Demonstration PDF to dispense important information. This template comprises four stages. It also presents valuable insights into the topics including Assessment Of Stakeholder, Analysis And Management Icon. This is a completely customizable PowerPoint theme that can be put to use immediately. So, download it and address the topic impactfully.
Magnifying Glass With Data Analysis Vector Icon Ppt PowerPoint Presentation Model Graphics Design PDF
Persuade your audience using this magnifying glass with data analysis vector icon ppt powerpoint presentation model graphics design pdf. This PPT design covers three stages, thus making it a great tool to use. It also caters to a variety of topics including magnifying glass with data analysis vector icon. Download this PPT design now to present a convincing pitch that not only emphasizes the topic but also showcases your presentation skills.
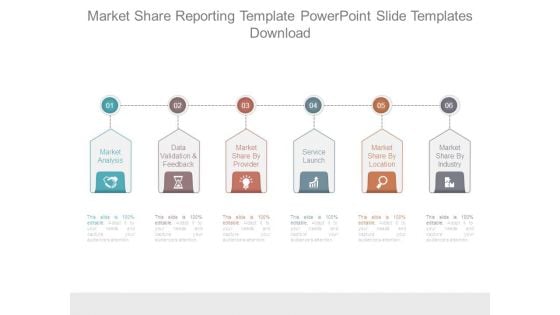
Market Share Reporting Template Powerpoint Slide Templates Download
This is a market share reporting template powerpoint slide templates download. This is a six stage process. The stages in this process are market analysis, data validation and feedback, market share by provider, service launch, market share by location, market share by industry.
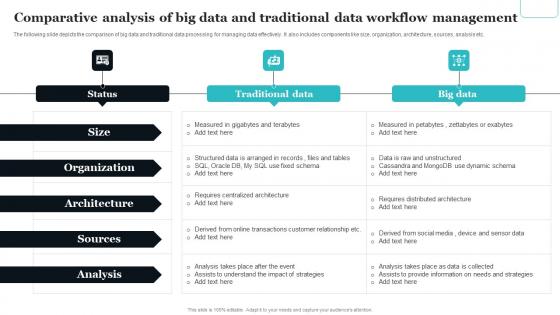
Comparative Analysis Of Big Data And Traditional Data Workflow Management Topics Pdf
The following slide depicts the comparison of big data and traditional data processing for managing data effectively. It also includes components like size, organization, architecture, sources, analysis etc. Showcasing this set of slides titled Comparative Analysis Of Big Data And Traditional Data Workflow Management Topics Pdf The topics addressed in these templates are Organization, Architecture, Sources, Analysis All the content presented in this PPT design is completely editable. Download it and make adjustments in color, background, font etc. as per your unique business setting. The following slide depicts the comparison of big data and traditional data processing for managing data effectively. It also includes components like size, organization, architecture, sources, analysis etc.
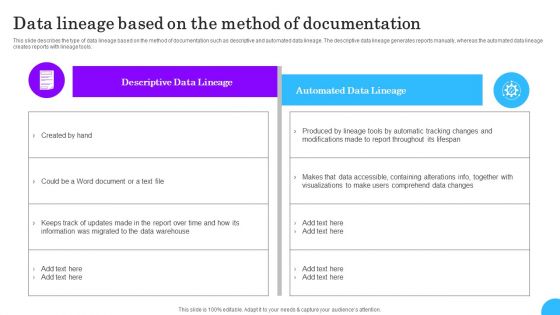
Comprehensive Analysis Of Different Data Lineage Classification Data Lineage Based On The Method Microsoft PDF
This slide describes the type of data lineage based on the method of documentation such as descriptive and automated data lineage. The descriptive data lineage generates reports manually, whereas the automated data lineage creates reports with lineage tools. If your project calls for a presentation, then Slidegeeks is your go to partner because we have professionally designed, easy to edit templates that are perfect for any presentation. After downloading, you can easily edit Comprehensive Analysis Of Different Data Lineage Classification Data Lineage Based On The Method Microsoft PDF and make the changes accordingly. You can rearrange slides or fill them with different images. Check out all the handy templates
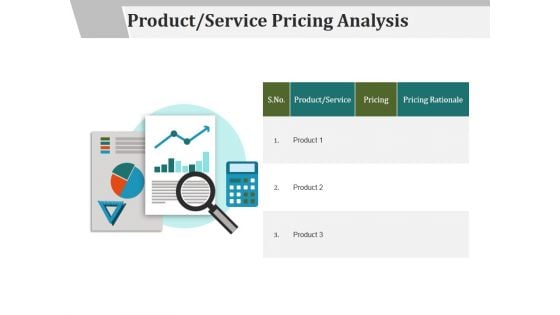
Product Service Pricing Analysis Ppt PowerPoint Presentation Styles Graphics Example
This is a product service pricing analysis ppt powerpoint presentation styles graphics example. This is a one stage process. The stages in this process are product service, pricing, pricing rationale.
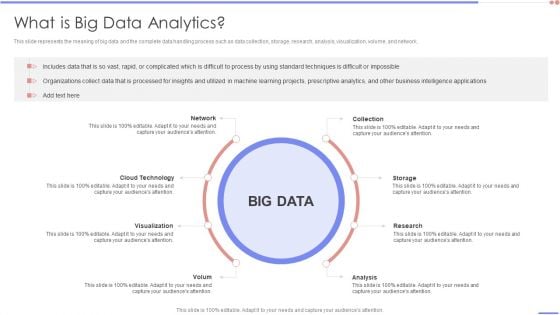
Data Analytics Management What Is Big Data Analytics Slides PDF
This slide represents the meaning of big data and the complete data handling process such as data collection, storage, research, analysis, visualization, volume, and network.This is a Data Analytics Management What Is Big Data Analytics Slides PDF template with various stages. Focus and dispense information on one stage using this creative set, that comes with editable features. It contains large content boxes to add your information on topics like Standard Techniques, Difficult Impossible, Intelligence. You can also showcase facts, figures, and other relevant content using this PPT layout. Grab it now.

Analytics Services Marketing Research Services Management Business Summary Pdf
The following slide highlights the reporting and analytics services offered by Pureprofile. It provides advanced data cleaning, data weighting, RIM weighting and verbatim coding Find a pre-designed and impeccable Analytics Services Marketing Research Services Management Business Summary Pdf. The templates can ace your presentation without additional effort. You can download these easy-to-edit presentation templates to make your presentation stand out from others. So, what are you waiting for Download the template from Slidegeeks today and give a unique touch to your presentation. The following slide highlights the reporting and analytics services offered by Pureprofile. It provides advanced data cleaning, data weighting, RIM weighting and verbatim coding
Bar Chart Business Analytics Vector Icon Ppt PowerPoint Presentation Layouts Shapes
Presenting this set of slides with name bar chart business analytics vector icon ppt powerpoint presentation layouts shapes. This is a three stage process. The stages in this process are data visualization icon, research analysis, business focus. This is a completely editable PowerPoint presentation and is available for immediate download. Download now and impress your audience.

Quarterly Recruiting Report Status For Various Departments Quarterly Report Ppt Slide
Following slide demonstrates quarterly hiring status which assist organizations to assess overall success of recruitment campaign and identify areas for improvement. This slide provides data regarding various organizational departments, job position and four quarters. Get a simple yet stunning designed Quarterly Recruiting Report Status For Various Departments Quarterly Report Ppt Slide It is the best one to establish the tone in your meetings. It is an excellent way to make your presentations highly effective. So, download this PPT today from Slidegeeks and see the positive impacts. Our easy-to-edit Quarterly Recruiting Report Status For Various Departments Quarterly Report Ppt Slide can be your go-to option for all upcoming conferences and meetings. So, what are you waiting for Grab this template today. Following slide demonstrates quarterly hiring status which assist organizations to assess overall success of recruitment campaign and identify areas for improvement. This slide provides data regarding various organizational departments, job position and four quarters.
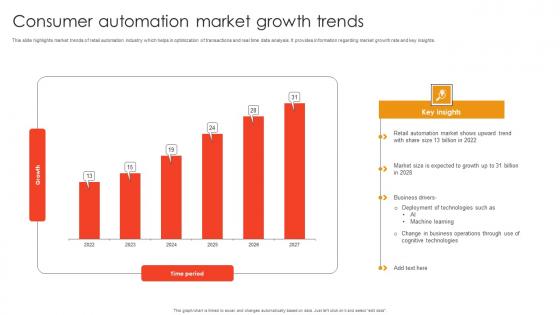
Consumer Automation Market Growth Trends Formats Pdf
This slide highlights market trends of retail automation industry which helps in optimization of transactions and real time data analysis. It provides information regarding market growth rate and key insights. Showcasing this set of slides titled Consumer Automation Market Growth Trends Formats Pdf. The topics addressed in these templates are Deployment Technologies Such, AI, Machine Learning. All the content presented in this PPT design is completely editable. Download it and make adjustments in color, background, font etc. as per your unique business setting. This slide highlights market trends of retail automation industry which helps in optimization of transactions and real time data analysis. It provides information regarding market growth rate and key insights.
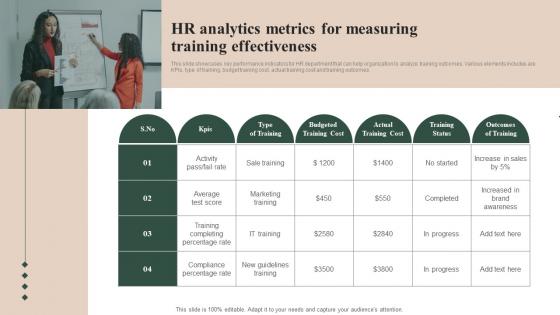
HR Analytics Metrics For Measuring Training Effectiveness Infographics Pdf
This slide showcases key performance indicators for HR department that can help organization to analyze training outcomes. Various elements includes are KPIs, type of training, budget training cost, actual training cost and training outcomes Showcasing this set of slides titled HR Analytics Metrics For Measuring Training Effectiveness Infographics Pdf The topics addressed in these templates are Percentage Rate, Training Completing, Marketing Training All the content presented in this PPT design is completely editable. Download it and make adjustments in color, background, font etc. as per your unique business setting. This slide showcases key performance indicators for HR department that can help organization to analyze training outcomes. Various elements includes are KPIs, type of training, budget training cost, actual training cost and training outcomes.
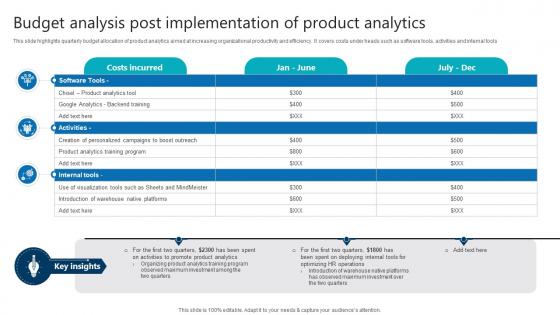
Budget Analysis Post Implementation Of Product Analytics Product Analytics Implementation Data Analytics V
This slide highlights quarterly budget allocation of product analytics aimed at increasing organizational productivity and efficiency. It covers costs under heads such as software tools, activities and internal tools From laying roadmaps to briefing everything in detail, our templates are perfect for you. You can set the stage with your presentation slides. All you have to do is download these easy-to-edit and customizable templates. Budget Analysis Post Implementation Of Product Analytics Product Analytics Implementation Data Analytics V will help you deliver an outstanding performance that everyone would remember and praise you for. Do download this presentation today. This slide highlights quarterly budget allocation of product analytics aimed at increasing organizational productivity and efficiency. It covers costs under heads such as software tools, activities and internal tools
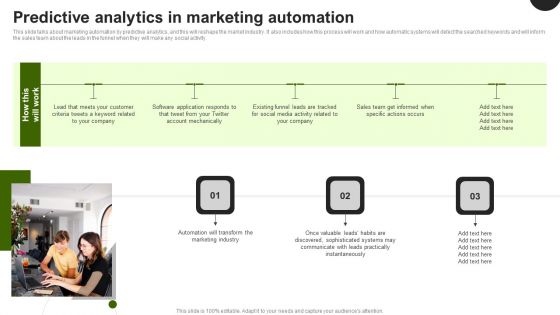
Predictive Analytics In The Age Of Big Data Predictive Analytics In Marketing Automation Ideas PDF
This slide talks about marketing automation by predictive analytics, and this will reshape the market industry. It also includes how this process will work and how automatic systems will detect the searched keywords and will inform the sales team about the leads in the funnel when they will make any social activity. The Predictive Analytics In The Age Of Big Data Predictive Analytics In Marketing Automation Ideas PDF is a compilation of the most recent design trends as a series of slides. It is suitable for any subject or industry presentation, containing attractive visuals and photo spots for businesses to clearly express their messages. This template contains a variety of slides for the user to input data, such as structures to contrast two elements, bullet points, and slides for written information. Slidegeeks is prepared to create an impression.
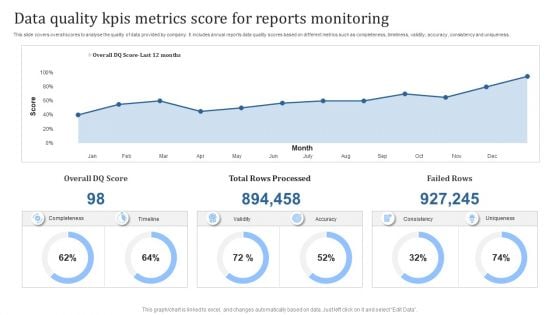
Data Quality Kpis Metrics Score For Reports Monitoring Download PDF
This slide covers overall scores to analyse the quality of data provided by company. It includes annual reports data quality scores based on different metrics such as completeness, timeliness, validity, accuracy, consistency and uniqueness. Showcasing this set of slides titled Data Quality Kpis Metrics Score For Reports Monitoring Download PDF. The topics addressed in these templates are Total Rows Processed, Failed Rows. All the content presented in this PPT design is completely editable. Download it and make adjustments in color, background, font etc. as per your unique business setting.

Financial Data Analysis For Risk Management Ppt PowerPoint Presentation Slides Picture
Presenting this set of slides with name financial data analysis for risk management ppt powerpoint presentation slides picture. This is a one stage process. The stages in this process are risk framework, risk management, planning process. This is a completely editable PowerPoint presentation and is available for immediate download. Download now and impress your audience.
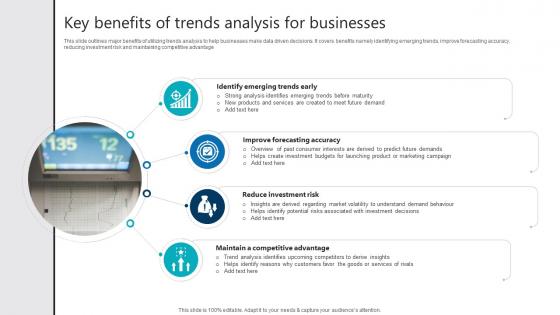
Key Benefits Of Trends Analysis For Businesses Product Analytics Implementation Data Analytics V
This slide outlines major benefits of utilizing trends analysis to help businesses make data driven decisions. It covers benefits namely identifying emerging trends, improve forecasting accuracy, reducing investment risk and maintaining competitive advantage Take your projects to the next level with our ultimate collection of Key Benefits Of Trends Analysis For Businesses Product Analytics Implementation Data Analytics V. Slidegeeks has designed a range of layouts that are perfect for representing task or activity duration, keeping track of all your deadlines at a glance. Tailor these designs to your exact needs and give them a truly corporate look with your own brand colors they will make your projects stand out from the rest This slide outlines major benefits of utilizing trends analysis to help businesses make data driven decisions. It covers benefits namely identifying emerging trends, improve forecasting accuracy, reducing investment risk and maintaining competitive advantage
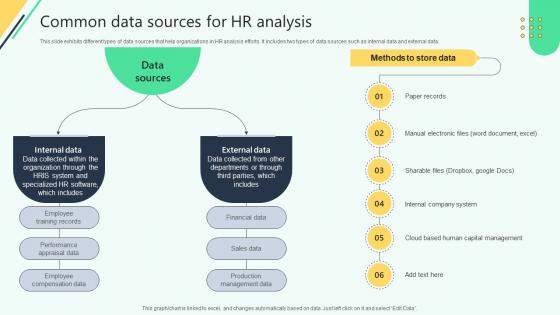
Common Data Sources For Hr Analysis Analysing Hr Data For Effective Decision Making
This slide exhibits different types of data sources that help organizations in HR analysis efforts. It includes two types of data sources such as internal data and external data. From laying roadmaps to briefing everything in detail, our templates are perfect for you. You can set the stage with your presentation slides. All you have to do is download these easy-to-edit and customizable templates. Common Data Sources For Hr Analysis Analysing Hr Data For Effective Decision Making will help you deliver an outstanding performance that everyone would remember and praise you for. Do download this presentation today. This slide exhibits different types of data sources that help organizations in HR analysis efforts. It includes two types of data sources such as internal data and external data.

Surgical Devices Industry Report powerpoint presentation slides PPT Example IR V
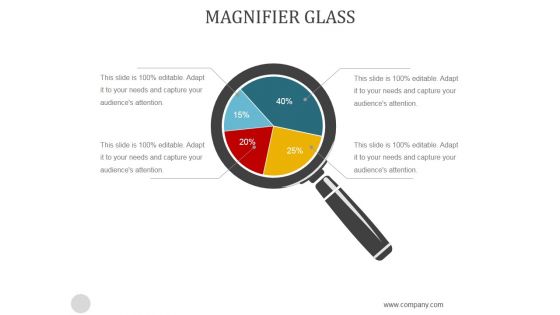
Magnifier Glass Ppt PowerPoint Presentation Example
This is a magnifier glass ppt powerpoint presentation example. This is a four stage process. The stages in this process are magnifier, searching, strategy, analysis, business.
Proposal For Data Analysis Project Example Document Report Doc Pdf Ppt
Heres a predesigned Proposal For Data Analysis Project Example Document Report Doc Pdf Ppt for you. Built on extensive research and analysis, this one-complete deck has all the center pieces of your specific requirements. This temple exudes brilliance and professionalism. Being completely editable, you can make changes to suit your purpose. Get this Proposal For Data Analysis Project Example Document Report Doc Pdf Ppt A4 One-pager now.

Proposal For Data Analysis In Research Project Example Document Report Doc Pdf Ppt
Here is a predesigned Proposal For Data Analysis In Research Project Example Document Report Doc Pdf Ppt for you. Built on extensive research and analysis, this one-complete deck has all the center pieces of your specific requirements. This temple exudes brilliance and professionalism. Being completely editable, you can make changes to suit your purpose. Get this Proposal For Data Analysis In Research Project Example Document Report Doc Pdf Ppt A4 One-pager now.
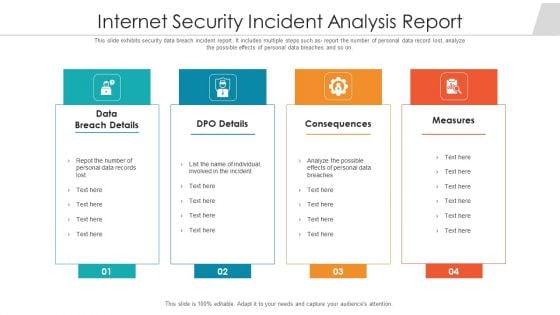
Internet Security Incident Analysis Report Template PDF
This slide exhibits security data breach incident report. It includes multiple steps such as- report the number of personal data record lost, analyze the possible effects of personal data breaches and so on. Showcasing this set of slides titled internet security incident analysis report template pdf. The topics addressed in these templates are data breach details, consequences, measures. All the content presented in this PPT design is completely editable. Download it and make adjustments in color, background, font etc. as per your unique business setting.
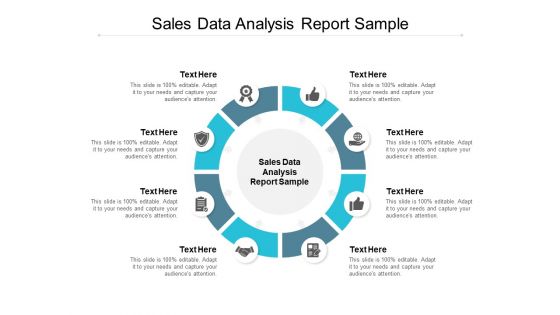
Sales Data Analysis Report Sample Ppt PowerPoint Presentation Summary Example Cpb
Presenting this set of slides with name sales data analysis report sample ppt powerpoint presentation summary example cpb. This is an editable Powerpoint eight stages graphic that deals with topics like sales data analysis report sample to help convey your message better graphically. This product is a premium product available for immediate download and is 100 percent editable in Powerpoint. Download this now and use it in your presentations to impress your audience.
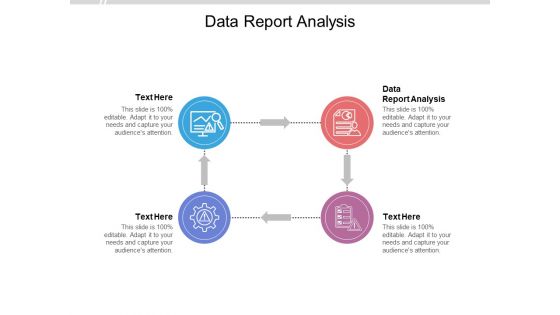
Data Report Analysis Ppt PowerPoint Presentation Inspiration Graphics Download Cpb Pdf
Presenting this set of slides with name data report analysis ppt powerpoint presentation inspiration graphics download cpb pdf. This is an editable Powerpoint four stages graphic that deals with topics like data report analysis to help convey your message better graphically. This product is a premium product available for immediate download and is 100 percent editable in Powerpoint. Download this now and use it in your presentations to impress your audience.
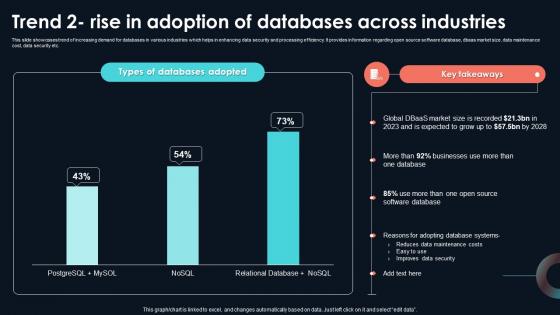
Trend 2 Rise In Adoption Of Databases Across Developing Strategic Insights Using Big Data Analytics SS V
This slide showcases trend of increasing demand for databases in various industries which helps in enhancing data security and processing efficiency. It provides information regarding open source software database, dbaas market size, data maintenance cost, data security etc. This Trend 2 Rise In Adoption Of Databases Across Developing Strategic Insights Using Big Data Analytics SS V from Slidegeeks makes it easy to present information on your topic with precision. It provides customization options, so you can make changes to the colors, design, graphics, or any other component to create a unique layout. It is also available for immediate download, so you can begin using it right away. Slidegeeks has done good research to ensure that you have everything you need to make your presentation stand out. Make a name out there for a brilliant performance. This slide showcases trend of increasing demand for databases in various industries which helps in enhancing data security and processing efficiency. It provides information regarding open source software database, dbaas market size, data maintenance cost, data security etc.
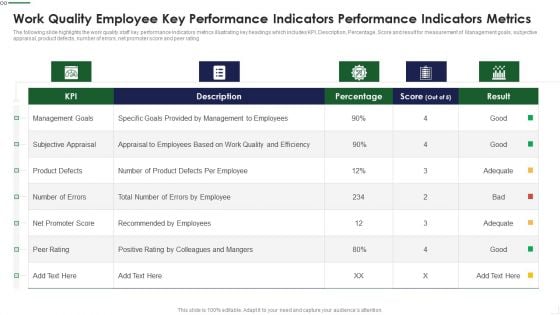
Work Quality Employee Key Performance Indicators Performance Indicators Metrics Template PDF
The following slide highlights the work quality staff key performance Indicators metrics illustrating key headings which includes KPI, Description, Percentage, Score and result for measurement of Management goals, subjective appraisal, product defects, number of errors, net promoter score and peer rating Deliver an awe inspiring pitch with this creative Work Quality Employee Key Performance Indicators Performance Indicators Metrics Template PDF bundle. Topics like Products Manufactured, Visit Meeting, Conversion can be discussed with this completely editable template. It is available for immediate download depending on the needs and requirements of the user.
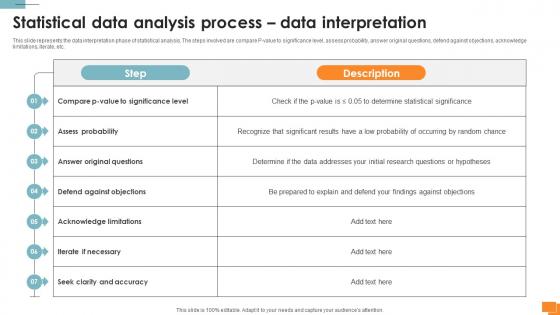
A133 Statistical Tools For Evidence Statistical Data Analysis Process Data Interpretation
This slide represents the data interpretation phase of statistical analysis. The steps involved are compare P-value to significance level, assess probability, answer original questions, defend against objections, acknowledge limitations, iterate, etc. Boost your pitch with our creative A133 Statistical Tools For Evidence Statistical Data Analysis Process Data Interpretation. Deliver an awe-inspiring pitch that will mesmerize everyone. Using these presentation templates you will surely catch everyones attention. You can browse the ppts collection on our website. We have researchers who are experts at creating the right content for the templates. So you do not have to invest time in any additional work. Just grab the template now and use them. This slide represents the data interpretation phase of statistical analysis. The steps involved are compare P-value to significance level, assess probability, answer original questions, defend against objections, acknowledge limitations, iterate, etc.
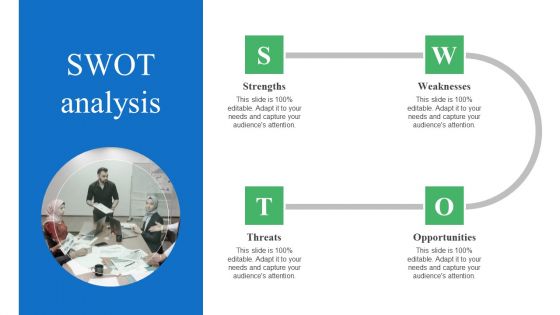
Toolkit For Data Science And Analytics Transition SWOT Analysis Download PDF
The Toolkit For Data Science And Analytics Transition SWOT Analysis Download PDF is a compilation of the most recent design trends as a series of slides. It is suitable for any subject or industry presentation, containing attractive visuals and photo spots for businesses to clearly express their messages. This template contains a variety of slides for the user to input data, such as structures to contrast two elements, bullet points, and slides for written information. Slidegeeks is prepared to create an impression.

Comparing Overall Business Performance Objectives And Key Result Methodology For Business
The following slide highlights some key performance indicators to compare business performance with industry standards to formulate strategies and fill the gap. It includes elements such as website traffic, customer acquisition cost, employee satisfaction rate, customer churn rate, sales revenue etc. From laying roadmaps to briefing everything in detail, our templates are perfect for you. You can set the stage with your presentation slides. All you have to do is download these easy-to-edit and customizable templates. Comparing Overall Business Performance Objectives And Key Result Methodology For Business will help you deliver an outstanding performance that everyone would remember and praise you for. Do download this presentation today. The following slide highlights some key performance indicators to compare business performance with industry standards to formulate strategies and fill the gap. It includes elements such as website traffic, customer acquisition cost, employee satisfaction rate, customer churn rate, sales revenue etc.

Key Metrics To Track Employee Relations Performance Plan To Develop Ppt Template
This slide shows various metrics which can be used by organizations to evaluate employee relations performance of current year. It also contains information regarding previous year key performance indicators. This modern and well-arranged Key Metrics To Track Employee Relations Performance Plan To Develop Ppt Template provides lots of creative possibilities. It is very simple to customize and edit with the Powerpoint Software. Just drag and drop your pictures into the shapes. All facets of this template can be edited with Powerpoint, no extra software is necessary. Add your own material, put your images in the places assigned for them, adjust the colors, and then you can show your slides to the world, with an animated slide included. This slide shows various metrics which can be used by organizations to evaluate employee relations performance of current year. It also contains information regarding previous year key performance indicators.
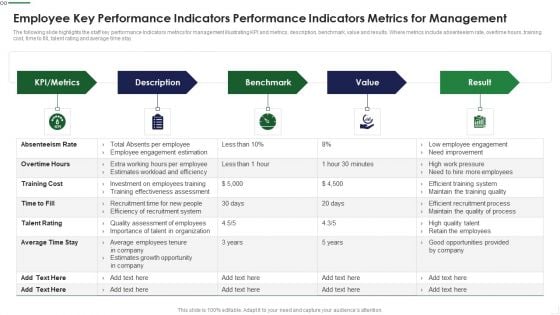
Employee Key Performance Indicators Performance Indicators Metrics For Management Professional PDF
The following slide highlights the staff key performance Indicators metrics for management illustrating KPI and metrics, description, benchmark, value and results. Where metrics include absenteeism rate, overtime hours, training cost, time to fill, talent rating and average time stay Presenting Employee Key Performance Indicators Performance Indicators Metrics For Management Professional PDF to dispense important information. This template comprises five stages. It also presents valuable insights into the topics including Employee Engagement, Recruitment System, Talent Organization This is a completely customizable PowerPoint theme that can be put to use immediately. So, download it and address the topic impactfully.

Human Resource Monthly Report Powerpoint Ppt Template Bundles
This Human Resource Monthly Report Powerpoint Ppt Template Bundles is designed to help you retain your audiences attention. This content-ready PowerPoint Template enables you to take your audience on a journey and share information in a way that is easier to recall. It helps you highlight the crucial parts of your work so that the audience does not get saddled with information download. This twenty-slide PPT Deck comes prepared with the graphs and charts you could need to showcase your information through visuals. You only need to enter your own data in them. Download this editable PowerPoint Theme and walk into that meeting with confidence. The human resource monthly report powerpoint template bundles is ideal for sharing employee performance, recruitment data and workforce metrics. These templates ensure polished and professional presentation every time.
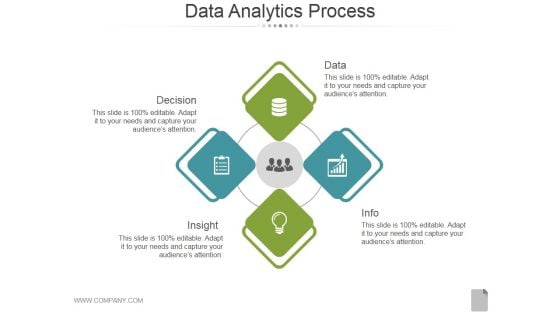
Data Analytics Process Ppt PowerPoint Presentation Inspiration
This is a data analytics process ppt powerpoint presentation inspiration. This is a four stage process. The stages in this process are decision, insight, data, info.
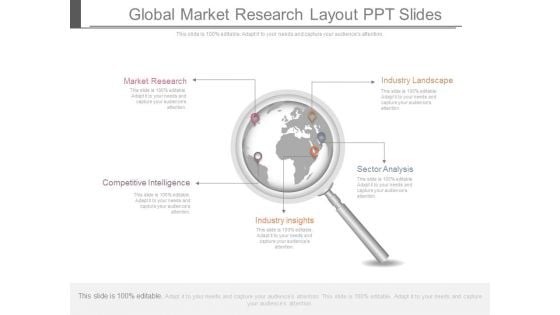
Global Market Research Layout Ppt Slides
This is a global market research layout ppt slides. This is a five stage process. The stages in this process are market research, industry landscape, competitive intelligence, sector analysis, industry insights.
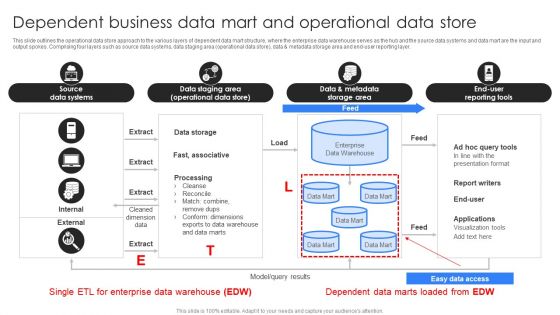
Dependent Business Data Mart And Operational Data Store Ppt Infographics Gridlines PDF
This slide outlines the operational data store approach to the various layers of dependent data mart structure, where the enterprise data warehouse serves as the hub and the source data systems and data mart are the input and output spokes. Comprising four layers such as source data systems, data staging area operational data store, data and metadata storage area and end-user reporting layer. Presenting Dependent Business Data Mart And Operational Data Store Ppt Infographics Gridlines PDF to dispense important information. This template comprises one stages. It also presents valuable insights into the topics including Source Data Systems, Data Storage, Load. This is a completely customizable PowerPoint theme that can be put to use immediately. So, download it and address the topic impactfully.
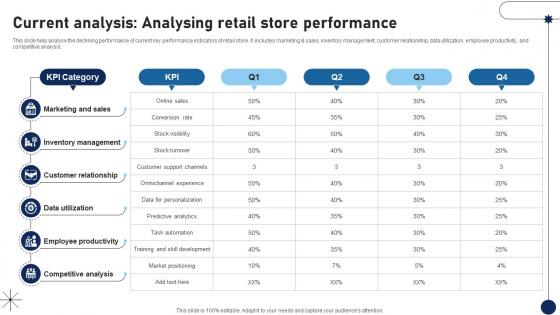
Current Analysis Analysing Retail Store Performance DT SS V
This slide help analyse the declining performance of current key performance indicators of retail store. It includes marketing and sales, inventory management, customer relationship, data utilization, employee productivity, and competitive analysis.Whether you have daily or monthly meetings, a brilliant presentation is necessary. Current Analysis Analysing Retail Store Performance DT SS V can be your best option for delivering a presentation. Represent everything in detail using Current Analysis Analysing Retail Store Performance DT SS V and make yourself stand out in meetings. The template is versatile and follows a structure that will cater to your requirements. All the templates prepared by Slidegeeks are easy to download and edit. Our research experts have taken care of the corporate themes as well. So, give it a try and see the results. This slide help analyse the declining performance of current key performance indicators of retail store. It includes marketing and sales, inventory management, customer relationship, data utilization, employee productivity, and competitive analysis.

Key Metrics To Consider In Prompt Evaluation Crafting Interactions A Guide AI SS V
This slide showcases key metrics to consider while evaluating prompt engineering, referable by users and multiple businesses harnessing this technology. It provides information about relevance, coherence, accuracy, etc. The Key Metrics To Consider In Prompt Evaluation Crafting Interactions A Guide AI SS V is a compilation of the most recent design trends as a series of slides. It is suitable for any subject or industry presentation, containing attractive visuals and photo spots for businesses to clearly express their messages. This template contains a variety of slides for the user to input data, such as structures to contrast two elements, bullet points, and slides for written information. Slidegeeks is prepared to create an impression. This slide showcases key metrics to consider while evaluating prompt engineering, referable by users and multiple businesses harnessing this technology. It provides information about relevance, coherence, accuracy, etc.
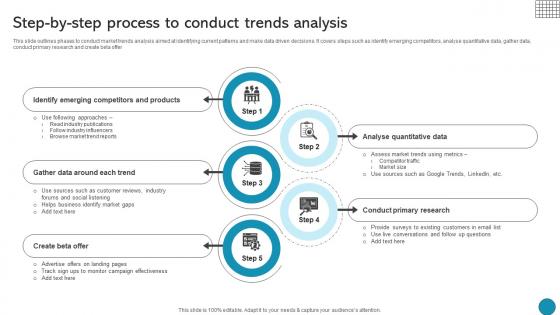
Step By Step Process To Conduct Trends Analysis Driving Business Success Integrating Product
This slide outlines phases to conduct market trends analysis aimed at identifying current patterns and make data driven decisions. It covers steps such as identify emerging competitors, analyse quantitative data, gather data, conduct primary research and create beta offerThis modern and well-arranged Step By Step Process To Conduct Trends Analysis Driving Business Success Integrating Product provides lots of creative possibilities. It is very simple to customize and edit with the Powerpoint Software. Just drag and drop your pictures into the shapes. All facets of this template can be edited with Powerpoint, no extra software is necessary. Add your own material, put your images in the places assigned for them, adjust the colors, and then you can show your slides to the world, with an animated slide included. This slide outlines phases to conduct market trends analysis aimed at identifying current patterns and make data driven decisions. It covers steps such as identify emerging competitors, analyse quantitative data, gather data, conduct primary research and create beta offer
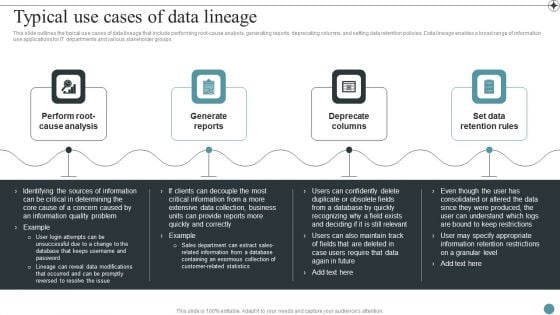
Typical Use Cases Of Data Lineage Deploying Data Lineage IT Mockup PDF
This slide outlines the typical use cases of data lineage that include performing root-cause analysis, generating reports, deprecating columns, and setting data retention policies. Data lineage enables a broad range of information use applications for IT departments and various stakeholder groups.Are you in need of a template that can accommodate all of your creative concepts This one is crafted professionally and can be altered to fit any style. Use it with Google Slides or PowerPoint. Include striking photographs, symbols, depictions, and other visuals. Fill, move around, or remove text boxes as desired. Test out color palettes and font mixtures. Edit and save your work, or work with colleagues. Download Typical Use Cases Of Data Lineage Deploying Data Lineage IT Mockup PDF and observe how to make your presentation outstanding. Give an impeccable presentation to your group and make your presentation unforgettable.
Database Management Vector Icon Ppt PowerPoint Presentation Professional Format Ideas
Presenting this set of slides with name database management vector icon ppt powerpoint presentation professional format ideas. The topics discussed in these slides are data sources, database management, marketing. This is a completely editable PowerPoint presentation and is available for immediate download. Download now and impress your audience.

Data Analysis Excel 3d Pie Chart For Marketing Process PowerPoint Templates
Our data analysis excel 3d pie chart for marketing process Powerpoint Templates Team Are A Dogged Lot. They Keep At It Till They Get It Right.
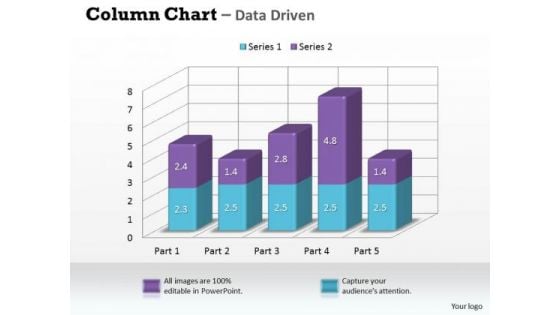
Data Analysis In Excel 3d Column Chart For Market Surveys PowerPoint Templates
Our data analysis in excel 3d column chart for market surveys Powerpoint Templates Leave No One In Doubt. Provide A Certainty To Your Views.
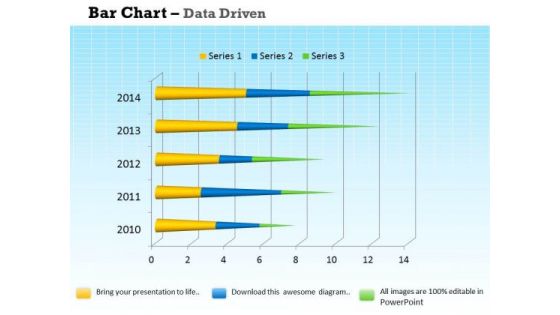
Data Analysis Programs 3d Bar Chart For Market Surveys PowerPoint Templates
Draw On The Experience Of Our data analysis programs 3d bar chart for market surveys Powerpoint Templates . They Imbibe From Past Masters.
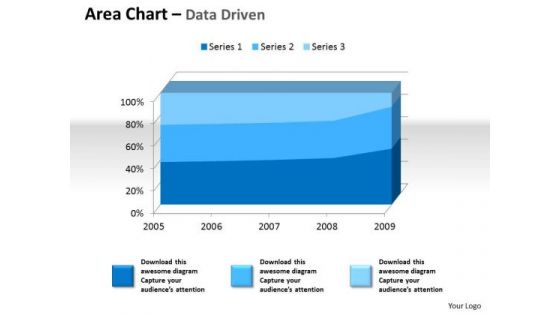
Examples Of Data Analysis Market 3d Area Chart For Quantiative PowerPoint Templates
Drum It Up With Our examples of data analysis market 3d area chart for quantiative Powerpoint Templates . Your Thoughts Will Raise The Tempo.
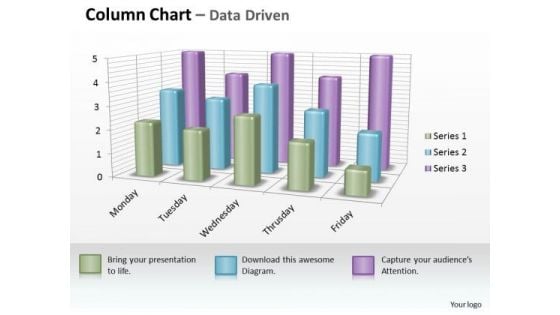
Examples Of Data Analysis Market 3d Business Inspection Procedure Chart PowerPoint Templates
However Dry Your Topic Maybe. Make It Catchy With Our examples of data analysis market 3d business inspection procedure chart Powerpoint Templates .
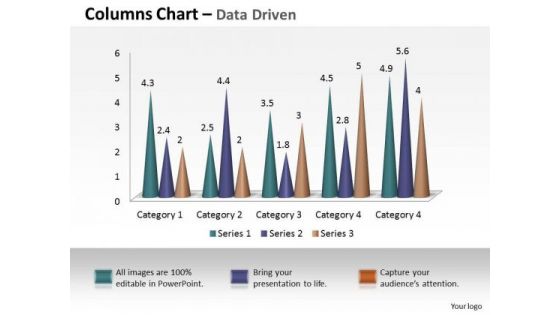
Examples Of Data Analysis Market 3d Business Intelligence And PowerPoint Templates
Our examples of data analysis market 3d business intelligence and Powerpoint Templates Are Dual Purpose. They Help Instruct And Inform At The Same Time.
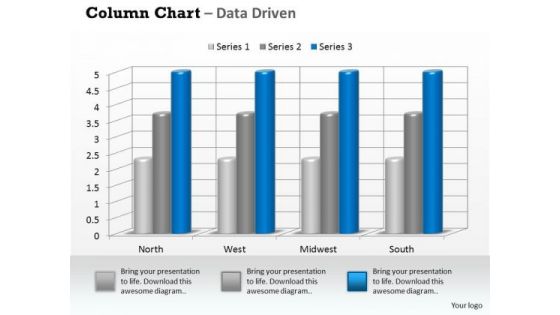
Examples Of Data Analysis Market 3d Business On Regular Intervals PowerPoint Templates
Drum It Out Loud And Clear On Our examples of data analysis market 3d business on regular intervals Powerpoint Templates . Your Words Will Ring In Their Ears.
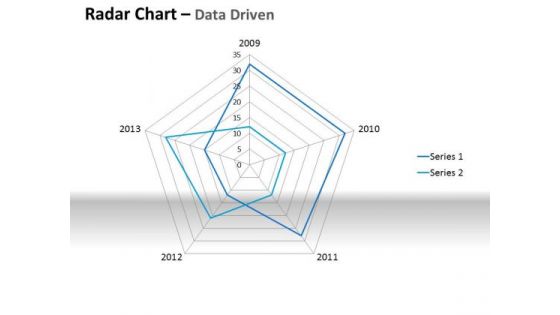
Examples Of Data Analysis Market Driven Plotting The Business Values PowerPoint Slides Templates
Ring The Duck With Our examples of data analysis market driven plotting the business values powerpoint slides Templates . Acquire The Points With Your Ideas.
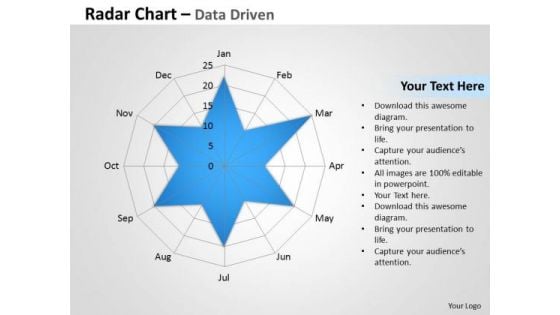
Examples Of Data Analysis Market Driven Radar Chart To Compare PowerPoint Slides Templates
Rely On Our examples of data analysis market driven radar chart to compare powerpoint slides Templates In Any Duel. They Will Drive Home Your Point.
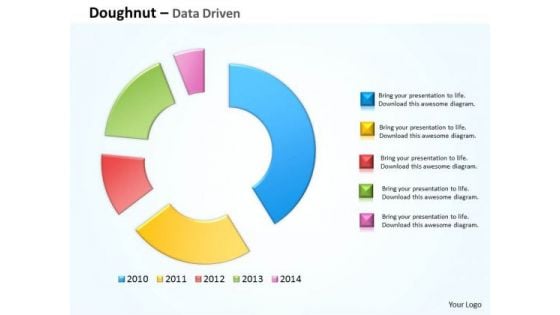
Financial Data Analysis Driven Compare Market Share Of Brand PowerPoint Templates
Doll Up Your Thoughts With Our financial data analysis driven compare market share of brand Powerpoint Templates . They Will Make A Pretty Picture.
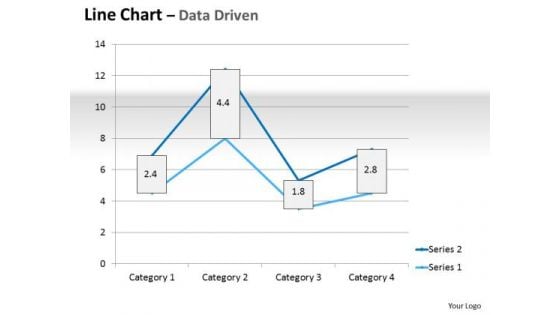
Multivariate Data Analysis Driven Line Chart Market Graph PowerPoint Slides Templates
Plan For All Contingencies With Our multivariate data analysis driven line chart market graph powerpoint slides Templates . Douse The Fire Before It Catches.
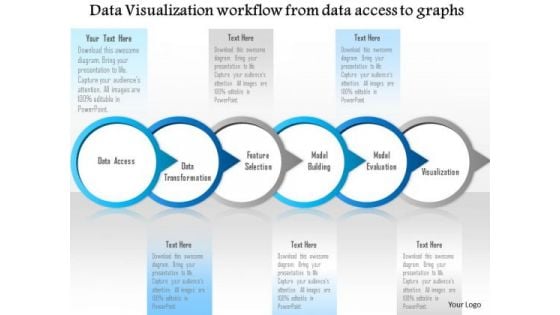
Business Diagram Data Visualization Workflow From Data Access To Graphs Ppt Slide
Graphic of workflow has been used to design this diagram. This diagram slide depicts the concept of data visualization from data access. This diagrams suitable for technology and internet related presentations.
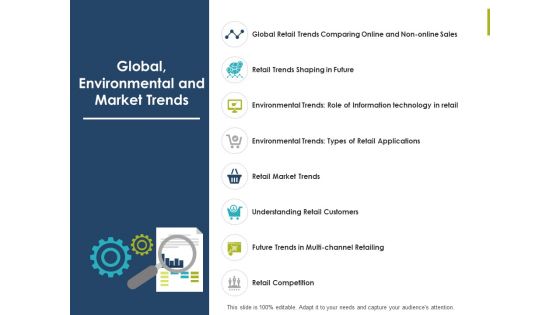
Global Environmental And Market Trends Ppt PowerPoint Presentation Show Topics
This is a global environmental and market trends ppt powerpoint presentation show topics. This is a eight stage process. The stages in this process are magnifying glass, research, marketing, strategy, business.
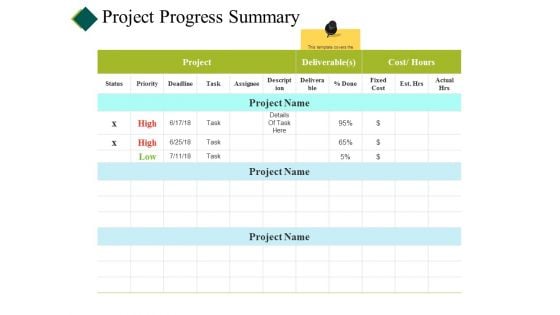
Project Progress Summary Ppt PowerPoint Presentation Inspiration Styles
This is a project progress summary ppt powerpoint presentation inspiration styles. This is a three stage process. The stages in this process are cost, planning, table, project report, data management.
Project Timeline Ppt PowerPoint Presentation Icon Graphics Design
This is a project timeline ppt powerpoint presentation icon graphics design. This is a six stage process. The stages in this process are cost, planning, table, project report, data management.
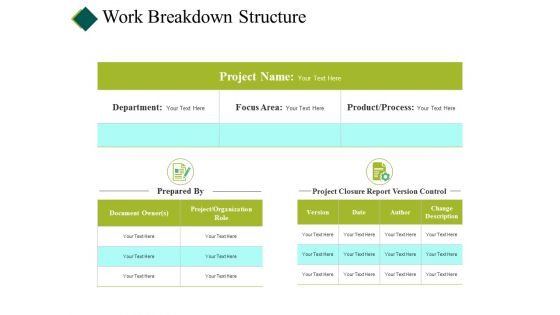
Work Breakdown Structure Ppt PowerPoint Presentation Show Example File
This is a work breakdown structure ppt powerpoint presentation show example file. This is a three stage process. The stages in this process are cost, planning, table, project report, data management.
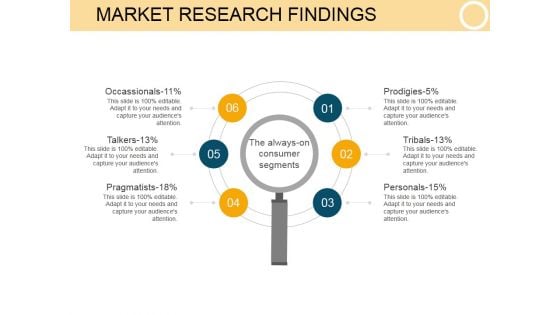
Market Research Findings Template 1 Ppt PowerPoint Presentation Backgrounds
This is a market research findings template 1 ppt powerpoint presentation backgrounds. This is a five stage process. The stages in this process are occassionals, talkers, pragmatists, personals, tribals, prodigies, the always on consumer segments.


 Continue with Email

 Home
Home


