Dashboards
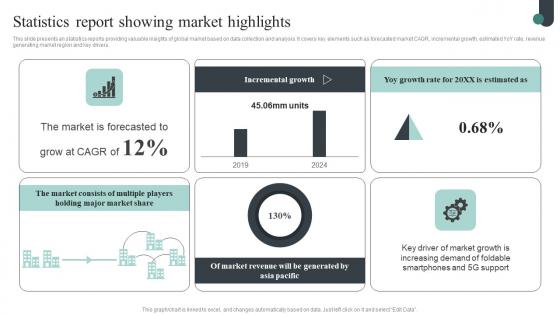
Competitive Intelligence Guide To Determine Market Statistics Report Showing Introduction Pdf
This slide presents an statistics reports providing valuable insights of global market based on data collection and analysis. It covers key elements such as forecasted market CAGR, incremental growth, estimated YoY rate, revenue generating market region and key drivers. The Competitive Intelligence Guide To Determine Market Statistics Report Showing Introduction Pdf is a compilation of the most recent design trends as a series of slides. It is suitable for any subject or industry presentation, containing attractive visuals and photo spots for businesses to clearly express their messages. This template contains a variety of slides for the user to input data, such as structures to contrast two elements, bullet points, and slides for written information. Slidegeeks is prepared to create an impression. This slide presents an statistics reports providing valuable insights of global market based on data collection and analysis. It covers key elements such as forecasted market CAGR, incremental growth, estimated YoY rate, revenue generating market region and key drivers.
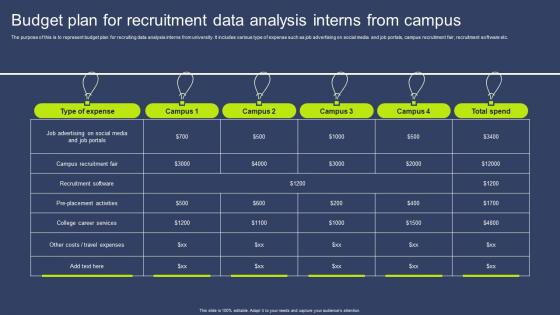
Budget Plan For Recruitment Data Analysis Interns From Campus Mockup Pdf
The purpose of this is to represent budget plan for recruiting data analysis interns from university. It includes various type of expense such as job advertising on social media and job portals, campus recruitment fair, recruitment software etc. Pitch your topic with ease and precision using this Budget Plan For Recruitment Data Analysis Interns From Campus Mockup Pdf. This layout presents information on Type Expense, Campus Recruitment Fair, Recruitment Software. It is also available for immediate download and adjustment. So, changes can be made in the color, design, graphics or any other component to create a unique layout. The purpose of this is to represent budget plan for recruiting data analysis interns from university. It includes various type of expense such as job advertising on social media and job portals, campus recruitment fair, recruitment software etc.
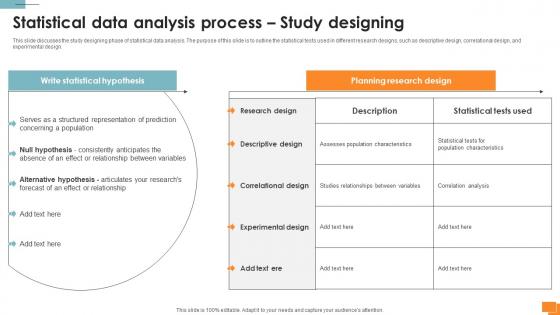
A135 Statistical Tools For Evidence Statistical Data Analysis Process Study Designing
This slide discusses the study designing phase of statistical data analysis. The purpose of this slide is to outline the statistical tests used in different research designs, such as descriptive design, correlational design, and experimental design. Slidegeeks is one of the best resources for PowerPoint templates. You can download easily and regulate A135 Statistical Tools For Evidence Statistical Data Analysis Process Study Designing for your personal presentations from our wonderful collection. A few clicks is all it takes to discover and get the most relevant and appropriate templates. Use our Templates to add a unique zing and appeal to your presentation and meetings. All the slides are easy to edit and you can use them even for advertisement purposes. This slide discusses the study designing phase of statistical data analysis. The purpose of this slide is to outline the statistical tests used in different research designs, such as descriptive design, correlational design, and experimental design.
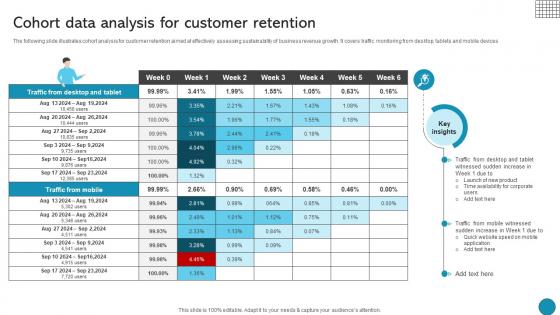
Cohort Data Analysis For Customer Retention Driving Business Success Integrating Product
The following slide illustrates cohort analysis for customer retention aimed at effectively assessing sustainability of business revenue growth. It covers traffic monitoring from desktop, tablets and mobile devicesFind highly impressive Cohort Data Analysis For Customer Retention Driving Business Success Integrating Product on Slidegeeks to deliver a meaningful presentation. You can save an ample amount of time using these presentation templates. No need to worry to prepare everything from scratch because Slidegeeks experts have already done a huge research and work for you. You need to download Cohort Data Analysis For Customer Retention Driving Business Success Integrating Product for your upcoming presentation. All the presentation templates are 100 percent editable and you can change the color and personalize the content accordingly. Download now The following slide illustrates cohort analysis for customer retention aimed at effectively assessing sustainability of business revenue growth. It covers traffic monitoring from desktop, tablets and mobile devices
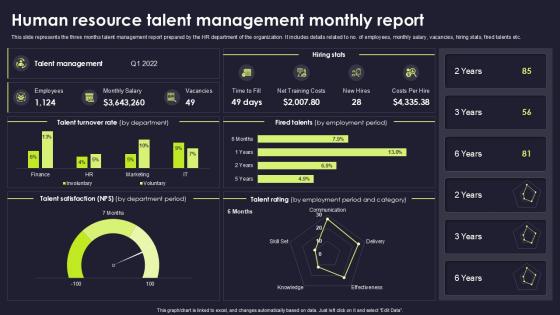
Human Resource Talent Management Monthly Report
Get a simple yet stunning designed Human Resource Talent Management Monthly Report. It is the best one to establish the tone in your meetings. It is an excellent way to make your presentations highly effective. So, download this PPT today from Slidegeeks and see the positive impacts. Our easy-to-edit Human Resource Talent Management Monthly Report can be your go-to option for all upcoming conferences and meetings. So, what are you waiting for Grab this template today. This slide presents a comprehensive three-month talent management report prepared by the HR department. It provides key data about the organizations workforce, including the total number of employees, monthly salary details, open vacancies, hiring statistics, and information on employees who were let go.
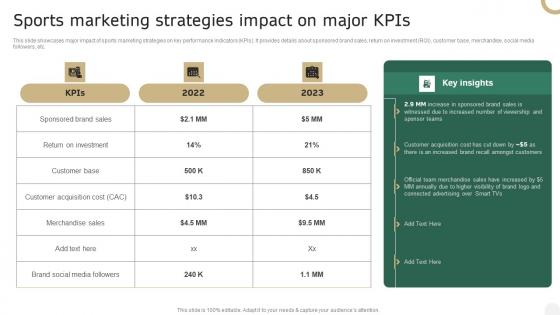
Sports Marketing Strategies Impact On Major Kpis In Depth Campaigning Guide Infographics PDF
This slide showcases major impact of sports marketing strategies on key performance indicators KPIs. It provides details about sponsored brand sales, return on investment ROI, customer base, merchandise, social media followers, etc. Present like a pro with Sports Marketing Strategies Impact On Major Kpis In Depth Campaigning Guide Infographics PDF Create beautiful presentations together with your team, using our easy-to-use presentation slides. Share your ideas in real-time and make changes on the fly by downloading our templates. So whether you are in the office, on the go, or in a remote location, you can stay in sync with your team and present your ideas with confidence. With Slidegeeks presentation got a whole lot easier. Grab these presentations today. This slide showcases major impact of sports marketing strategies on key performance indicators KPIs. It provides details about sponsored brand sales, return on investment ROI, customer base, merchandise, social media followers, etc.
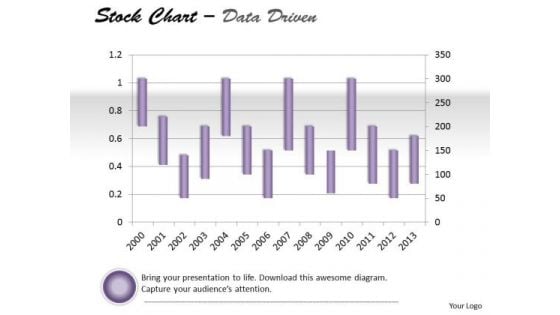
Data Analysis On Excel Driven Stock Chart For Market History PowerPoint Slides Templates
Draw Out The Best In You With Our data analysis on excel driven stock chart for market history powerpoint slides Templates . Let Your Inner Brilliance Come To The Surface.
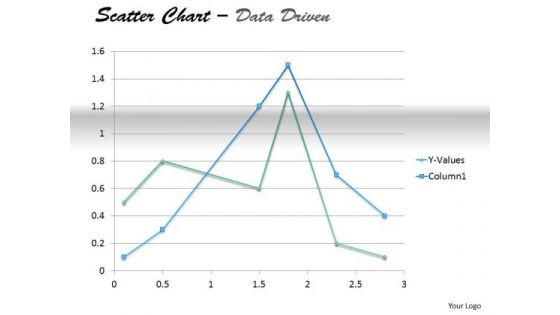
Examples Of Data Analysis Market Driven Present In Scatter Chart PowerPoint Slides Templates
Your Thoughts Will Take To Our examples of data analysis market driven present in scatter chart powerpoint slides Templates Like A Duck To Water. They Develop A Binding Affinity.
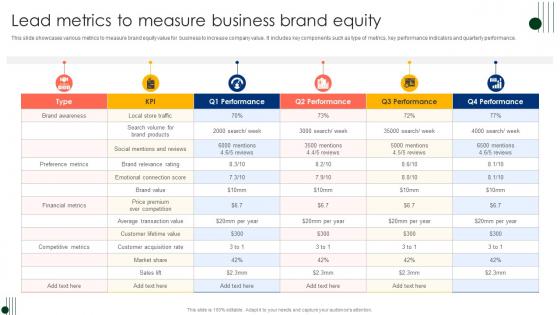
Lead Metrics To Measure Business Brand Equity Ppt Inspiration Model Pdf
This slide showcases various metrics to measure brand equity value for business to increase company value. It includes key components such as type of metrics, key performance indicators and quarterly performance. Showcasing this set of slides titled Lead Metrics To Measure Business Brand Equity Ppt Inspiration Model Pdf. The topics addressed in these templates are Key Performance Indicators, Quarterly Performance, KPI. All the content presented in this PPT design is completely editable. Download it and make adjustments in color, background, font etc. as per your unique business setting. This slide showcases various metrics to measure brand equity value for business to increase company value. It includes key components such as type of metrics, key performance indicators and quarterly performance.
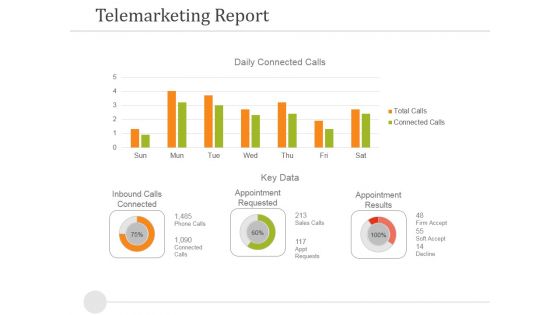
Telemarketing Report Template 1 Ppt PowerPoint Presentation Model Model
This is a telemarketing report template 1 ppt powerpoint presentation model model. This is a two stage process. The stages in this process are inbound calls connected, appointment requested, appointment results, key data.
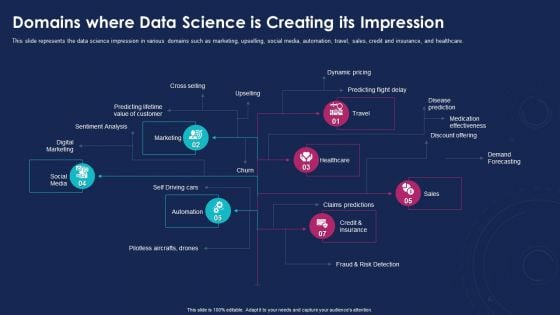
Data Analytics IT Domains Where Data Science Is Creating Its Impression Ppt Inspiration Layout Ideas PDF
This slide represents the data science impression in various domains such as marketing, upselling, social media, automation, travel, sales, credit and insurance, and healthcare. Presenting data analytics it domains where data science is creating its impression ppt inspiration layout ideas pdf to provide visual cues and insights. Share and navigate important information on seven stages that need your due attention. This template can be used to pitch topics like social media, marketing, automation, healthcare, credit and insurance. In addtion, this PPT design contains high resolution images, graphics, etc, that are easily editable and available for immediate download.
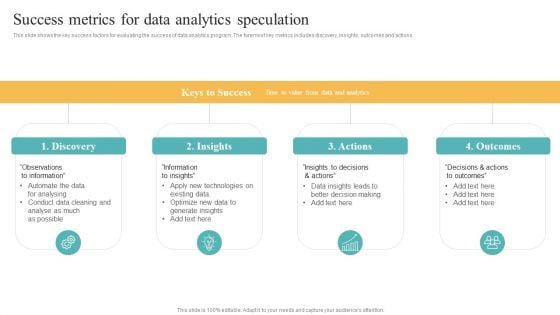
Transformation Toolkit Competitive Intelligence Information Analysis Success Metrics For Data Analytics Speculation Diagrams PDF
This slide shows the key success factors for evaluating the success of data analytics program. The foremost key metrics includes discovery, insights, outcomes and actions. Do you have to make sure that everyone on your team knows about any specific topic I yes, then you should give Transformation Toolkit Competitive Intelligence Information Analysis Success Metrics For Data Analytics Speculation Diagrams PDF a try. Our experts have put a lot of knowledge and effort into creating this impeccable Transformation Toolkit Competitive Intelligence Information Analysis Success Metrics For Data Analytics Speculation Diagrams PDF. You can use this template for your upcoming presentations, as the slides are perfect to represent even the tiniest detail. You can download these templates from the Slidegeeks website and these are easy to edit. So grab these today.
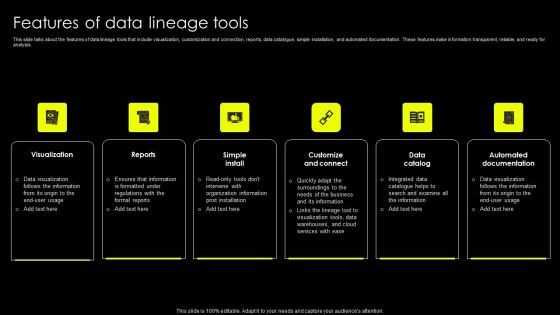
Data Lineage Implementation Features Of Data Lineage Tools Template PDF
This slide talks about the features of data lineage tools that include visualization, customization and connection, reports, data catalogue, simple installation, and automated documentation. These features make information transparent, reliable, and ready for analysis. The best PPT templates are a great way to save time, energy, and resources. Slidegeeks have 100 percent editable powerpoint slides making them incredibly versatile. With these quality presentation templates, you can create a captivating and memorable presentation by combining visually appealing slides and effectively communicating your message. Download Data Lineage Implementation Features Of Data Lineage Tools Template PDF from Slidegeeks and deliver a wonderful presentation.
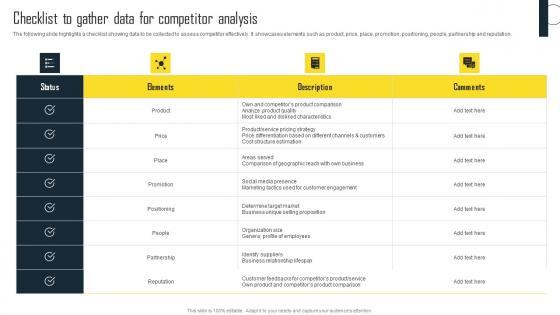
Checklist To Gather Data For Competitor Analysis Efficient Plan For Conducting Competitor Inspiration Pdf
The following slide highlights a checklist showing data to be collected to assess competitor effectively. It showcases elements such as product, price, place, promotion, positioning, people, partnership and reputation. From laying roadmaps to briefing everything in detail, our templates are perfect for you. You can set the stage with your presentation slides. All you have to do is download these easy-to-edit and customizable templates. Checklist To Gather Data For Competitor Analysis Efficient Plan For Conducting Competitor Inspiration Pdf will help you deliver an outstanding performance that everyone would remember and praise you for. Do download this presentation today. The following slide highlights a checklist showing data to be collected to assess competitor effectively. It showcases elements such as product, price, place, promotion, positioning, people, partnership and reputation.
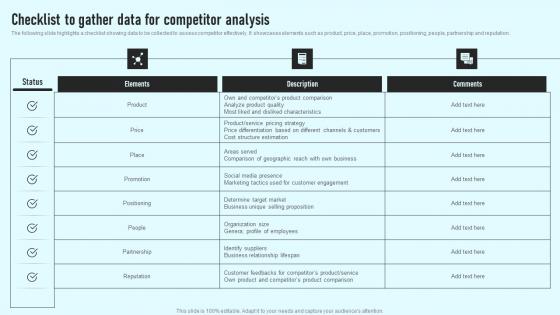
Checklist To Gather Data For Competitor Analysis Comprehensive Guide Designs Pdf
The following slide highlights a checklist showing data to be collected to assess competitor effectively. It showcases elements such as product, price, place, promotion, positioning, people, partnership and reputation. Present like a pro with Checklist To Gather Data For Competitor Analysis Comprehensive Guide Designs Pdf Create beautiful presentations together with your team, using our easy-to-use presentation slides. Share your ideas in real-time and make changes on the fly by downloading our templates. So whether you are in the office, on the go, or in a remote location, you can stay in sync with your team and present your ideas with confidence. With Slidegeeks presentation got a whole lot easier. Grab these presentations today. The following slide highlights a checklist showing data to be collected to assess competitor effectively. It showcases elements such as product, price, place, promotion, positioning, people, partnership and reputation.
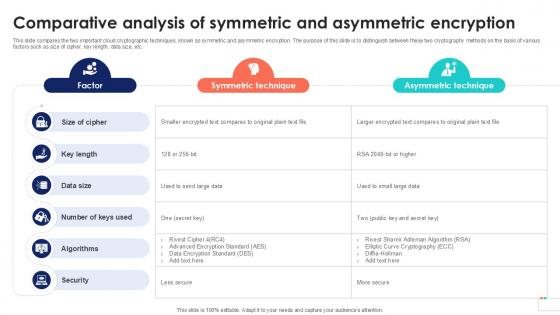
Comparative Analysis Of Symmetric Data Security In Cloud Computing Ppt Sample
This slide compares the two important cloud cryptographic techniques, known as symmetric and asymmetric encryption. The purpose of this slide is to distinguish between these two cryptography methods on the basis of various factors such as size of cipher, key length, data size, etc. Make sure to capture your audiences attention in your business displays with our gratis customizable Comparative Analysis Of Symmetric Data Security In Cloud Computing Ppt Sample. These are great for business strategies, office conferences, capital raising or task suggestions. If you desire to acquire more customers for your tech business and ensure they stay satisfied, create your own sales presentation with these plain slides. This slide compares the two important cloud cryptographic techniques, known as symmetric and asymmetric encryption. The purpose of this slide is to distinguish between these two cryptography methods on the basis of various factors such as size of cipher, key length, data size, etc.
Comparative Analysis Of Symmetric Cloud Data Security Using Cryptography Clipart Pdf
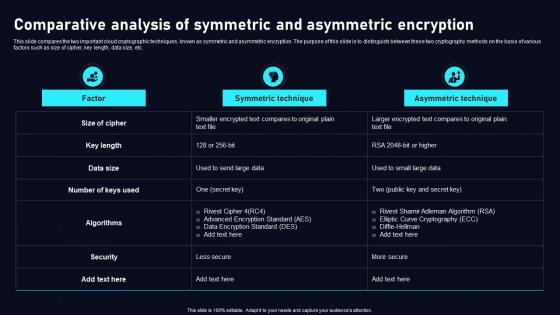
This slide compares the two important cloud cryptographic techniques, known as symmetric and asymmetric encryption. The purpose of this slide is to distinguish between these two cryptography methods on the basis of various factors such as size of cipher, key length, data size, etc. Explore a selection of the finest Comparative Analysis Of Symmetric Cloud Data Security Using Cryptography Clipart Pdf here. With a plethora of professionally designed and pre made slide templates, you can quickly and easily find the right one for your upcoming presentation. You can use our Comparative Analysis Of Symmetric Cloud Data Security Using Cryptography Clipart Pdf to effectively convey your message to a wider audience. Slidegeeks has done a lot of research before preparing these presentation templates. The content can be personalized and the slides are highly editable. Grab templates today from Slidegeeks. This slide compares the two important cloud cryptographic techniques, known as symmetric and asymmetric encryption. The purpose of this slide is to distinguish between these two cryptography methods on the basis of various factors such as size of cipher, key length, data size, etc.

Principles Of Behavioral Analysis Biomedical Data Science And Health Informatics Mockup Pdf
This slide depicts the principles of behavioral analysis using digital biomarkers. It also includes the components, such as a microphone, camera, activity, location, light sensor, call and text logs, browser history, screen events, and human computer interactions. There are so many reasons you need a Principles Of Behavioral Analysis Biomedical Data Science And Health Informatics Mockup Pdf. The first reason is you can not spend time making everything from scratch, Thus, Slidegeeks has made presentation templates for you too. You can easily download these templates from our website easily. This slide depicts the principles of behavioral analysis using digital biomarkers. It also includes the components, such as a microphone, camera, activity, location, light sensor, call and text logs, browser history, screen events, and human computer interactions.
Data Lake Architecture Future Of Data Analysis How Data Lakehouse Solves Data Lake Challenges Demonstration PDF
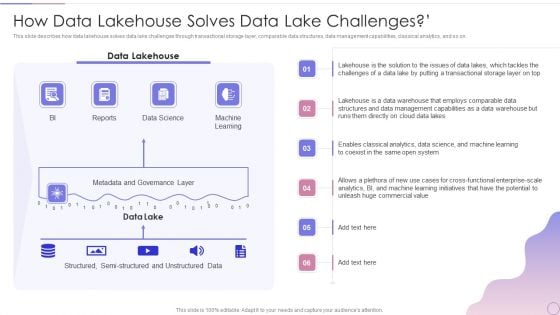
This slide describes how data lakehouse solves data lake challenges through transactional storage layer, comparable data structures, data management capabilities, classical analytics, and so on.Deliver an awe inspiring pitch with this creative Data Lake Architecture Future Of Data Analysis How Data Lakehouse Solves Data Lake Challenges Demonstration PDF bundle. Topics like Metadata And Governance, Machine Learning, Structured And Unstructured can be discussed with this completely editable template. It is available for immediate download depending on the needs and requirements of the user.
Market Constraints Impacting Consumer Electronics Smartphones Industry Report PPT Presentation IR SS V
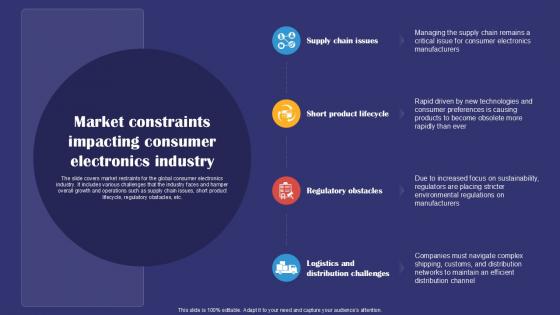
The slide covers market restraints for the global consumer electronics industry. It includes various challenges that the industry faces and hamper overall growth and operations such as supply chain issues, short product lifecycle, regulatory obstacles, etc. The Market Constraints Impacting Consumer Electronics Smartphones Industry Report PPT Presentation IR SS V is a compilation of the most recent design trends as a series of slides. It is suitable for any subject or industry presentation, containing attractive visuals and photo spots for businesses to clearly express their messages. This template contains a variety of slides for the user to input data, such as structures to contrast two elements, bullet points, and slides for written information. Slidegeeks is prepared to create an impression. The slide covers market restraints for the global consumer electronics industry. It includes various challenges that the industry faces and hamper overall growth and operations such as supply chain issues, short product lifecycle, regulatory obstacles, etc.

Port Terminal Industry Report Ppt Sample
Toolkit For Data Science And Analytics Transition Vendor Data Profile For Data Analytics Software Infographics PDF
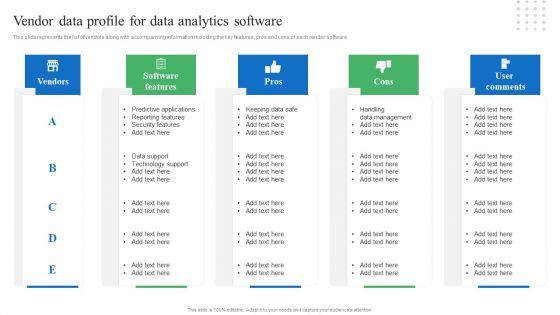
This slide represents the list of vendors along with accompanying information including the key features, pros and cons of each vendor software. If your project calls for a presentation, then Slidegeeks is your go to partner because we have professionally designed, easy to edit templates that are perfect for any presentation. After downloading, you can easily edit Toolkit For Data Science And Analytics Transition Vendor Data Profile For Data Analytics Software Infographics PDF and make the changes accordingly. You can rearrange slides or fill them with different images. Check out all the handy templates.
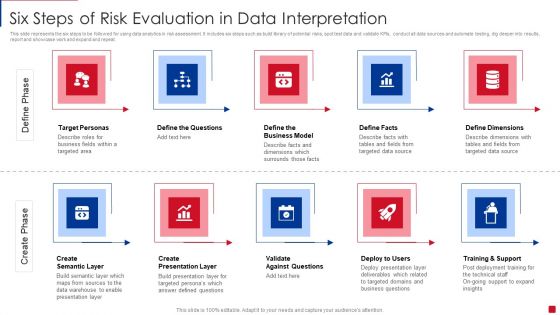
Six Steps Of Risk Evaluation In Data Interpretation Introduction PDF
This slide represents the six steps to be followed for using data analytics in risk assessment. It includes six steps such as build library of potential risks, spot test data and validate KPIs, conduct all data sources and automate testing, dig deeper into results, report and showcase work and expand and repeat. Persuade your audience using this Six Steps Of Risk Evaluation In Data Interpretation Introduction PDF. This PPT design covers six stages, thus making it a great tool to use. It also caters to a variety of topics including Expand And Repeat, Report Showcase Work, Potential Risks. Download this PPT design now to present a convincing pitch that not only emphasizes the topic but also showcases your presentation skills.
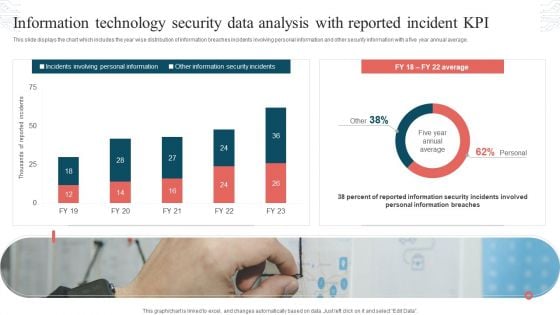
Information Technology Security Data Analysis With Reported Incident KPI Download PDF
This slide displays the chart which includes the year wise distribution of information breaches incidents involving personal information and other security information with a five year annual average. Showcasing this set of slides titled Information Technology Security Data Analysis With Reported Incident KPI Download PDF. The topics addressed in these templates are Incidents Involving, Personal Information, Other Information, Security Incidents. All the content presented in this PPT design is completely editable. Download it and make adjustments in color, background, font etc. as per your unique business setting.
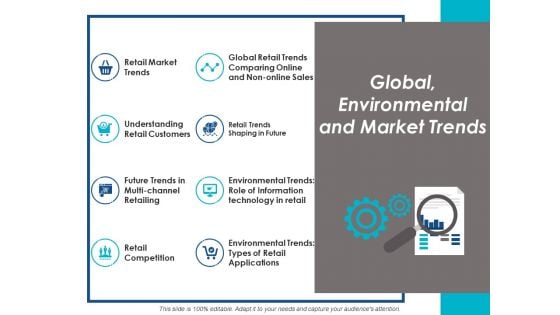
Global Environmental And Market Trends Ppt Powerpoint Presentation Infographics Gallery
This is a global environmental and market trends ppt powerpoint presentation infographics gallery. This is a eight stage process. The stages in this process are business, management, planning, strategy.
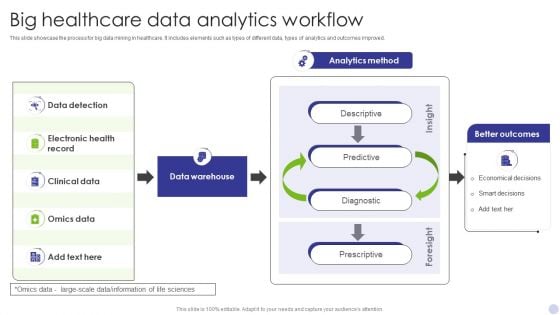
Big Healthcare Data Analytics Workflow Infographics PDF
This slide showcase the process for big data mining in healthcare. It includes elements such as types of different data, types of analytics and outcomes improved. Showcasing this set of slides titled Big Healthcare Data Analytics Workflow Infographics PDF. The topics addressed in these templates are Data Detection, Electronic Health Record, Clinical Data. All the content presented in this PPT design is completely editable. Download it and make adjustments in color, background, font etc. as per your unique business setting.
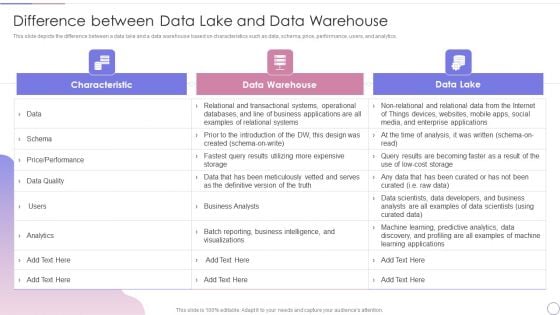
Data Lake Architecture Future Of Data Analysis Difference Between Data Lake And Data Warehouse Information PDF
This slide depicts the difference between a data lake and a data warehouse based on characteristics such as data, schema, price, performance, users, and analytics.Deliver an awe inspiring pitch with this creative Data Lake Architecture Future Of Data Analysis Difference Between Data Lake And Data Warehouse Information PDF bundle. Topics like Relational And Transactional, Systems Operational, Databases can be discussed with this completely editable template. It is available for immediate download depending on the needs and requirements of the user.

Real Time Data Analysis Ppt Powerpoint Presentation Complete Deck With Slides
Improve your presentation delivery using this Real Time Data Analysis Ppt Powerpoint Presentation Complete Deck With Slides. Support your business vision and objectives using this well-structured PPT deck. This template offers a great starting point for delivering beautifully designed presentations on the topic of your choice. Comprising twenty slides this professionally designed template is all you need to host discussion and meetings with collaborators. Each slide is self-explanatory and equipped with high-quality graphics that can be adjusted to your needs. Therefore, you will face no difficulty in portraying your desired content using this PPT slideshow. This PowerPoint slideshow contains every important element that you need for a great pitch. It is not only editable but also available for immediate download and utilization. The color, font size, background, shapes everything can be modified to create your unique presentation layout. Therefore, download it now. Our Real Time Data Analysis Ppt Powerpoint Presentation Complete Deck With Slides are topically designed to provide an attractive backdrop to any subject. Use them to look like a presentation pro.
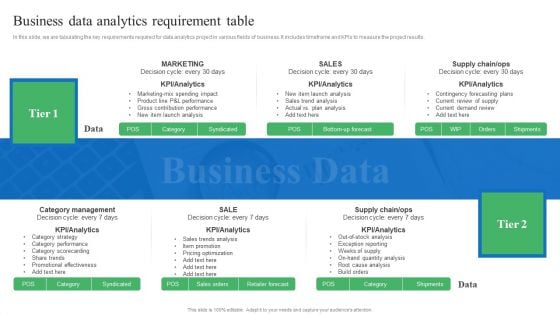
Toolkit For Data Science And Analytics Transition Business Data Analytics Requirement Table Sample PDF
In this slide, we are tabulating the key requirements required for data analytics project in various fields of business. It includes timeframe and KPIs to measure the project results. This Toolkit For Data Science And Analytics Transition Business Data Analytics Requirement Table Sample PDF from Slidegeeks makes it easy to present information on your topic with precision. It provides customization options, so you can make changes to the colors, design, graphics, or any other component to create a unique layout. It is also available for immediate download, so you can begin using it right away. Slidegeeks has done good research to ensure that you have everything you need to make your presentation stand out. Make a name out there for a brilliant performance.
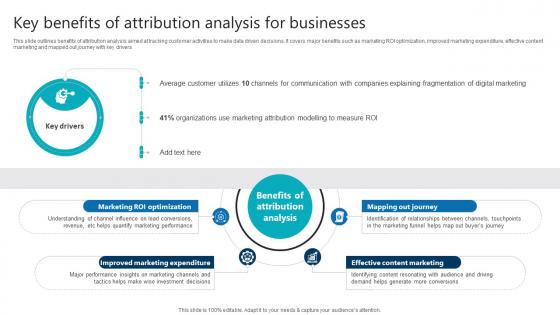
Key Benefits Of Attribution Analysis For Businesses Product Analytics Implementation Data Analytics V
This slide outlines benefits of attribution analysis aimed at tracking customer activities to make data driven decisions. It covers major benefits such as marketing ROI optimization, improved marketing expenditure, effective content marketing and mapped out journey with key drivers Presenting this PowerPoint presentation, titled Key Benefits Of Attribution Analysis For Businesses Product Analytics Implementation Data Analytics V, with topics curated by our researchers after extensive research. This editable presentation is available for immediate download and provides attractive features when used. Download now and captivate your audience. Presenting this Key Benefits Of Attribution Analysis For Businesses Product Analytics Implementation Data Analytics V. Our researchers have carefully researched and created these slides with all aspects taken into consideration. This is a completely customizable Key Benefits Of Attribution Analysis For Businesses Product Analytics Implementation Data Analytics V that is available for immediate downloading. Download now and make an impact on your audience. Highlight the attractive features available with our PPTs. This slide outlines benefits of attribution analysis aimed at tracking customer activities to make data driven decisions. It covers major benefits such as marketing ROI optimization, improved marketing expenditure, effective content marketing and mapped out journey with key drivers

Overview Of Key Findings Ppt PowerPoint Presentation Complete Deck With Slides
Presenting this set of slides with name overview of key findings ppt powerpoint presentation complete deck with slides. The topics discussed in these slides are overview, key findings, agenda, marketing, business. This is a completely editable PowerPoint presentation and is available for immediate download. Download now and impress your audience.
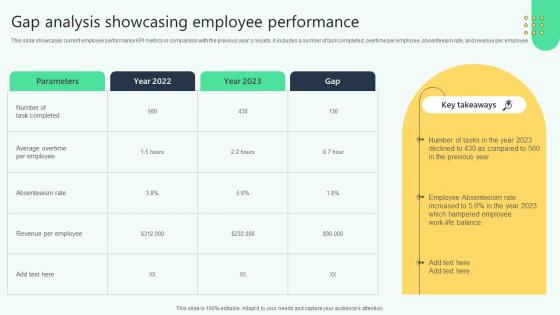
Gap Analysis Showcasing Employee Performance Analysing Hr Data For Effective Decision Making
This slide showcases current employee performance KPI metrics in comparison with the previous years results. It includes a number of task completed, overtime per employee, absenteeism rate, and revenue per employee. This modern and well-arranged Gap Analysis Showcasing Employee Performance Analysing Hr Data For Effective Decision Making provides lots of creative possibilities. It is very simple to customize and edit with the Powerpoint Software. Just drag and drop your pictures into the shapes. All facets of this template can be edited with Powerpoint, no extra software is necessary. Add your own material, put your images in the places assigned for them, adjust the colors, and then you can show your slides to the world, with an animated slide included. This slide showcases current employee performance KPI metrics in comparison with the previous years results. It includes a number of task completed, overtime per employee, absenteeism rate, and revenue per employee.
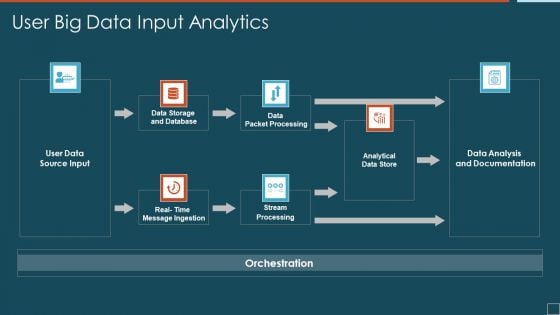
User Big Data Input Analytics Designs PDF
Showcasing this set of slides titled user big data input analytics designs pdf. The topics addressed in these templates are analytical data store, data packet processing, stream processing. All the content presented in this PPT design is completely editable. Download it and make adjustments in color, background, font etc. as per your unique business setting.

Transformation Toolkit Competitive Intelligence Information Analysis Key Reasons For Failure Of Data Analytics Project Portrait PDF
This slide describes a list of key reasons responsible for the failure of delivering accurate data analytics results to the business. The best PPT templates are a great way to save time, energy, and resources. Slidegeeks have 100 percent editable powerpoint slides making them incredibly versatile. With these quality presentation templates, you can create a captivating and memorable presentation by combining visually appealing slides and effectively communicating your message. Download Transformation Toolkit Competitive Intelligence Information Analysis Key Reasons For Failure Of Data Analytics Project Portrait PDF from Slidegeeks and deliver a wonderful presentation.

Agenda Product Analytics Implementation For Enhanced Business Insights Data Analytics V
Find a pre-designed and impeccable Agenda Product Analytics Implementation For Enhanced Business Insights Data Analytics V. The templates can ace your presentation without additional effort. You can download these easy-to-edit presentation templates to make your presentation stand out from others. So, what are you waiting for Download the template from Slidegeeks today and give a unique touch to your presentation. Our Agenda Product Analytics Implementation For Enhanced Business Insights Data Analytics V are topically designed to provide an attractive backdrop to any subject. Use them to look like a presentation pro.
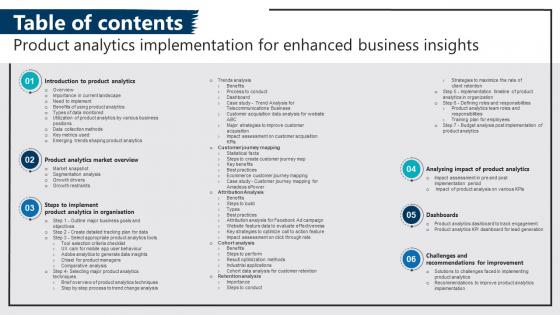
Table Of Contents Product Analytics Implementation For Enhanced Business Insights Data Analytics V
The best PPT templates are a great way to save time, energy, and resources. Slidegeeks have 100 percent editable powerpoint slides making them incredibly versatile. With these quality presentation templates, you can create a captivating and memorable presentation by combining visually appealing slides and effectively communicating your message. Download Table Of Contents Product Analytics Implementation For Enhanced Business Insights Data Analytics V from Slidegeeks and deliver a wonderful presentation. Our Table Of Contents Product Analytics Implementation For Enhanced Business Insights Data Analytics V are topically designed to provide an attractive backdrop to any subject. Use them to look like a presentation pro.
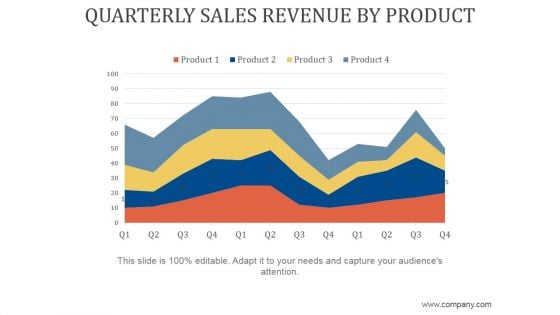
Quarterly Sales Revenue By Product Ppt PowerPoint Presentation Background Designs
This is a quarterly sales revenue by product ppt powerpoint presentation background designs. This is a four stage process. The stages in this process are business, strategy, marketing, analysis, growth strategy.
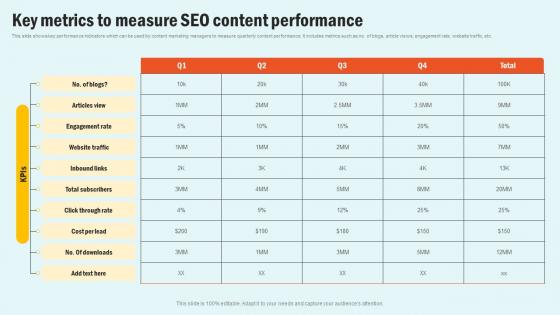
Key Metrics To Measure SEO Enhancing Website Performance With Search Engine Content Background Pdf
This slide shows key performance indicators which can be used by content marketing managers to measure quarterly content performance. It includes metrics such as no. of blogs, article views, engagement rate, website traffic, etc. Formulating a presentation can take up a lot of effort and time, so the content and message should always be the primary focus. The visuals of the PowerPoint can enhance the presenters message, so our Key Metrics To Measure SEO Enhancing Website Performance With Search Engine Content Background Pdf was created to help save time. Instead of worrying about the design, the presenter can concentrate on the message while our designers work on creating the ideal templates for whatever situation is needed. Slidegeeks has experts for everything from amazing designs to valuable content, we have put everything into Key Metrics To Measure SEO Enhancing Website Performance With Search Engine Content Background Pdf This slide shows key performance indicators which can be used by content marketing managers to measure quarterly content performance. It includes metrics such as no. of blogs, article views, engagement rate, website traffic, etc.
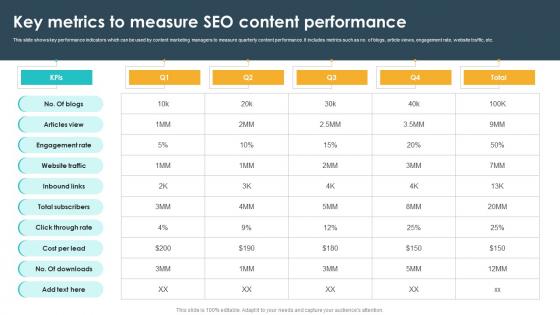
Key Metrics To Measure Seo Content Performance Seo Content Plan To Drive Strategy SS V
This slide shows key performance indicators which can be used by content marketing managers to measure quarterly content performance. It includes metrics such as no. of blogs, article views, engagement rate, website traffic, etc. Formulating a presentation can take up a lot of effort and time, so the content and message should always be the primary focus. The visuals of the PowerPoint can enhance the presenters message, so our Key Metrics To Measure Seo Content Performance Seo Content Plan To Drive Strategy SS V was created to help save time. Instead of worrying about the design, the presenter can concentrate on the message while our designers work on creating the ideal templates for whatever situation is needed. Slidegeeks has experts for everything from amazing designs to valuable content, we have put everything into Key Metrics To Measure Seo Content Performance Seo Content Plan To Drive Strategy SS V This slide shows key performance indicators which can be used by content marketing managers to measure quarterly content performance. It includes metrics such as no. of blogs, article views, engagement rate, website traffic, etc.
Structure Of A Data Analysis Report Framework Business Ppt PowerPoint Presentation Complete Deck
Boost your confidence and team morale with this well-structured structure of a data analysis report framework business ppt powerpoint presentation complete deck. This prefabricated set gives a voice to your presentation because of its well-researched content and graphics. Our experts have added all the components very carefully, thus helping you deliver great presentations with a single click. Not only that, it contains a set of twelve slides that are designed using the right visuals, graphics, etc. Various topics can be discussed, and effective brainstorming sessions can be conducted using the wide variety of slides added in this complete deck. Apart from this, our PPT design contains clear instructions to help you restructure your presentations and create multiple variations. The color, format, design anything can be modified as deemed fit by the user. Not only this, it is available for immediate download. So, grab it now.
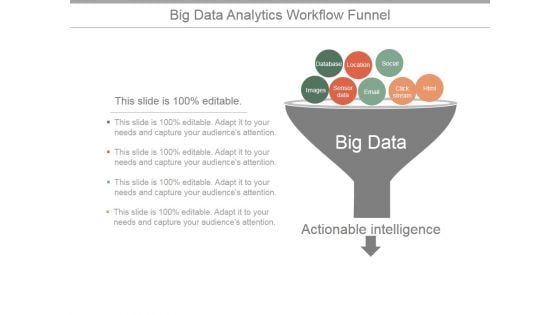
Big Data Analytics Workflow Funnel Ppt PowerPoint Presentation Rules
This is a big data analytics workflow funnel ppt powerpoint presentation rules. This is a one stage process. The stages in this process are database, location, social, images, sensor data, email, clickstream, html, actionable intelligence.
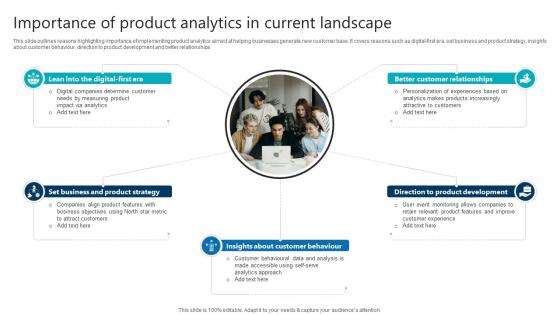
Importance Of Product Analytics In Current Landscape Product Analytics Implementation Data Analytics V
This slide outlines reasons highlighting importance of implementing product analytics aimed at helping businesses generate new customer base. It covers reasons such as digital-first era, set business and product strategy, insights about customer behaviour, direction to product development and better relationships Slidegeeks has constructed Importance Of Product Analytics In Current Landscape Product Analytics Implementation Data Analytics V after conducting extensive research and examination. These presentation templates are constantly being generated and modified based on user preferences and critiques from editors. Here, you will find the most attractive templates for a range of purposes while taking into account ratings and remarks from users regarding the content. This is an excellent jumping-off point to explore our content and will give new users an insight into our top-notch PowerPoint Templates. This slide outlines reasons highlighting importance of implementing product analytics aimed at helping businesses generate new customer base. It covers reasons such as digital-first era, set business and product strategy, insights about customer behaviour, direction to product development and better relationships
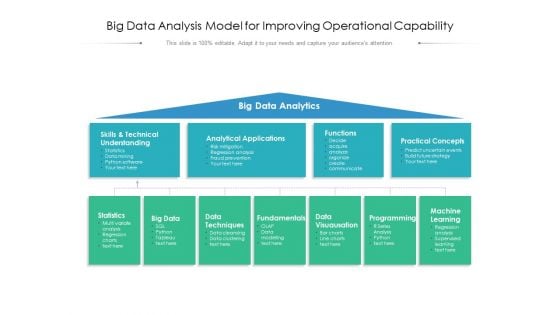
Big Data Analysis Model For Improving Operational Capability Ppt PowerPoint Presentation Infographics Visuals PDF
Presenting this set of slides with name big data analysis model for improving operational capability ppt powerpoint presentation infographics visuals pdf. This is a one stage process. The stages in this process are big data analytics, skills and technical understanding, analytical applications, functions, practical concepts, statistics, big data, data techniques, fundamentals, data visuausation, programming, machine learning. This is a completely editable PowerPoint presentation and is available for immediate download. Download now and impress your audience.
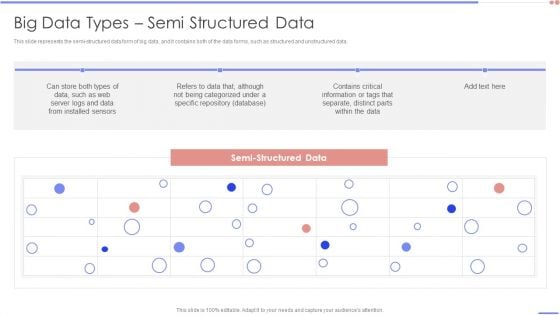
Data Analytics Management Big Data Types Semi Structured Data Formats PDF
This slide represents the semi-structured data form of big data, and it contains both of the data forms, such as structured and unstructured data.Deliver and pitch your topic in the best possible manner with this Data Analytics Management Big Data Types Semi Structured Data Formats PDF. Use them to share invaluable insights on Installed Sensors, Specific Repository, Information Or Tags and impress your audience. This template can be altered and modified as per your expectations. So, grab it now.
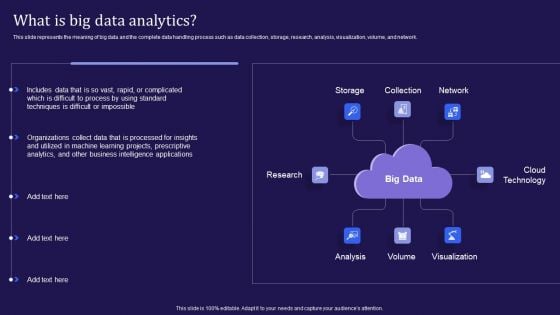
Big Data Analytics Lifecycle What Is Big Data Analytics Ppt Layouts Portrait PDF
This slide represents the meaning of big data and the complete data handling process such as data collection, storage, research, analysis, visualization, volume, and network. Present like a pro with Big Data Analytics Lifecycle What Is Big Data Analytics Ppt Layouts Portrait PDF Create beautiful presentations together with your team, using our easy-to-use presentation slides. Share your ideas in real-time and make changes on the fly by downloading our templates. So whether youre in the office, on the go, or in a remote location, you can stay in sync with your team and present your ideas with confidence. With Slidegeeks presentation got a whole lot easier. Grab these presentations today.
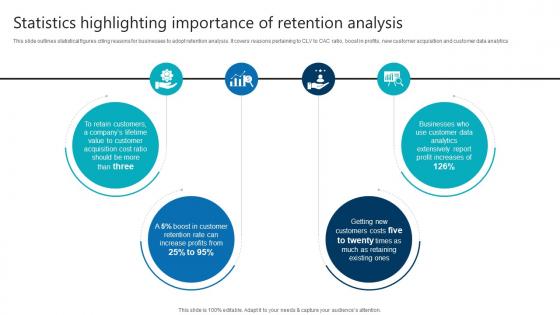
Statistics Highlighting Importance Of Retention Analysis Product Analytics Implementation Data Analytics V
This slide outlines statistical figures citing reasons for businesses to adopt retention analysis. It covers reasons pertaining to CLV to CAC ratio, boost in profits, new customer acquisition and customer data analyticsAre you in need of a template that can accommodate all of your creative concepts This one is crafted professionally and can be altered to fit any style. Use it with Google Slides or PowerPoint. Include striking photographs, symbols, depictions, and other visuals. Fill, move around, or remove text boxes as desired. Test out color palettes and font mixtures. Edit and save your work, or work with colleagues. Download Statistics Highlighting Importance Of Retention Analysis Product Analytics Implementation Data Analytics V and observe how to make your presentation outstanding. Give an impeccable presentation to your group and make your presentation unforgettable. This slide outlines statistical figures citing reasons for businesses to adopt retention analysis. It covers reasons pertaining to CLV to CAC ratio, boost in profits, new customer acquisition and customer data analytics

Prescriptive Analytics Software Tool IBM Decision Optimization Data Analytics SS V
This slide provides an overview of advanced analytic tool Alteryx. It covers details regarding unique selling propositions, customer reviews and pricing plans of Alteryx.The best PPT templates are a great way to save time, energy, and resources. Slidegeeks have 100 percent editable powerpoint slides making them incredibly versatile. With these quality presentation templates, you can create a captivating and memorable presentation by combining visually appealing slides and effectively communicating your message. Download Prescriptive Analytics Software Tool IBM Decision Optimization Data Analytics SS V from Slidegeeks and deliver a wonderful presentation. This slide provides an overview of advanced analytic tool Alteryx. It covers details regarding unique selling propositions, customer reviews and pricing plans of Alteryx.
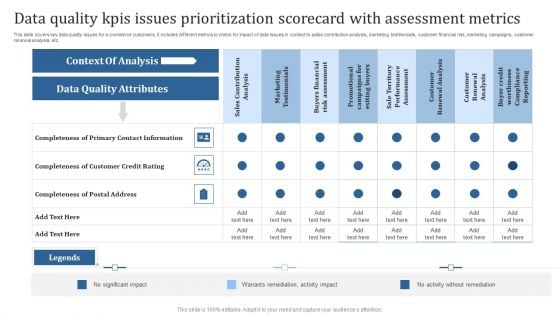
Data Quality Kpis Issues Prioritization Scorecard With Assessment Metrics Ideas PDF
This slide covers key data quality issues for e-commerce customers. It includes different metrics to check for impact of data issues in context to sales contribution analysis, marketing testimonials, customer financial risk, marketing campaigns, customer renewal analysis, etc. Showcasing this set of slides titled Data Quality Kpis Issues Prioritization Scorecard With Assessment Metrics Ideas PDF. The topics addressed in these templates are Context Of Analysis, Data Quality Attributes. All the content presented in this PPT design is completely editable. Download it and make adjustments in color, background, font etc. as per your unique business setting.
HR Process Analysis Vector Icon Ppt PowerPoint Presentation Styles Professional PDF
Presenting HR process analysis vector icon ppt powerpoint presentation styles professional pdf to dispense important information. This template comprises three stages. It also presents valuable insights into the topics including hr process analysis vector icon. This is a completely customizable PowerPoint theme that can be put to use immediately. So, download it and address the topic impactfully.
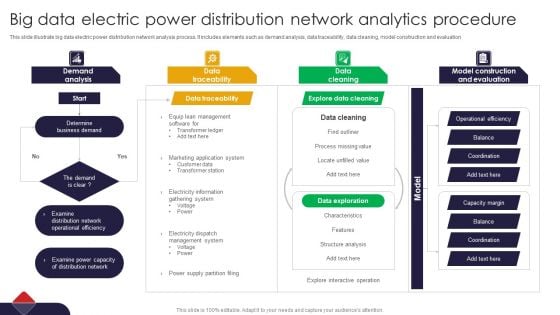
Big Data Electric Power Distribution Network Analytics Procedure Slides PDF
This slide illustrate big data electric power distribution network analysis process. It includes elements such as demand analysis, data traceability, data cleaning, model construction and evaluation Persuade your audience using this Big Data Electric Power Distribution Network Analytics Procedure Slides PDF. This PPT design covers three stages, thus making it a great tool to use. It also caters to a variety of topics including Demand Analysis, Data Traceability, Data Cleaning. Download this PPT design now to present a convincing pitch that not only emphasizes the topic but also showcases your presentation skills.
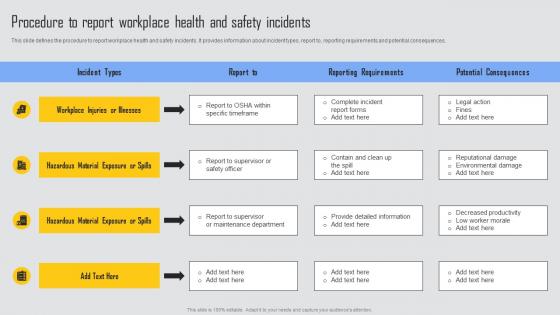
Procedure To Report Workplace Managing Risks And Establishing Trust Through Efficient Structure Pdf
This slide defines the procedure to report workplace health and safety incidents. It provides information about incident types, report to, reporting requirements and potential consequences. The Procedure To Report Workplace Managing Risks And Establishing Trust Through Efficient Structure Pdf is a compilation of the most recent design trends as a series of slides. It is suitable for any subject or industry presentation, containing attractive visuals and photo spots for businesses to clearly express their messages. This template contains a variety of slides for the user to input data, such as structures to contrast two elements, bullet points, and slides for written information. Slidegeeks is prepared to create an impression. This slide defines the procedure to report workplace health and safety incidents. It provides information about incident types, report to, reporting requirements and potential consequences.
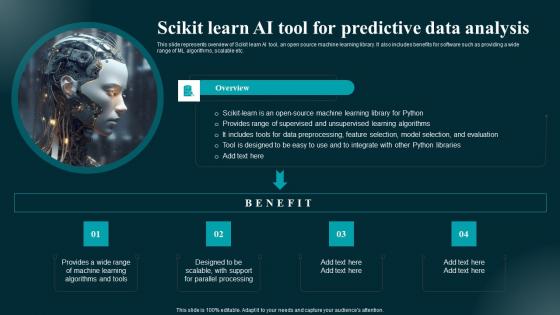
Scikit Learn AI Tool For Predictive Data Analysis Applications And Impact Information Pdf
This slide represents overview of Scikit learn AI tool, an open source machine learning library. It also includes benefits for software such as providing a wide range of ML algorithms, scalable etc. Slidegeeks is one of the best resources for PowerPoint templates. You can download easily and regulate for your personal presentations from our wonderful collection. A few clicks is all it takes to discover and get the most relevant and appropriate templates. Use our Templates to add a unique zing and appeal to your presentation and meetings. All the slides are easy to edit and you can use them even for advertisement purposes. This slide represents overview of Scikit learn AI tool, an open source machine learning library. It also includes benefits for software such as providing a wide range of ML algorithms, scalable etc.
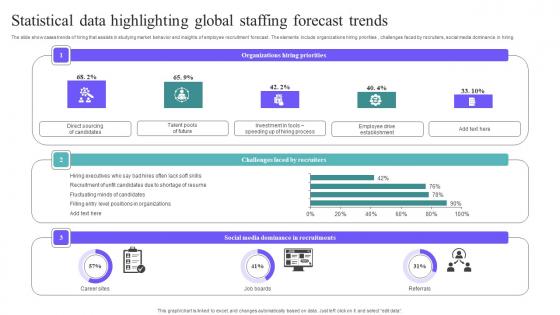
Statistical Data Highlighting Global Staffing Forecast Trends Template Pdf
The slide showcases trends of hiring that assists in studying market behavior and insights of employee recruitment forecast . The elements include organizations hiring priorities , challenges faced by recruiters, social media dominance in hiring. Showcasing this set of slides titled Statistical Data Highlighting Global Staffing Forecast Trends Template Pdf. The topics addressed in these templates are Hiring Executives, Fluctuating Minds, Filling Entry Level Positions. All the content presented in this PPT design is completely editable. Download it and make adjustments in color, background, font etc. as per your unique business setting. The slide showcases trends of hiring that assists in studying market behavior and insights of employee recruitment forecast . The elements include organizations hiring priorities , challenges faced by recruiters, social media dominance in hiring.
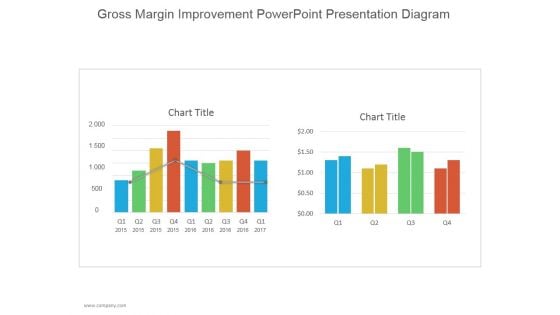
Gross Margin Improvement Ppt PowerPoint Presentation Tips
This is a gross margin improvement ppt powerpoint presentation tips. This is a two stage process. The stages in this process are chart title, business, strategy, marketing, line graph, chart and graph.
Bar Chart With Magnifying Glass For Product Performance Analysis Ppt PowerPoint Presentation Gallery Example File PDF
Presenting bar chart with magnifying glass for product performance analysis ppt powerpoint presentation gallery example file pdf to dispense important information. This template comprises three stages. It also presents valuable insights into the topics including bar chart with magnifying glass for product performance analysis. This is a completely customizable PowerPoint theme that can be put to use immediately. So, download it and address the topic impactfully.
Electric Circuit Issues Analysis Vector Icon Ppt PowerPoint Presentation Gallery Graphics Template PDF
Persuade your audience using this electric circuit issues analysis vector icon ppt powerpoint presentation gallery graphics template pdf. This PPT design covers three stages, thus making it a great tool to use. It also caters to a variety of topics including electric circuit issues analysis vector icon. Download this PPT design now to present a convincing pitch that not only emphasizes the topic but also showcases your presentation skills.
Pie Chart For Data Presentation Vector Ppt PowerPoint Presentation Summary Files
Presenting this set of slides with name pie chart for data presentation vector ppt powerpoint presentation summary files. The topics discussed in these slides are data visualization icon, research analysis, business focus. This is a completely editable PowerPoint presentation and is available for immediate download. Download now and impress your audience.
Magnifying Glass With Arrow Statistical Analysis Vector Icon Ppt PowerPoint Presentation Show Icon
Presenting this set of slides with name magnifying glass with arrow statistical analysis vector icon ppt powerpoint presentation show icon. This is a three stage process. The stages in this process are data icon, status icon, status symbol icon. This is a completely editable PowerPoint presentation and is available for immediate download. Download now and impress your audience.

Significant Stages Of Financial Audit System Ppt PowerPoint Presentation Backgrounds
This is a significant stages of financial audit system ppt powerpoint presentation backgrounds. This is a eight stage process. The stages in this process are planning of the audit, audit report, review of financial statements, testing of internal controls.
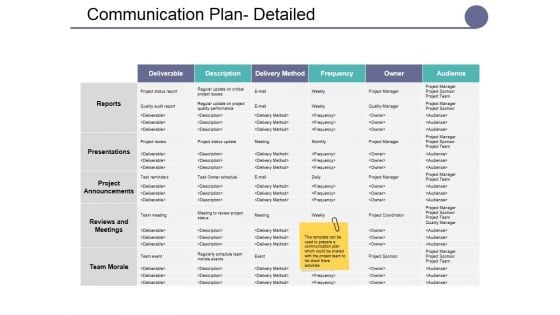
Communication Plan Detailed Ppt PowerPoint Presentation Slides Model
This is a communication plan detailed ppt powerpoint presentation slides model. This is a five stage process. The stages in this process are reports, presentations, project announcements, reviews and meetings, team morale.


 Continue with Email

 Home
Home


