Dashboards
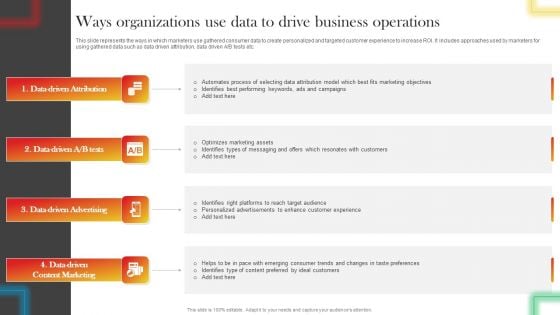
Ways Organizations Use Data To Drive Business Operations Brochure PDF
This slide represents the ways in which marketers use gathered consumer data to create personalized and targeted customer experience to increase ROI. It includes approaches used by marketers for using gathered data such as data driven attribution, data driven A OR B tests etc. Find highly impressive Ways Organizations Use Data To Drive Business Operations Brochure PDF on Slidegeeks to deliver a meaningful presentation. You can save an ample amount of time using these presentation templates. No need to worry to prepare everything from scratch because Slidegeeks experts have already done a huge research and work for you. You need to download Ways Organizations Use Data To Drive Business Operations Brochure PDF for your upcoming presentation. All the presentation templates are 100 percent editable and you can change the color and personalize the content accordingly. Download now
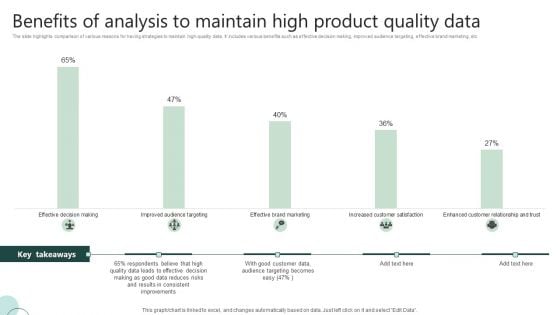
Benefits Of Analysis To Maintain High Product Quality Data Ppt Portfolio Gallery PDF
The slide highlights comparison of various reasons for having strategies to maintain high-quality data. It includes various benefits such as effective decision making, improved audience targeting, effective brand marketing, etc. Showcasing this set of slides titled Benefits Of Analysis To Maintain High Product Quality Data Ppt Portfolio Gallery PDF. The topics addressed in these templates are Effective Decision, Quality Data Leads, Good Customer Data. All the content presented in this PPT design is completely editable. Download it and make adjustments in color, background, font etc. as per your unique business setting.
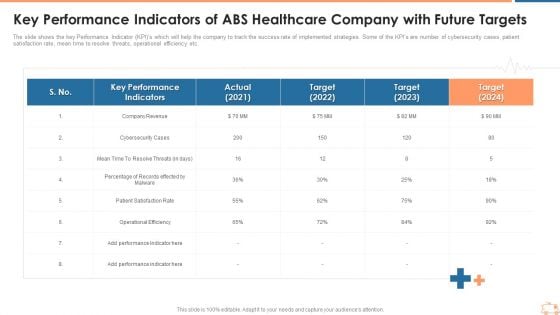
Key Performance Indicators Of ABS Healthcare Company With Future Targets Topics PDF
The slide shows the key Performance Indicator KPI s which will help the company to track the success rate of implemented strategies. Some of the KPIs are number of cybersecurity cases, patient satisfaction rate, mean time to resolve threats, operational efficiency etc. Deliver an awe inspiring pitch with this creative key performance indicators of abs healthcare company with future targets topics pdf bundle. Topics like patient satisfaction rate, operational efficiency, target can be discussed with this completely editable template. It is available for immediate download depending on the needs and requirements of the user.
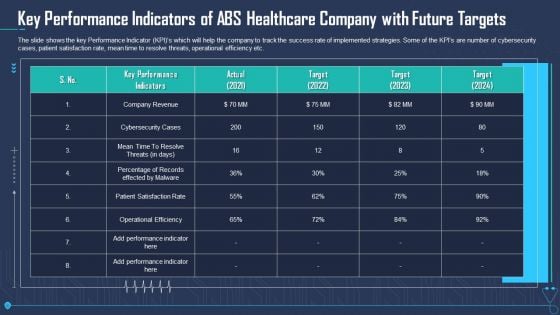
Key Performance Indicators Of ABS Healthcare Company With Future Targets Template PDF
The slide shows the key Performance Indicator KPI s which will help the company to track the success rate of implemented strategies. Some of the KPIs are number of cybersecurity cases, patient satisfaction rate, mean time to resolve threats, operational efficiency etc. Deliver an awe inspiring pitch with this creative key performance indicators of abs healthcare company with future targets template pdf bundle. Topics like company revenue, cybersecurity cases, operational efficiency can be discussed with this completely editable template. It is available for immediate download depending on the needs and requirements of the user.
Improvement In Employee Turnover In Technology Industry Key Performance Indicators Icons PDF
The slide shows the key Performance Indicator KPI s which will help the company to track the success rate of implemented strategies. Major KPIs include number of Total Employee Turnover, Employee Attrition rate, Total Recruitment, etc. Deliver and pitch your topic in the best possible manner with this improvement in employee turnover in technology industry key performance indicators icons pdf. Use them to share invaluable insights on recruitment, attrition, employee and impress your audience. This template can be altered and modified as per your expectations. So, grab it now.
Roadmap For Financial Accounting Transformation Key Performance Indicators To Track The Success Of Accounting Icons PDF
The slide shows key Performance Indicator KPI which will help the company to track the success of Accounting and Finance Transformation. Major KPIs include revenue, operating profit margin, net profit margin, invoice errors, net discount etc. Deliver an awe inspiring pitch with this creative roadmap for financial accounting transformation key performance indicators to track the success of accounting icons pdf bundle. Topics like revenue, operating profit margin, net profit margin, invoice errors, net discount can be discussed with this completely editable template. It is available for immediate download depending on the needs and requirements of the user.
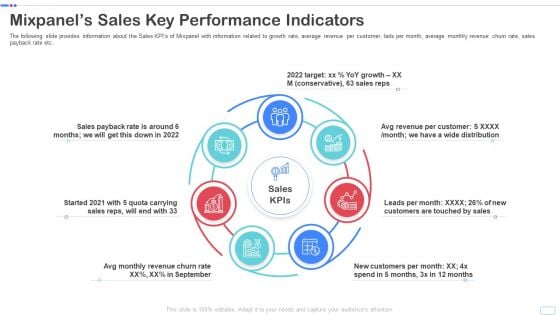
Mixpanel Capital Raising Pitch Deck Mixpanels Sales Key Performance Indicators Clipart PDF
The following slide provides information about the Sales KPIs of Mixpanel with information related to growth rate, average revenue per customer, lads per month, average monthly revenue churn rate, sales payback rate etc. This is a mixpanel capital raising pitch deck mixpanels sales key performance indicators clipart pdf template with various stages. Focus and dispense information on seven stages using this creative set, that comes with editable features. It contains large content boxes to add your information on topics like mixpanels sales key performance indicators. You can also showcase facts, figures, and other relevant content using this PPT layout. Grab it now.
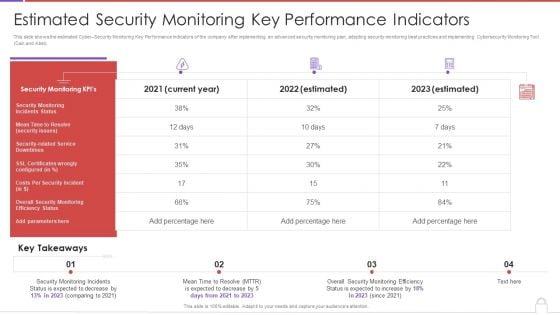
Methods To Develop Advanced Estimated Security Monitoring Key Performance Indicators Structure PDF
This slide shows the estimated Cyber Security Monitoring Key Performance Indicators of the company after implementing an advanced security monitoring plan, adopting security monitoring best practices and implementing Cybersecurity Monitoring Tool Cain and Abel. Deliver an awe inspiring pitch with this creative methods to develop advanced estimated security monitoring key performance indicators structure pdf bundle. Topics like security monitoring kpis, costs per security incident can be discussed with this completely editable template. It is available for immediate download depending on the needs and requirements of the user.
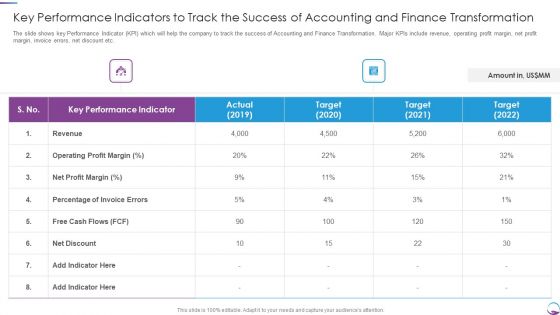
Key Performance Indicators To Track The Success Of Accounting And Finance Transformation Ideas PDF
The slide shows key Performance Indicator KPI which will help the company to track the success of Accounting and Finance Transformation. Major KPIs include revenue, operating profit margin, net profit margin, invoice errors, net discount etc. Deliver and pitch your topic in the best possible manner with this Key Performance Indicators To Track The Success Of Accounting And Finance Transformation Ideas PDF. Use them to share invaluable insights on Revenue, Net Profit Margin, Target and impress your audience. This template can be altered and modified as per your expectations. So, grab it now.

Finance And Accounting Online Conversion Plan Key Performance Indicators To Track Microsoft PDF
The slide shows key Performance Indicator KPI which will help the company to track the success of Accounting and Finance Transformation. Major KPIs include revenue, operating profit margin, net profit margin, invoice errors, net discount etc. Deliver an awe inspiring pitch with this creative Finance And Accounting Online Conversion Plan Key Performance Indicators To Track Microsoft PDF bundle. Topics like Operating Profit, Percentage Invoice, Revenue can be discussed with this completely editable template. It is available for immediate download depending on the needs and requirements of the user.
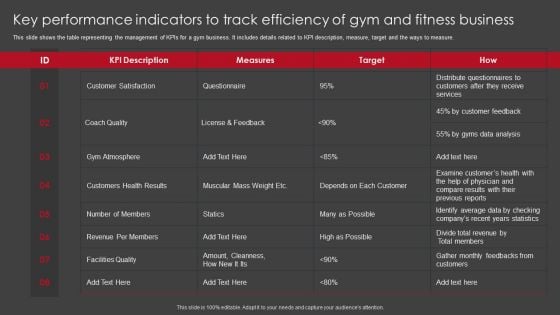
Key Performance Indicators To Track Efficiency Of Gym And Fitness Business Themes PDF
This slide shows the table representing the management of KPIs for a gym business. It includes details related to KPI description, measure, target and the ways to measure. Pitch your topic with ease and precision using this Key Performance Indicators To Track Efficiency Of Gym And Fitness Business Themes PDF. This layout presents information on Key Performance Indicators, Track Efficiency, Gym And Fitness Business. It is also available for immediate download and adjustment. So, changes can be made in the color, design, graphics or any other component to create a unique layout.
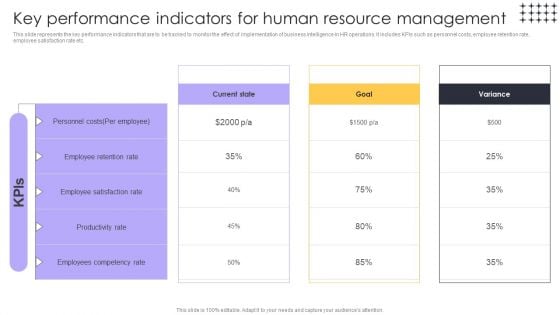
Tools For HR Business Analytics Key Performance Indicators For Human Resource Elements PDF
This slide represents the key performance indicators that are to be tracked to monitor the effect of implementation of business intelligence in HR operations. It includes KPIs such as personnel costs, employee retention rate, employee satisfaction rate etc. The best PPT templates are a great way to save time, energy, and resources. Slidegeeks have 100 percent editable powerpoint slides making them incredibly versatile. With these quality presentation templates, you can create a captivating and memorable presentation by combining visually appealing slides and effectively communicating your message. Download Tools For HR Business Analytics Key Performance Indicators For Human Resource Elements PDF from Slidegeeks and deliver a wonderful presentation.
Icon For Data Analytics Healthcare Tools Portrait PDF
Presenting Icon For Data Analytics Healthcare Tools Portrait PDF to dispense important information. This template comprises Three stages. It also presents valuable insights into the topics including Icon For Data, Analytics, Healthcare Tools. This is a completely customizable PowerPoint theme that can be put to use immediately. So, download it and address the topic impactfully.
Machine Learning Healthcare Data Analytics Icon Background PDF
Persuade your audience using this Machine Learning Healthcare Data Analytics Icon Background PDF. This PPT design covers Three stages, thus making it a great tool to use. It also caters to a variety of topics including Machine Learning, Healthcare Data, Analytics Icon. Download this PPT design now to present a convincing pitch that not only emphasizes the topic but also showcases your presentation skills.
Data Analytics Procedure Icon With Desktop Graphics PDF
Persuade your audience using this Data Analytics Procedure Icon With Desktop Graphics PDF. This PPT design covers four stages, thus making it a great tool to use. It also caters to a variety of topics including Data Analytics Procedure, Desktop. Download this PPT design now to present a convincing pitch that not only emphasizes the topic but also showcases your presentation skills.
Big Data And Analytics Cloud Computing Framework Icon Guidelines PDF
Presenting Big Data And Analytics Cloud Computing Framework Icon Guidelines PDF to dispense important information. This template comprises three stages. It also presents valuable insights into the topics including Big Data Analytics, Cloud Computing, Framework. This is a completely customizable PowerPoint theme that can be put to use immediately. So, download it and address the topic impactfully.
Big Data And Analytics Framework Server Icon Rules PDF
Presenting Big Data And Analytics Framework Server Icon Rules PDF to dispense important information. This template comprises four stages. It also presents valuable insights into the topics including Big Data Analytics, Framework, Server. This is a completely customizable PowerPoint theme that can be put to use immediately. So, download it and address the topic impactfully.

Healthcare Marketing Data Management Ppt PowerPoint Presentation Complete Deck With Slides
This healthcare marketing data management ppt powerpoint presentation complete deck with slides acts as backup support for your ideas, vision, thoughts, etc. Use it to present a thorough understanding of the topic. This PPT slideshow can be utilized for both in-house and outside presentations depending upon your needs and business demands. Entailing twelve slides with a consistent design and theme, this template will make a solid use case. As it is intuitively designed, it suits every business vertical and industry. All you have to do is make a few tweaks in the content or any other component to design unique presentations. The biggest advantage of this complete deck is that it can be personalized multiple times once downloaded. The color, design, shapes, and other elements are free to modify to add personal touches. You can also insert your logo design in this PPT layout. Therefore a well-thought and crafted presentation can be delivered with ease and precision by downloading this healthcare marketing data management ppt powerpoint presentation complete deck with slides PPT slideshow.
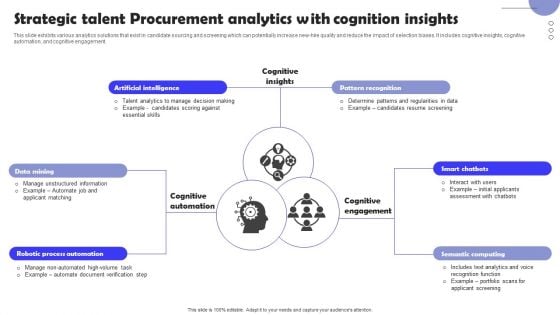
Strategic Talent Procurement Analytics With Cognition Insights Infographics PDF
This slide exhibits various analytics solutions that exist in candidate sourcing and screening which can potentially increase new-hire quality and reduce the impact of selection biases. It includes cognitive insights, cognitive automation, and cognitive engagement. Presenting Strategic Talent Procurement Analytics With Cognition Insights Infographics PDF to dispense important information. This template comprises six stages. It also presents valuable insights into the topics including Data Mining, Artificial Intelligence, Pattern Recognition, Smart Chatbots. This is a completely customizable PowerPoint theme that can be put to use immediately. So, download it and address the topic impactfully.
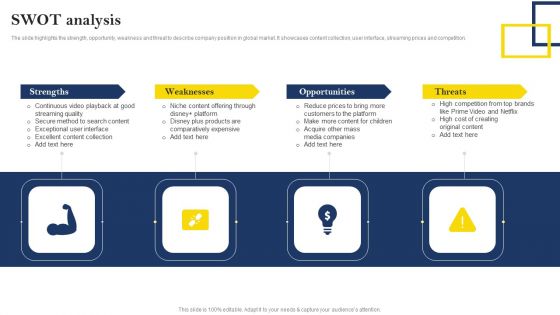
Over The Top Platform Company Profile Swot Analysis Rules PDF
The slide highlights the strength, opportunity, weakness and threat to describe company position in global market. It showcases content collection, user interface, streaming prices and competition. The Over The Top Platform Company Profile Swot Analysis Rules PDF is a compilation of the most recent design trends as a series of slides. It is suitable for any subject or industry presentation, containing attractive visuals and photo spots for businesses to clearly express their messages. This template contains a variety of slides for the user to input data, such as structures to contrast two elements, bullet points, and slides for written information. Slidegeeks is prepared to create an impression.
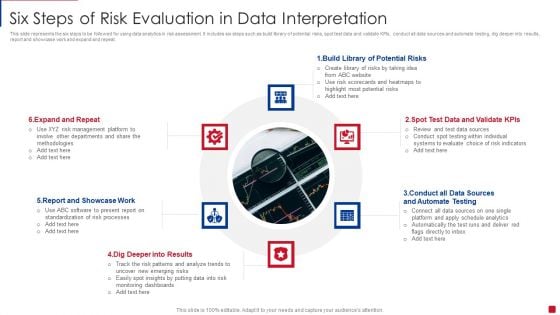
Six Steps Of Risk Evaluation In Data Interpretation Sources Brochure PDF
This slide represents the six steps to be followed for using data analytics in risk assessment. It includes six steps such as build library of potential risks, spot test data and validate KPIs, conduct all data sources and automate testing, dig deeper into results, report and showcase work and expand and repeat. Presenting Six Steps Of Risk Evaluation In Data Interpretation Sources Brochure PDF to dispense important information. This template comprises ten stages. It also presents valuable insights into the topics including Target Personas, Define The Questions, Define The Business Model. This is a completely customizable PowerPoint theme that can be put to use immediately. So, download it and address the topic impactfully.

Data Migration PowerPoint Template Ppt PowerPoint Presentation Portfolio Layout
This is a data migration powerpoint template ppt powerpoint presentation portfolio layout. This is a six stage process. The stages in this process are Migration Approach, Data Analysis, Migration Design, Migration Execution, Migration Testing.
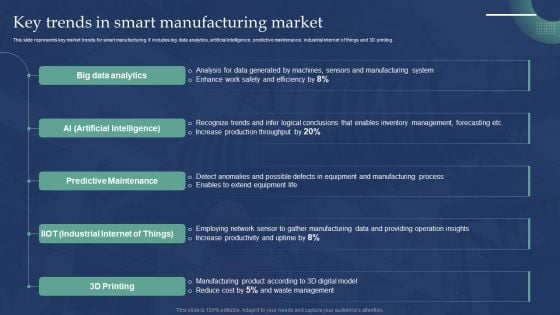
Automated Production Process To Enhance Efficiency Key Trends In Smart Manufacturing Market Topics PDF
This slide represents key market trends for smart manufacturing. It includes big data analytics, artificial intelligence, predictive maintenance, industrial internet of things and 3D printing. Do you have to make sure that everyone on your team knows about any specific topic I yes, then you should give Automated Production Process To Enhance Efficiency Key Trends In Smart Manufacturing Market Topics PDF a try. Our experts have put a lot of knowledge and effort into creating this impeccable Automated Production Process To Enhance Efficiency Key Trends In Smart Manufacturing Market Topics PDF. You can use this template for your upcoming presentations, as the slides are perfect to represent even the tiniest detail. You can download these templates from the Slidegeeks website and these are easy to edit. So grab these today.
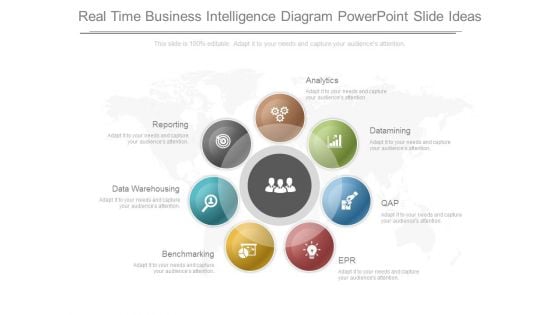
Real Time Business Intelligence Diagram Powerpoint Slide Ideas
This is a real time business intelligence diagram powerpoint slide ideas. This is a seven stage process. The stages in this process are data warehousing, reporting, analytics, datamining, qap, epr, benchmarking.
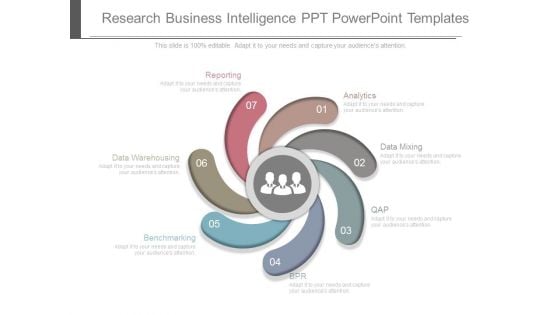
Research Business Intelligence Ppt Powerpoint Templates
This is a research business intelligence ppt powerpoint templates. This is a seven stage process. The stages in this process are data warehousing, reporting, analytics, datamining, qap, epr, benchmarking.
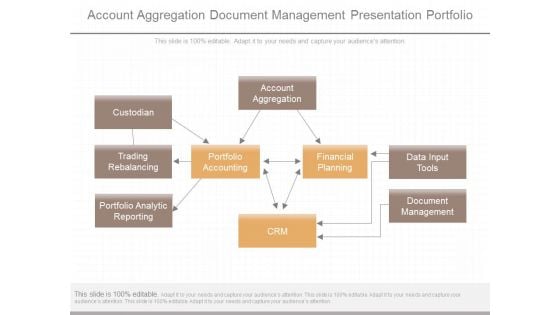
Account Aggregation Document Management Presentation Portfolio
This is a account aggregation document management presentation portfolio. This is a nine stage process. The stages in this process are custodian, trading rebalancing, portfolio analytic reporting, account aggregation, data input tools, document management, portfolio accounting, financial planning, crm.
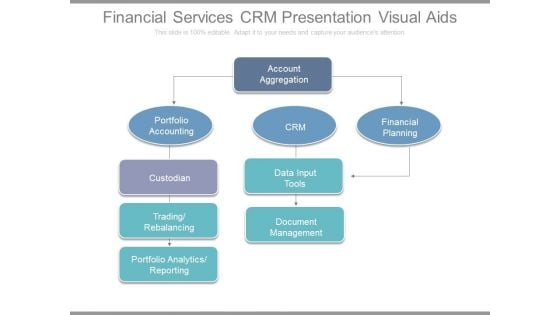
Financial Services Crm Presentation Visual Aids
This is a financial services crm presentation visual aids. This is a five stage process. The stages in this process are account aggregation, financial planning, crm, data input tools, document management, portfolio accounting, custodian, trading rebalancing, portfolio analytics reporting.
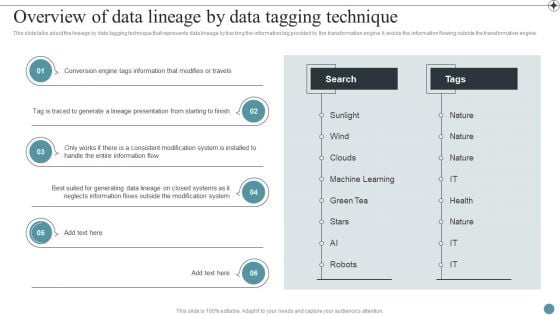
Overview Of Data Lineage By Data Tagging Technique Deploying Data Lineage IT Download PDF
This slide represents the overview of data lineage by parsing technique that reads the logic behind the automatic data processing. It also includes the tools and programming languages used by this technique such as STL logic, SQL, XML, Java and so on.This Overview Of Data Lineage By Data Tagging Technique Deploying Data Lineage IT Download PDF from Slidegeeks makes it easy to present information on your topic with precision. It provides customization options, so you can make changes to the colors, design, graphics, or any other component to create a unique layout. It is also available for immediate download, so you can begin using it right away. Slidegeeks has done good research to ensure that you have everything you need to make your presentation stand out. Make a name out there for a brilliant performance.
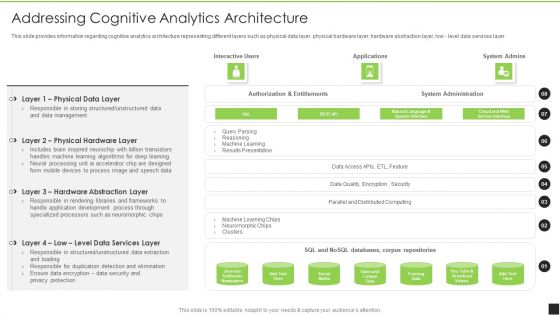
Cognitive Visualizations Computing Strategy Addressing Cognitive Analytics Contd Introduction PDF
This slide provides information regarding cognitive analytics architecture representing different layers such as physical data layer, physical hardware layer, hardware abstraction layer, low - level data services layer. Deliver and pitch your topic in the best possible manner with this Cognitive Visualizations Computing Strategy Addressing Cognitive Analytics Contd Introduction PDF. Use them to share invaluable insights on Physical Data Layer, Physical Hardware, Hardware Abstraction and impress your audience. This template can be altered and modified as per your expectations. So, grab it now.
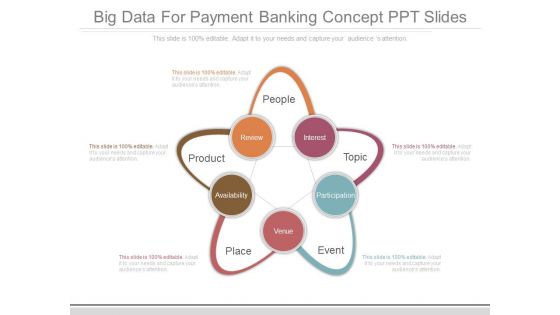
Big Data For Payment Banking Concept Ppt Slides
This is a big data for payment banking concept ppt slides. This is a five stage process. The stages in this process are people, topic, event, place, product.
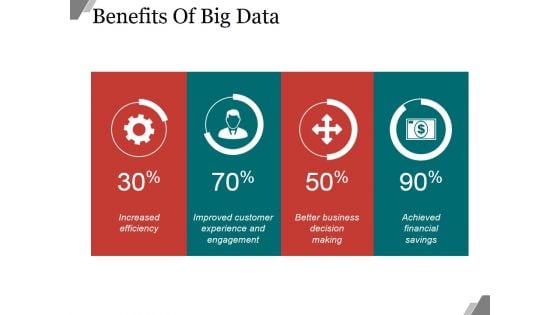
Benefits Of Big Data Ppt PowerPoint Presentation Example 2015
This is a benefits of big data ppt powerpoint presentation example 2015. This is a four stage process. The stages in this process are business, marketing, success, finance, analysis.
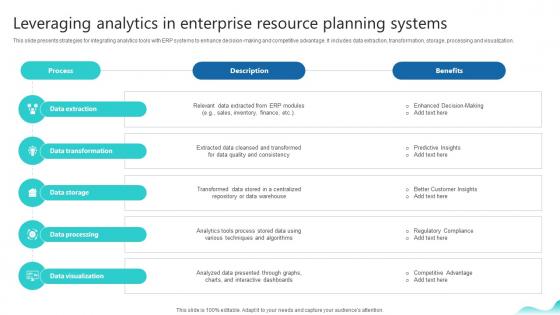
Leveraging Analytics In Enterprise Resource Planning Erp And Digital Transformation For Maximizing DT SS V
This slide presents strategies for integrating analytics tools with ERP systems to enhance decision-making and competitive advantage. It includes data extraction, transformation, storage, processing and visualization.Are you in need of a template that can accommodate all of your creative concepts This one is crafted professionally and can be altered to fit any style. Use it with Google Slides or PowerPoint. Include striking photographs, symbols, depictions, and other visuals. Fill, move around, or remove text boxes as desired. Test out color palettes and font mixtures. Edit and save your work, or work with colleagues. Download Leveraging Analytics In Enterprise Resource Planning Erp And Digital Transformation For Maximizing DT SS V and observe how to make your presentation outstanding. Give an impeccable presentation to your group and make your presentation unforgettable. This slide presents strategies for integrating analytics tools with ERP systems to enhance decision-making and competitive advantage. It includes data extraction, transformation, storage, processing and visualization.
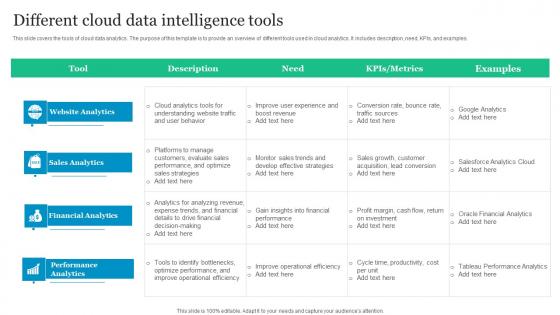
Different Cloud Data Intelligence Tools Themes Pdf
This slide covers the tools of cloud data analytics. The purpose of this template is to provide an overview of different tools used in cloud analytics. It includes description, need, KPIs, and examples. Showcasing this set of slides titled Different Cloud Data Intelligence Tools Themes Pdf. The topics addressed in these templates are Website Analytics, Sales Analytics, Financial Analytics. All the content presented in this PPT design is completely editable. Download it and make adjustments in color, background, font etc. as per your unique business setting. This slide covers the tools of cloud data analytics. The purpose of this template is to provide an overview of different tools used in cloud analytics. It includes description, need, KPIs, and examples.
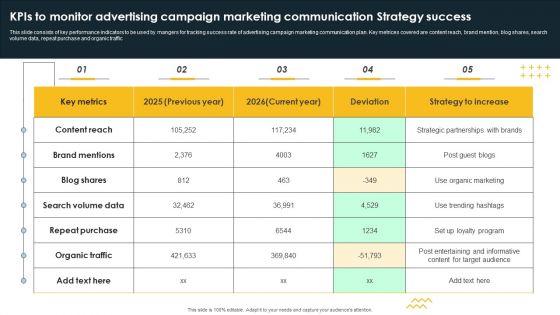
Kpis To Monitor Advertising Campaign Marketing Communication Strategy Success Pictures PDF
This slide consists of key performance indicators to be used by mangers for tracking success rate of advertising campaign marketing communication plan. Key metrices covered are content reach, brand mention, blog shares, search volume data, repeat purchase and organic traffic Showcasing this set of slides titled Kpis To Monitor Advertising Campaign Marketing Communication Strategy Success Pictures PDF. The topics addressed in these templates are Content Reach, Brand Mentions, Blog Shares. All the content presented in this PPT design is completely editable. Download it and make adjustments in color, background, font etc. as per your unique business setting.

Customized Analytical Support Diagram Powerpoint Presentation Examples
This is a customized analytical support diagram powerpoint presentation examples. This is a four stage process. The stages in this process are scope and define the problem, data gathering and investigation, develop options, recommendation report.
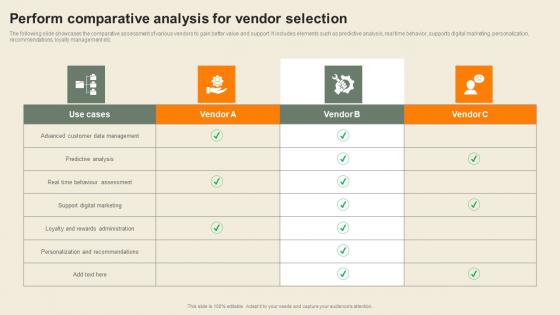
Perform Comparative Analysis For Vendor Selection Usability Of CDP Software Tool Infographics Pdf
The following slide showcases the comparative assessment of various vendors to gain better value and support. It includes elements such as predictive analysis, real time behavior, supports digital marketing, personalization, recommendations, loyalty management etc. Here you can discover an assortment of the finest PowerPoint and Google Slides templates. With these templates, you can create presentations for a variety of purposes while simultaneously providing your audience with an eye-catching visual experience. Download Perform Comparative Analysis For Vendor Selection Usability Of CDP Software Tool Infographics Pdf to deliver an impeccable presentation. These templates will make your job of preparing presentations much quicker, yet still, maintain a high level of quality. Slidegeeks has experienced researchers who prepare these templates and write high-quality content for you. Later on, you can personalize the content by editing the Perform Comparative Analysis For Vendor Selection Usability Of CDP Software Tool Infographics Pdf. The following slide showcases the comparative assessment of various vendors to gain better value and support. It includes elements such as predictive analysis, real time behavior, supports digital marketing, personalization, recommendations, loyalty management etc.
Data Analytics Ppt PowerPoint Presentation Summary Samples Cpb
This is a data analytics ppt powerpoint presentation summary samples cpb. This is a three stage process. The stages in this process are data analytics.

Data Analytics Service Ppt PowerPoint Presentation Ideas Background Images Cpb
This is a data analytics service ppt powerpoint presentation ideas background images cpb. This is a five stage process. The stages in this process are data analytics service.
Financial Data Analytics Ppt Powerpoint Presentation Show Smartart Cpb
This is a financial data analytics ppt powerpoint presentation show smartart cpb. This is a four stage process. The stages in this process are financial data analytics.
Predictive Data Analytics Ppt Powerpoint Presentation Infographics Master Slide Cpb
This is a predictive data analytics ppt powerpoint presentation infographics master slide cpb. This is a five stage process. The stages in this process are predictive data analytics.
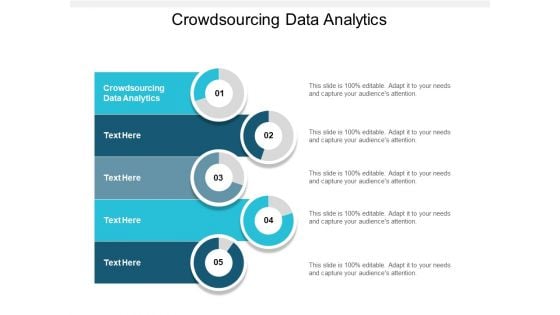
Crowdsourcing Data Analytics Ppt PowerPoint Presentation Ideas Designs Download Cpb
This is a crowdsourcing data analytics ppt powerpoint presentation ideas designs download cpb. This is a five stage process. The stages in this process are crowdsourcing data analytics.
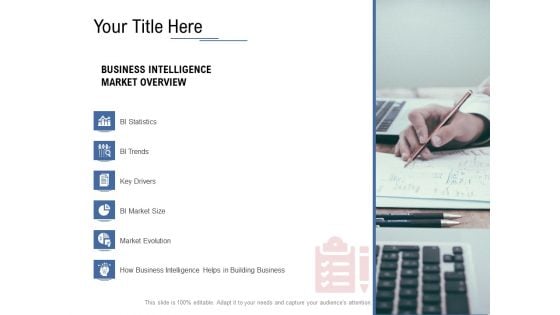
Data Assimilation Your Title Here Building Ppt Model Infographic Template PDF
This is a data assimilation your title here building ppt model infographic template pdf template with various stages. Focus and dispense information on six stages using this creative set, that comes with editable features. It contains large content boxes to add your information on topics like market evolution, bi market size, key drivers, bi trends, bi statistics. You can also showcase facts, figures, and other relevant content using this PPT layout. Grab it now.
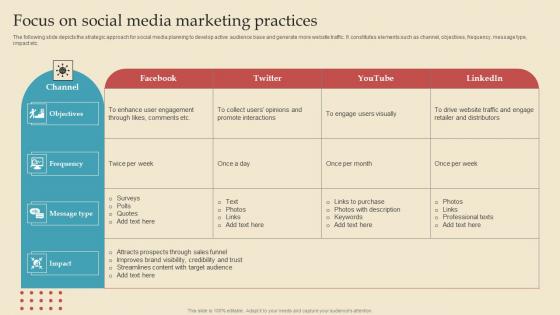
Focus On Social Media Describing Business Performance Administration Goals Infographics Pdf
The following slide depicts the strategic approach for social media planning to develop active audience base and generate more website traffic. It constitutes elements such as channel, objectives, frequency, message type,impact etc. Take your projects to the next level with our ultimate collection of Focus On Social Media Describing Business Performance Administration Goals Infographics Pdf. Slidegeeks has designed a range of layouts that are perfect for representing task or activity duration, keeping track of all your deadlines at a glance. Tailor these designs to your exact needs and give them a truly corporate look with your own brand colors they will make your projects stand out from the rest The following slide depicts the strategic approach for social media planning to develop active audience base and generate more website traffic. It constitutes elements such as channel, objectives, frequency, message type,impact etc.
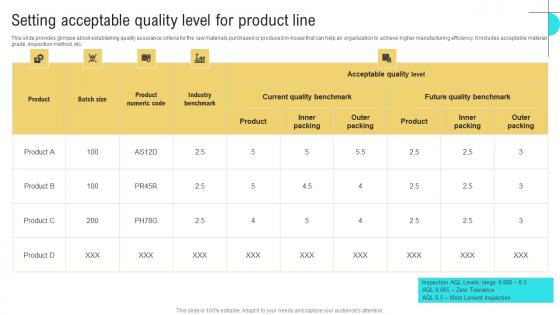
Setting Acceptable Quality Business Performance Optimization New Operations Strategy Infographics Pdf
This slide provides glimpse about establishing quality assurance criteria for the raw materials purchased or produced in house that can help an organization to achieve higher manufacturing efficiency. It includes acceptable material grade, inspection method, etc. Want to ace your presentation in front of a live audience Our Setting Acceptable Quality Business Performance Optimization New Operations Strategy Infographics Pdf can help you do that by engaging all the users towards you. Slidegeeks experts have put their efforts and expertise into creating these impeccable powerpoint presentations so that you can communicate your ideas clearly. Moreover, all the templates are customizable, and easy to edit and downloadable. Use these for both personal and commercial use. This slide provides glimpse about establishing quality assurance criteria for the raw materials purchased or produced in house that can help an organization to achieve higher manufacturing efficiency. It includes acceptable material grade, inspection method, etc.
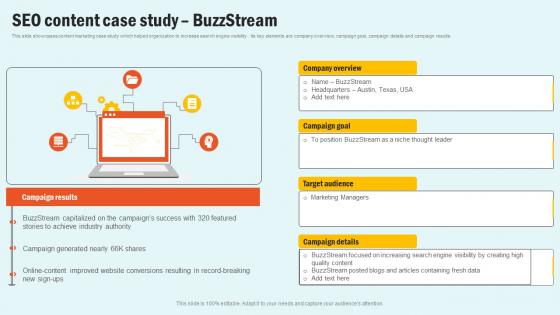
SEO Content Case Study Enhancing Website Performance With Search Engine Content Infographics Pdf
This slide showcases content marketing case study which helped organization to increase search engine visibility . Its key elements are company overview, campaign goal, campaign details and campaign results. Take your projects to the next level with our ultimate collection of SEO Content Case Study Enhancing Website Performance With Search Engine Content Infographics Pdf. Slidegeeks has designed a range of layouts that are perfect for representing task or activity duration, keeping track of all your deadlines at a glance. Tailor these designs to your exact needs and give them a truly corporate look with your own brand colors they will make your projects stand out from the rest This slide showcases content marketing case study which helped organization to increase search engine visibility . Its key elements are company overview, campaign goal, campaign details and campaign results.
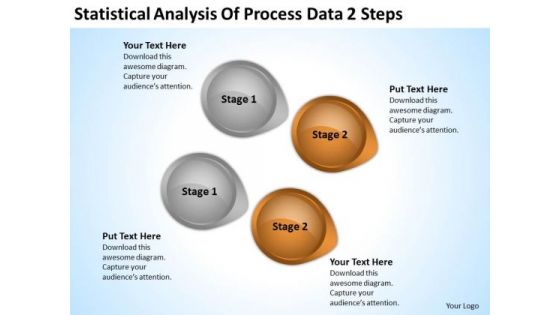
Arrow In PowerPoint Statistical Analysis Of Process Data 2 Steps Ppt Slide
We present our arrow in powerpoint statistical analysis of process data 2 steps ppt Slide.Download our Business PowerPoint Templates because Our PowerPoint Templates and Slides will weave a web of your great ideas. They are gauranteed to attract even the most critical of your colleagues. Use our Circle Charts PowerPoint Templates because Our PowerPoint Templates and Slides will let your words and thoughts hit bullseye everytime. Download our Arrows PowerPoint Templates because Our PowerPoint Templates and Slides will let you Hit the right notes. Watch your audience start singing to your tune. Download and present our Shapes PowerPoint Templates because You have the co-ordinates for your destination of success. Let our PowerPoint Templates and Slides map out your journey. Download and present our Signs PowerPoint Templates because It will let you Set new benchmarks with our PowerPoint Templates and Slides. They will keep your prospects well above par.Use these PowerPoint slides for presentations relating to 3d, abstract, analysis, arrow, background, business, button, chart, circle, circular, color, concept, conservation, cycle, development, diagram, direction, eco, ecology, energy, environment, flow, flowchart, globe, graphic, growing, growth, icon, internet, isolated, object, power, process, protection, recyclable, recycle, recycling, render, resource, saving, sign, solution, sphere, statistic, sustainable, symbol, technology, white. The prominent colors used in the PowerPoint template are Brown, Gray, Black. You can be sure our arrow in powerpoint statistical analysis of process data 2 steps ppt Slide are designed by professionals People tell us our button PowerPoint templates and PPT Slides will make the presenter look like a pro even if they are not computer savvy. You can be sure our arrow in powerpoint statistical analysis of process data 2 steps ppt Slide are designed by professionals Use our arrow PowerPoint templates and PPT Slides have awesome images to get your point across. Presenters tell us our arrow in powerpoint statistical analysis of process data 2 steps ppt Slide will make the presenter successul in his career/life. We assure you our arrow PowerPoint templates and PPT Slides are visually appealing. Get noticed immediately with our Arrow In PowerPoint Statistical Analysis Of Process Data 2 Steps Ppt Slide. Dont waste time struggling with PowerPoint. Let us do it for you.
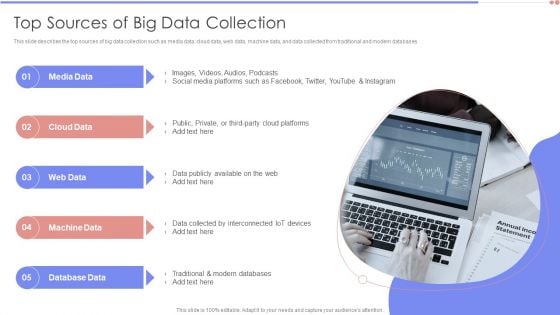
Data Analytics Management Top Sources Of Big Data Collection Sample PDF
This slide describes the top sources of big data collection such as media data, cloud data, web data, machine data, and data collected from traditional and modern databases.Presenting Data Analytics Management Top Sources Of Big Data Collection Sample PDF to provide visual cues and insights. Share and navigate important information on five stages that need your due attention. This template can be used to pitch topics like Machine Data, Database Data, Media Data. In addtion, this PPT design contains high resolution images, graphics, etc, that are easily editable and available for immediate download.
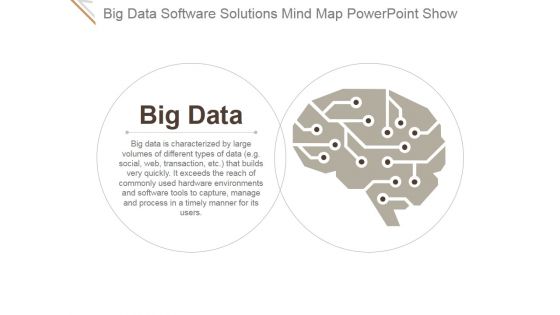
Big Data Software Solutions Mind Map Ppt PowerPoint Presentation Show
This is a big data software solutions mind map ppt powerpoint presentation show. This is a one stage process. The stages in this process are business, marketing, thought, big data, solutions, skill.
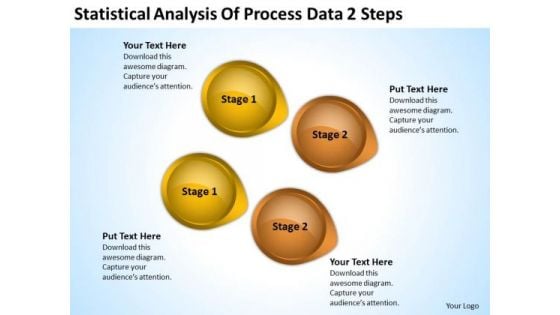
Power Point Arrows Statistical Analysis Of Process Data 2 Steps PowerPoint Templates
We present our power point arrows statistical analysis of process data 2 steps PowerPoint templates.Download and present our Business PowerPoint Templates because It is Aesthetically crafted by artistic young minds. Our PowerPoint Templates and Slides are designed to display your dexterity. Present our Arrows PowerPoint Templates because You can Rise to the occasion with our PowerPoint Templates and Slides. You will bring your audience on their feet in no time. Download and present our Circle Charts PowerPoint Templates because Our PowerPoint Templates and Slides help you pinpoint your timelines. Highlight the reasons for your deadlines with their use. Present our Shapes PowerPoint Templates because You aspire to touch the sky with glory. Let our PowerPoint Templates and Slides provide the fuel for your ascent. Present our Symbol PowerPoint Templates because You have gained great respect for your brilliant ideas. Use our PowerPoint Templates and Slides to strengthen and enhance your reputation.Use these PowerPoint slides for presentations relating to abstract, arrow, art, background, banner, blue, bright, business, circle, color, colorful, concept, conceptual, connection, creative, cycle, design, different, element, empty, flower, form, frame, graphic, green, group, idea, illustration, match, message, order, part, petal, piece, place, red, ring, shape, solution, special, speech, strategy, symbol, template, text, usable, vector, web, website. The prominent colors used in the PowerPoint template are Yellow, Brown, Black. People tell us our power point arrows statistical analysis of process data 2 steps PowerPoint templates will impress their bosses and teams. People tell us our circle PowerPoint templates and PPT Slides are designed by professionals Presenters tell us our power point arrows statistical analysis of process data 2 steps PowerPoint templates are second to none. We assure you our banner PowerPoint templates and PPT Slides will make the presenter successul in his career/life. Presenters tell us our power point arrows statistical analysis of process data 2 steps PowerPoint templates will help you be quick off the draw. Just enter your specific text and see your points hit home. Professionals tell us our background PowerPoint templates and PPT Slides will make the presenter look like a pro even if they are not computer savvy. File it down with our Power Point Arrows Statistical Analysis Of Process Data 2 Steps PowerPoint Templates. Get your thoughts into the shape you desire.
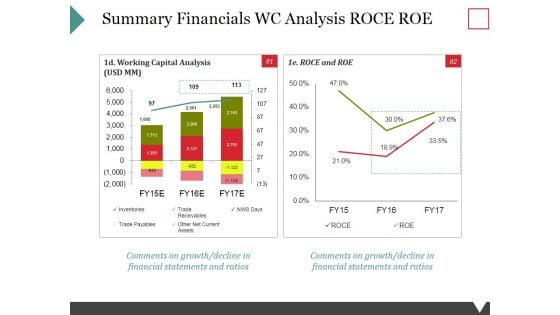
Summary Financials Wc Analysis Roce Roe Ppt PowerPoint Presentation Show Inspiration
This is a summary financials wc analysis roce roe ppt powerpoint presentation show inspiration. This is a two stage process. The stages in this process are inventories, trade payables, trade receivables, other net current assets, nws days.
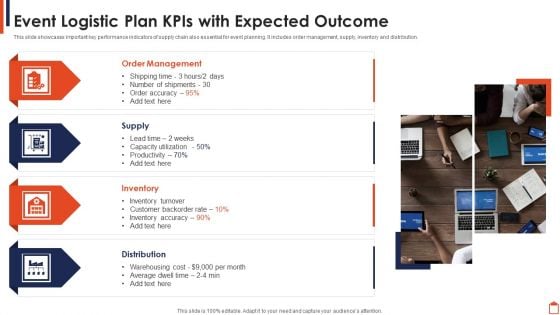
Event Logistic Plan Kpis With Expected Outcome Infographics PDF
This slide showcases important key performance indicators of supply chain also essential for event planning. It includes order management, supply, inventory and distribution.Persuade your audience using this Event Logistic Plan Kpis With Expected Outcome Infographics PDF This PPT design covers four stages, thus making it a great tool to use. It also caters to a variety of topics including Order Management, Inventory Turnover, Distribution Download this PPT design now to present a convincing pitch that not only emphasizes the topic but also showcases your presentation skills.
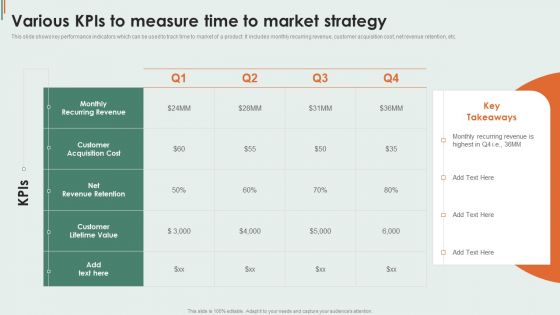
Various Kpis To Measure Time To Market Strategy Infographics PDF
This slide shows key performance indicators which can be used to track time to market of a product. It includes monthly recurring revenue, customer acquisition cost, net revenue retention, etc. Showcasing this set of slides titled Various Kpis To Measure Time To Market Strategy Infographics PDF. The topics addressed in these templates are Customer Acquisition, Customer Lifetime, Monthly Recurring. All the content presented in this PPT design is completely editable. Download it and make adjustments in color, background, font etc. as per your unique business setting.
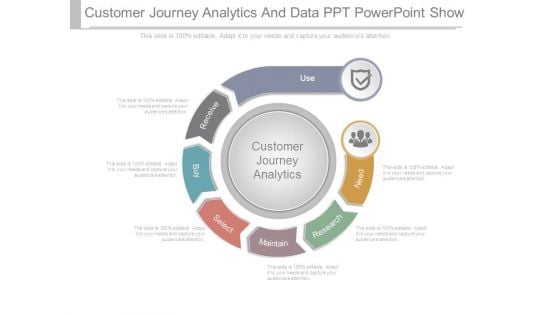
Customer Journey Analytics And Data Ppt Powerpoint Show
This is a customer journey analytics and data ppt powerpoint show. This is a seven stage process. The stages in this process are use, receive, buy, select, maintain, research, need, customer journey analytics.
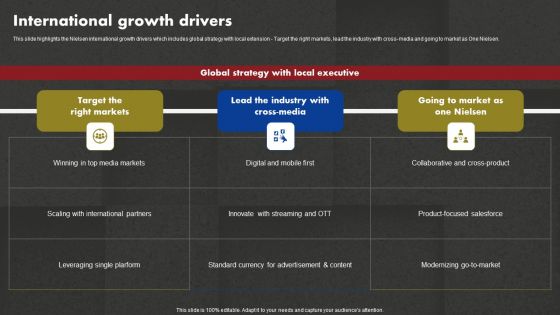
Data And Customer Analysis Company Outline International Growth Drivers Download PDF

Industry Report Of Packaged Food Products Part 2 Ppt PowerPoint Presentation Complete Deck With Slides
This Industry Report Of Packaged Food Products Part 2 Ppt PowerPoint Presentation Complete Deck With Slides is designed to help you retain your audiences attention. This content-ready PowerPoint Template enables you to take your audience on a journey and share information in a way that is easier to recall. It helps you highlight the crucial parts of your work so that the audience does not get saddled with information download. This one hundred eleven slide PPT Deck comes prepared with the graphs and charts you could need to showcase your information through visuals. You only need to enter your own data in them. Download this editable PowerPoint Theme and walk into that meeting with confidence.
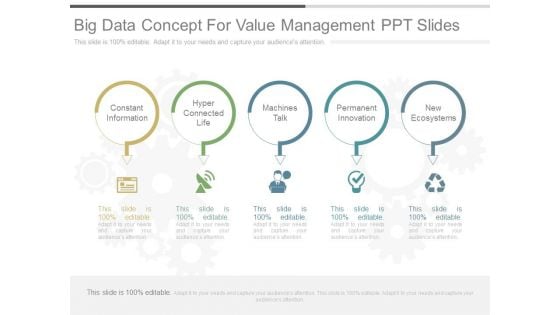
Big Data Concept For Value Management Ppt Slides
This is a big data concept for value management ppt slides. This is a five stage process. The stages in this process are constant information, hyper connected life, machines talk, permanent innovation, new ecosystems.
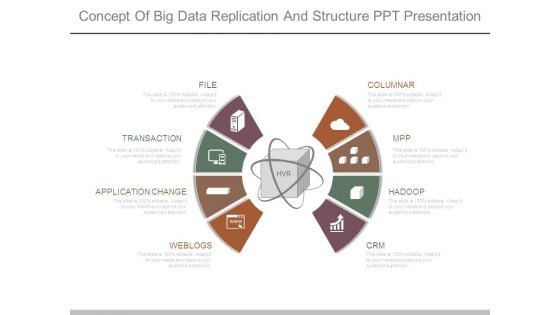
Concept Of Big Data Replication And Structure Ppt Presentation
This is a concept of big data replication and structure ppt presentation. This is a eight stage process. The stages in this process are file, transaction, application change, weblogs, crm, hadoop, mpp, columnar.
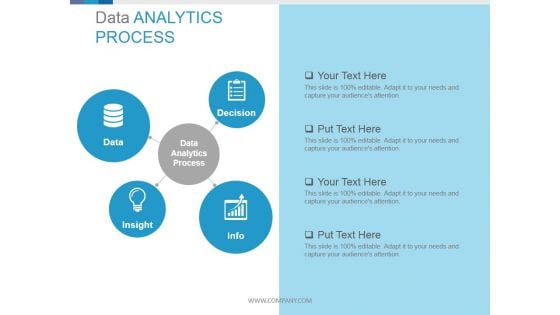
Data Analytics Process Circular Diagrams Ppt PowerPoint Presentation Guidelines
This is a data analytics process circular diagrams ppt powerpoint presentation guidelines. This is a four stage process. The stages in this process are data analytics process, data, decision, insight, info.
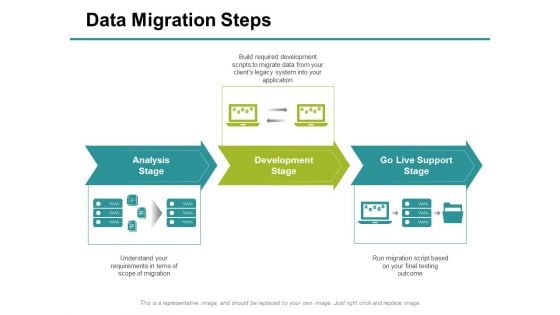
Data Migration Steps Ppt PowerPoint Presentation Slides Inspiration
This is a data migration steps ppt powerpoint presentation slides inspiration. This is a three stage process. The stages in this process are analysis stage, development stage, go live support stage, marketing, technology.
Data Collection Histograms Ppt PowerPoint Presentation Icon Slides
This is a data collection histograms ppt powerpoint presentation icon slides. This is a two stage process. The stages in this process are bar chart, finance, marketing, business, analysis.


 Continue with Email

 Home
Home


