Dashboards
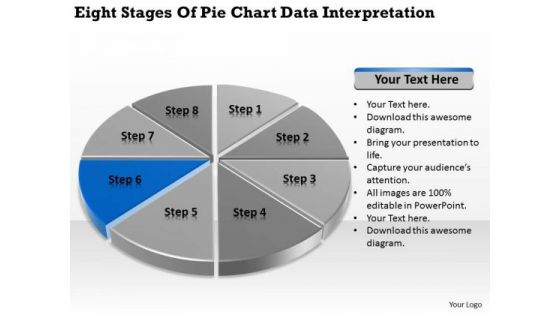
Stages Of Pie Chart Data Interpretation Example Business Plan PowerPoint Slides
We present our stages of pie chart data interpretation example business plan PowerPoint Slides.Download and present our Circle Charts PowerPoint Templates because It will let you Set new benchmarks with our PowerPoint Templates and Slides. They will keep your prospects well above par. Download our Marketing PowerPoint Templates because Our PowerPoint Templates and Slides will weave a web of your great ideas. They are gauranteed to attract even the most critical of your colleagues. Use our Business PowerPoint Templates because It will Strengthen your hand with your thoughts. They have all the aces you need to win the day. Present our Shapes PowerPoint Templates because It will get your audience in sync. Present our Process and Flows PowerPoint Templates because Our PowerPoint Templates and Slides will generate and maintain the level of interest you desire. They will create the impression you want to imprint on your audience.Use these PowerPoint slides for presentations relating to achievement, analysis, background, bank, banking, business, calculation, chart, circle, commerce, commercial, commission, concept, credit, crisis, debt, deposit, design, detail, diagram, earnings, economics, economy, element, finance, goal, gold, golden, graph, graphic, growth, icon, idea, illustration, income, increase, invest, isolated, level, loss, market, marketing, metal, modern, money, new, object, part, percent, percentage, pie, plot, politics, profit, progress, ratio, reflection, reflective. The prominent colors used in the PowerPoint template are Blue navy, Gray, Black. Add emphasis to your ideas with our Stages Of Pie Chart Data Interpretation Example Business Plan PowerPoint Slides. Lend greater credence to your expression.
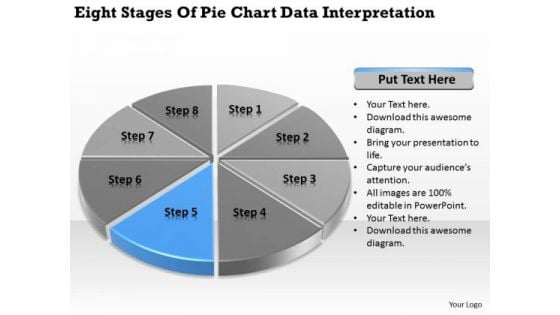
Stages Of Pie Chart Data Interpretation How To Write Business Plan PowerPoint Templates
We present our stages of pie chart data interpretation how to write business plan PowerPoint templates.Present our Circle Charts PowerPoint Templates because Our PowerPoint Templates and Slides will provide you a launch platform. Give a lift off to your ideas and send them into orbit. Present our Marketing PowerPoint Templates because Our PowerPoint Templates and Slides will let you Hit the right notes. Watch your audience start singing to your tune. Use our Business PowerPoint Templates because Our PowerPoint Templates and Slides come in all colours, shades and hues. They help highlight every nuance of your views. Download our Shapes PowerPoint Templates because It can Leverage your style with our PowerPoint Templates and Slides. Charm your audience with your ability. Use our Process and Flows PowerPoint Templates because You can Connect the dots. Fan expectations as the whole picture emerges.Use these PowerPoint slides for presentations relating to achievement, analysis, background, bank, banking, business, calculation, chart, circle, commerce, commercial, commission, concept, credit, crisis, debt, deposit, design, detail, diagram, earnings, economics, economy, element, finance, goal, gold, golden, graph, graphic, growth, icon, idea, illustration, income, increase, invest, isolated, level, loss, market, marketing, metal, modern, money, new, object, part, percent, percentage, pie, plot, politics, profit, progress, ratio, reflection, reflective. The prominent colors used in the PowerPoint template are Blue, Gray, Black. Our Stages Of Pie Chart Data Interpretation How To Write Business Plan PowerPoint Templates avoid exaggerations. They keep you away from any farce.
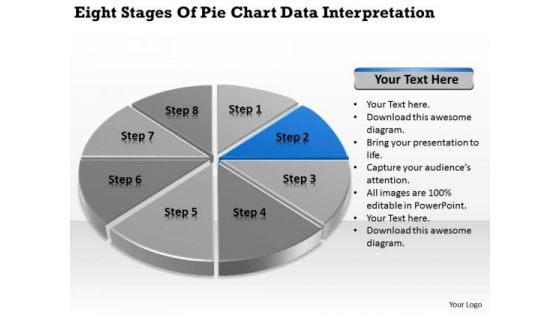
Stages Of Pie Chart Data Interpretation Vending Machine Business Plan PowerPoint Slides
We present our stages of pie chart data interpretation vending machine business plan PowerPoint Slides.Present our Circle Charts PowerPoint Templates because You should Bet on your luck with our PowerPoint Templates and Slides. Be assured that you will hit the jackpot. Present our Marketing PowerPoint Templates because Our PowerPoint Templates and Slides will provide you the cutting edge. Slice through the doubts in the minds of your listeners. Download our Business PowerPoint Templates because you should Experience excellence with our PowerPoint Templates and Slides. They will take your breath away. Download our Shapes PowerPoint Templates because It will Raise the bar of your Thoughts. They are programmed to take you to the next level. Present our Process and Flows PowerPoint Templates because Our PowerPoint Templates and Slides will give good value for money. They also have respect for the value of your time.Use these PowerPoint slides for presentations relating to achievement, analysis, background, bank, banking, business, calculation, chart, circle, commerce, commercial, commission, concept, credit, crisis, debt, deposit, design, detail, diagram, earnings, economics, economy, element, finance, goal, gold, golden, graph, graphic, growth, icon, idea, illustration, income, increase, invest, isolated, level, loss, market, marketing, metal, modern, money, new, object, part, percent, percentage, pie, plot, politics, profit, progress, ratio, reflection, reflective. The prominent colors used in the PowerPoint template are Blue, Gray, Black. Our Stages Of Pie Chart Data Interpretation Vending Machine Business Plan PowerPoint Slides come at a comfortable cost. They are definitely an economical choice.
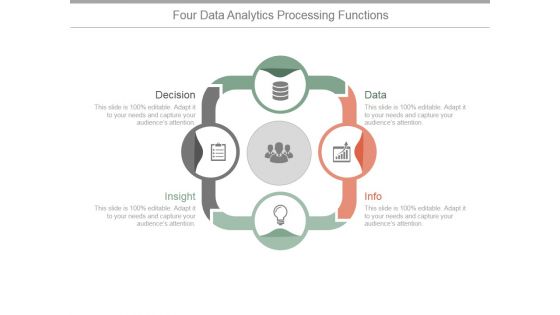
Four Data Analytics Processing Functions Ppt PowerPoint Presentation Example 2015
This is a four data analytics processing functions ppt powerpoint presentation example 2015. This is a four stage process. The stages in this process are decision, data, info, insight.
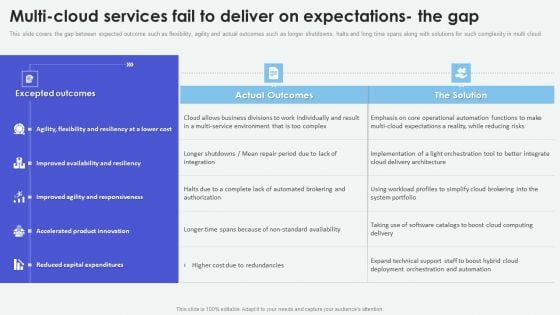
Cloud Based Computing Analysis Multi Cloud Services Fail To Deliver On Expectations Summary PDF
This modern and well-arranged Cloud Based Computing Analysis Multi Cloud Services Fail To Deliver On Expectations Summary PDF provides lots of creative possibilities. It is very simple to customize and edit with the Powerpoint Software. Just drag and drop your pictures into the shapes. All facets of this template can be edited with Powerpoint, no extra software is necessary. Add your own material, put your images in the places assigned for them, adjust the colors, and then you can show your slides to the world, with an animated slide included.
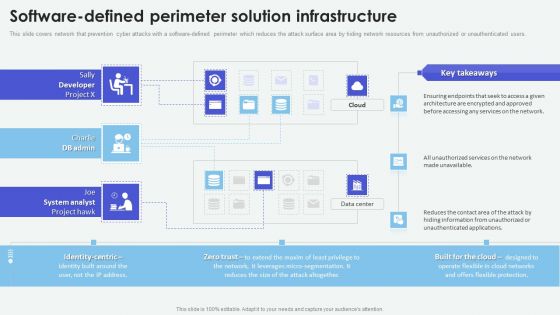
Cloud Based Computing Analysis Software Defined Perimeter Solution Infrastructure Summary PDF
This slide covers network that prevention cyber attacks with a software-defined perimeter which reduces the attack surface area by hiding network resources from unauthorized or unauthenticated users. Take your projects to the next level with our ultimate collection of Cloud Based Computing Analysis Software Defined Perimeter Solution Infrastructure Summary PDF. Slidegeeks has designed a range of layouts that are perfect for representing task or activity duration, keeping track of all your deadlines at a glance. Tailor these designs to your exact needs and give them a truly corporate look with your own brand colors theyll make your projects stand out from the rest
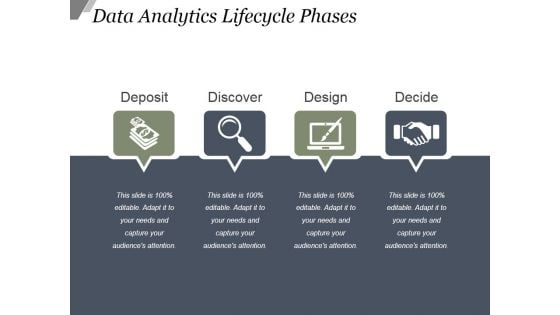
Data Analytics Lifecycle Phases Ppt PowerPoint Presentation Example File
This is a data analytics lifecycle phases ppt powerpoint presentation example file. This is a four stage process. The stages in this process are deposit, discover, design, decide.
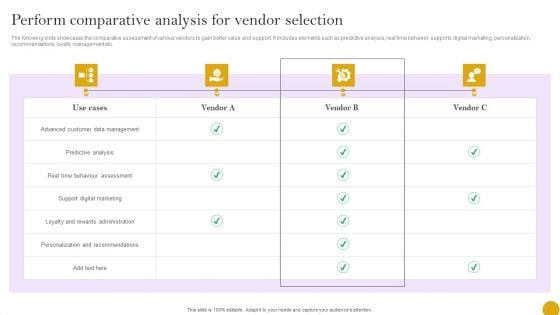
Comprehensive Customer Data Platform Guide Optimizing Promotional Initiatives Perform Comparative Analysis Vendor Background PDF
The following slide showcases the comparative assessment of various vendors to gain better value and support. It includes elements such as predictive analysis, real time behavior, supports digital marketing, personalization, recommendations, loyalty management etc. Slidegeeks is one of the best resources for PowerPoint templates. You can download easily and regulate Comprehensive Customer Data Platform Guide Optimizing Promotional Initiatives Perform Comparative Analysis Vendor Background PDF for your personal presentations from our wonderful collection. A few clicks is all it takes to discover and get the most relevant and appropriate templates. Use our Templates to add a unique zing and appeal to your presentation and meetings. All the slides are easy to edit and you can use them even for advertisement purposes.
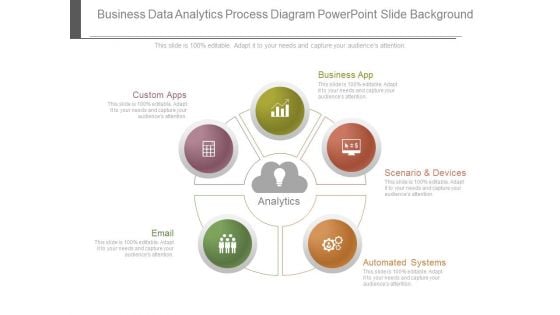
Business Data Analytics Process Diagram Powerpoint Slide Background
This is a business data analytics process diagram powerpoint slide background. This is a five stage process. The stages in this process are custom apps, business app, analytics, email, scenario and devices, automated systems.
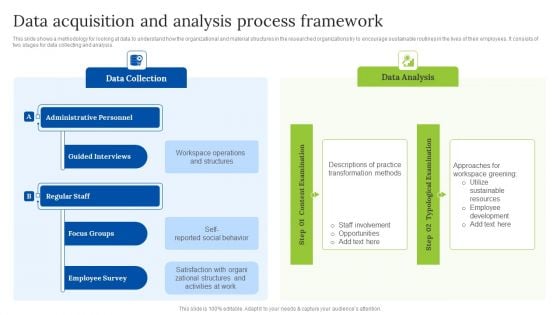
Data Acquisition And Analysis Process Framework Introduction PDF
This slide shows a methodology for looking at data to understand how the organizational and material structures in the researched organizations try to encourage sustainable routines in the lives of their employees. It consists of two stages for data collecting and analysis.Showcasing this set of slides titled Data Acquisition And Analysis Process Framework Introduction PDF. The topics addressed in these templates are Administrative Personnel, Guided Interviews, Employee Survey. All the content presented in this PPT design is completely editable. Download it and make adjustments in color, background, font etc. as per your unique business setting.
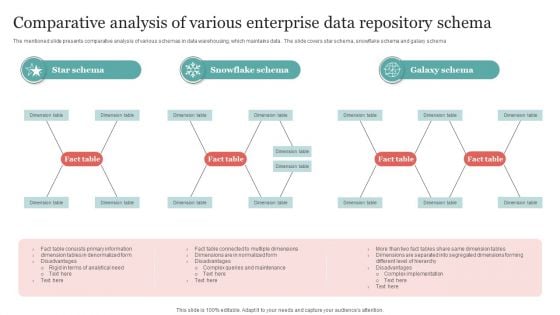
Comparative Analysis Of Various Enterprise Data Repository Schema Microsoft PDF
The mentioned slide presents comparative analysis of various schemas in data warehousing, which maintains data . The slide covers star schema, snowflake schema and galaxy schema Pitch your topic with ease and precision using this Comparative Analysis Of Various Enterprise Data Repository Schema Microsoft PDF. This layout presents information on Galaxy Schema, Snowflake Schema, Star Schema. It is also available for immediate download and adjustment. So, changes can be made in the color, design, graphics or any other component to create a unique layout.
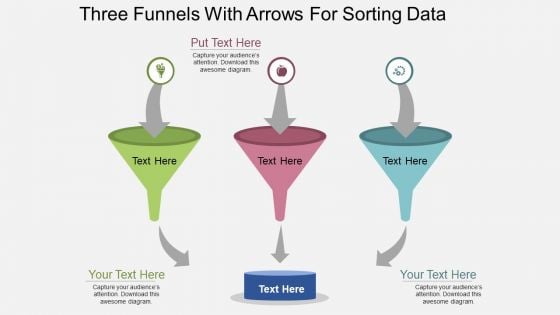
Three Funnels With Arrows For Sorting Data Powerpoint Template
Communicate with your group through this slide of three funnels. Download this PowerPoint template to exhibit management tools. This PPT slide design will facilitate understanding of your views.
Business Strategy Process Folder With Important Data Concept Statement
Add Some Dramatization To Your Thoughts. Our Business Strategy Process Folder With Important Data Concept Statement Powerpoint Templates Make Useful Props. Draw Ahead Of Others With Our People Powerpoint Templates. Cross The Line And Win The Race.
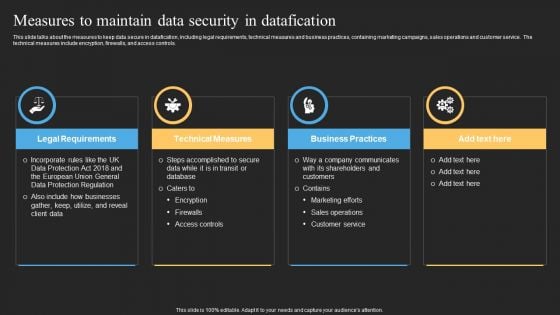
Datafy Measures To Maintain Data Security In Datafication Diagrams PDF
This slide talks about the measures to keep data secure in datafication, including legal requirements, technical measures and business practices, containing marketing campaigns, sales operations and customer service. The technical measures include encryption, firewalls, and access controls. Welcome to our selection of the Datafy Measures To Maintain Data Security In Datafication Diagrams PDF. These are designed to help you showcase your creativity and bring your sphere to life. Planning and Innovation are essential for any business that is just starting out. This collection contains the designs that you need for your everyday presentations. All of our PowerPoints are 100 percent editable, so you can customize them to suit your needs. This multi-purpose template can be used in various situations. Grab these presentation templates today.
Key Performance Indicators To Track Sales Performance Ppt PowerPoint Presentation Icon Diagrams PDF
Showcasing this set of slides titled key performance indicators to track sales performance ppt powerpoint presentation icon diagrams pdf. The topics addressed in these templates are key performance indicators to track sales performance. All the content presented in this PPT design is completely editable. Download it and make adjustments in color, background, font etc. as per your unique business setting.
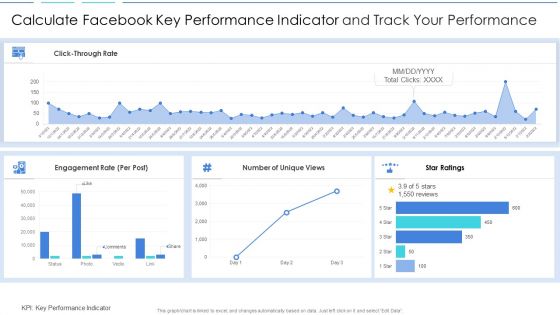
Calculate Facebook Key Performance Indicator And Track Your Performance Information PDF
Showcasing this set of slides titled calculate facebook key performance indicator and track your performance information pdf. The topics addressed in these templates are calculate facebook key performance indicator and track your performance. All the content presented in this PPT design is completely editable. Download it and make adjustments in color, background, font etc. as per your unique business setting.
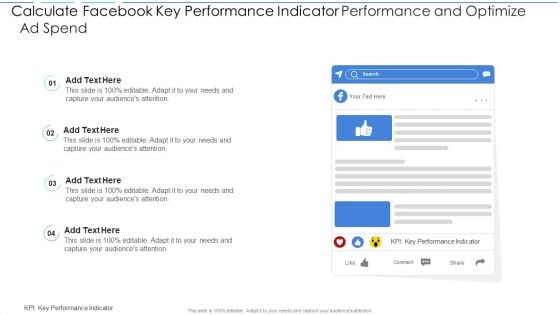
Calculate Facebook Key Performance Indicator Performance And Optimize Ad Spend Brochure PDF
Showcasing this set of slides titled calculate facebook key performance indicator performance and optimize ad spend brochure pdf. The topics addressed in these templates are calculate facebook key performance indicator performance and optimize ad spend. All the content presented in this PPT design is completely editable. Download it and make adjustments in color, background, font etc. as per your unique business setting.
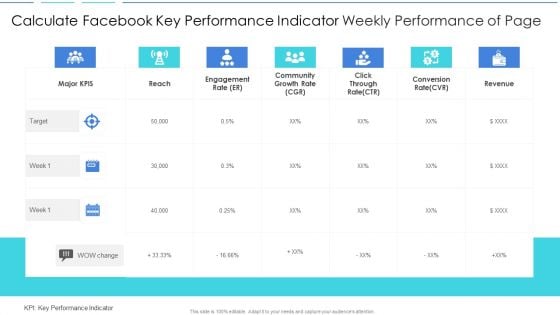
Calculate Facebook Key Performance Indicator Weekly Performance Of Page Elements PDF
Pitch your topic with ease and precision using this calculate facebook key performance indicator weekly performance of page elements pdf. This layout presents information on calculate facebook key performance indicator weekly performance of page. It is also available for immediate download and adjustment. So, changes can be made in the color, design, graphics or any other component to create a unique layout.
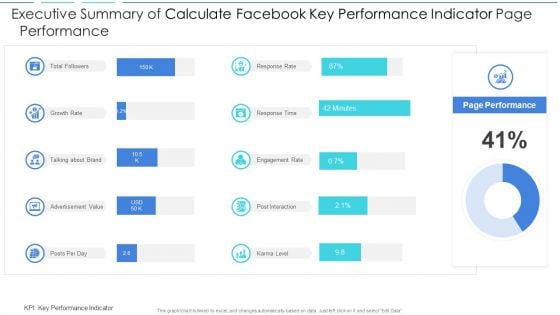
Executive Summary Of Calculate Facebook Key Performance Indicator Page Performance Download PDF
Showcasing this set of slides titled executive summary of calculate facebook key performance indicator page performance download pdf. The topics addressed in these templates are executive summary of calculate facebook key performance indicator page performance. All the content presented in this PPT design is completely editable. Download it and make adjustments in color, background, font etc. as per your unique business setting.
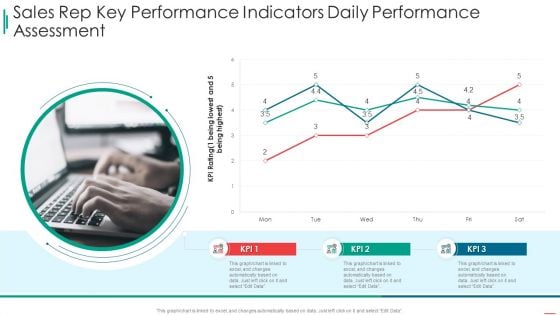
Sales Rep Scorecard Sales Rep Key Performance Indicators Daily Performance Assessment Sample PDF
Deliver and pitch your topic in the best possible manner with this sales rep scorecard sales rep key performance indicators daily performance assessment sample pdf. Use them to share invaluable insights on sales rep key performance indicators daily performance assessment and impress your audience. This template can be altered and modified as per your expectations. So, grab it now.
Icon Of Key Performance Indicators For Continuous Performance Measurement Professional PDF
Showcasing this set of slides titled Icon Of Key Performance Indicators For Continuous Performance Measurement Professional PDF The topics addressed in these templates are Icon Of Key Performance, Indicators For Continuous, Performance Measurement All the content presented in this PPT design is completely editable. Download it and make adjustments in color, background, font etc. as per your unique business setting.

Concepts Data Warehousing Ppt PowerPoint Presentation Professional Demonstration Cpb
Presenting this set of slides with name concepts data warehousing ppt powerpoint presentation professional demonstration cpb. This is an editable Powerpoint four stages graphic that deals with topics like concepts data warehousing to help convey your message better graphically. This product is a premium product available for immediate download and is 100 percent editable in Powerpoint. Download this now and use it in your presentations to impress your audience.
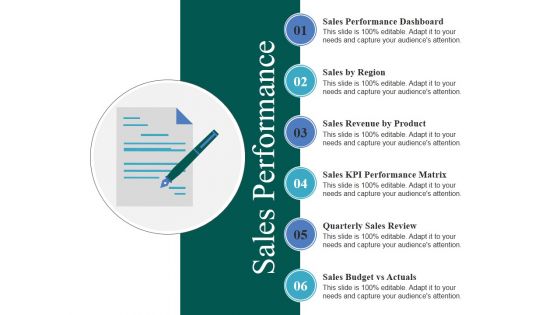
Sales Performance Ppt PowerPoint Presentation Infographics Visuals
This is a sales performance ppt powerpoint presentation infographics visuals. This is a six stage process. The stages in this process are sales by region, sales revenue by product, sales kpi performance matrix, quarterly sales review, sales budget vs actuals.
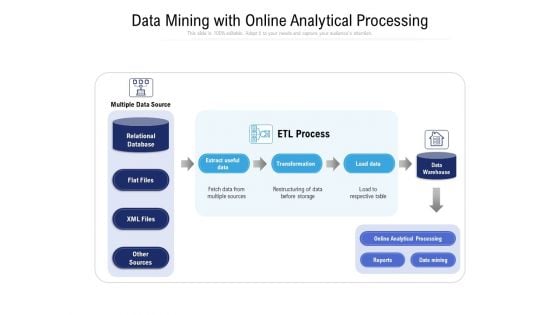
Data Mining With Online Analytical Processing Ppt PowerPoint Presentation Inspiration
Presenting this set of slides with name data mining with online analytical processing ppt powerpoint presentation inspiration. This is a two stage process. The stages in this process are multiple data source, etl process, relational database, flat files, xml files, other sources, data warehouse, load data transformation, extract useful data. This is a completely editable PowerPoint presentation and is available for immediate download. Download now and impress your audience.
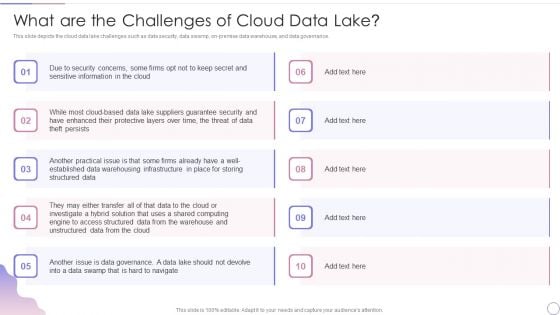
Data Lake Architecture Future Of Data Analysis What Are The Challenges Of Cloud Data Lake Download PDF
This slide depicts the cloud data lake challenges such as data security, data swamp, on-premise data warehouse, and data governance. Deliver an awe inspiring pitch with this creative Data Lake Architecture Future Of Data Analysis What Are The Challenges Of Cloud Data Lake Download PDF bundle. Topics like Sensitive Information, Data Warehousing, Unstructured Data can be discussed with this completely editable template. It is available for immediate download depending on the needs and requirements of the user.
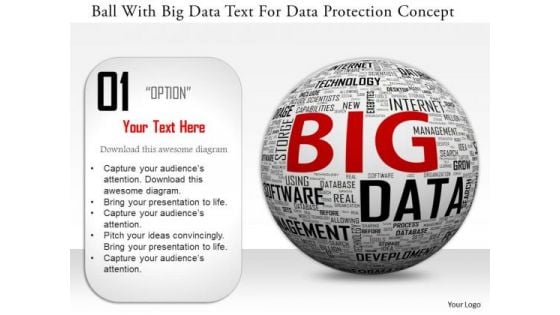
Stock Photo Ball With Big Data Text For Data Protection Concept PowerPoint Slide
Graphic of ball with big data text has been used to craft this power point template. This image template contains the concept of data protection. Use this image for data security related topics in any presentation.
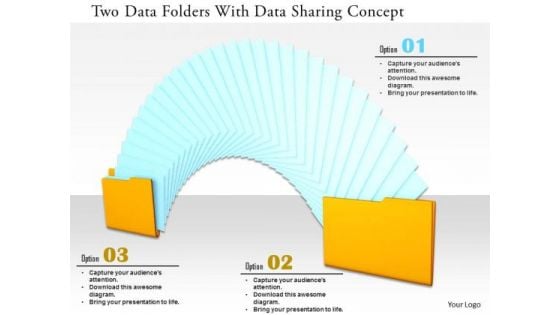
Stock Photo Two Data Folders With Data Sharing Concept PowerPoint Slide
This power point image template has been designed with graphic of two data folders. This PPT contains the concept of data sharing. This PPT can be used for data and technology related presentations.
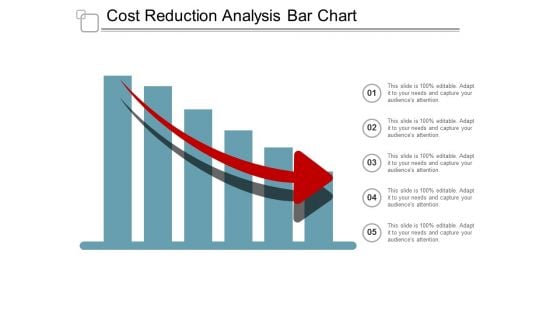
Cost Reduction Analysis Bar Chart Ppt Powerpoint Presentation File Graphics Design
This is a cost reduction analysis bar chart ppt powerpoint presentation file graphics design. This is a five stage process. The stages in this process are data analysis, data science, information science.

Assemble An Analytic Data Repository Powerpoint Presentation Templates
This is a assemble an analytic data repository powerpoint presentation templates. This is a five stage process. The stages in this process are assemble an analytic data repository, track all customer interactions, monitor customer experience scores, determine customer behavior changes, evaluate customer value impacts.
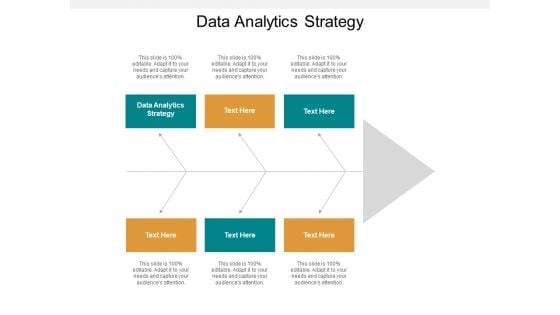
Data Analytics Strategy Ppt PowerPoint Presentation Visual Aids Layouts Cpb
Presenting this set of slides with name data analytics strategy ppt powerpoint presentation visual aids layouts cpb. This is a six stage process. The stages in this process are data analytics strategy. This is a completely editable PowerPoint presentation and is available for immediate download. Download now and impress your audience.
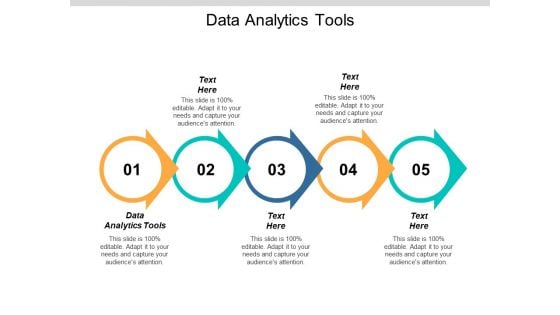
Data Analytics Tools Ppt PowerPoint Presentation Professional Structure Cpb
Presenting this set of slides with name data analytics tools ppt powerpoint presentation professional structure cpb. This is a five stage process. The stages in this process are data analytics tools. This is a completely editable PowerPoint presentation and is available for immediate download. Download now and impress your audience.

Big Data Analytics Lifecycle Why Big Data Management Is Important Ppt Outline Maker PDF
This slide depicts the importance of big data and how collected data will help organizations in cost-saving, time savings, new product launching, and decision making. Slidegeeks is here to make your presentations a breeze with Big Data Analytics Lifecycle Why Big Data Management Is Important Ppt Outline Maker PDF With our easy-to-use and customizable templates, you can focus on delivering your ideas rather than worrying about formatting. With a variety of designs to choose from, youre sure to find one that suits your needs. And with animations and unique photos, illustrations, and fonts, you can make your presentation pop. So whether youre giving a sales pitch or presenting to the board, make sure to check out Slidegeeks first.
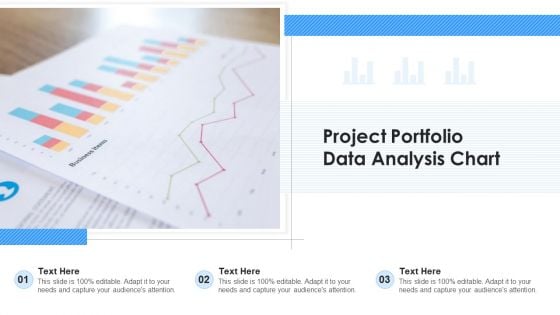
Project Portfolio Data Analysis Chart Ppt Ideas Gallery PDF
Presenting project portfolio data analysis chart ppt ideas gallery pdf to dispense important information. This template comprises three stages. It also presents valuable insights into the topics including project portfolio data analysis chart. This is a completely customizable PowerPoint theme that can be put to use immediately. So, download it and address the topic impactfully.
Business Data IT Security Analysis Icon With Shield Download PDF
Presenting Business Data IT Security Analysis Icon With Shield Download PDF to dispense important information. This template comprises three stages. It also presents valuable insights into the topics including Business Data IT Security, Analysis Icon With Shield. This is a completely customizable PowerPoint theme that can be put to use immediately. So, download it and address the topic impactfully.
Data Analysis And Assessment Checklist Icon Rules PDF
Presenting Data Analysis And Assessment Checklist Icon Rules PDF to dispense important information. This template comprises three stages. It also presents valuable insights into the topics including Data Analysis, Assessment, Checklist. This is a completely customizable PowerPoint theme that can be put to use immediately. So, download it and address the topic impactfully.
Real Time Data Utilization Analysis Icon Summary PDF
Persuade your audience using this Real Time Data Utilization Analysis Icon Summary PDF. This PPT design covers three stages, thus making it a great tool to use. It also caters to a variety of topics including Real Time Data Utilization, Analysis Icon. Download this PPT design now to present a convincing pitch that not only emphasizes the topic but also showcases your presentation skills.
Digital Model Of Healthcare Data Analysis Demonstration PDF
Presenting Digital Model Of Healthcare Data Analysis Demonstration PDF to dispense important information. This template comprises three stages. It also presents valuable insights into the topics including Digital Model, Healthcare Data Analysis. This is a completely customizable PowerPoint theme that can be put to use immediately. So, download it and address the topic impactfully.
Progressive Trends Of Healthcare Data Analysis Microsoft PDF
Persuade your audience using this Progressive Trends Of Healthcare Data Analysis Microsoft PDF. This PPT design covers three stages, thus making it a great tool to use. It also caters to a variety of topics including Progressive Trends, Healthcare Data Analysis. Download this PPT design now to present a convincing pitch that not only emphasizes the topic but also showcases your presentation skills.
Data Analysis Employment Ppt Powerpoint Presentation Inspiration Shapes Cpb
This is a data analysis employment ppt powerpoint presentation inspiration shapes cpb. This is a seven stage process. The stages in this process are data analysis employment.
Data Analysis Ppt PowerPoint Presentation Slides Visual Aids Cpb
This is a data analysis ppt powerpoint presentation slides visual aids cpb. This is a four stage process. The stages in this process are data analysis.
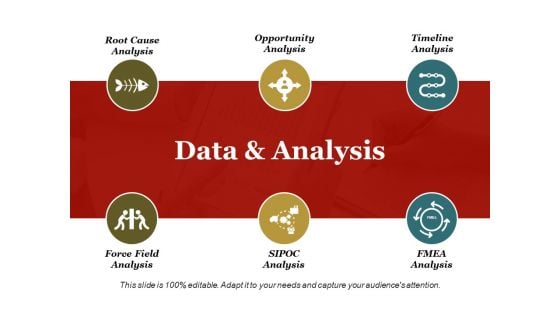
Data And Analysis Ppt PowerPoint Presentation Styles Show
This is a data and analysis ppt powerpoint presentation styles show. This is a six stage process. The stages in this process are root cause analysis, opportunity analysis, timeline analysis, force field analysis, sipoc analysis.
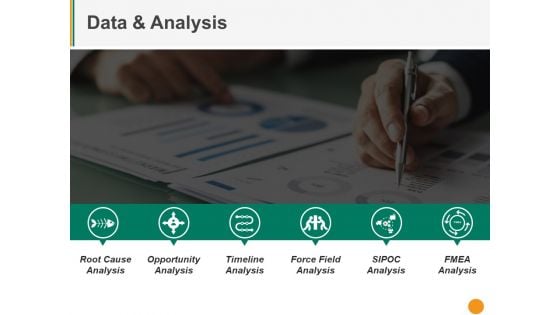
Data And Analysis Ppt PowerPoint Presentation Layouts Slideshow
This is a data and analysis ppt powerpoint presentation layouts slideshow. This is a six stage process. The stages in this process are root cause analysis, opportunity analysis, timeline analysis, force field analysis, fmea analysis.
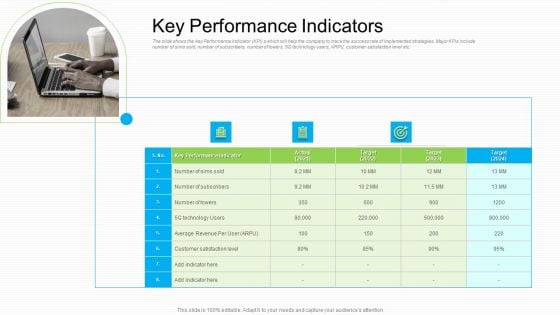
Lowering Sales Revenue A Telecommunication Firm Case Competition Key Performance Indicators Designs PDF
The slide shows the key Performance Indicator KPI s which will help the company to track the success rate of implemented strategies. Major KPIs include number of sims sold, number of subscribers, number of towers, 5G technology users, ARPU, customer satisfaction level etc. This is a lowering sales revenue a telecommunication firm case competition key performance indicators designs pdf template with various stages. Focus and dispense information on one stage using this creative set, that comes with editable features. It contains large content boxes to add your information on topics like average revenue, target, 2021 to 2024. You can also showcase facts, figures, and other relevant content using this PPT layout. Grab it now.
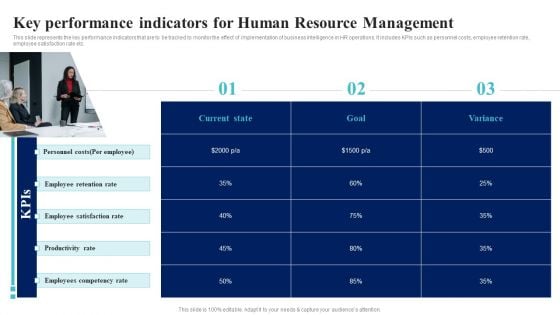
BI Implementation To Enhance Hiring Process Key Performance Indicators For Human Resource Management Summary PDF
This slide represents the key performance indicators that are to be tracked to monitor the effect of implementation of business intelligence in HR operations. It includes KPIs such as personnel costs, employee retention rate, employee satisfaction rate etc.The BI Implementation To Enhance Hiring Process Key Performance Indicators For Human Resource Management Summary PDF is a compilation of the most recent design trends as a series of slides. It is suitable for any subject or industry presentation, containing attractive visuals and photo spots for businesses to clearly express their messages. This template contains a variety of slides for the user to input data, such as structures to contrast two elements, bullet points, and slides for written information. Slidegeeks is prepared to create an impression.
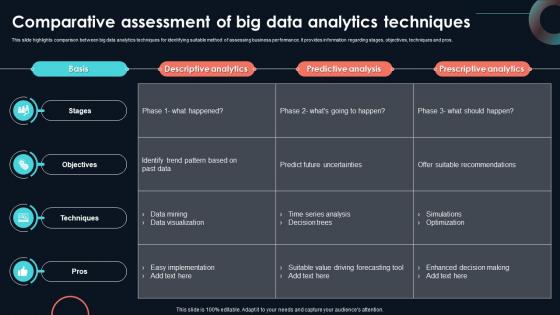
Comparative Assessment Of Big Data Developing Strategic Insights Using Big Data Analytics SS V
This slide highlights comparison between big data analytics techniques for identifying suitable method of assessing business performance. It provides information regarding stages, objectives, techniques and pros. Coming up with a presentation necessitates that the majority of the effort goes into the content and the message you intend to convey. The visuals of a PowerPoint presentation can only be effective if it supplements and supports the story that is being told. Keeping this in mind our experts created Comparative Assessment Of Big Data Developing Strategic Insights Using Big Data Analytics SS V to reduce the time that goes into designing the presentation. This way, you can concentrate on the message while our designers take care of providing you with the right template for the situation. This slide highlights comparison between big data analytics techniques for identifying suitable method of assessing business performance. It provides information regarding stages, objectives, techniques and pros.
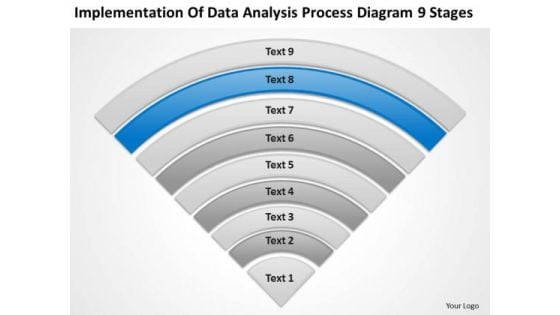
Data Analysis Process Diagram 9 Stages Ppt 8 Business Continuation Plan PowerPoint Slides
We present our data analysis process diagram 9 stages ppt 8 business continuation plan PowerPoint Slides.Use our Flow Charts PowerPoint Templates because It can Leverage your style with our PowerPoint Templates and Slides. Charm your audience with your ability. Use our Process and Flows PowerPoint Templates because You can Channelise the thoughts of your team with our PowerPoint Templates and Slides. Urge them to focus on the goals you have set. Download our Shapes PowerPoint Templates because Timeline crunches are a fact of life. Meet all deadlines using our PowerPoint Templates and Slides. Present our Business PowerPoint Templates because They will Put the wind in your sails. Skim smoothly over the choppy waters of the market. Present our Triangles PowerPoint Templates because Our PowerPoint Templates and Slides are endowed to endure. Ideas conveyed through them will pass the test of time.Use these PowerPoint slides for presentations relating to Saturation, strip, saturated, line, spectrum, pantone, bright, diagram, circle, sampler, guide, element, paint, scale,shape, ten, multicolored, palette, illustration, spectral, guidance, chart, collection, abstraction, selection, choice, visible, variation, painter, contrast, ,gradient, pattern, chooser, analyzer. The prominent colors used in the PowerPoint template are Blue, Gray, Black. Field your thoughts with our Data Analysis Process Diagram 9 Stages Ppt 8 Business Continuation Plan PowerPoint Slides. They will make an enormous contribution to your effort.
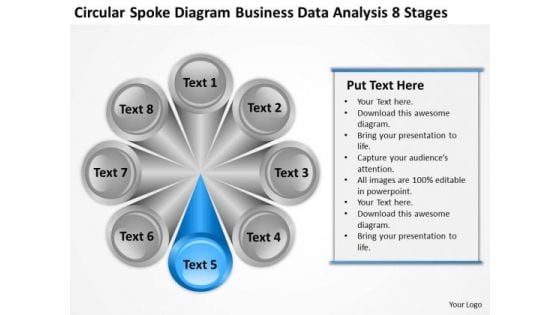
Spoke Diagram Business Data Analysis 8 Stages Barber Shop Plan PowerPoint Templates
We present our spoke diagram business data analysis 8 stages barber shop plan PowerPoint templates.Use our Finance PowerPoint Templates because Our PowerPoint Templates and Slides are created with admirable insight. Use them and give your group a sense of your logical mind. Present our Leadership PowerPoint Templates because Our PowerPoint Templates and Slides are effectively colour coded to prioritise your plans They automatically highlight the sequence of events you desire. Use our Circle Charts PowerPoint Templates because you should Experience excellence with our PowerPoint Templates and Slides. They will take your breath away. Use our Business PowerPoint Templates because you should once Tap the ingenuity of our PowerPoint Templates and Slides. They are programmed to succeed. Download and present our Process and Flows PowerPoint Templates because You will get more than you ever bargained for. Use these PowerPoint slides for presentations relating to Chart, segmented, pie, hub, wheel, isolated, divided, business, communication, diagram, circle, graphic, process, element, tire, graph, marketing, illustration, icon, circular, round, clipart, design, success, set, spoke, button. The prominent colors used in the PowerPoint template are Blue, Gray, White. Make your audience feel exclusive with our Spoke Diagram Business Data Analysis 8 Stages Barber Shop Plan PowerPoint Templates. Give them special attention with your thoughts.
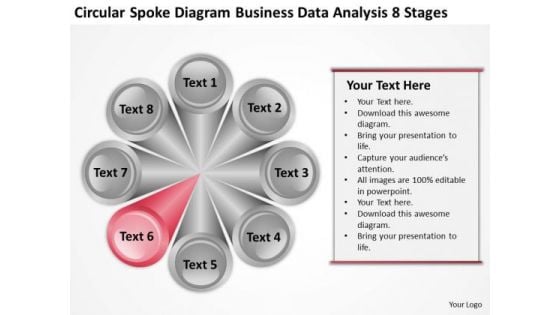
Spoke Diagram Business Data Analysis 8 Stages Plan Help PowerPoint Templates
We present our spoke diagram business data analysis 8 stages plan help PowerPoint templates.Use our Finance PowerPoint Templates because Our PowerPoint Templates and Slides will let you Hit the target. Go the full distance with ease and elan. Use our Leadership PowerPoint Templates because Our PowerPoint Templates and Slides are created with admirable insight. Use them and give your group a sense of your logical mind. Use our Circle Charts PowerPoint Templates because You should Bet on your luck with our PowerPoint Templates and Slides. Be assured that you will hit the jackpot. Download our Business PowerPoint Templates because Timeline crunches are a fact of life. Meet all deadlines using our PowerPoint Templates and Slides. Download our Process and Flows PowerPoint Templates because Our PowerPoint Templates and Slides will let you Hit the right notes. Watch your audience start singing to your tune.Use these PowerPoint slides for presentations relating to Chart, segmented, pie, hub, wheel, isolated, divided, business, communication, diagram, circle, graphic, process, element, tire, graph, marketing, illustration, icon, circular, round, clipart, design, success, set, spoke, button. The prominent colors used in the PowerPoint template are Red, Gray, White. Your audience will love what they are looking at. Impress them with our Spoke Diagram Business Data Analysis 8 Stages Plan Help PowerPoint Templates. You will be at the top of your game.

Steps For Insights In Dataset With Analysis Ppt Infographics PDF
This slide illustrate step for data analytics for extracting insights from the available data set for data mining and cleaning. It include steps like descriptive analytics, diagnosis analytics, predictive analytics and perspective analytics. Persuade your audience using this Steps For Insights In Dataset With Analysis Ppt Infographics PDF. This PPT design covers four stages, thus making it a great tool to use. It also caters to a variety of topics including Descriptive Analytics, Diagnostics Analytics, Predicative Analytics, Prescriptive Analytics. Download this PPT design now to present a convincing pitch that not only emphasizes the topic but also showcases your presentation skills.
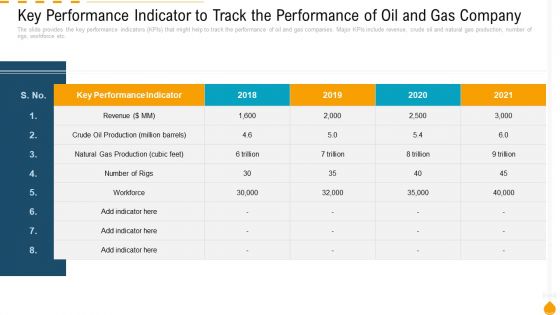
Key Performance Indicator To Track The Performance Of Oil And Gas Company Inspiration PDF
Deliver an awe inspiring pitch with this creative key performance indicator to track the performance of oil and gas company inspiration pdf bundle. Topics likekey performance indicator, natural gas production cubic feet, crude oil production can be discussed with this completely editable template. It is available for immediate download depending on the needs and requirements of the user.
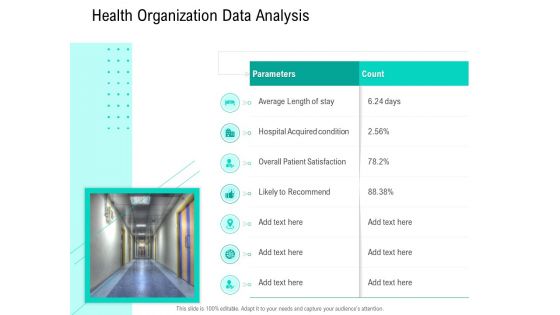
Nursing Administration Health Organization Data Analysis Ppt Summary Graphics PDF
Deliver and pitch your topic in the best possible manner with this nursing administration health organization data analysis ppt summary graphics pdf. Use them to share invaluable insights on average length of stay, hospital acquired condition, overall patient satisfaction, likely to recommend and impress your audience. This template can be altered and modified as per your expectations. So, grab it now.
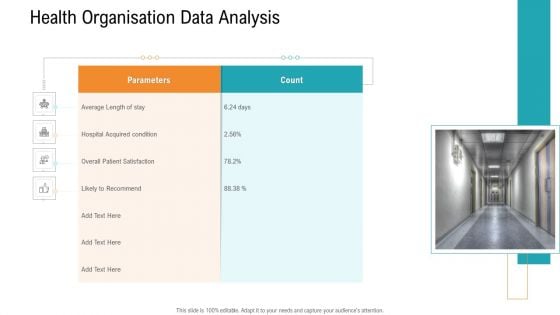
E Healthcare Management System Health Organisation Data Analysis Summary PDF
Deliver and pitch your topic in the best possible manner with this e healthcare management system health organisation data analysis summary pdf. Use them to share invaluable insights on average length of stay, hospital acquired condition, overall patient satisfaction, likely to recommend and impress your audience. This template can be altered and modified as per your expectations. So, grab it now.
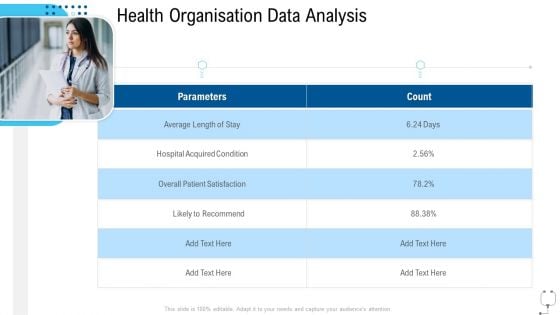
Healthcare Management Health Organisation Data Analysis Ppt Outline Deck PDF
Deliver and pitch your topic in the best possible manner with this healthcare management health organisation data analysis ppt outline deck pdf. Use them to share invaluable insights on average length of stay, hospital acquired condition, overall patient satisfaction, likely to recommend and impress your audience. This template can be altered and modified as per your expectations. So, grab it now.

Hospital Administration Health Organisation Data Analysis Ppt Inspiration Maker PDF
Deliver and pitch your topic in the best possible manner with this hospital administration health organisation data analysis ppt inspiration maker pdf. Use them to share invaluable insights on average length of stay, hospital acquired condition, overall patient satisfaction, likely to recommend and impress your audience. This template can be altered and modified as per your expectations. So, grab it now.
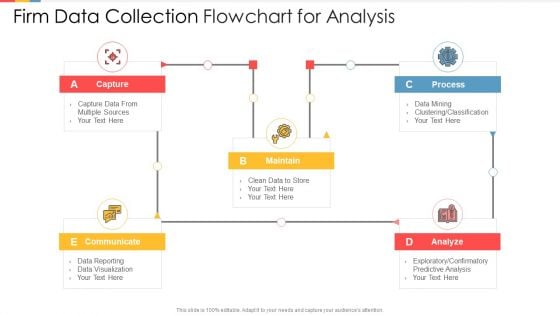
Firm Data Collection Flowchart For Analysis Template PDF
Showcasing this set of slides titled firm data collection flowchart for analysis template pdf. The topics addressed in these templates are capture, maintain, communicate, analyze, process. All the content presented in this PPT design is completely editable. Download it and make adjustments in color, background, font etc. as per your unique business setting.
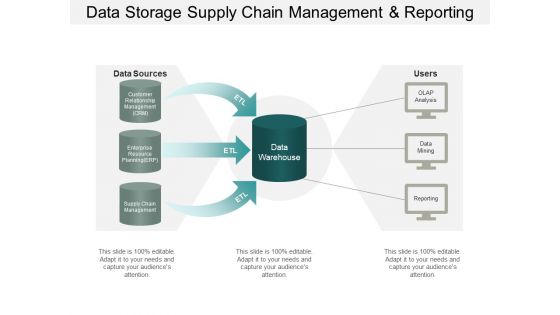
Data Storage Supply Chain Management And Reporting Ppt PowerPoint Presentation Outline
This is a data storage supply chain management and reporting ppt powerpoint presentation outline. This is a six stage process. The stages in this process are transform and load, data wore housing, etl, extract.
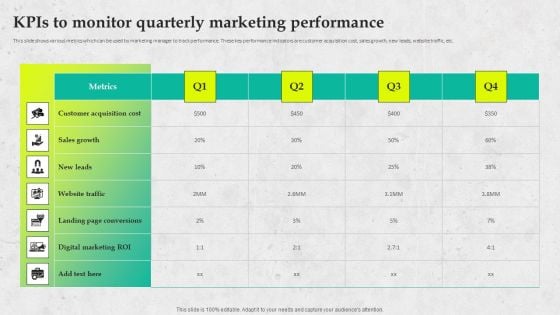
Service Promotion Plan Kpis To Monitor Quarterly Marketing Performance Diagrams PDF
This slide shows various metrics which can be used by marketing manager to track performance. These key performance indicators are customer acquisition cost, sales growth, new leads, website traffic, etc. Make sure to capture your audiences attention in your business displays with our gratis customizable Service Promotion Plan Kpis To Monitor Quarterly Marketing Performance Diagrams PDF. These are great for business strategies, office conferences, capital raising or task suggestions. If you desire to acquire more customers for your tech business and ensure they stay satisfied, create your own sales presentation with these plain slides.
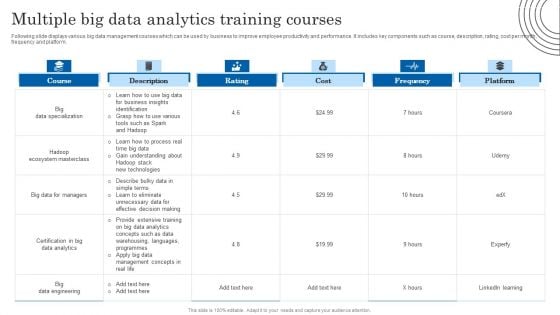
Multiple Big Data Analytics Training Courses Mockup PDF
Following slide displays various big data management courses which can be used by business to improve employee productivity and performance. It includes key components such as course, description, rating, cost per month, frequency and platform. Pitch your topic with ease and precision using this Multiple Big Data Analytics Training Courses Mockup PDF. This layout presents information on Data Specialization, Management Concepts, Business. It is also available for immediate download and adjustment. So, changes can be made in the color, design, graphics or any other component to create a unique layout.
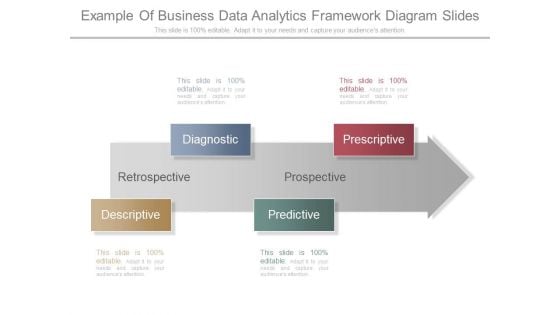
Example Of Business Data Analytics Framework Diagram Slides
This is a example of business data analytics framework diagram slides. This is a four stage process. The stages in this process are diagnostic, descriptive, predictive, prescriptive, retrospective, prospective.
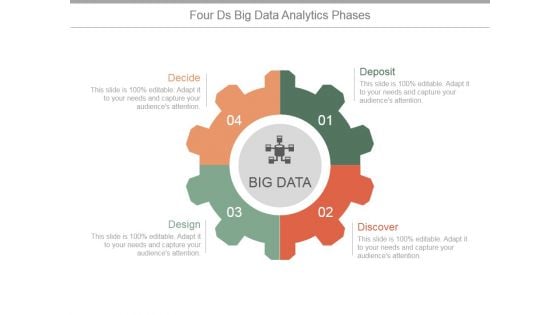
Four Ds Big Data Analytics Phases Ppt PowerPoint Presentation Shapes
This is a four ds big data analytics phases ppt powerpoint presentation shapes. This is a four stage process. The stages in this process are deposit, discover, design, decide.


 Continue with Email

 Home
Home


