Dashboards
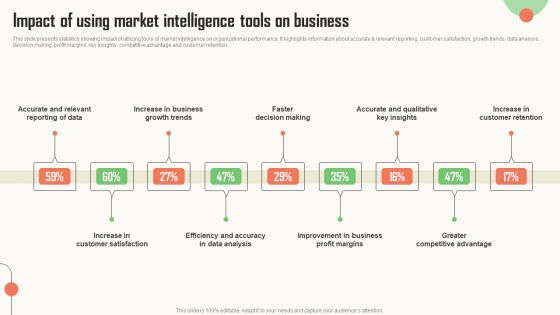
Strategic Market Insight Implementation Guide Impact Of Using Market Intelligence Tools On Business Download PDF
This slide presents statistics showing impact of utilizing tools of market intelligence on organizational performance. It highlights information about accurate and relevant reporting, customer satisfaction, growth trends, data analysis, decision making, profit margins, key insights, competitive advantage and customer retention. Crafting an eye catching presentation has never been more straightforward. Let your presentation shine with this tasteful yet straightforward Strategic Market Insight Implementation Guide Impact Of Using Market Intelligence Tools On Business Download PDF template. It offers a minimalistic and classy look that is great for making a statement. The colors have been employed intelligently to add a bit of playfulness while still remaining professional. Construct the ideal Strategic Market Insight Implementation Guide Impact Of Using Market Intelligence Tools On Business Download PDF that effortlessly grabs the attention of your audience. Begin now and be certain to wow your customers.
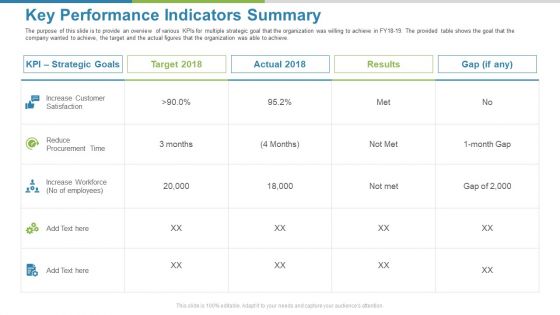
Work Execution Liability Key Performance Indicators Summary Ppt Show Slides PDF
The purpose of this slide is to provide an overview of various KPIs for multiple strategic goal that the organization was willing to achieve in FY18-19. The provided table shows the goal that the company wanted to achieve, the target and the actual figures that the organization was able to achieve. Deliver and pitch your topic in the best possible manner with this work execution liability key performance indicators summary ppt show slides pdf. Use them to share invaluable insights on strategic goals, target, actual, results, gap and impress your audience. This template can be altered and modified as per your expectations. So, grab it now.
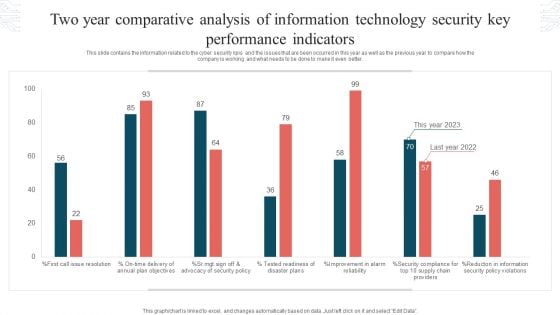
Two Year Comparative Analysis Of Information Technology Security Key Performance Indicators Graphics PDF
This slide contains the information related to the cyber security kpis and the issues that are been occurred in this year as well as the previous year to compare how the company is working and what needs to be done to make it even better. Showcasing this set of slides titled Two Year Comparative Analysis Of Information Technology Security Key Performance Indicators Graphics PDF. The topics addressed in these templates are Tested Readiness, Disaster Plans, Security Policy Violations. All the content presented in this PPT design is completely editable. Download it and make adjustments in color, background, font etc. as per your unique business setting.
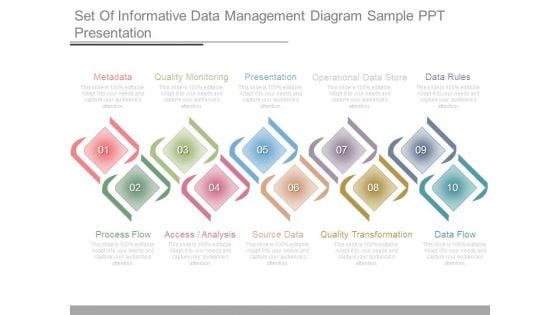
Set Of Informative Data Management Diagram Sample Ppt Presentation
This is a set of informative data management diagram sample ppt presentation. This is a ten stage process. The stages in this process are metadata, quality monitoring, presentation, operational data store, data rules, process flow, access analysis, source data, quality transformation, data flow.

Consumption Metrics Sharing Metrics Ppt Example
This is a consumption metrics sharing metrics ppt example. This is a four stage process. The stages in this process are circle charts, business, marketing.
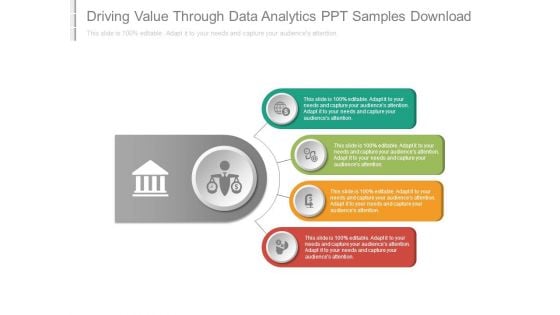
Driving Value Through Data Analytics Ppt Samples Download
This is a driving value through data analytics ppt samples download. This is a four stage process. The stages in this process are icons, business, strategy, management, process, marketing.
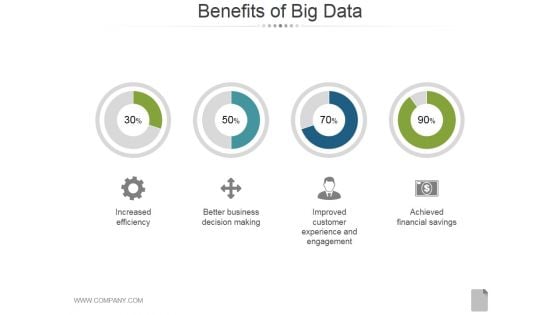
Benefits Of Big Data Ppt PowerPoint Presentation Inspiration
This is a benefits of big data ppt powerpoint presentation inspiration. This is a four stage process. The stages in this process are increased efficiency, better business decision making, improved customer experience and engagement, achieved financial savings.
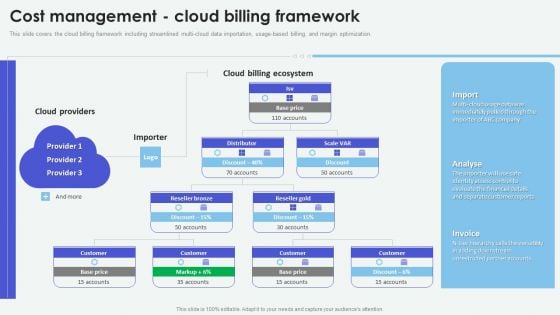
Cloud Based Computing Analysis Cost Management Cloud Billing Framework Portrait PDF
This slide covers the cloud billing framework including streamlined multi-cloud data importation, usage-based billing, and margin optimization. Present like a pro with Cloud Based Computing Analysis Cost Management Cloud Billing Framework Portrait PDF Create beautiful presentations together with your team, using our easy-to-use presentation slides. Share your ideas in real-time and make changes on the fly by downloading our templates. So whether youre in the office, on the go, or in a remote location, you can stay in sync with your team and present your ideas with confidence. With Slidegeeks presentation got a whole lot easier. Grab these presentations today.
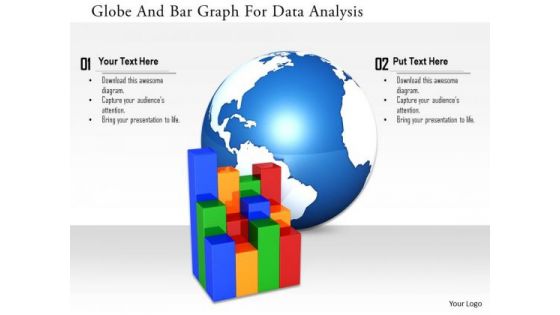
Stock Photo Globe And Bar Graph For Data Analysis Image Graphics For PowerPoint Slide
This image slide has been designed with business graph with globe in background. This image slide represents topics like global business, economic growth. This image will enhance the quality of your presentations.
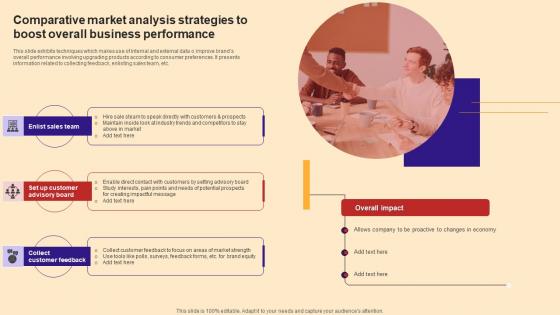
Comparative Market Analysis Strategies To Boost Overall Business Performance Mockup Pdf
This slide exhibits techniques which makes use of internal and external data o improve brands overall performance involving upgrading products according to consumer preferences. It presents information related to collecting feedback, enlisting sales team, etc.Showcasing this set of slides titled Comparative Market Analysis Strategies To Boost Overall Business Performance Mockup Pdf The topics addressed in these templates are Speak Directly, Industry Trends, Market Strength All the content presented in this PPT design is completely editable. Download it and make adjustments in color, background, font etc. as per your unique business setting. This slide exhibits techniques which makes use of internal and external data o improve brands overall performance involving upgrading products according to consumer preferences. It presents information related to collecting feedback, enlisting sales team, etc.
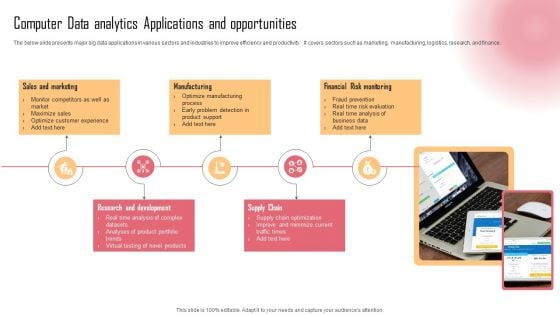
Computer Data Analytics Applications And Opportunities Demonstration PDF
The below slide presents major big data applications in various sectors and industries to improve efficiency and productivity. It covers sectors such as marketing, manufacturing, logistics, research, and finance. Presenting Computer Data Analytics Applications And Opportunities Demonstration PDF to dispense important information. This template comprises five stages. It also presents valuable insights into the topics including Sales And Marketing, Manufacturing, Financial Risk Monitoring . This is a completely customizable PowerPoint theme that can be put to use immediately. So, download it and address the topic impactfully.

Technology And Skills Matrix For Data Interpretation And Evaluation Lifecycle Phases Slides PDF
This slide covers the matrix representing technology and skills required for each phase of data analytics and assessment infrastructure lifecycle. It includes four phases of analytics infrastructure lifecycle such as ingestion, data quality and governance, data lake administration and analytics. Presenting Technology And Skills Matrix For Data Interpretation And Evaluation Lifecycle Phases Slides PDF to dispense important information. This template comprises four stages. It also presents valuable insights into the topics including Ingestion, Data Lake Administration, Data Quality And Governance. This is a completely customizable PowerPoint theme that can be put to use immediately. So, download it and address the topic impactfully.
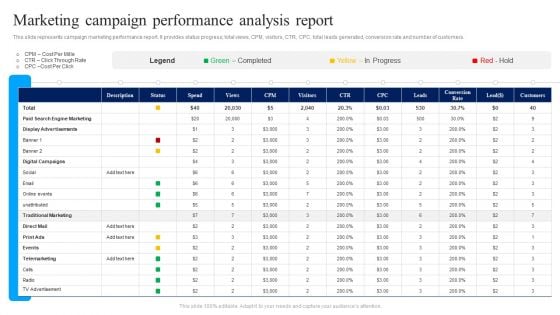
Marketing Campaign Performance Analysis Report Ppt Infographics Infographics PDF
This slide represents campaign marketing performance report. It provides status progress, total views, CPM, visitors, CTR, CPC, total leads generated, conversion rate and number of customers. Showcasing this set of slides titled Marketing Campaign Performance Analysis Report Ppt Infographics Infographics PDF. The topics addressed in these templates are Display Advertisements, Digital Campaigns, Traditional Marketing. All the content presented in this PPT design is completely editable. Download it and make adjustments in color, background, font etc. as per your unique business setting.
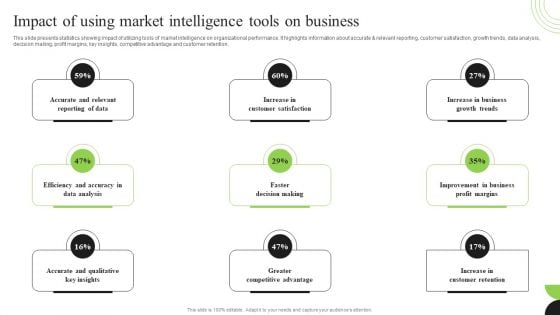
Guidebook For Executing Business Market Intelligence Impact Of Using Market Intelligence Formats PDF
This slide presents statistics showing impact of utilizing tools of market intelligence on organizational performance. It highlights information about accurate and relevant reporting, customer satisfaction, growth trends, data analysis, decision making, profit margins, key insights, competitive advantage and customer retention. This Guidebook For Executing Business Market Intelligence Impact Of Using Market Intelligence Formats PDF is perfect for any presentation, be it in front of clients or colleagues. It is a versatile and stylish solution for organizing your meetings. The product features a modern design for your presentation meetings. The adjustable and customizable slides provide unlimited possibilities for acing up your presentation. Slidegeeks has done all the homework before launching the product for you. So, do not wait, grab the presentation templates today
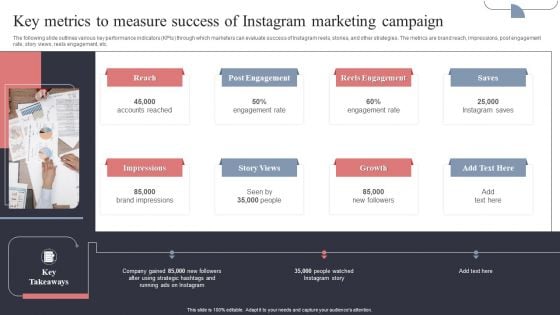
Key Metrics To Measure Success Of Instagram Marketing Campaign Designs PDF
The following slide outlines various key performance indicators KPIs through which marketers can evaluate success of Instagram reels, stories, and other strategies. The metrics are brand reach, impressions, post engagement rate, story views, reels engagement, etc. Find highly impressive Key Metrics To Measure Success Of Instagram Marketing Campaign Designs PDF on Slidegeeks to deliver a meaningful presentation. You can save an ample amount of time using these presentation templates. No need to worry to prepare everything from scratch because Slidegeeks experts have already done a huge research and work for you. You need to download Key Metrics To Measure Success Of Instagram Marketing Campaign Designs PDF for your upcoming presentation. All the presentation templates are 100 percent editable and you can change the color and personalize the content accordingly. Download now
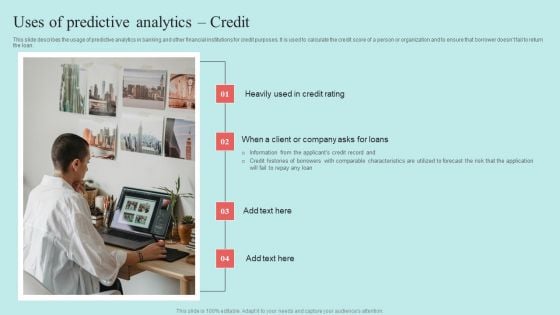
Predictive Data Model Uses Of Predictive Analytics Credit Information PDF
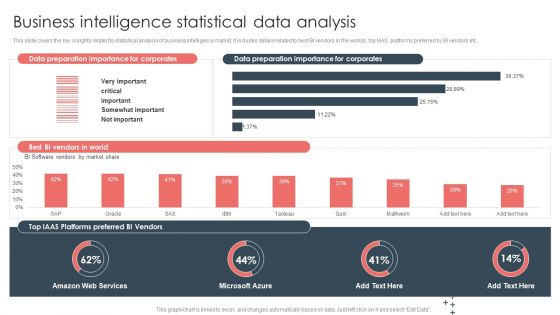
Overview Of BI For Enhanced Decision Making Business Intelligence Statistical Data Analysis Guidelines PDF
This slide covers the key insights related to statistical analysis of business intelligence market. It includes details related to best BI vendors in the worlds, top IAAS platforms preferred by BI vendors etc. There are so many reasons you need a Overview Of BI For Enhanced Decision Making Business Intelligence Statistical Data Analysis Guidelines PDF. The first reason is you cannot spend time making everything from scratch, Thus, Slidegeeks has made presentation templates for you too. You can easily download these templates from our website easily.
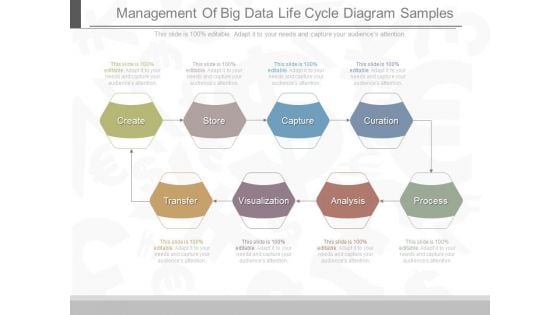
Management Of Big Data Life Cycle Diagram Samples
This is a management of big data life cycle diagram samples. This is a eight stage process. The stages in this process are create, store, capture, curation, transfer, visualization, analysis, process.
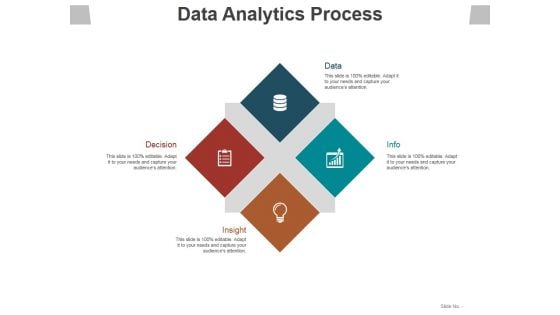
Data Analytics Process Ppt PowerPoint Presentation Show Example
This is a data analytics process ppt powerpoint presentation show example. This is a four stage process. The stages in this process are decision, insight, info, data, icons.
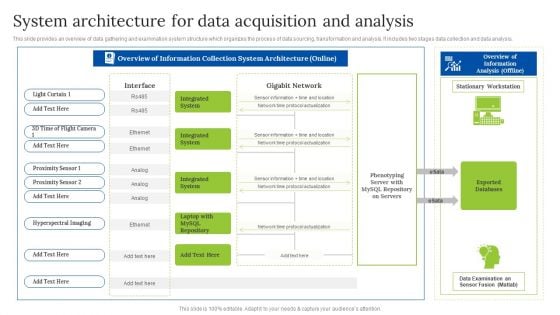
System Architecture For Data Acquisition And Analysis Professional PDF
This slide provides an overview of data gathering and examination system structure which organizes the process of data sourcing, transformation and analysis. It includes two stages data collection and data analysis.Pitch your topic with ease and precision using this System Architecture For Data Acquisition And Analysis Professional PDF. This layout presents information on Overview Of Information, Collection System, Architecture Online. It is also available for immediate download and adjustment. So, changes can be made in the color, design, graphics or any other component to create a unique layout.
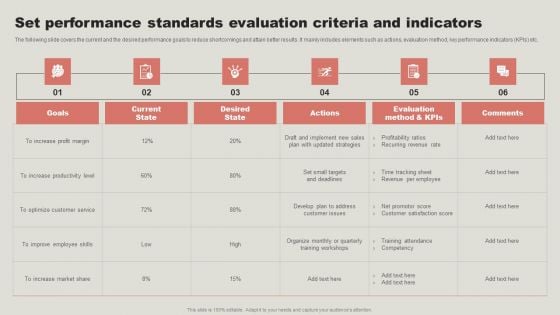
Set Performance Standards Evaluation Criteria And Indicators Brochure PDF
The following slide covers the current and the desired performance goals to reduce shortcomings and attain better results. It mainly includes elements such as actions, evaluation method, key performance indicators KPIs etc. Welcome to our selection of the Set Performance Standards Evaluation Criteria And Indicators Brochure PDF. These are designed to help you showcase your creativity and bring your sphere to life. Planning and Innovation are essential for any business that is just starting out. This collection contains the designs that you need for your everyday presentations. All of our PowerPoints are 100 percent editable, so you can customize them to suit your needs. This multi purpose template can be used in various situations. Grab these presentation templates today.
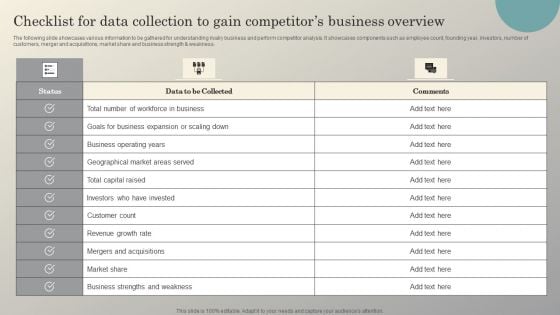
Steps To Conduct Competitor Analysis Checklist For Data Collection To Gain Competitors Ideas PDF
The following slide showcases various information to be gathered for understanding rivalry business and perform competitor analysis. It showcases components such as employee count, founding year, investors, number of customers, merger and acquisitions, market share and business strength and weakness. This Steps To Conduct Competitor Analysis Checklist For Data Collection To Gain Competitors Ideas PDF is perfect for any presentation, be it in front of clients or colleagues. It is a versatile and stylish solution for organizing your meetings. The Steps To Conduct Competitor Analysis Checklist For Data Collection To Gain Competitors Ideas PDF features a modern design for your presentation meetings. The adjustable and customizable slides provide unlimited possibilities for acing up your presentation. Slidegeeks has done all the homework before launching the product for you. So, do not wait, grab the presentation templates today
Concept Of Promotion Tracking Based On Big Data Ppt Slides
This is a concept of promotion tracking based on big data ppt slides. This is a four stage process. The stages in this process are learning as belonging, community of practice, constructing identify, learning as becoming, learning as experience, negotiating meaning, learning as doing, engagement in practice, learning.
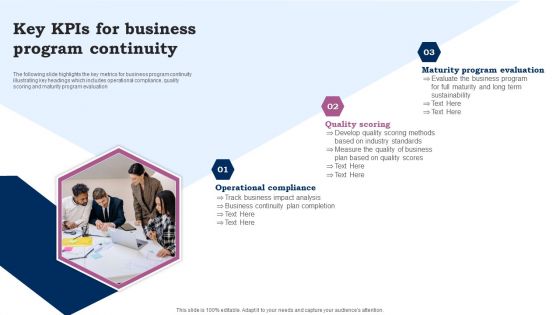
Key Kpis For Business Program Continuity Ppt Pictures Format PDF
The following slide highlights the key metrics for business program continuity illustrating key headings which includes operational compliance, quality scoring and maturity program evaluation. Persuade your audience using this Key Kpis For Business Program Continuity Ppt Pictures Format PDF. This PPT design covers three stages, thus making it a great tool to use. It also caters to a variety of topics including Operational Compliance, Quality Scoring, Maturity Program Evaluation. Download this PPT design now to present a convincing pitch that not only emphasizes the topic but also showcases your presentation skills.

Big Data Analytics Mobile Device Ppt Slide Template
This is a big data analytics mobile device ppt slide template. This is a five stage process. The stages in this process are big data analytics, mobile device, internet of things, social network, cloud computing.
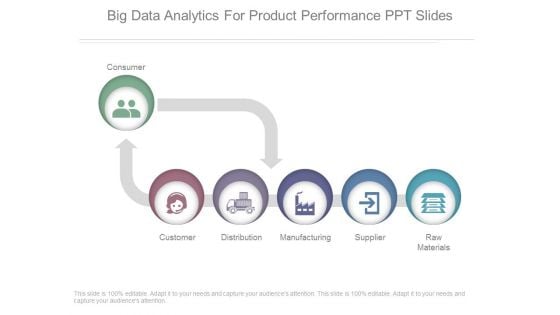
Big Data Analytics For Product Performance Ppt Slides
This is a big data analytics for product performance ppt slides. This is a five stage process. The stages in this process are consumer, customer, distribution, manufacturing, supplier, raw materials.
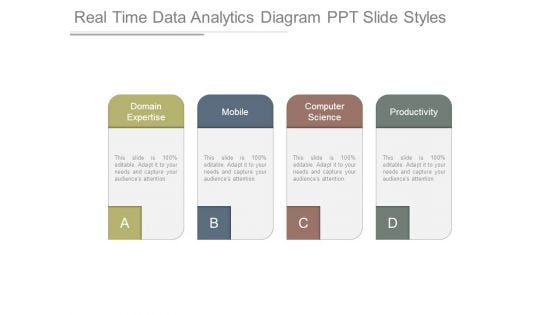
Real Time Data Analytics Diagram Ppt Slide Styles
This is a real time data analytics diagram ppt slide styles. This is a four stage process. The stages in this process are domain expertise, mobile, computer science, productivity.
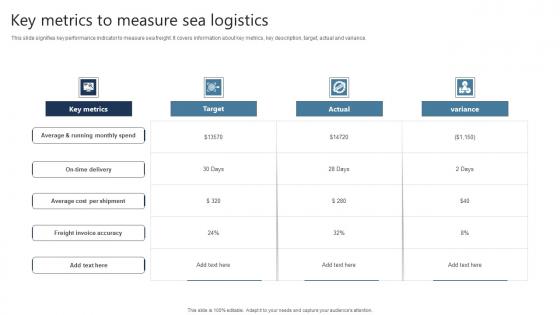
Key Metrics To Measure Sea Logistics Graphics Pdf
This slide signifies key performance indicator to measure sea freight. It covers information about key metrics, key description, target, actual and variance. Pitch your topic with ease and precision using this Key Metrics To Measure Sea Logistics Graphics Pdf This layout presents information on Freight Invoice Accuracy, Key Metrics, Target It is also available for immediate download and adjustment. So, changes can be made in the color, design, graphics or any other component to create a unique layout. This slide signifies key performance indicator to measure sea freight. It covers information about key metrics, key description, target, actual and variance.

Examining Customer Experience Path To Enhance Adoption Rate Marketplace Report To Ensure Product Structure PDF
This slide provides glimpse about a market data report that can help our organization to ensure availability of product information for boosting product interest among customers. It includes product images, sample offered, lab reports, etc. Welcome to our selection of the Examining Customer Experience Path To Enhance Adoption Rate Marketplace Report To Ensure Product Structure PDF. These are designed to help you showcase your creativity and bring your sphere to life. Planning and Innovation are essential for any business that is just starting out. This collection contains the designs that you need for your everyday presentations. All of our PowerPoints are 100 percent editable, so you can customize them to suit your needs. This multi purpose template can be used in various situations. Grab these presentation templates today.
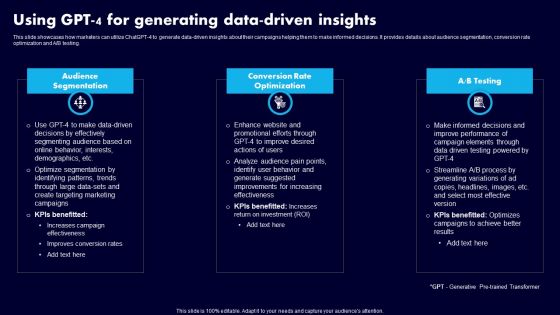
Using GPT 4 For Generating Data Driven Insights Topics PDF
This slide showcases how marketers can utilize ChatGPT-4 to generate data-driven insights about their campaigns helping them to make informed decisions. It provides details about audience segmentation, conversion rate optimization and A OR B testing. Boost your pitch with our creative Using GPT 4 For Generating Data Driven Insights Topics PDF. Deliver an awe-inspiring pitch that will mesmerize everyone. Using these presentation templates you will surely catch everyones attention. You can browse the ppts collection on our website. We have researchers who are experts at creating the right content for the templates. So you do not have to invest time in any additional work. Just grab the template now and use them.
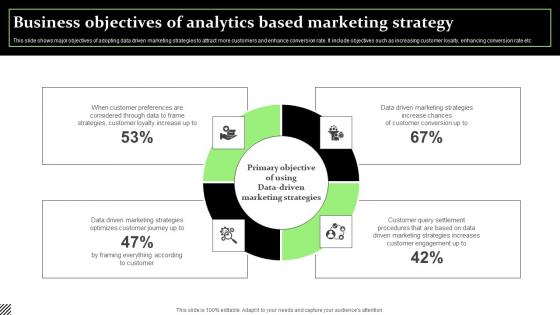
Business Objectives Of Analytics Based Marketing Strategy Formats Pdf
This slide shows major objectives of adopting data driven marketing strategies to attract more customers and enhance conversion rate. It include objectives such as increasing customer loyalty, enhancing conversion rate etc.Showcasing this set of slides titled Business Objectives Of Analytics Based Marketing Strategy Formats Pdf The topics addressed in these templates are Customer Preferences, Strategies Customer, Driven Marketing Strategies All the content presented in this PPT design is completely editable. Download it and make adjustments in color, background, font etc. as per your unique business setting. This slide shows major objectives of adopting data driven marketing strategies to attract more customers and enhance conversion rate. It include objectives such as increasing customer loyalty, enhancing conversion rate etc.
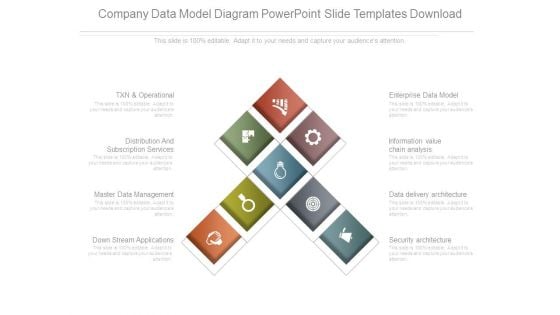
Company Data Model Diagram Powerpoint Slide Templates Download
This is a company data model diagram powerpoint slide templates download. This is a eight stage process. The stages in this process are txn and operational, distribution and subscription services, master data management, down stream applications, enterprise data model, information value chain analysis, data delivery architecture, security architecture.
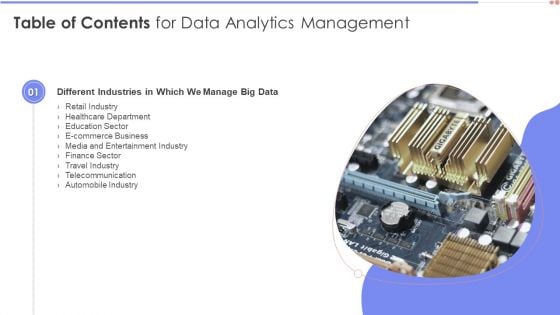
Table Of Contents For Data Analytics Management Slide Elements PDF
This is a Table Of Contents For Data Analytics Management Slide Elements PDF template with various stages. Focus and dispense information on one stage using this creative set, that comes with editable features. It contains large content boxes to add your information on topics like Different Industries, Healthcare Department, Entertainment Industry. You can also showcase facts, figures, and other relevant content using this PPT layout. Grab it now.
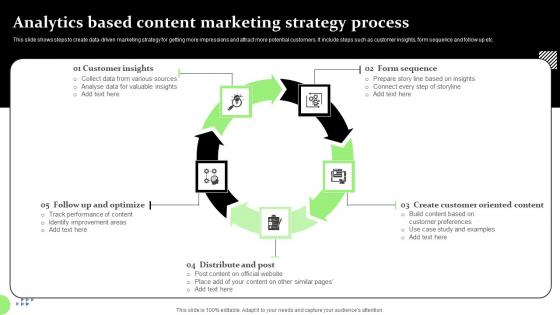
Analytics Based Content Marketing Strategy Process Professional Pdf
This slide shows steps to create data driven marketing strategy for getting more impressions and attract more potential customers. It include steps such as customer insights, form sequence and follow up etc this set of slides titled Analytics Based Content Marketing Strategy Process Professional Pdf The topics addressed in these templates are Customer Insights, Form Sequence, Customer Oriented Content All the content presented in this PPT design is completely editable. Download it and make adjustments in color, background, font etc. as per your unique business setting. This slide shows steps to create data driven marketing strategy for getting more impressions and attract more potential customers. It include steps such as customer insights, form sequence and follow up etc
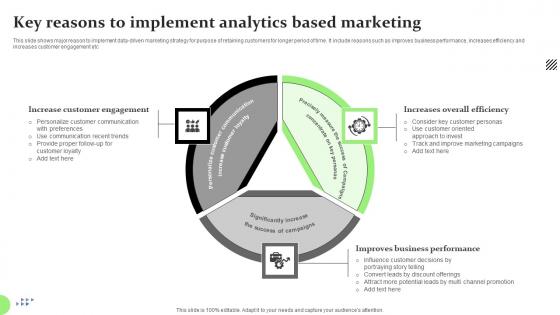
Key Reasons To Implement Analytics Based Marketing Diagrams Pdf
This slide shows major reason to implement data driven marketing strategy for purpose of retaining customers for longer period of time. It include reasons such as improves business performance, increases efficiency and increases customer engagement etc.Pitch your topic with ease and precision using this Key Reasons To Implement Analytics Based Marketing Diagrams Pdf This layout presents information on Increase Customer Engagement, Increases Overall Efficiency, Improves Business Performance It is also available for immediate download and adjustment. So, changes can be made in the color, design, graphics or any other component to create a unique layout. This slide shows major reason to implement data driven marketing strategy for purpose of retaining customers for longer period of time. It include reasons such as improves business performance, increases efficiency and increases customer engagement etc.

Solar Panels Green Heart Technology PowerPoint Templates And PowerPoint Backgrounds 0211
Microsoft PowerPoint Template and Background with green heart shaped solar panel in front of blue classic shaped solar panels Take control of your fate. Determine your destiny with our Solar Panels Green Heart Technology PowerPoint Templates And PowerPoint Backgrounds 0211.
Secondary Data Acquisition And Analysis Icon Download PDF
Pitch your topic with ease and precision using this Secondary Data Acquisition And Analysis Icon Download PDF. This layout presents information on Secondary Data, Acquisition Analysis Icon. It is also available for immediate download and adjustment. So, changes can be made in the color, design, graphics or any other component to create a unique layout.
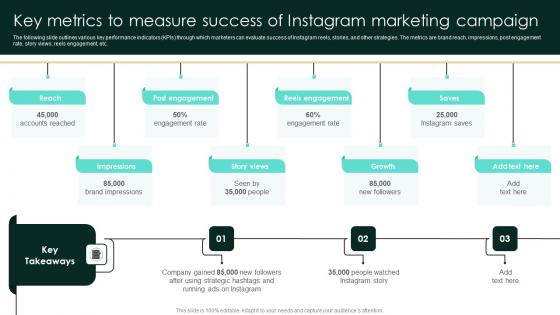
Key Metrics To Measure Success Of Instagram Marketing Campaign Strategic Real Estate Rules Pdf
The following slide outlines various key performance indicators KPIs through which marketers can evaluate success of Instagram reels, stories, and other strategies. The metrics are brand reach, impressions, post engagement rate, story views, reels engagement, etc. Slidegeeks has constructed Key Metrics To Measure Success Of Instagram Marketing Campaign Strategic Real Estate Rules Pdf after conducting extensive research and examination. These presentation templates are constantly being generated and modified based on user preferences and critiques from editors. Here, you will find the most attractive templates for a range of purposes while taking into account ratings and remarks from users regarding the content. This is an excellent jumping-off point to explore our content and will give new users an insight into our top-notch PowerPoint Templates. The following slide outlines various key performance indicators KPIs through which marketers can evaluate success of Instagram reels, stories, and other strategies. The metrics are brand reach, impressions, post engagement rate, story views, reels engagement, etc.
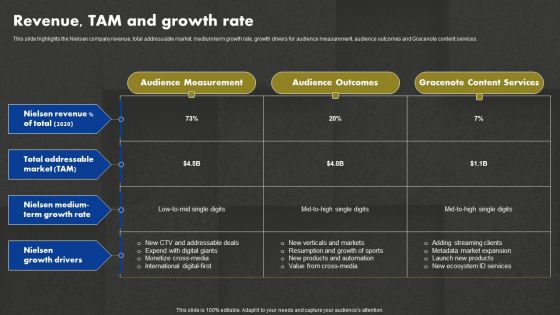
Data And Customer Analysis Company Outline Revenue TAM And Growth Rate Infographics PDF
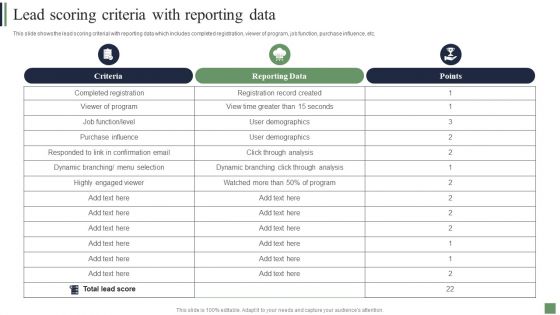
Customer Acquisition Strategies Lead Scoring Criteria With Reporting Data Mockup PDF
This slide shows the lead scoring criterial with reporting data which includes completed registration, viewer of program, job function, purchase influence, etc. Deliver and pitch your topic in the best possible manner with this Customer Acquisition Strategies Lead Scoring Criteria With Reporting Data Mockup PDF. Use them to share invaluable insights on Criteria, Reporting Data, Reporting Data and impress your audience. This template can be altered and modified as per your expectations. So, grab it now.

Business Intelligence And Big Data Work Streams Organizational Structure For Data Analytics Formats PDF
This slide shows the organization structure model including the analytics leadership, analytical tool for to obtain the business results. Presenting business intelligence and big data work streams organizational structure for data analytics formats pdf to provide visual cues and insights. Share and navigate important information on two stages that need your due attention. This template can be used to pitch topics like business sponsor, analytics leadership, business owner, it owner. In addtion, this PPT design contains high resolution images, graphics, etc, that are easily editable and available for immediate download.
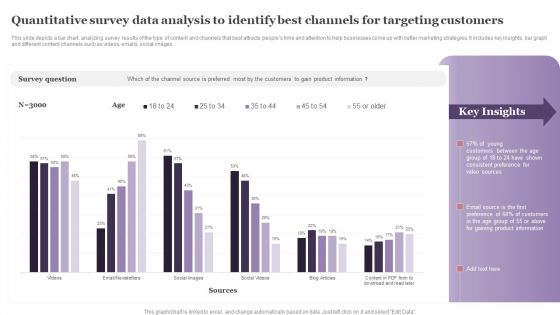
Quantitative Survey Data Analysis To Identify Best Channels For Targeting Customers Formats PDF
This slide depicts a bar chart, analyzing survey results of the type of content and channels that best attracts peoples time and attention to help businesses come up with better marketing strategies. It includes key insights, bar graph and different content channels such as videos, emails, social images. Pitch your topic with ease and precision using this Quantitative Survey Data Analysis To Identify Best Channels For Targeting Customers Formats PDF. This layout presents information on Survey Question, Young Customers, Consistent Preference. It is also available for immediate download and adjustment. So, changes can be made in the color, design, graphics or any other component to create a unique layout.
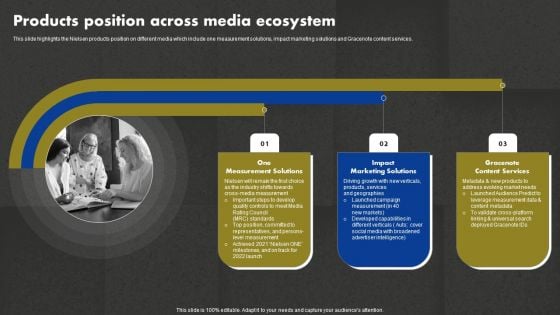
Data And Customer Analysis Company Outline Products Position Across Media Ecosystem Rules PDF

Data And Customer Analysis Company Outline Ppt PowerPoint Presentation Complete Deck With Slides
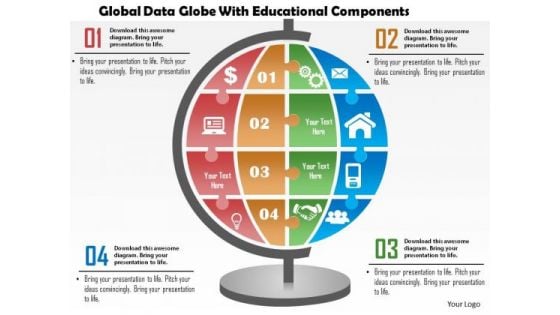
Business Diagram Global Data Globe With Educational Components Presentation Template
This business diagram has been designed with graphic of globe with icons. Use our diagram slide to organize data and to display data analysis. This diagram is suitable for global business and marketing related presentations.
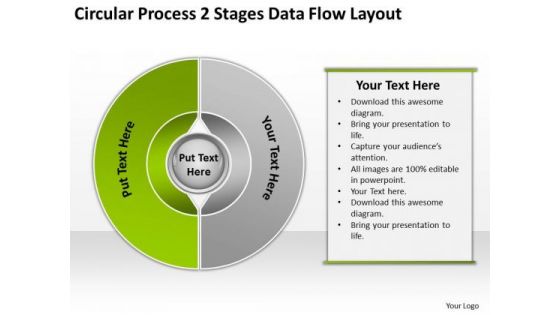
Circular Process 2 Stages Data Flow Layout Market Plan Example PowerPoint Slides
We present our circular process 2 stages data flow layout market plan example PowerPoint Slides.Use our Process and Flows PowerPoint Templates because Our PowerPoint Templates and Slides will let your team Walk through your plans. See their energy levels rise as you show them the way. Download our Circle Charts PowerPoint Templates because Our PowerPoint Templates and Slides will Activate the energies of your audience. Get their creative juices flowing with your words. Download our Business PowerPoint Templates because These PowerPoint Templates and Slides will give the updraft to your ideas. See them soar to great heights with ease. Use our Marketing PowerPoint Templates because You are an avid believer in ethical practices. Highlight the benefits that accrue with our PowerPoint Templates and Slides. Use our Success PowerPoint Templates because Our PowerPoint Templates and Slides will let you meet your Deadlines.Use these PowerPoint slides for presentations relating to Cross, circle,statistics, model, target,two,steps, statement, interface, business, arrow, list, presentation, glossy, internet, diagram, circle,brochure, description, report, marketing, level, abstract, wheel, steps, illustration, pie, chart, sphere, registry, catalog, section, futuristic, colors, web, design,information, space, demonstration, navigation, pattern, webdesign, structure, multiple, button, goals. The prominent colors used in the PowerPoint template are Green lime, White, Gray. Our Circular Process 2 Stages Data Flow Layout Market Plan Example PowerPoint Slides have a everlasting effect. They remain in the memory for ages.
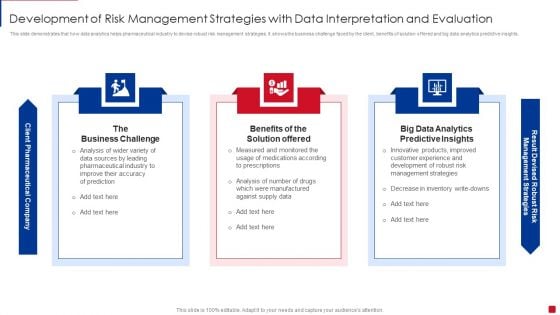
Development Of Risk Management Strategies With Data Interpretation And Evaluation Summary PDF
This slide demonstrates that how data analytics helps pharmaceutical industry to devise robust risk management strategies. It shows the business challenge faced by the client, benefits of solution offered and big data analytics predictive insights. Persuade your audience using this Development Of Risk Management Strategies With Data Interpretation And Evaluation Summary PDF. This PPT design covers three stages, thus making it a great tool to use. It also caters to a variety of topics including Business Challenge, Benefits Solution Offered, Big Data Analytics. Download this PPT design now to present a convincing pitch that not only emphasizes the topic but also showcases your presentation skills.
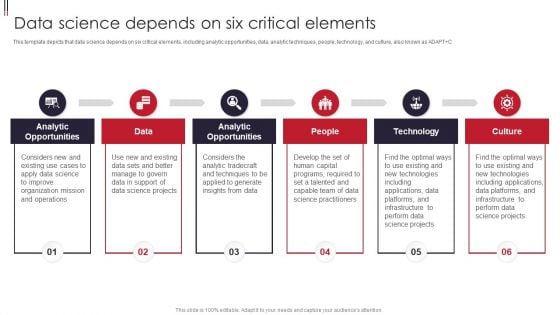
Information Visualizations Playbook Data Science Depends On Six Critical Elements Structure PDF
This template depicts that data science depends on six critical elements, including analytic opportunities, data, analytic techniques, people, technology, and culture, also known as ADAPT C. This is a Information Visualizations Playbook Data Science Depends On Six Critical Elements Structure PDF template with various stages. Focus and dispense information on six stages using this creative set, that comes with editable features. It contains large content boxes to add your information on topics like Data, Analytic Opportunities, Technology. You can also showcase facts, figures, and other relevant content using this PPT layout. Grab it now.
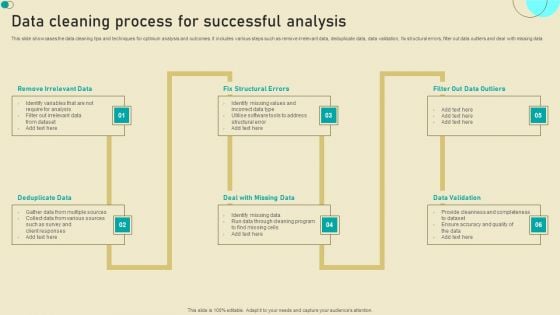
Data Cleaning Process For Successful Analysis Diagrams PDF
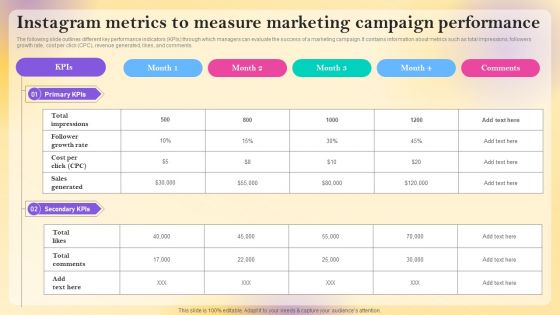
Instagram Metrics To Measure Marketing Campaign Performance Formats PDF
The following slide outlines different key performance indicators KPIs through which managers can evaluate the success of a marketing campaign. It contains information about metrics such as total impressions, followers growth rate, cost per click CPC, revenue generated, likes, and comments. Explore a selection of the finest Instagram Metrics To Measure Marketing Campaign Performance Formats PDF here. With a plethora of professionally designed and pre made slide templates, you can quickly and easily find the right one for your upcoming presentation. You can use our Instagram Metrics To Measure Marketing Campaign Performance Formats PDF to effectively convey your message to a wider audience. Slidegeeks has done a lot of research before preparing these presentation templates. The content can be personalized and the slides are highly editable. Grab templates today from Slidegeeks.

Data Mining Analysis Framework With ERP System Formats PDF
Mentioned slide delineates a comprehensive data mining analysis framework that an organization can use to manage day to day activities. The framework consists of several components such as experts, specialized knowledge, a definite goal, ERP database etc.Pitch your topic with ease and precision using this Data Mining Analysis Framework With ERP System Formats PDF This layout presents information on Data Preprocessing, Specialized Knowledge, Data Categories It is also available for immediate download and adjustment. So, changes can be made in the color, design, graphics or any other component to create a unique layout.
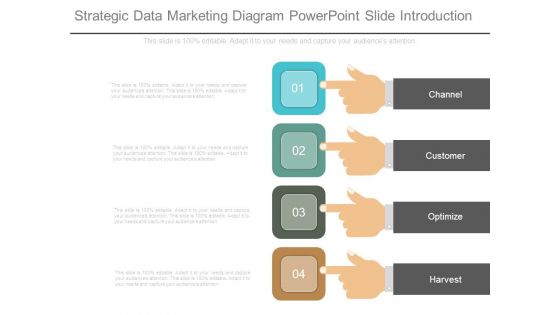
Strategic Data Marketing Diagram Powerpoint Slide Introduction
This is a strategic data marketing diagram powerpoint slide introduction. This is a four stage process. The stages in this process are channel, customer, optimize, harvest.
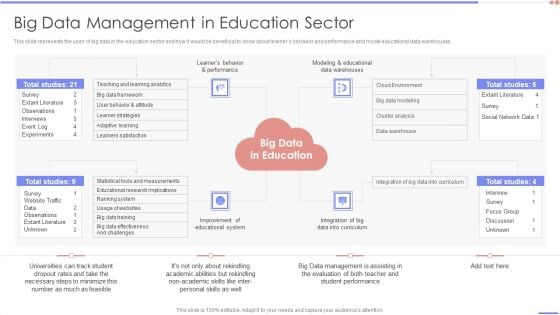
Data Analytics Management Big Data Management In Education Sector Diagrams PDF
This slide represents the uses of big data in the education sector and how it would be beneficial to know about learners behavior and performance and model educational data warehouses.This is a Data Analytics Management Big Data Management In Education Sector Diagrams PDF template with various stages. Focus and dispense information on four stages using this creative set, that comes with editable features. It contains large content boxes to add your information on topics like Extant Literature, Observations, Experiments . You can also showcase facts, figures, and other relevant content using this PPT layout. Grab it now.
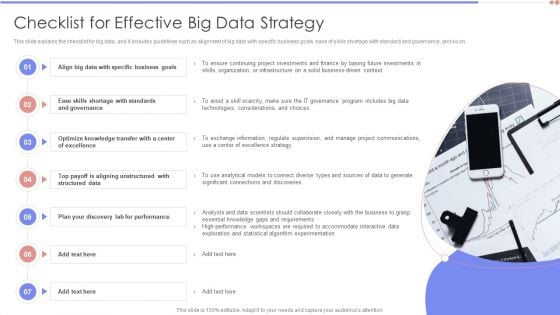
Data Analytics Management Checklist For Effective Big Data Strategy Themes PDF
This slide explains the checklist for big data, and it includes guidelines such as alignment of big data with specific business goals, ease of skills shortage with standard and governance, and so on.This is a Data Analytics Management Checklist For Effective Big Data Strategy Themes PDF template with various stages. Focus and dispense information on seven stages using this creative set, that comes with editable features. It contains large content boxes to add your information on topics like Standards Governance, Aligning Unstructured, Discovery Performance. You can also showcase facts, figures, and other relevant content using this PPT layout. Grab it now.
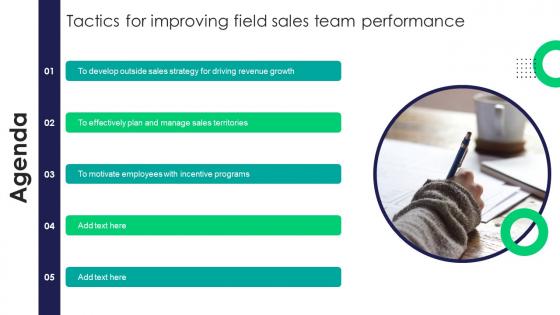
Agenda Tactics For Improving Field Sales Team Performance SA SS V
This slide showcases the impact of outside sales team with quarter-wise key performance indicators such as sales cycle length, cost per lead, win rate, etc. Boost your pitch with our creative Agenda Tactics For Improving Field Sales Team Performance SA SS V. Deliver an awe-inspiring pitch that will mesmerize everyone. Using these presentation templates you will surely catch everyones attention. You can browse the ppts collection on our website. We have researchers who are experts at creating the right content for the templates. So you do not have to invest time in any additional work. Just grab the template now and use them. Our Agenda Tactics For Improving Field Sales Team Performance SA SS V are topically designed to provide an attractive backdrop to any subject. Use them to look like a presentation pro.

Information Security Data Privacy Vs Data Security Ppt PowerPoint Presentation File Infographic Template PDF
This slide compares data privacy with data security, indicating that security is concerned with safeguarding data, and privacy is about responsible data usage. From laying roadmaps to briefing everything in detail, our templates are perfect for you. You can set the stage with your presentation slides. All you have to do is download these easy to edit and customizable templates. Information Security Data Privacy Vs Data Security Ppt PowerPoint Presentation File Infographic Template PDF will help you deliver an outstanding performance that everyone would remember and praise you for. Do download this presentation today.

How Sentiment Analysis Operates While Sentiment Analysis Demystified Understanding AI SS V
This slide provides information regarding the functioning of the sentiment analysis approach while detecting the core message of the text. The technique works by determining core message of the text with preprocessing and it also detect toxic content and categorizes it categories such as threats, insults, etc. The How Sentiment Analysis Operates While Sentiment Analysis Demystified Understanding AI SS V is a compilation of the most recent design trends as a series of slides. It is suitable for any subject or industry presentation, containing attractive visuals and photo spots for businesses to clearly express their messages. This template contains a variety of slides for the user to input data, such as structures to contrast two elements, bullet points, and slides for written information. Slidegeeks is prepared to create an impression. This slide provides information regarding the functioning of the sentiment analysis approach while detecting the core message of the text. The technique works by determining core message of the text with preprocessing and it also detect toxic content and categorizes it categories such as threats, insults, etc.
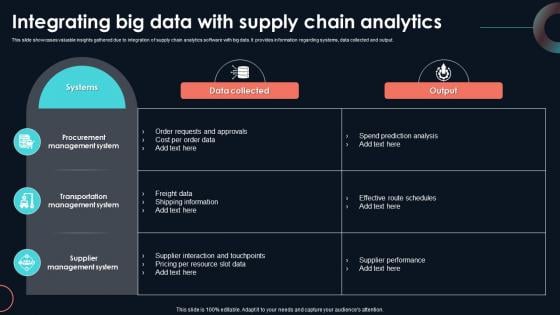
Integrating Big Data With Supply Chain Developing Strategic Insights Using Big Data Analytics SS V
This slide showcases valuable insights gathered due to integration of supply chain analytics software with big data. It provides information regarding systems, data collected and output. Create an editable Integrating Big Data With Supply Chain Developing Strategic Insights Using Big Data Analytics SS V that communicates your idea and engages your audience. Whether you are presenting a business or an educational presentation, pre-designed presentation templates help save time. Integrating Big Data With Supply Chain Developing Strategic Insights Using Big Data Analytics SS V is highly customizable and very easy to edit, covering many different styles from creative to business presentations. Slidegeeks has creative team members who have crafted amazing templates. So, go and get them without any delay. This slide showcases valuable insights gathered due to integration of supply chain analytics software with big data. It provides information regarding systems, data collected and output.
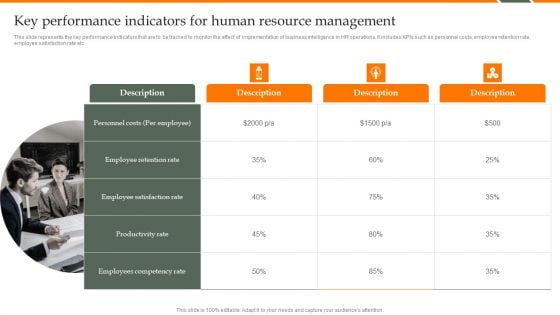
Human Resource Analytics Key Performance Indicators For Human Resource Management Sample PDF
This slide represents the key performance indicators that are to be tracked to monitor the effect of implementation of business intelligence in HR operations. It includes KPIs such as personnel costs, employee retention rate, employee satisfaction rate etc. Explore a selection of the finest Human Resource Analytics Key Performance Indicators For Human Resource Management Sample PDF here. With a plethora of professionally designed and pre-made slide templates, you can quickly and easily find the right one for your upcoming presentation. You can use our Human Resource Analytics Key Performance Indicators For Human Resource Management Sample PDF to effectively convey your message to a wider audience. Slidegeeks has done a lot of research before preparing these presentation templates. The content can be personalized and the slides are highly editable. Grab templates today from Slidegeeks.

Stages Of Pie Chart Data Interpretation Business Plan Template PowerPoint Templates
We present our stages of pie chart data interpretation business plan template PowerPoint templates.Download and present our Circle Charts PowerPoint Templates because You can Stir your ideas in the cauldron of our PowerPoint Templates and Slides. Cast a magic spell on your audience. Download our Marketing PowerPoint Templates because Our PowerPoint Templates and Slides will let you Hit the target. Go the full distance with ease and elan. Use our Business PowerPoint Templates because Our PowerPoint Templates and Slides are truly out of this world. Even the MIB duo has been keeping tabs on our team. Download our Shapes PowerPoint Templates because Watching this your Audience will Grab their eyeballs, they wont even blink. Download our Process and Flows PowerPoint Templates because It will Give impetus to the hopes of your colleagues. Our PowerPoint Templates and Slides will aid you in winning their trust.Use these PowerPoint slides for presentations relating to achievement, analysis, background, bank, banking, business, calculation, chart, circle, commerce, commercial, commission, concept, credit, crisis, debt, deposit, design, detail, diagram, earnings, economics, economy, element, finance, goal, gold, golden, graph, graphic, growth, icon, idea, illustration, income, increase, invest, isolated, level, loss, market, marketing, metal, modern, money, new, object, part, percent, percentage, pie, plot, politics, profit, progress, ratio, reflection, reflective. The prominent colors used in the PowerPoint template are Blue, Gray, Black. Feed their curiosity with our Stages Of Pie Chart Data Interpretation Business Plan Template PowerPoint Templates. Arouse expectations with your thoughts.


 Continue with Email

 Home
Home


