Financial Dashboard
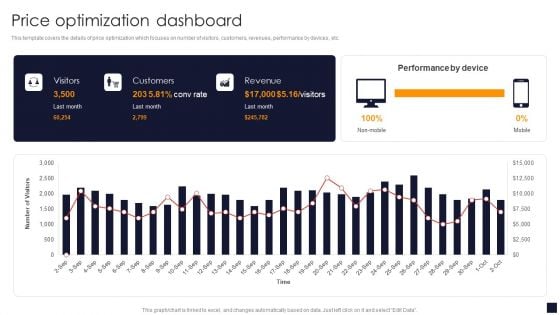
Price Optimization Dashboard Product Pricing Strategic Guide Introduction PDF
This template covers the details of price optimization which focuses on number of visitors, customers, revenues, performance by devices, etc.If your project calls for a presentation, then Slidegeeks is your go-to partner because we have professionally designed, easy-to-edit templates that are perfect for any presentation. After downloading, you can easily edit Price Optimization Dashboard Product Pricing Strategic Guide Introduction PDF and make the changes accordingly. You can rearrange slides or fill them with different images. Check out all the handy templates
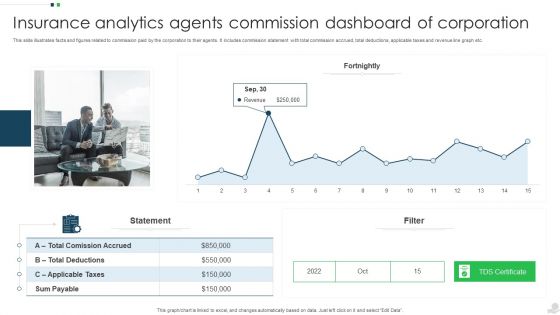
Insurance Analytics Agents Commission Dashboard Of Corporation Introduction PDF
This slide illustrates facts and figures related to commission paid by the corporation to their agents. It includes commission statement with total commission accrued, total deductions, applicable taxes and revenue line graph etc. Pitch your topic with ease and precision using this Insurance Analytics Agents Commission Dashboard Of Corporation Introduction PDF. This layout presents information on Applicable Taxes, Sum Payable, Revenue. It is also available for immediate download and adjustment. So, changes can be made in the color, design, graphics or any other component to create a unique layout.
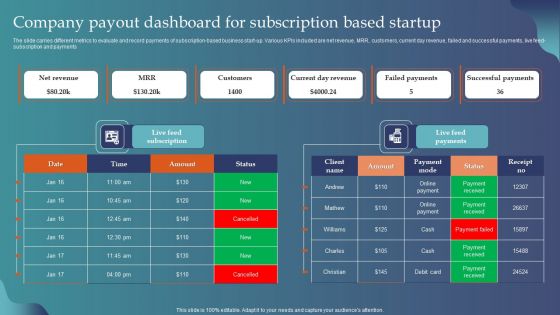
Company Payout Dashboard For Subscription Based Startup Designs PDF
The slide carries different metrics to evaluate and record payments of subscription-based business start-up. Various KPIs included are net revenue, MRR, customers, current day revenue, failed and successful payments, live feed- subscription and payments. Pitch your topic with ease and precision using this Company Payout Dashboard For Subscription Based Startup Designs PDF. This layout presents information on Net Revenue, MRR, Customers, Current Day Revenue. It is also available for immediate download and adjustment. So, changes can be made in the color, design, graphics or any other component to create a unique layout.
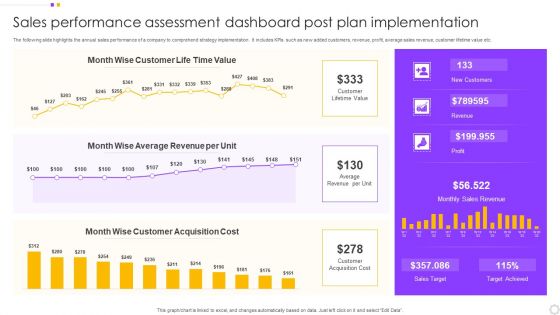
Sales Performance Assessment Dashboard Post Plan Implementation Introduction PDF
The following slide highlights the annual sales performance of a company to comprehend strategy implementation. It includes KPIs such as new added customers, revenue, profit, average sales revenue, customer lifetime value etc. Pitch your topic with ease and precision using this Sales Performance Assessment Dashboard Post Plan Implementation Introduction PDF. This layout presents information on Customer, Value, Average Revenue. It is also available for immediate download and adjustment. So, changes can be made in the color, design, graphics or any other component to create a unique layout.
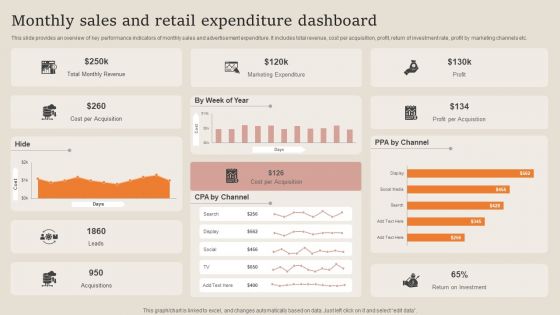
Monthly Sales And Retail Expenditure Dashboard Summary PDF
This slide provides an overview of key performance indicators of monthly sales and advertisement expenditure. It includes total revenue, cost per acquisition, profit, return of investment rate, profit by marketing channels etc. Pitch your topic with ease and precision using this Monthly Sales And Retail Expenditure Dashboard Summary PDF. This layout presents information on Marketing Expenditure, Revenue, Cost Per Acquisition. It is also available for immediate download and adjustment. So, changes can be made in the color, design, graphics or any other component to create a unique layout.
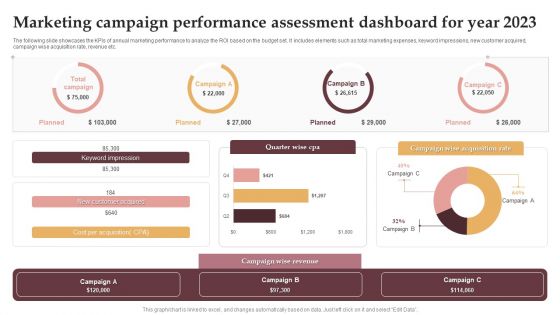
Marketing Campaign Performance Assessment Dashboard For Year 2023 Download PDF
The following slide showcases the KPIs of annual marketing performance to analyze the ROI based on the budget set. It includes elements such as total marketing expenses, keyword impressions, new customer acquired, campaign wise acquisition rate, revenue etc. Showcasing this set of slides titled Marketing Campaign Performance Assessment Dashboard For Year 2023 Download PDF. The topics addressed in these templates are Keyword Impression, New Customer Acquired, Campaign Wise Revenue. All the content presented in this PPT design is completely editable. Download it and make adjustments in color, background, font etc. as per your unique business setting.
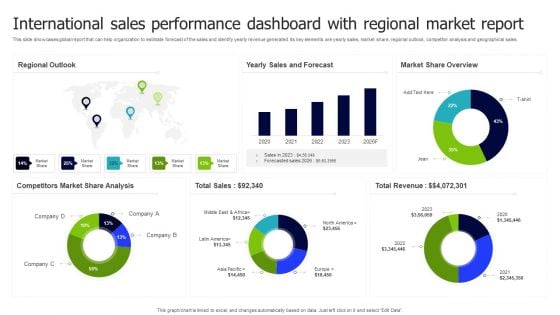
International Sales Performance Dashboard With Regional Market Report Inspiration PDF
This slide showcases global report that can help organization to estimate forecast of the sales and identify yearly revenue generated. Its key elements are yearly sales, market share, regional outlook, competitor analysis and geographical sales. Pitch your topic with ease and precision using this International Sales Performance Dashboard With Regional Market Report Inspiration PDF. This layout presents information on Regional Outlook, Sales And Forecast, Market Share Overview. It is also available for immediate download and adjustment. So, changes can be made in the color, design, graphics or any other component to create a unique layout.
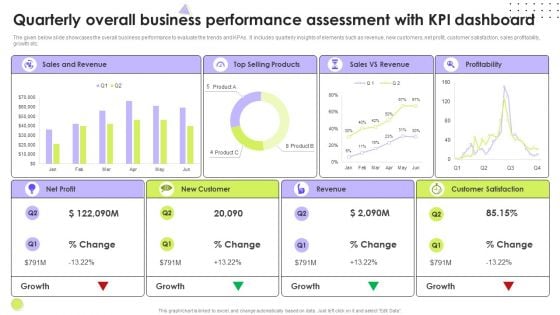
Quarterly Overall Business Performance Assessment With Kpi Dashboard Microsoft PDF
The given below slide showcases the overall business performance to evaluate the trends and KPAs. It includes quarterly insights of elements such as revenue, new customers, net profit, customer satisfaction, sales profitability, growth etc. Pitch your topic with ease and precision using this Quarterly Overall Business Performance Assessment With Kpi Dashboard Microsoft PDF. This layout presents information on Revenue, Customer Satisfaction, Net Profit. It is also available for immediate download and adjustment. So, changes can be made in the color, design, graphics or any other component to create a unique layout.
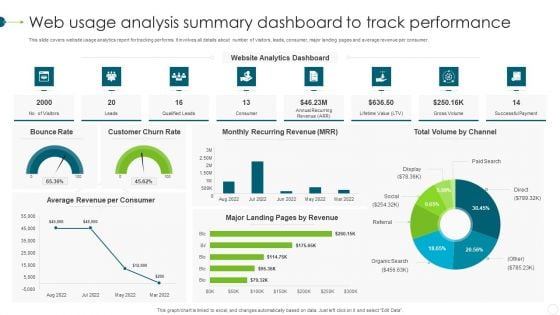
Web Usage Analysis Summary Dashboard To Track Performance Background PDF
This slide covers website usage analytics report for tracking performs. It involves all details about number of visitors, leads, consumer, major landing pages and average revenue per consumer. Showcasing this set of slides titled Web Usage Analysis Summary Dashboard To Track Performance Background PDF. The topics addressed in these templates are Customer Churn Rate, Bounce Rate, Monthly Recurring Revenue. All the content presented in this PPT design is completely editable. Download it and make adjustments in color, background, font etc. as per your unique business setting.
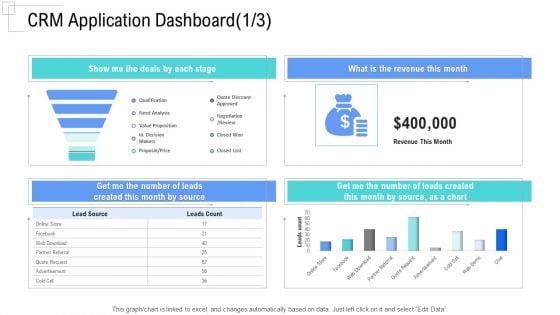
Managing Customer Experience CRM Application Dashboard Month Mockup PDF
This graph or chart is linked to excel, and changes automatically based on data. Just left click on it and select Edit Data.Deliver an awe-inspiring pitch with this creative managing customer experience crm application dashboard month mockup pdf bundle. Topics like show me the deals by each stage, what is the revenue this month, get me the number of leads created this month by source can be discussed with this completely editable template. It is available for immediate download depending on the needs and requirements of the user.
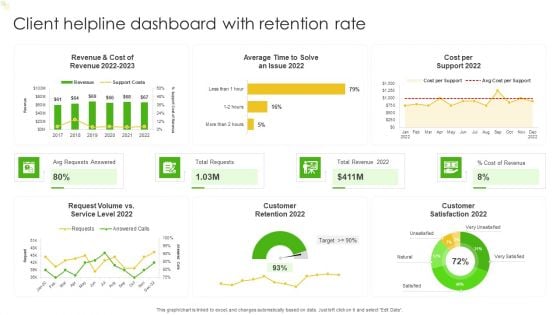
Client Helpline Dashboard With Retention Rate Ppt Gallery Ideas PDF
This graph or chart is linked to excel, and changes automatically based on data. Just left click on it and select Edit Data. Pitch your topic with ease and precision using this Client Helpline Dashboard With Retention Rate Ppt Gallery Ideas PDF. This layout presents information on Cost per Support 2022, Total Requests, Total Revenue 2022, Avg Requests Answered. It is also available for immediate download and adjustment. So, changes can be made in the color, design, graphics or any other component to create a unique layout.
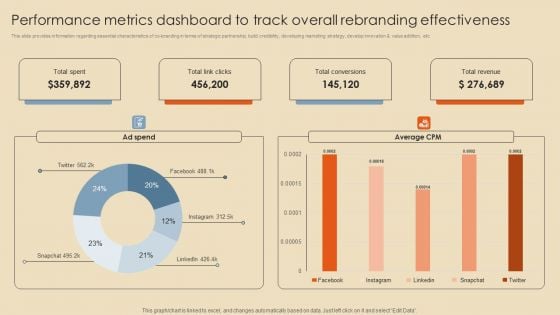
Performance Metrics Dashboard To Track Overall Rebranding Effectiveness Professional PDF
This slide provides information regarding essential characteristics of co-branding in terms of strategic partnership, build credibility, developing marketing strategy, develop innovation and value addition, etc. Make sure to capture your audiences attention in your business displays with our gratis customizable Performance Metrics Dashboard To Track Overall Rebranding Effectiveness Professional PDF. These are great for business strategies, office conferences, capital raising or task suggestions. If you desire to acquire more customers for your tech business and ensure they stay satisfied, create your own sales presentation with these plain slides.
Sales Techniques Playbook Sales Management Activities Tracking Dashboard Introduction PDF
This slide provides information regarding various metrics catered to track sales team performance in terms of average revenue per account, win rate, NPS, along with sales representative performance tracking through number of opportunities created, lead response time, etc. Deliver an awe inspiring pitch with this creative sales techniques playbook sales management activities tracking dashboard introduction pdf bundle. Topics like growth, sales can be discussed with this completely editable template. It is available for immediate download depending on the needs and requirements of the user.
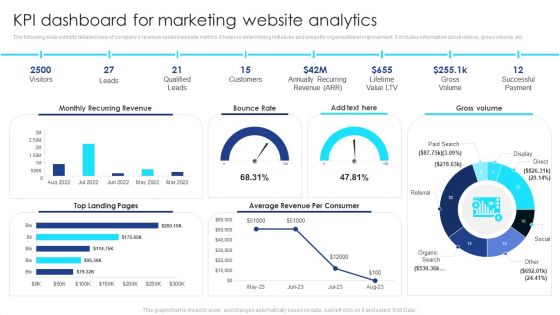
KPI Dashboard For Marketing Website Analytics Summary PDF
The following slide exhibits detailed view of companys revenue-related website metrics. It helps in determining initiatives and areas for organisational improvement. It includes information about visitors, gross volume, etc. Pitch your topic with ease and precision using this KPI Dashboard For Marketing Website Analytics Summary PDF. This layout presents information on Visitors, Leads, Qualified Leads, Customers, Gross Volume, Successful Payment. It is also available for immediate download and adjustment. So, changes can be made in the color, design, graphics or any other component to create a unique layout.
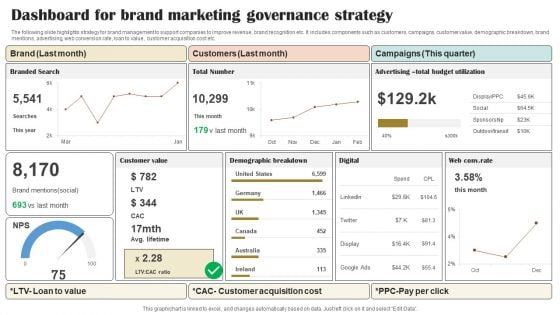
Dashboard For Brand Marketing Governance Strategy Portrait PDF
The following slide highlights strategy for brand management to support companies to improve revenue, brand recognition etc. It includes components such as customers, campaigns, customer value, demographic breakdown, brand mentions, advertising, web conversion rate, loan to value, customer acquisition cost etc. Pitch your topic with ease and precision using this Dashboard For Brand Marketing Governance Strategy Portrait PDF. This layout presents information on Brand, Customers, Campaigns. It is also available for immediate download and adjustment. So, changes can be made in the color, design, graphics or any other component to create a unique layout.
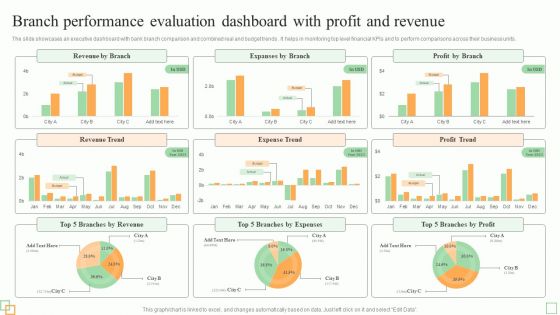
Branch Performance Evaluation Dashboard With Profit And Revenue Diagrams PDF
The slides showcases tips for enhancing branchs workforce performance and efficiency. It covers utilize transaction analysis data, schedule idle time, incent staff for efficiency, get bottom support and use part-time staff.Persuade your audience using this Best Practices To Improve Branch Workforce Performance Evaluation And Efficiency Introduction PDF. This PPT design covers five stages, thus making it a great tool to use. It also caters to a variety of topics including Market Opportunities, Customer Branch, Unnecessary Labor. Download this PPT design now to present a convincing pitch that not only emphasizes the topic but also showcases your presentation skills.
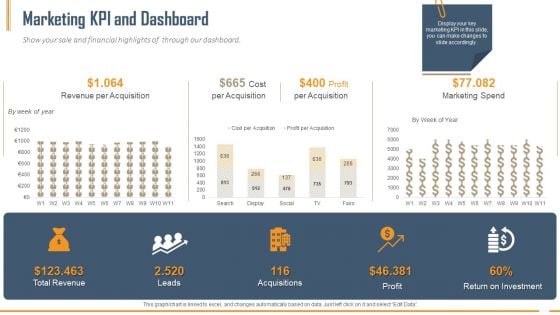
Building Innovation Capabilities And USP Detection Marketing KPI And Dashboard Ppt Infographic Template Pictures PDF
Show your sale and financial highlights of through our dashboard. Deliver an awe-inspiring pitch with this creative building innovation capabilities and usp detection marketing kpi and dashboard ppt infographic template pictures pdf bundle. Topics like revenue per acquisition, per acquisition, marketing spend, total revenu, leads, acquisitions, profit, return on investment can be discussed with this completely editable template. It is available for immediate download depending on the needs and requirements of the user.

Asset Assessment Dashboard With Cash Flow And Market Value Summary PDF
This slide illustrates asset valuation dashboard with key financial metrics. It provides information about cash flow, market value, intrinsic value, assumptions, market cap, discount rate, etc.Showcasing this set of slides titled Asset Assessment Dashboard With Cash Flow And Market Value Summary PDF. The topics addressed in these templates are Discount Rate, Capital Expenditure, Market Capitalization. All the content presented in this PPT design is completely editable. Download it and make adjustments in color, background, font etc. as per your unique business setting.
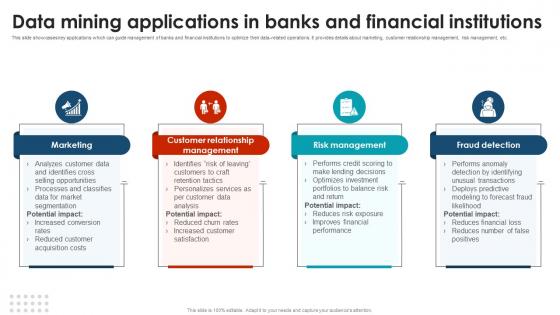
Data Mining Applications In Banks And Financial Using Data Mining Tools To Optimize Processes AI SS V
This slide showcases key applications which can guide management of banks and financial institutions to optimize their data-related operations. It provides details about marketing, customer relationship management, risk management, etc. Whether you have daily or monthly meetings, a brilliant presentation is necessary. Data Mining Applications In Banks And Financial Using Data Mining Tools To Optimize Processes AI SS V can be your best option for delivering a presentation. Represent everything in detail using Data Mining Applications In Banks And Financial Using Data Mining Tools To Optimize Processes AI SS V and make yourself stand out in meetings. The template is versatile and follows a structure that will cater to your requirements. All the templates prepared by Slidegeeks are easy to download and edit. Our research experts have taken care of the corporate themes as well. So, give it a try and see the results. This slide showcases key applications which can guide management of banks and financial institutions to optimize their data-related operations. It provides details about marketing, customer relationship management, risk management, etc.
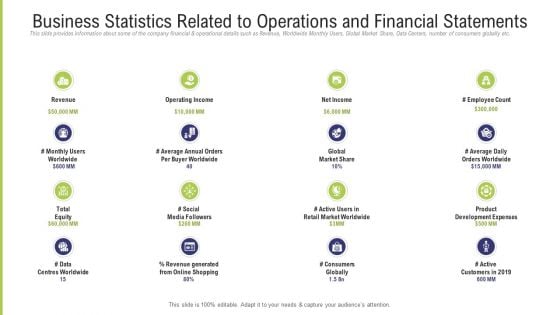
Funding Pitch Deck To Obtain Long Term Debt From Banks Business Statistics Related To Operations And Financial Statements Graphics PDF
This slide provides information about some of the company financial and operational details such as Revenue, Worldwide Monthly Users, Global Market Share, Data Centers, number of consumers globally etc. This is a funding pitch deck to obtain long term debt from banks business statistics related to operations and financial statements graphics pdf template with various stages. Focus and dispense information on one stage using this creative set, that comes with editable features. It contains large content boxes to add your information on topics like revenue, social media, net income, global market share, data centres worldwide. You can also showcase facts, figures, and other relevant content using this PPT layout. Grab it now.
Bar Chart With Magnifying Glass And Dollar Symbol For Financial Analysis Ppt PowerPoint Presentation File Structure PDF
Presenting this set of slides with name bar chart with magnifying glass and dollar symbol for financial analysis ppt powerpoint presentation file structure pdf. This is a one stage process. The stages in this process is bar chart with magnifying glass and dollar symbol for financial analysis. This is a completely editable PowerPoint presentation and is available for immediate download. Download now and impress your audience.
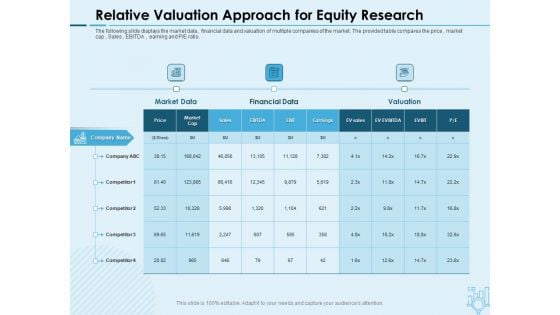
Assessing Stocks In Financial Market Relative Valuation Approach For Equity Research Ppt PowerPoint Presentation Ideas Graphics Tutorials PDF
Presenting this set of slides with name assessing stocks in financial market relative valuation approach for equity research ppt powerpoint presentation ideas graphics tutorials pdf. This is a three stage process. The stages in this process are market data, financial data, valuation. This is a completely editable PowerPoint presentation and is available for immediate download. Download now and impress your audience.
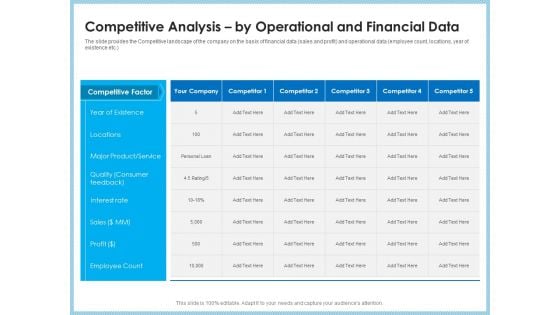
Investment Pitch To Generating Capital From Mezzanine Credit Competitive Analysis By Operational And Financial Data Inspiration PDF
The slide provides the Competitive landscape of the company on the basis of financial data sales and profit and operational data employee count, locations, year of existence etc. Deliver and pitch your topic in the best possible manner with this investment pitch to generating capital from mezzanine credit competitive analysis by operational and financial data inspiration pdf. Use them to share invaluable insights on competitive factor, year existence, locations, major product, service, quality consumer, interest rate and impress your audience. This template can be altered and modified as per your expectations. So, grab it now.

Investor Pitch Deck To Collect Capital From Subordinated Loan Competitive Analysis By Operational And Financial Data Diagrams PDF
The slide provides the Competitive landscape of the company on the basis of financial data sales and profit and operational data employee count, locations, year of existence etc. Deliver an awe-inspiring pitch with this creative investor pitch deck to collect capital from subordinated loan competitive analysis by operational and financial data diagrams pdf bundle. Topics like year existence, locations, major product service, interest rate, sales, employee count, profit can be discussed with this completely editable template. It is available for immediate download depending on the needs and requirements of the user.
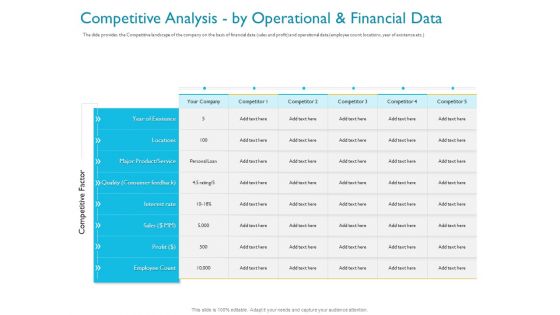
Investor Funding Deck For Hybrid Financing Competitive Analysis By Operational And Financial Data Ppt Pictures Rules PDF
The slide provides the Competitive landscape of the company on the basis of financial data sales and profit and operational data employee count, locations, year of existence etc. Deliver and pitch your topic in the best possible manner with this investor funding deck for hybrid financing competitive analysis by operational and financial data ppt pictures rules pdf. Use them to share invaluable insights on locations, sales, interest rate, major product, service, employee count, quality, consumer feedback and impress your audience. This template can be altered and modified as per your expectations. So, grab it now.
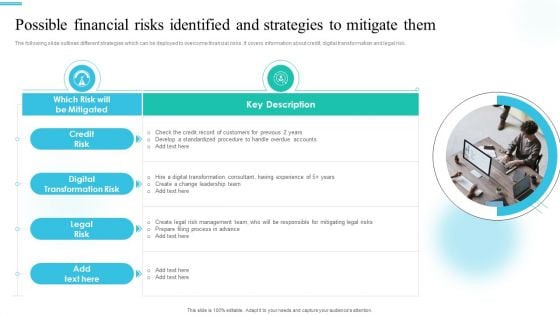
Monetary Planning And Evaluation Guide Possible Financial Risks Identified And Strategies To Mitigate Them Ppt Ideas Display PDF
The following slide outlines different strategies which can be deployed to overcome financial risks. It covers information about credit, digital transformation and legal risk. The Monetary Planning And Evaluation Guide Possible Financial Risks Identified And Strategies To Mitigate Them Ppt Ideas Display PDF is a compilation of the most recent design trends as a series of slides. It is suitable for any subject or industry presentation, containing attractive visuals and photo spots for businesses to clearly express their messages. This template contains a variety of slides for the user to input data, such as structures to contrast two elements, bullet points, and slides for written information. Slidegeeks is prepared to create an impression.
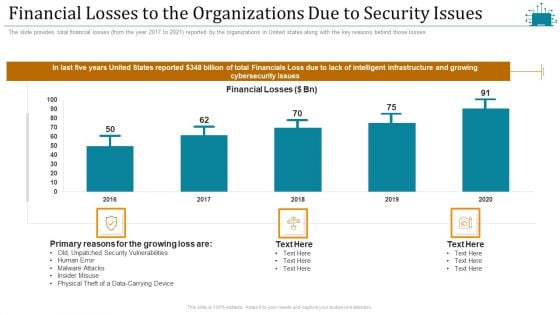
Cloud Intelligence Framework For Application Consumption Financial Losses To The Organizations Due To Security Issues Mockup PDF
The slide provides total financial losses from the year 2017 to 2021 reported by the organizations in United states along with the key reasons behind those losses. Deliver an awe inspiring pitch with this creative cloud intelligence framework for application consumption financial losses to the organizations due to security issues mockup pdf bundle. Topics like security vulnerabilities, primary reasons for the growing, physical theft of a data-carrying device, 2016 to 2020 can be discussed with this completely editable template. It is available for immediate download depending on the needs and requirements of the user.
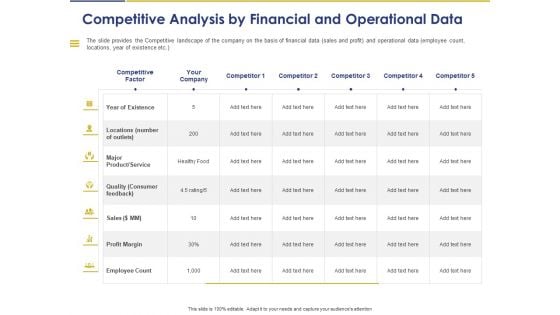
Convertible Note Pitch Deck Funding Strategy Competitive Analysis By Financial And Operational Data Ppt PowerPoint Presentation Styles Structure PDF
Presenting this set of slides with name convertible note pitch deck funding strategy competitive analysis by financial and operational data ppt powerpoint presentation styles structure pdf. The topics discussed in these slides are competitive factor, existence, locations, product service, quality consumer feedback, sales, profit marg, employee count. This is a completely editable PowerPoint presentation and is available for immediate download. Download now and impress your audience.
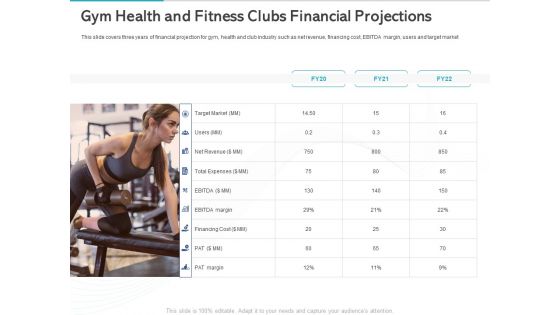
Gym Health And Fitness Market Industry Report Gym Health And Fitness Clubs Financial Projections Ppt Slides Maker PDF
Presenting this set of slides with name gym health and fitness market industry report gym health and fitness clubs financial projections ppt slides maker pdf. The topics discussed in these slides are target market, net revenue, financing cost, total expenses. This is a completely editable PowerPoint presentation and is available for immediate download. Download now and impress your audience.
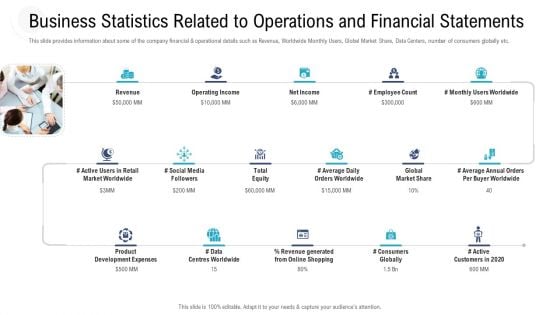
Investor Pitch Deck Procure Federal Debt From Banks Business Statistics Related To Operations And Financial Statements Download PDF
This slide provides information about some of the company financial and operational details such as Revenue, Worldwide Monthly Users, Global Market Share, Data Centers, number of consumers globally etc. This is a investor pitch deck procure federal debt from banks business statistics related to operations and financial statements download pdf template with various stages. Focus and dispense information on one stage using this creative set, that comes with editable features. It contains large content boxes to add your information on topics like revenue, operating income, data centres worldwide, product development expenses, social media. You can also showcase facts, figures, and other relevant content using this PPT layout. Grab it now.
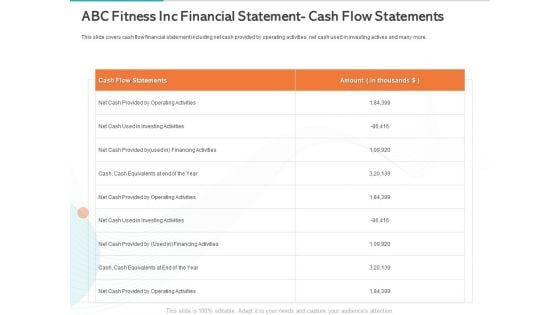
Gym Health And Fitness Market Industry Report Abc Fitness Inc Financial Statement Cash Flow Statements Ppt File Gallery PDF
Presenting this set of slides with name gym health and fitness market industry report abc fitness inc financial statement cash flow statements ppt file gallery pdf. The topics discussed in these slides are cash flow statements, amount, operating activities, investing activities, financing activities, cash, equivalents. This is a completely editable PowerPoint presentation and is available for immediate download. Download now and impress your audience.
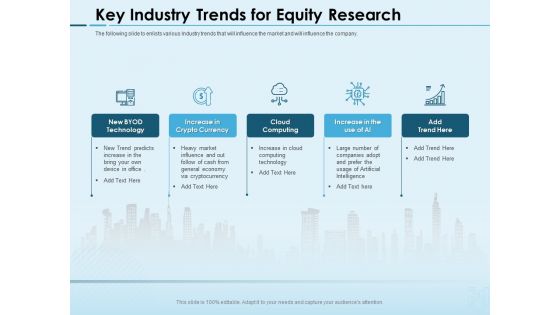
Assessing Stocks In Financial Market Key Industry Trends For Equity Research Ppt PowerPoint Presentation Show Templates PDF
Presenting this set of slides with name assessing stocks in financial market key industry trends for equity research ppt powerpoint presentation show templates pdf. This is a five stage process. The stages in this process are byod technology, increase in crypto currency, cloud, computing, increase ai. This is a completely editable PowerPoint presentation and is available for immediate download. Download now and impress your audience.
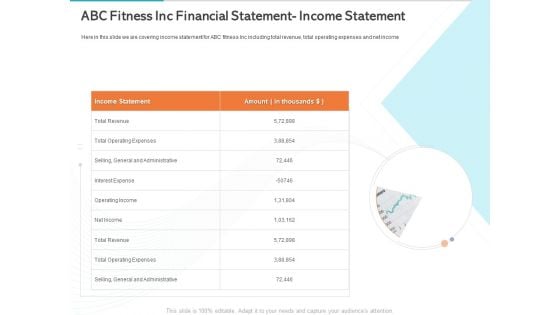
Gym Health And Fitness Market Industry Report Abc Fitness Inc Financial Statement Income Statement Ppt Infographic Template Gallery PDF
Presenting this set of slides with name gym health and fitness market industry report abc fitness inc financial statement income statement ppt infographic template gallery pdf. The topics discussed in these slides are income statement, amount, total revenue, total operating expenses, general and administrative, interest expense, operating income, net income. This is a completely editable PowerPoint presentation and is available for immediate download. Download now and impress your audience.
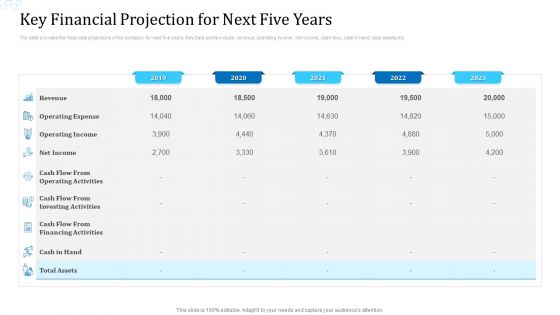
Investor Deck For Procuring Funds From Money Market Key Financial Projection For Next Five Years Designs PDF
The slide provides the financials projections of the company for next five years. Key Data points include revenue, operating income, net income, cash flow, cash in hand, total assets etc. Deliver and pitch your topic in the best possible manner with this investor deck for procuring funds from money market key financial projection for next five years designs pdf. Use them to share invaluable insights on revenue, operating expense, operating income, net income, financing and impress your audience. This template can be altered and modified as per your expectations. So, grab it now.
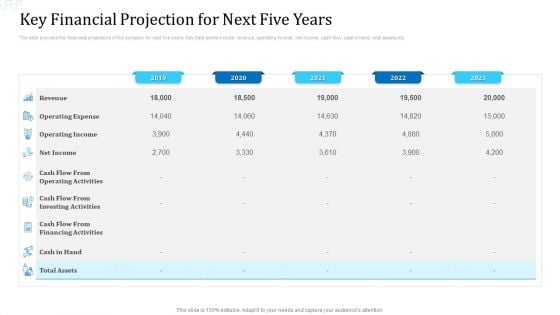
Investor Deck For Procuring Funds From Money Market Key Financial Projection For Next Five Years Portrait PDF
The slide provides the financials projections of the company for next five years. Key Data points include revenue, operating income, net income, cash flow, cash in hand, total assets etc. Deliver an awe inspiring pitch with this creative investor deck for procuring funds from money market key financial projection for next five years portrait pdf bundle. Topics like operating income, operating expense, net income can be discussed with this completely editable template. It is available for immediate download depending on the needs and requirements of the user.
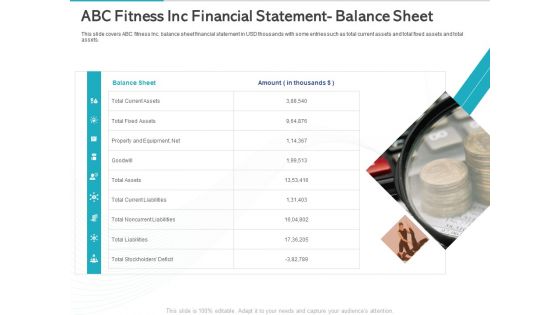
Gym Health And Fitness Market Industry Report Abc Fitness Inc Financial Statement Balance Sheet Ppt File Layouts PDF
Presenting this set of slides with name differentiated member experience, nationally recognized brand, scale advantage, exceptional value proposition that appeals to a broad member demographic, strong store level economics. This is a one stage process. The stages in this process are balance sheet, total current assets, total fixed assets, property and equipment, net, total current liabilities. This is a completely editable PowerPoint presentation and is available for immediate download. Download now and impress your audience.
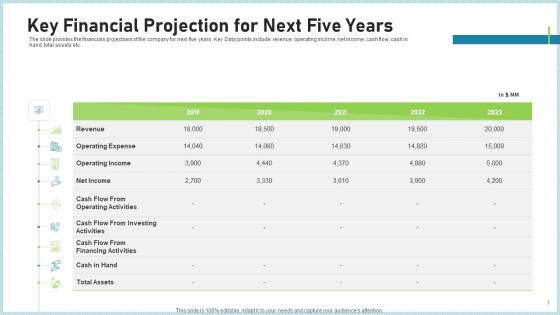
Pitch Deck To Attract Funding After IPO Market Key Financial Projection For Next Five Years Professional PDF
The slide provides the financials projections of the company for next five years. Key Data points include revenue, operating income, net income, cash flow, cash in hand, total assets etc.Deliver and pitch your topic in the best possible manner with this pitch deck to attract funding after ipo market key financial projection for next five years professional pdf. Use them to share invaluable insights on operating expense, cash flow from investing activities, cash flow from financing activities and impress your audience. This template can be altered and modified as per your expectations. So, grab it now.
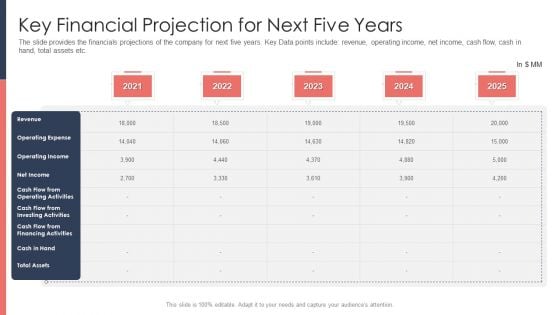
Pitch Deck For Fundraising From Post Market Financing Key Financial Projection For Next Five Years Template PDF
The slide provides the financials projections of the company for next five years. Key Data points include revenue, operating income, net income, cash flow, cash in hand, total assets etc.Deliver and pitch your topic in the best possible manner with this pitch deck for fundraising from post market financing key financial projection for next five years template pdf. Use them to share invaluable insights on operating expense, operating income, cash flow from operating activities and impress your audience. This template can be altered and modified as per your expectations. So, grab it now.
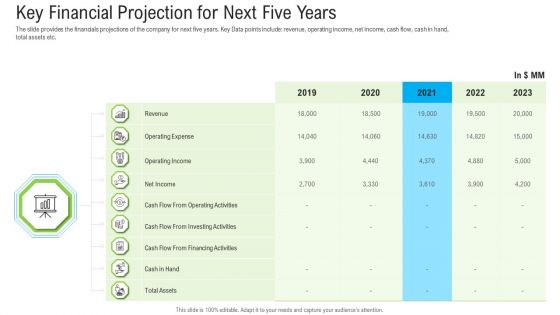
Pitch Deck To Raise Funding From Secondary Market Key Financial Projection For Next Five Years Designs PDF
The slide provides the financials projections of the company for next five years. Key Data points include revenue, operating income, net income, cash flow, cash in hand, total assets etc. Deliver and pitch your topic in the best possible manner with this pitch deck to raise funding from secondary market key financial projection for next five years designs pdf. Use them to share invaluable insights on operating expense, net income, financing activities, cash flow, 2019 to 2023 and impress your audience. This template can be altered and modified as per your expectations. So, grab it now.
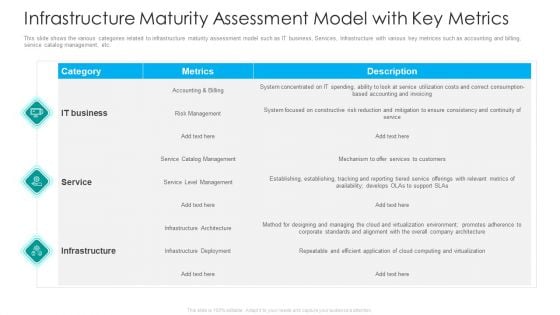
IT Facilities Maturity Framework For Strong Business Financial Position Infrastructure Maturity Assessment Model With Key Metrics Download PDF
This slide shows the various categories related to infrastructure maturity assessment model such as IT business, Services, Infrastructure with various key metrices such as accounting and billing, service catalog management, etc. Deliver an awe inspiring pitch with this creative it facilities maturity framework for strong business financial position infrastructure maturity assessment model with key metrics download pdf bundle. Topics like it business, service, infrastructure, risk management, deployment can be discussed with this completely editable template. It is available for immediate download depending on the needs and requirements of the user.

Pitch Deck To Raise Capital From Commercial Financial Institution Using Bonds Current Market Trends And Future Outlook Mockup PDF
This slide shows the current market overview of fast food market worldwide and Global Fast Food Market Size with a graph Deliver an awe-inspiring pitch with this creative pitch deck to raise capital from commercial financial institution using bonds current market trends and future outlook mockup pdf bundle. Topics like global fast food market size, restaurants and casual dining, restaurants together can be discussed with this completely editable template. It is available for immediate download depending on the needs and requirements of the user.

Security Information And Event Management Strategies For Financial Audit And Compliance Fully Managed Service Model Portrait PDF
This slide covers the SIEM as a service model wherein all the steps are taken care by our company and the client just have to provide us the relevant data. Deliver and pitch your topic in the best possible manner with this security information and event management strategies for financial audit and compliance fully managed service model portrait pdf. Use them to share invaluable insights on correlation, aggregation, collection, event sources and impress your audience. This template can be altered and modified as per your expectations. So, grab it now.
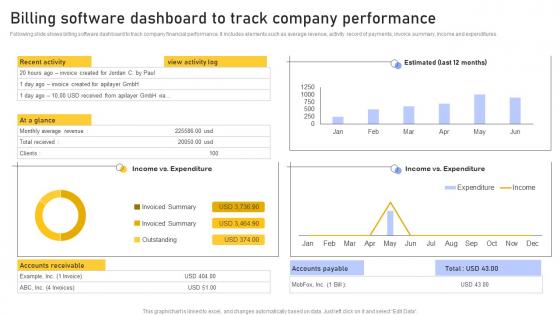
Billing Software Dashboard Enhancing Customer Service Operations Using CRM Technology Microsoft Pdf
Following slide shows billing software dashboard to track company financial performance. It includes elements such as average revenue, activity record of payments, invoice summary, income and expenditures. Create an editable Billing Software Dashboard Enhancing Customer Service Operations Using CRM Technology Microsoft Pdf that communicates your idea and engages your audience. Whether you are presenting a business or an educational presentation, pre designed presentation templates help save time. Billing Software Dashboard Enhancing Customer Service Operations Using CRM Technology Microsoft Pdf is highly customizable and very easy to edit, covering many different styles from creative to business presentations. Slidegeeks has creative team members who have crafted amazing templates. So, go and get them without any delay. Following slide shows billing software dashboard to track company financial performance. It includes elements such as average revenue, activity record of payments, invoice summary, income and expenditures.
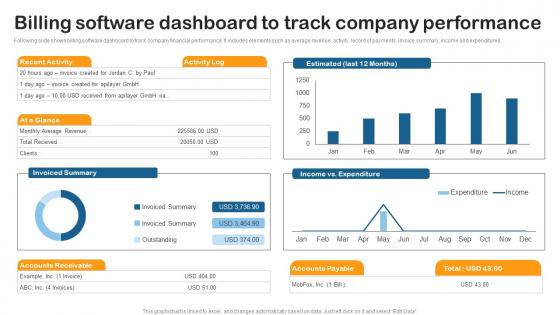
Billing Software Dashboard Track Building Utility Billing And Invoicing Management System Inspiration Pdf
Following slide shows billing software dashboard to track company financial performance. It includes elements such as average revenue, activity record of payments, invoice summary, income and expenditures. Create an editable Billing Software Dashboard Track Building Utility Billing And Invoicing Management System Inspiration Pdf that communicates your idea and engages your audience. Whether you are presenting a business or an educational presentation, pre designed presentation templates help save time. Billing Software Dashboard Track Building Utility Billing And Invoicing Management System Inspiration Pdf is highly customizable and very easy to edit, covering many different styles from creative to business presentations. Slidegeeks has creative team members who have crafted amazing templates. So, go and get them without any delay. Following slide shows billing software dashboard to track company financial performance. It includes elements such as average revenue, activity record of payments, invoice summary, income and expenditures.
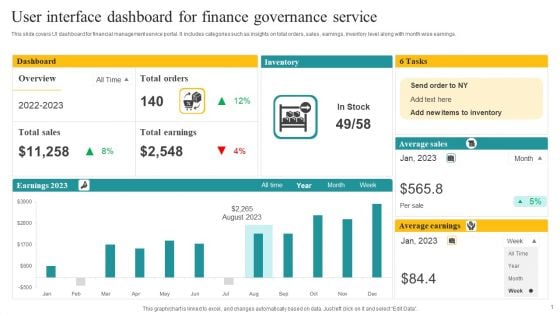
User Interface Dashboard For Finance Governance Service Ppt Outline Graphics Tutorials PDF
This slide covers UI dashboard for financial management service portal. It includes categories such as insights on total orders, sales , earnings, inventory level along with month wise earnings. Showcasing this set of slides titled User Interface Dashboard For Finance Governance Service Ppt Outline Graphics Tutorials PDF. The topics addressed in these templates are Dashboard, Inventory, Average Sales. All the content presented in this PPT design is completely editable. Download it and make adjustments in color, background, font etc. as per your unique business setting.
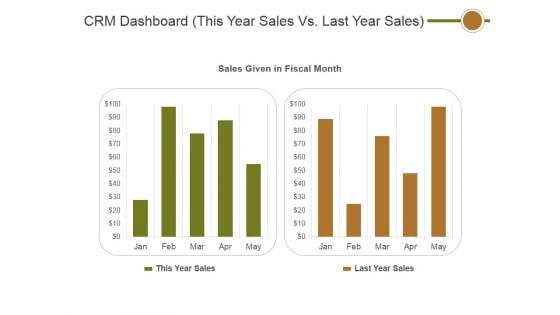
Crm Dashboard This Year Sales Vs Last Year Sales Ppt PowerPoint Presentation Layouts Outline
This is a crm dashboard this year sales vs last year sales ppt powerpoint presentation layouts outline. This is a two stage process. The stages in this process are sales given in fiscal month, this year sales, last year sales.
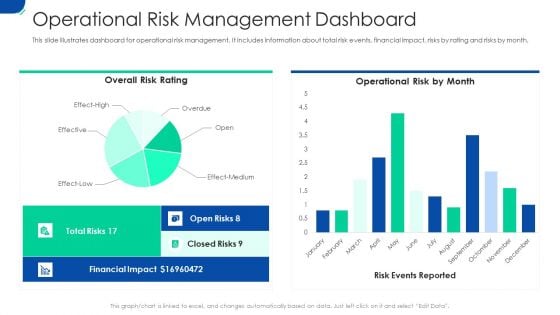
Initiating Hazard Managing Structure Firm Operational Risk Management Dashboard Brochure PDF
This slide illustrates dashboard for operational risk management. It includes information about total risk events, financial impact, risks by rating and risks by month. Deliver an awe-inspiring pitch with this creative initiating hazard managing structure firm operational risk management dashboard brochure pdf bundle. Topics like financial impact, operational risk, risk events, risk rating can be discussed with this completely editable template. It is available for immediate download depending on the needs and requirements of the user.
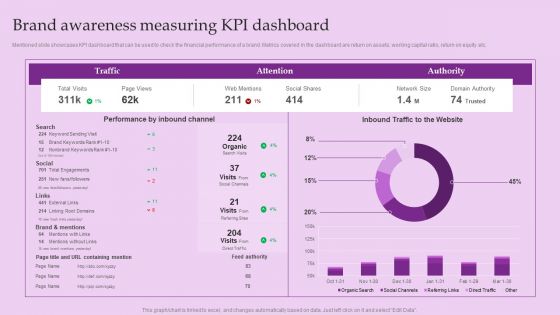
Brand Awareness Measuring Kpi Dashboard Brand And Equity Evaluation Techniques Ideas PDF
Mentioned slide showcases KPI dashboard that can be used to check the financial performance of a brand. Metrics covered in the dashboard are return on assets, working capital ratio, return on equity etc.From laying roadmaps to briefing everything in detail, our templates are perfect for you. You can set the stage with your presentation slides. All you have to do is download these easy-to-edit and customizable templates. Brand Awareness Measuring Kpi Dashboard Brand And Equity Evaluation Techniques Ideas PDF will help you deliver an outstanding performance that everyone would remember and praise you for. Do download this presentation today.
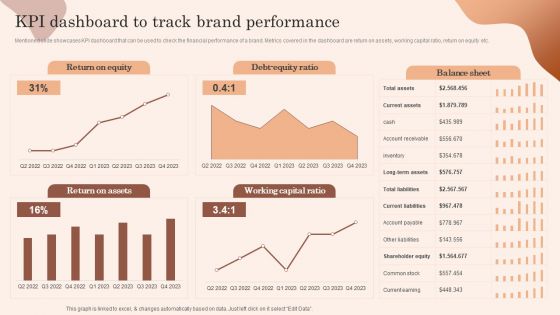
Building Market Brand Leadership Strategies Kpi Dashboard To Track Brand Performance Designs PDF
Mentioned slide showcases KPI dashboard that can be used to check the financial performance of a brand. Metrics covered in the dashboard are return on assets, working capital ratio, return on equity etc. There are so many reasons you need a Building Market Brand Leadership Strategies Kpi Dashboard To Track Brand Performance Designs PDF. The first reason is you cannot spend time making everything from scratch, Thus, Slidegeeks has made presentation templates for you too. You can easily download these templates from our website easily.
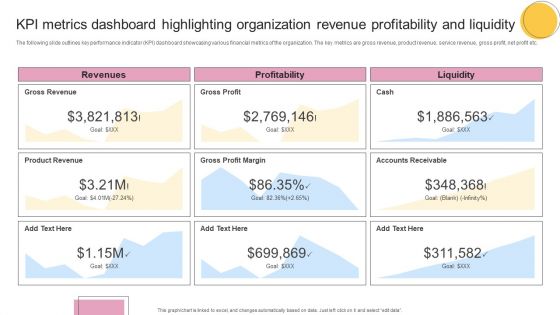
KPI Metrics Dashboard Highlighting Organization Revenue Profitability And Liquidity Formats PDF
The following slide outlines key performance indicator KPI dashboard showcasing various financial metrics of the organization. The key metrics are gross revenue, product revenue, service revenue, gross profit, net profit etc. From laying roadmaps to briefing everything in detail, our templates are perfect for you. You can set the stage with your presentation slides. All you have to do is download these easy to edit and customizable templates. KPI Metrics Dashboard Highlighting Organization Revenue Profitability And Liquidity Formats PDF will help you deliver an outstanding performance that everyone would remember and praise you for. Do download this presentation today.
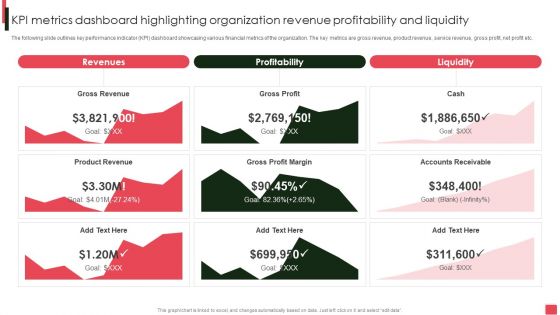
Overview Of Organizational Kpi Metrics Dashboard Highlighting Organization Revenue Brochure PDF
The following slide outlines key performance indicator KPI dashboard showcasing various financial metrics of the organization. The key metrics are gross revenue, product revenue, service revenue, gross profit, net profit etc. If your project calls for a presentation, then Slidegeeks is your go-to partner because we have professionally designed, easy-to-edit templates that are perfect for any presentation. After downloading, you can easily edit Overview Of Organizational Kpi Metrics Dashboard Highlighting Organization Revenue Brochure PDF and make the changes accordingly. You can rearrange slides or fill them with different images. Check out all the handy templates.
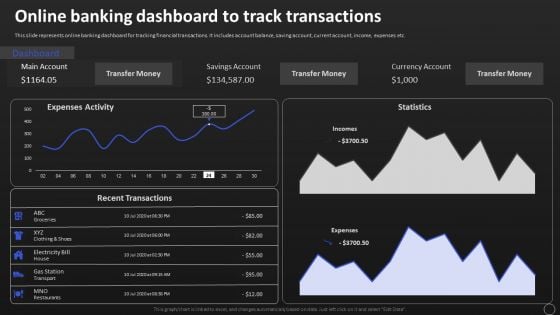
Net Banking Channel And Service Management Online Banking Dashboard To Track Transactions Professional PDF
This slide represents online banking dashboard for tracking financial transactions. It includes account balance, saving account, current account, income, expenses etc. Boost your pitch with our creative Net Banking Channel And Service Management Online Banking Dashboard To Track Transactions Professional PDF. Deliver an awe inspiring pitch that will mesmerize everyone. Using these presentation templates you will surely catch everyones attention. You can browse the ppts collection on our website. We have researchers who are experts at creating the right content for the templates. So you dont have to invest time in any additional work. Just grab the template now and use them.
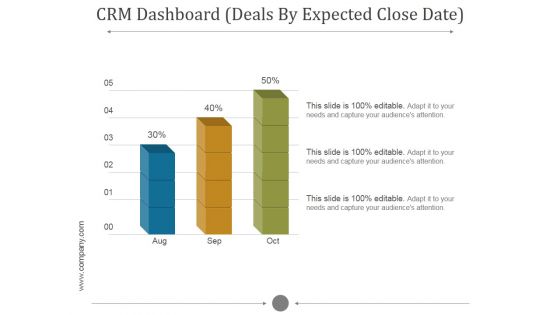
Crm Dashboard Deals By Expected Close Date Ppt PowerPoint Presentation Background Images
This is a crm dashboard deals by expected close date ppt powerpoint presentation background images. This is a five stage process. The stages in this process are bar graph, aug, sep, oct, growth.
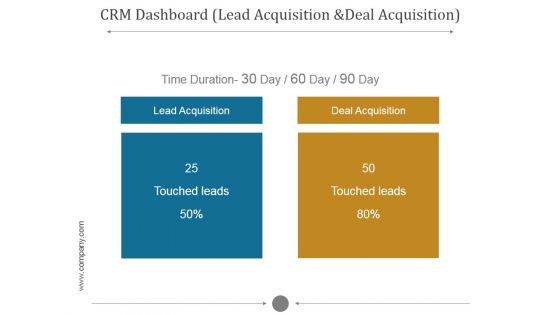
Crm Dashboard Lead Acquisition And Deal Acquisition Ppt PowerPoint Presentation Inspiration
This is a crm dashboard lead acquisition and deal acquisition ppt powerpoint presentation inspiration. This is a five stage process. The stages in this process are touched leads, lead acquisition, deal acquisition, time duration.
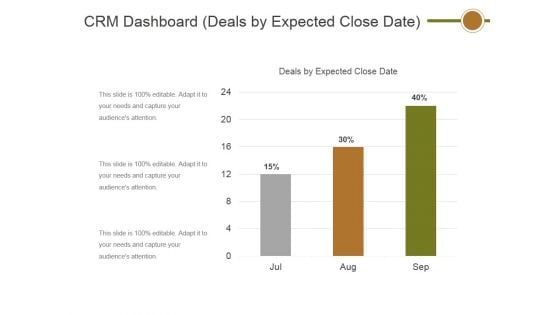
Crm Dashboard Deals By Expected Close Date Ppt PowerPoint Presentation Show Information
This is a crm dashboard deals by expected close date ppt powerpoint presentation show information. This is a three stage process. The stages in this process are deals by expected close date, percentage, business, finance, success.
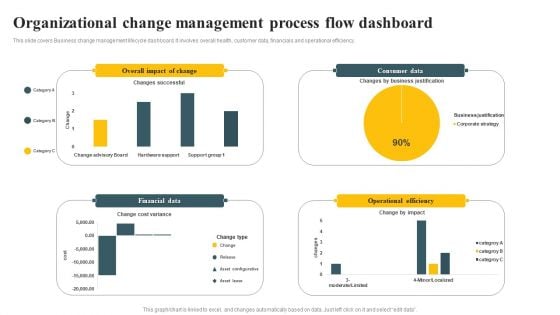
Organizational Change Management Process Flow Dashboard Ppt PowerPoint Presentation Diagram PDF
This slide covers Business change management lifecycle dashboard. It involves overall health, customer data, financials and operational efficiency. Pitch your topic with ease and precision using this Organizational Change Management Process Flow Dashboard Ppt PowerPoint Presentation Diagram PDF. This layout presents information on Financial Data, Operational Efficiency, Consumer Data. It is also available for immediate download and adjustment. So, changes can be made in the color, design, graphics or any other component to create a unique layout.
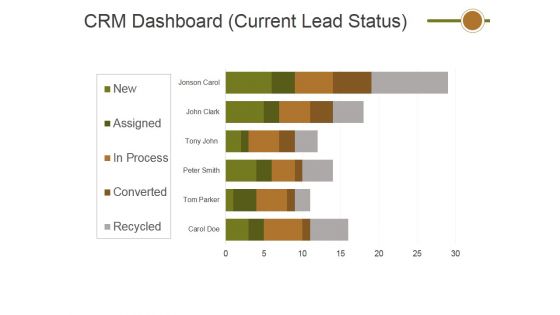
Crm Dashboard Current Lead Status Ppt PowerPoint Presentation Show Slide Portrait
This is a crm dashboard current lead status ppt powerpoint presentation show slide portrait. This is a six stage process. The stages in this process are crm dashboard, current lead status, business, marketing.
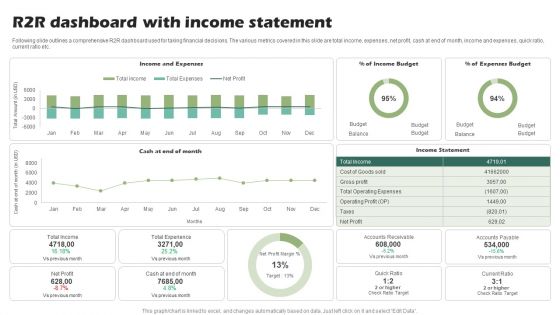
R2R Dashboard With Income Statement Ppt PowerPoint Presentation Show Slide Download PDF
Following slide outlines a comprehensive R2R dashboard used for taking financial decisions. The various metrics covered in this slide are total income, expenses, net profit, cash at end of month, income and expenses, quick ratio, current ratio etc.Showcasing this set of slides titled R2R Dashboard With Income Statement Ppt PowerPoint Presentation Show Slide Download PDF. The topics addressed in these templates are Operating Expenses, Total Experience, Accounts Receivable. All the content presented in this PPT design is completely editable. Download it and make adjustments in color, background, font etc. as per your unique business setting.
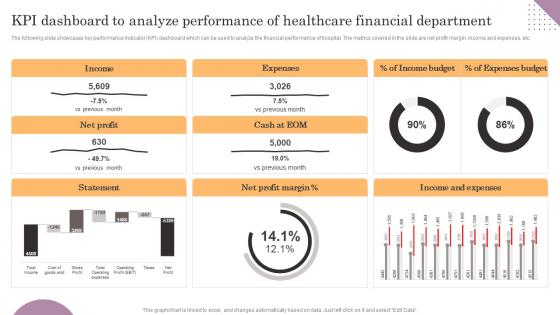
KPI Dashboard To Analyze Performance Of Healthcare General Management Introduction Pdf
The following slide showcases key performance indicator KPI dashboard which can be used to analyze the financial performance of hospital. The metrics covered in the slide are net profit margin, income and expenses, etc. Slidegeeks has constructed KPI Dashboard To Analyze Performance Of Healthcare General Management Introduction Pdf after conducting extensive research and examination. These presentation templates are constantly being generated and modified based on user preferences and critiques from editors. Here, you will find the most attractive templates for a range of purposes while taking into account ratings and remarks from users regarding the content. This is an excellent jumping-off point to explore our content and will give new users an insight into our top-notch PowerPoint Templates. The following slide showcases key performance indicator KPI dashboard which can be used to analyze the financial performance of hospital. The metrics covered in the slide are net profit margin, income and expenses, etc.
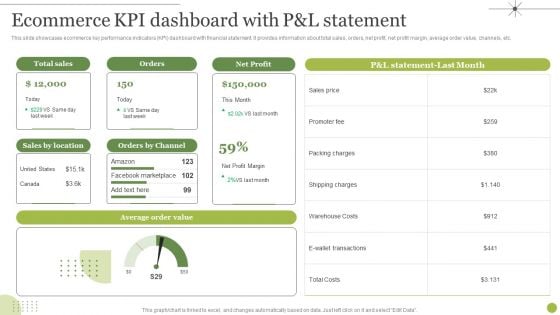
Managing E Commerce Business Accounting Ecommerce KPI Dashboard With P And L Statement Diagrams PDF
This slide showcases ecommerce key performance indicators KPI dashboard with financial statement. It provides information about total sales, orders, net profit, net profit margin, average order value, channels, etc. Present like a pro with Managing E Commerce Business Accounting Ecommerce KPI Dashboard With P And L Statement Diagrams PDF Create beautiful presentations together with your team, using our easy to use presentation slides. Share your ideas in real time and make changes on the fly by downloading our templates. So whether you are in the office, on the go, or in a remote location, you can stay in sync with your team and present your ideas with confidence. With Slidegeeks presentation got a whole lot easier. Grab these presentations today.


 Continue with Email

 Home
Home


