Financial Dashboard
KPI Dashboard For Tracking Business Investment Portfolio Investment Fund PPT Example
Mentioned slide demonstrates the key performance indicator dashboard of the business financial portfolio.It includes key elements such as portfolio value, yield cost ratio, annual dividends, unrealized gains, investment style, investment allocation by sectors, etc. Here you can discover an assortment of the finest PowerPoint and Google Slides templates. With these templates, you can create presentations for a variety of purposes while simultaneously providing your audience with an eye catching visual experience. Download KPI Dashboard For Tracking Business Investment Portfolio Investment Fund PPT Example to deliver an impeccable presentation. These templates will make your job of preparing presentations much quicker, yet still, maintain a high level of quality. Slidegeeks has experienced researchers who prepare these templates and write high quality content for you. Later on, you can personalize the content by editing the KPI Dashboard For Tracking Business Investment Portfolio Investment Fund PPT Example. Mentioned slide demonstrates the key performance indicator dashboard of the business financial portfolio.It includes key elements such as portfolio value, yield cost ratio, annual dividends, unrealized gains, investment style, investment allocation by sectors, etc.
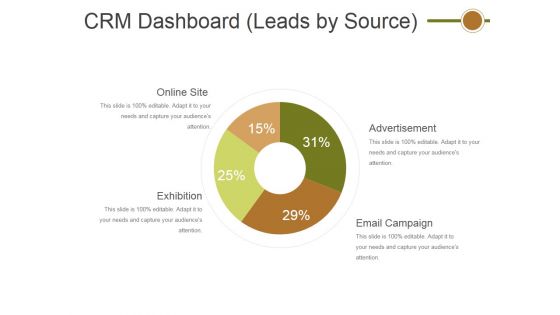
Crm Dashboard Leads By Source Ppt PowerPoint Presentation File Graphics Template
This is a crm dashboard leads by source ppt powerpoint presentation file graphics template. This is a four stage process. The stages in this process are online site, exhibition, advertisement, email campaign.
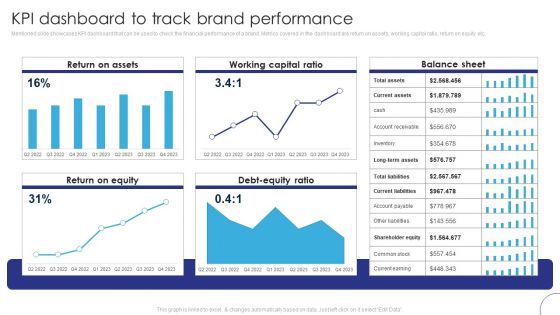
Implementing Brand Leadership Kpi Dashboard To Track Brand Performance Themes PDF
Mentioned slide showcases KPI dashboard that can be used to check the financial performance of a brand. Metrics covered in the dashboard are return on assets, working capital ratio, return on equity etc. This Implementing Brand Leadership Kpi Dashboard To Track Brand Performance Themes PDF is perfect for any presentation, be it in front of clients or colleagues. It is a versatile and stylish solution for organizing your meetings. The Implementing Brand Leadership Kpi Dashboard To Track Brand Performance Themes PDF features a modern design for your presentation meetings. The adjustable and customizable slides provide unlimited possibilities for acing up your presentation. Slidegeeks has done all the homework before launching the product for you. So, dont wait, grab the presentation templates today.
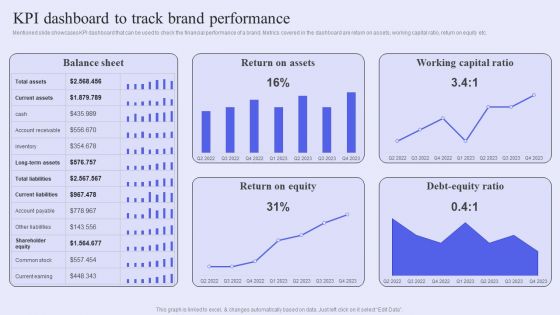
Brand Management Strategy To Increase Awareness KPI Dashboard To Track Brand Performance Slides PDF
Mentioned slide showcases KPI dashboard that can be used to check the financial performance of a brand. Metrics covered in the dashboard are return on assets, working capital ratio, return on equity etc. This Brand Management Strategy To Increase Awareness KPI Dashboard To Track Brand Performance Slides PDF is perfect for any presentation, be it in front of clients or colleagues. It is a versatile and stylish solution for organizing your meetings. The Brand Management Strategy To Increase Awareness KPI Dashboard To Track Brand Performance Slides PDF features a modern design for your presentation meetings. The adjustable and customizable slides provide unlimited possibilities for acing up your presentation. Slidegeeks has done all the homework before launching the product for you. So, dont wait, grab the presentation templates today
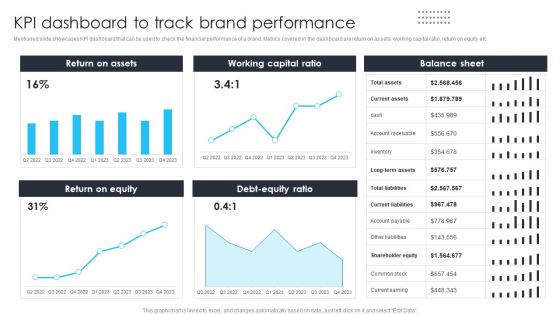
Building Brand Leadership Strategy To Dominate The Market KPI Dashboard To Track Brand Performance Formats PDF
Mentioned slide showcases KPI dashboard that can be used to check the financial performance of a brand. Metrics covered in the dashboard are return on assets, working capital ratio, return on equity etc.This Building Brand Leadership Strategy To Dominate The Market KPI Dashboard To Track Brand Performance Formats PDF is perfect for any presentation, be it in front of clients or colleagues. It is a versatile and stylish solution for organizing your meetings. The Building Brand Leadership Strategy To Dominate The Market KPI Dashboard To Track Brand Performance Formats PDF features a modern design for your presentation meetings. The adjustable and customizable slides provide unlimited possibilities for acing up your presentation. Slidegeeks has done all the homework before launching the product for you. So, dont wait, grab the presentation templates today
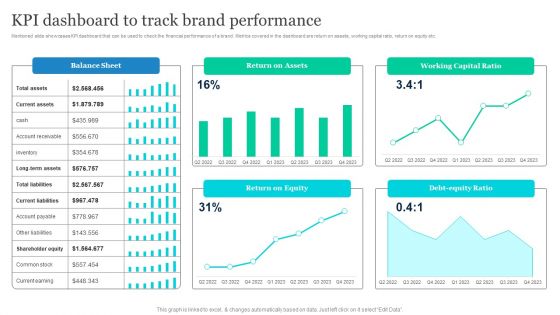
Effective Product Positioning Approach Kpi Dashboard To Track Brand Performance Infographics PDF
Mentioned slide showcases KPI dashboard that can be used to check the financial performance of a brand. Metrics covered in the dashboard are return on assets, working capital ratio, return on equity etc. Slidegeeks is one of the best resources for PowerPoint templates. You can download easily and regulate Effective Product Positioning Approach Kpi Dashboard To Track Brand Performance Infographics PDF for your personal presentations from our wonderful collection. A few clicks is all it takes to discover and get the most relevant and appropriate templates. Use our Templates to add a unique zing and appeal to your presentation and meetings. All the slides are easy to edit and you can use them even for advertisement purposes.
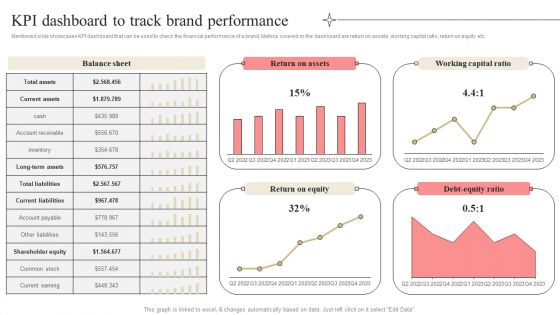
Developing Market Leading Businesses KPI Dashboard To Track Brand Performance Summary PDF
Mentioned slide showcases KPI dashboard that can be used to check the financial performance of a brand. Metrics covered in the dashboard are return on assets, working capital ratio, return on equity etc. Coming up with a presentation necessitates that the majority of the effort goes into the content and the message you intend to convey. The visuals of a PowerPoint presentation can only be effective if it supplements and supports the story that is being told. Keeping this in mind our experts created Developing Market Leading Businesses KPI Dashboard To Track Brand Performance Summary PDF to reduce the time that goes into designing the presentation. This way, you can concentrate on the message while our designers take care of providing you with the right template for the situation.
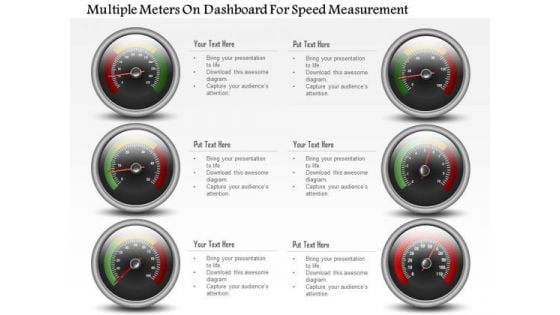
Business Diagram Multiple Meters On Dashboard For Speed Measurement PowerPoint Slide
This business diagram has been designed with multiple meters on dashboard. This slide can be used for business planning and progress. Use this diagram for your business and success milestones related presentations.

Estimating Business Overall Kpi Metrics Dashboard Highlighting Organization Revenue Clipart PDF
The following slide outlines key performance indicator KPI dashboard showcasing various financial metrics of the organization. The key metrics are gross revenue, product revenue, service revenue, gross profit, net profit etc. Formulating a presentation can take up a lot of effort and time, so the content and message should always be the primary focus. The visuals of the PowerPoint can enhance the presenters message, so our Estimating Business Overall Kpi Metrics Dashboard Highlighting Organization Revenue Clipart PDF was created to help save time. Instead of worrying about the design, the presenter can concentrate on the message while our designers work on creating the ideal templates for whatever situation is needed. Slidegeeks has experts for everything from amazing designs to valuable content, we have put everything into Estimating Business Overall Kpi Metrics Dashboard Highlighting Organization Revenue Clipart PDF.
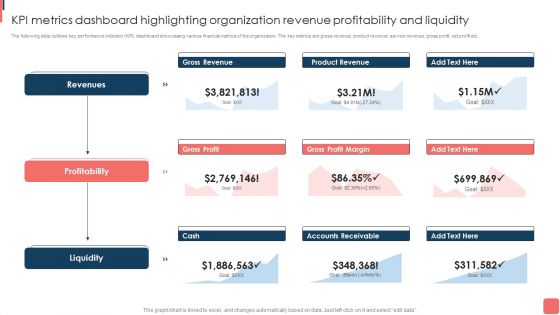
KPI Metrics Dashboard Highlighting Organization Revenue Profitability And Liquidity Template PDF
The following slide outlines key performance indicator KPI dashboard showcasing various financial metrics of the organization. The key metrics are gross revenue, product revenue, service revenue, gross profit, net profit etc. This KPI Metrics Dashboard Highlighting Organization Revenue Profitability And Liquidity Template PDF from Slidegeeks makes it easy to present information on your topic with precision. It provides customization options, so you can make changes to the colors, design, graphics, or any other component to create a unique layout. It is also available for immediate download, so you can begin using it right away. Slidegeeks has done good research to ensure that you have everything you need to make your presentation stand out. Make a name out there for a brilliant performance.

Strategy For Managing Ecommerce Returns Reverse Logistics Dashboard Days Template PDF
Deliver an awe inspiring pitch with this creative strategy for managing ecommerce returns reverse logistics dashboard days template pdf bundle. Topics like global, financial, performance, metric, inventory can be discussed with this completely editable template. It is available for immediate download depending on the needs and requirements of the user.
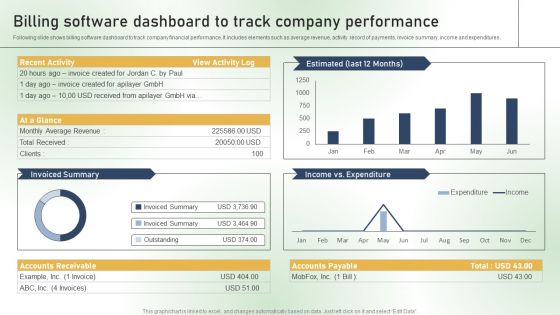
Billing Software Dashboard To Track Company Performance Ppt PowerPoint Presentation File Professional PDF
Following slide shows billing software dashboard to track company financial performance. It includes elements such as average revenue, activity record of payments, invoice summary, income and expenditures. Slidegeeks is here to make your presentations a breeze with Billing Software Dashboard To Track Company Performance Ppt PowerPoint Presentation File Professional PDF With our easy to use and customizable templates, you can focus on delivering your ideas rather than worrying about formatting. With a variety of designs to choose from, you are sure to find one that suits your needs. And with animations and unique photos, illustrations, and fonts, you can make your presentation pop. So whether you are giving a sales pitch or presenting to the board, make sure to check out Slidegeeks first.
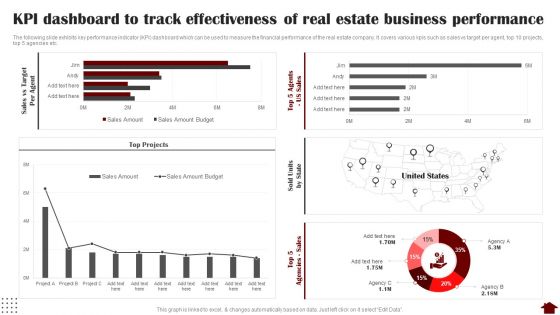
KPI Dashboard To Track Effectiveness Of Real Estate Business Performance Slides PDF
The following slide exhibits key performance indicator KPI dashboard which can be used to measure the financial performance of the real estate company. It covers various kpis such as sales vs target per agent, top 10 projects, top 5 agencies etc. Deliver an awe inspiring pitch with this creative KPI Dashboard To Track Effectiveness Of Real Estate Business Performance Slides PDF bundle. Topics like KPI Dashboard, Track Effectiveness, Real Estate Business Performance can be discussed with this completely editable template. It is available for immediate download depending on the needs and requirements of the user.
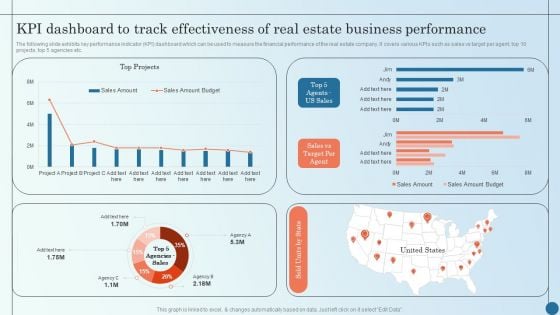
KPI Dashboard To Track Effectiveness Of Real Estate Business Managing Commercial Property Risks Demonstration PDF
The following slide exhibits key performance indicator KPI dashboard which can be used to measure the financial performance of the real estate company. It covers various KPIs such as sales vs target per agent, top 10 projects, top 5 agencies etc.Deliver an awe inspiring pitch with this creative KPI Dashboard To Track Effectiveness Of Real Estate Business Managing Commercial Property Risks Demonstration PDF bundle. Topics like Kpi Dashboard, Track Effectiveness, Estate Business can be discussed with this completely editable template. It is available for immediate download depending on the needs and requirements of the user.
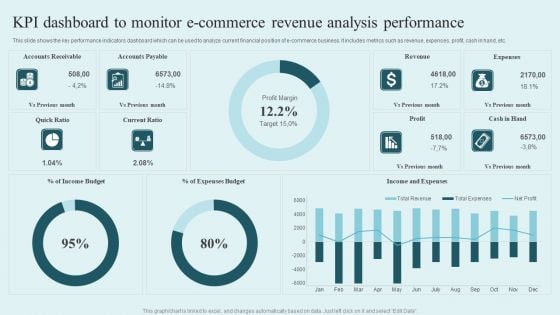
KPI Dashboard To Monitor E Commerce Revenue Analysis Performance Mockup PDF
This slide shows the key performance indicators dashboard which can be used to analyze current financial position of e-commerce business. It includes metrics such as revenue, expenses, profit, cash in hand, etc. Showcasing this set of slides titled KPI Dashboard To Monitor E Commerce Revenue Analysis Performance Mockup PDF. The topics addressed in these templates are Accounts Receivable, Accounts Payable, Revenue, Expenses. All the content presented in this PPT design is completely editable. Download it and make adjustments in color, background, font etc. as per your unique business setting.
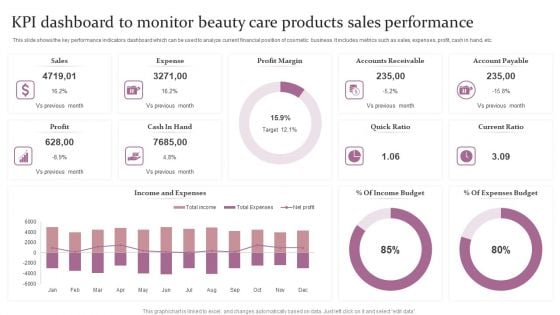
KPI Dashboard To Monitor Beauty Care Products Sales Performance Ppt Outline Example Topics PDF
This slide shows the key performance indicators dashboard which can be used to analyze current financial position of cosmetic business. It includes metrics such as sales, expenses, profit, cash in hand, etc. Showcasing this set of slides titled KPI Dashboard To Monitor Beauty Care Products Sales Performance Ppt Outline Example Topics PDF. The topics addressed in these templates are Accounts Receivable, Profit Margin, Expense. All the content presented in this PPT design is completely editable. Download it and make adjustments in color, background, font etc. as per your unique business setting.
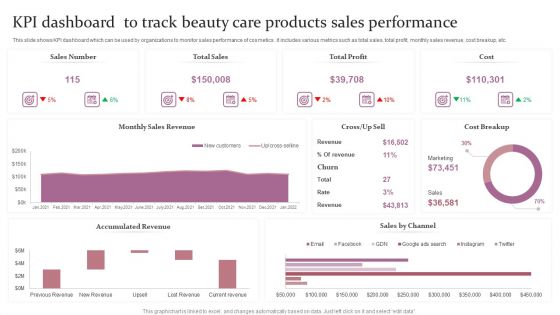
KPI Dashboard To Track Beauty Care Products Sales Performance Ppt Outline Pictures PDF
This slide shows the key performance indicators dashboard which can be used to analyze current financial position of cosmetic business. It includes metrics such as sales, expenses, profit, cash in hand, etc. Showcasing this set of slides titled KPI Dashboard To Track Beauty Care Products Sales Performance Ppt Outline Pictures PDF. The topics addressed in these templates are Sales Number, Total Sales, Total Profit, Cost. All the content presented in this PPT design is completely editable. Download it and make adjustments in color, background, font etc. as per your unique business setting.
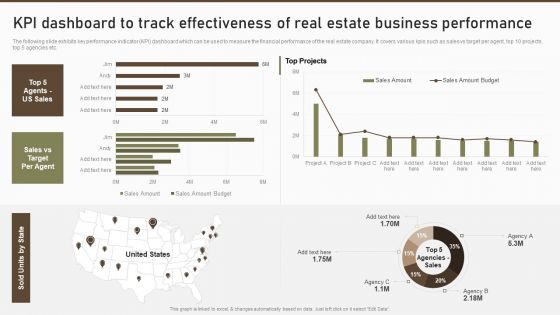
KPI Dashboard To Track Effectiveness Of Real Estate Business Performance Guidelines PDF
The following slide exhibits key performance indicator KPI dashboard which can be used to measure the financial performance of the real estate company. It covers various kpis such as sales vs target per agent, top 10 projects, top 5 agencies etc.Deliver an awe inspiring pitch with this creative KPI Dashboard To Track Effectiveness Of Real Estate Business Performance Guidelines PDF bundle. Topics like Top Projects, Sales Amount, Sales Amount can be discussed with this completely editable template. It is available for immediate download depending on the needs and requirements of the user.
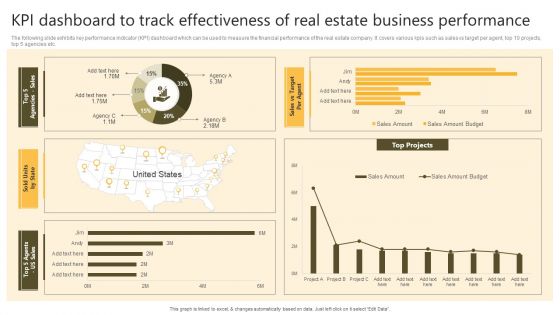
Successful Risk Administration KPI Dashboard To Track Effectiveness Of Real Estate Business Template PDF
The following slide exhibits key performance indicator KPI dashboard which can be used to measure the financial performance of the real estate company. It covers various kpis such as sales vs target per agent, top 10 projects, top 5 agencies etc. If your project calls for a presentation, then Slidegeeks is your go-to partner because we have professionally designed, easy-to-edit templates that are perfect for any presentation. After downloading, you can easily edit Successful Risk Administration KPI Dashboard To Track Effectiveness Of Real Estate Business Template PDF and make the changes accordingly. You can rearrange slides or fill them with different images. Check out all the handy templates.
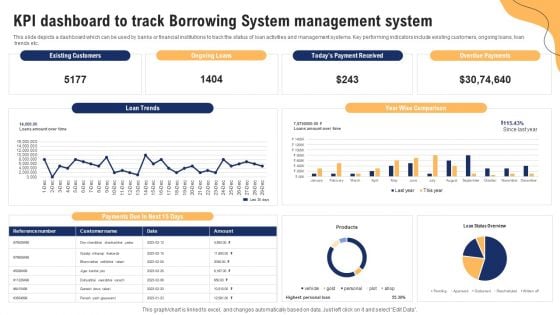
KPI Dashboard To Track Borrowing System Management System Ppt Visual Aids Portfolio PDF
CIO For IT Cost Optimization Techniques Determine IT Project Portfolio Management Tracking Dashboard Ideas PDF
This slide provides information regarding IT project portfolio management tracking dashboard including details about allocated budget across portfolios, used budget percentage, estimated vs. actual cost, etc. Deliver an awe inspiring pitch with this creative CIO For IT Cost Optimization Techniques Determine IT Project Portfolio Management Tracking Dashboard Ideas PDF bundle. Topics like Financials, Budget Across Portfolios, Strategic Intiatives can be discussed with this completely editable template. It is available for immediate download depending on the needs and requirements of the user.
Analytics Dashboard Tracking Effective Digital Transformation Journey PPT Presentation DT SS V
This slide represents an analytics dashboard for effective energy monitoring and management. It tracks KPIs such as energy production, solar energy production, savings, energy produced, carbon savings, and financial savings. Get a simple yet stunning designed Analytics Dashboard Tracking Effective Digital Transformation Journey PPT Presentation DT SS V. It is the best one to establish the tone in your meetings. It is an excellent way to make your presentations highly effective. So, download this PPT today from Slidegeeks and see the positive impacts. Our easy-to-edit Analytics Dashboard Tracking Effective Digital Transformation Journey PPT Presentation DT SS V can be your go-to option for all upcoming conferences and meetings. So, what are you waiting for Grab this template today. This slide represents an analytics dashboard for effective energy monitoring and management. It tracks KPIs such as energy production, solar energy production, savings, energy produced, carbon savings, and financial savings.

Data Quality Dashboard For Linked Data Integrating Linked Data To Enhance Operational Template PDF
This slide describes the data quality dashboard for linked data by covering details of account information quality, contact details quality, financial data quality, and missing account information.This Data Quality Dashboard For Linked Data Integrating Linked Data To Enhance Operational Template PDF from Slidegeeks makes it easy to present information on your topic with precision. It provides customization options, so you can make changes to the colors, design, graphics, or any other component to create a unique layout. It is also available for immediate download, so you can begin using it right away. Slidegeeks has done good research to ensure that you have everything you need to make your presentation stand out. Make a name out there for a brilliant performance.
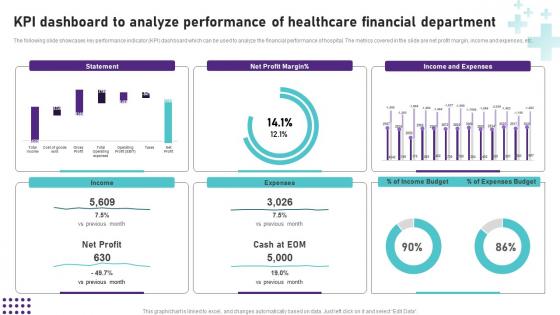
KPI Dashboard To Analyze Performance Of Healthcare Operational Areas Healthcare Clipart PDF
Are you searching for a KPI Dashboard To Analyze Performance Of Healthcare Operational Areas Healthcare Clipart PDF that is uncluttered, straightforward, and original Its easy to edit, and you can change the colors to suit your personal or business branding. For a presentation that expresses how much effort you have put in, this template is ideal With all of its features, including tables, diagrams, statistics, and lists, its perfect for a business plan presentation. Make your ideas more appealing with these professional slides. Download Kpi Dashboard To Analyze Performance Of Healthcare Operational Areas Healthcare Clipart PDF from Slidegeeks today. The following slide showcases key performance indicator KPI dashboard which can be used to analyze the financial performance of hospital. The metrics covered in the slide are net profit margin, income and expenses, etc.
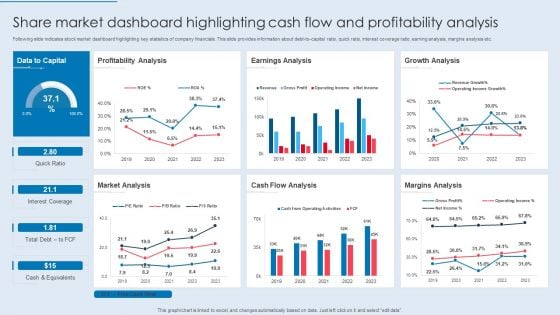
Share Market Dashboard Highlighting Cash Flow And Profitability Analysis Information PDF
Following slide indicates stock market dashboard highlighting key statistics of company financials. This slide provides information about debt-to-capital ratio, quick ratio, interest coverage ratio, earning analysis, margins analysis etc. Showcasing this set of slides titled Share Market Dashboard Highlighting Cash Flow And Profitability Analysis Information PDF. The topics addressed in these templates are Profitability Analysis, Earnings Analysis, Growth Analysis. All the content presented in this PPT design is completely editable. Download it and make adjustments in color, background, font etc. as per your unique business setting.
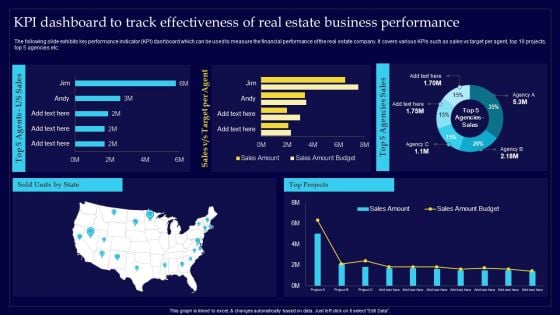
Executing Risk Mitigation KPI Dashboard To Track Effectiveness Of Real Estate Rules PDF
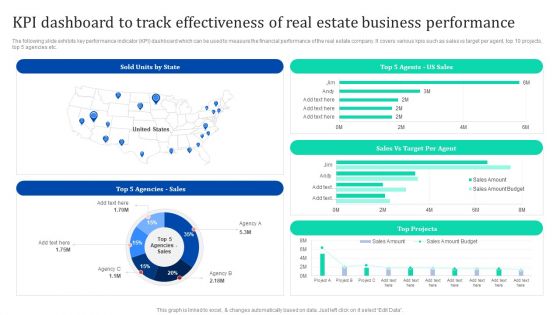
KPI Dashboard To Track Effectiveness Of Real Estate Business Enhancing Process Improvement By Regularly Themes PDF
The following slide exhibits key performance indicator KPI dashboard which can be used to measure the financial performance of the real estate company. It covers various kpis such as sales vs target per agent, top 10 projects, top 5 agencies etc. Welcome to our selection of the KPI Dashboard To Track Effectiveness Of Real Estate Business Enhancing Process Improvement By Regularly Themes PDF. These are designed to help you showcase your creativity and bring your sphere to life. Planning and Innovation are essential for any business that is just starting out. This collection contains the designs that you need for your everyday presentations. All of our PowerPoints are 100 parcent editable, so you can customize them to suit your needs. This multi-purpose template can be used in various situations. Grab these presentation templates today.
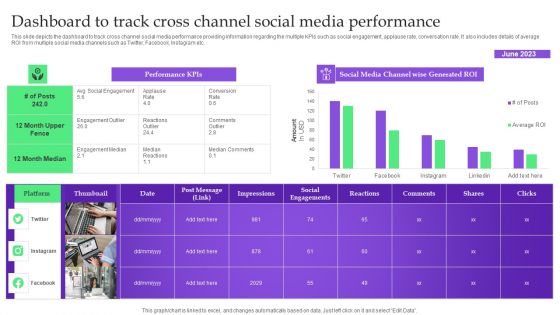
Analysis Plan For E Commerce Promotion Tactics Dashboard To Track Cross Channel Social Media Performance Demonstration PDF
This slide depicts the dashboard to track cross channel social media performance providing information regarding the multiple KPIs such as social engagement, applause rate, conversation rate. It also includes details of average ROI from multiple social media channels such as Twitter, Facebook, Instagram etc. This Analysis Plan For E Commerce Promotion Tactics Dashboard To Track Cross Channel Social Media Performance Demonstration PDF is perfect for any presentation, be it in front of clients or colleagues. It is a versatile and stylish solution for organizing your meetings. The Analysis Plan For E Commerce Promotion Tactics Dashboard To Track Cross Channel Social Media Performance Demonstration PDF features a modern design for your presentation meetings. The adjustable and customizable slides provide unlimited possibilities for acing up your presentation. Slidegeeks has done all the homework before launching the product for you. So, do not wait, grab the presentation templates today.
Analysis Plan For E Commerce Promotion Tactics Content Performance Tracking Dashboard For Social Media Channels Icons PDF
This slide indicates the content performance tracking dashboard for social media channels providing information regarding the total number of posts, engagement rate, audience sentiments and multiple hashtags performance. Formulating a presentation can take up a lot of effort and time, so the content and message should always be the primary focus. The visuals of the PowerPoint can enhance the presenters message, so our Analysis Plan For E Commerce Promotion Tactics Content Performance Tracking Dashboard For Social Media Channels Icons PDF was created to help save time. Instead of worrying about the design, the presenter can concentrate on the message while our designers work on creating the ideal templates for whatever situation is needed. Slidegeeks has experts for everything from amazing designs to valuable content, we have put everything into Analysis Plan For E Commerce Promotion Tactics Content Performance Tracking Dashboard For Social Media Channels Icons PDF
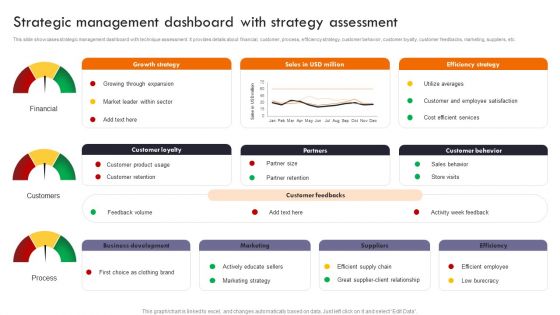
Gaining Competitive Edge Strategic Management Dashboard With Strategy Assessment Sample PDF
This slide showcases strategic management dashboard with technique assessment. It provides details about financial, customer, process, efficiency strategy, customer behavior, customer loyalty, customer feedbacks, marketing, suppliers, etc. The Gaining Competitive Edge Strategic Management Dashboard With Strategy Assessment Sample PDF is a compilation of the most recent design trends as a series of slides. It is suitable for any subject or industry presentation, containing attractive visuals and photo spots for businesses to clearly express their messages. This template contains a variety of slides for the user to input data, such as structures to contrast two elements, bullet points, and slides for written information. Slidegeeks is prepared to create an impression.
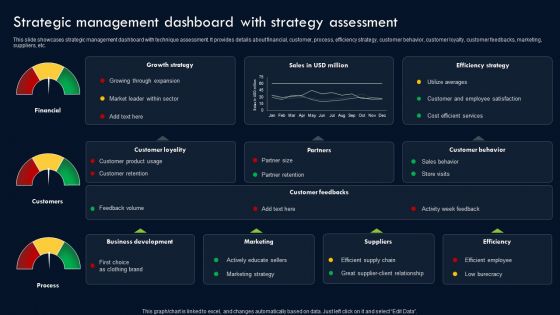
Transforming Sustainability Into Competitive Strategic Management Dashboard With Strategy Assessment Summary PDF
This slide showcases strategic management dashboard with technique assessment. It provides details about financial, customer, process, efficiency strategy, customer behavior, customer loyalty, customer feedbacks, marketing, suppliers, etc. From laying roadmaps to briefing everything in detail, our templates are perfect for you. You can set the stage with your presentation slides. All you have to do is download these easy-to-edit and customizable templates. Transforming Sustainability Into Competitive Strategic Management Dashboard With Strategy Assessment Summary PDF will help you deliver an outstanding performance that everyone would remember and praise you for. Do download this presentation today.
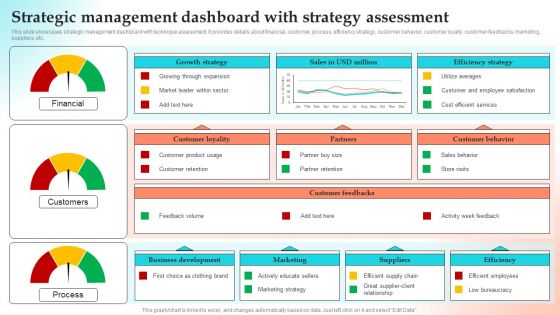
Implementing Strategies To Gain Competitive Advantage Strategic Management Dashboard With Strategy Assessment Inspiration PDF
This slide showcases strategic management dashboard with technique assessment. It provides details about financial, customer, process, efficiency strategy, customer behavior, customer loyalty, customer feedbacks, marketing, suppliers, etc. From laying roadmaps to briefing everything in detail, our templates are perfect for you. You can set the stage with your presentation slides. All you have to do is download these easy to edit and customizable templates. Implementing Strategies To Gain Competitive Advantage Strategic Management Dashboard With Strategy Assessment Inspiration PDF will help you deliver an outstanding performance that everyone would remember and praise you for. Do download this presentation today.
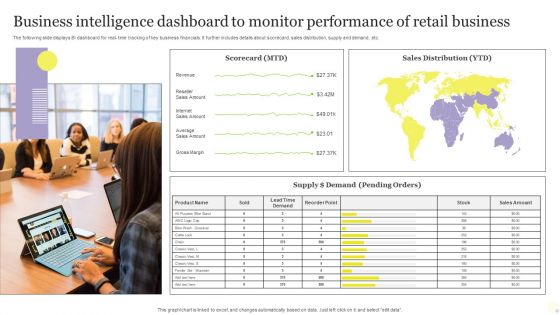
Business Intelligence Dashboard To Monitor Performance Of Retail Business Infographics PDF
The following slide displays BI dashboard for real time tracking of key business financials. It further includes details about scorecard, sales distribution, supply and demand, etc. Pitch your topic with ease and precision using this Business Intelligence Dashboard To Monitor Performance Of Retail Business Infographics PDF. This layout presents information on Business Intelligence Dashboard, Monitor Performance, Retail Business. It is also available for immediate download and adjustment. So, changes can be made in the color, design, graphics or any other component to create a unique layout.
Monthly Project Progress Report Dashboard With Execution Timeline Ppt Icon Graphics Tutorials PDF
This slide showcases monthly project status dashboard with execution timeline. It provides information about sponsor, financials, budget, key risks and issues, work stream , etc. Presenting Monthly Project Progress Report Dashboard With Execution Timeline Ppt Icon Graphics Tutorials PDF to dispense important information. This template comprises one stages. It also presents valuable insights into the topics including Execution Timeline, Project Status, Project Manager. This is a completely customizable PowerPoint theme that can be put to use immediately. So, download it and address the topic impactfully.
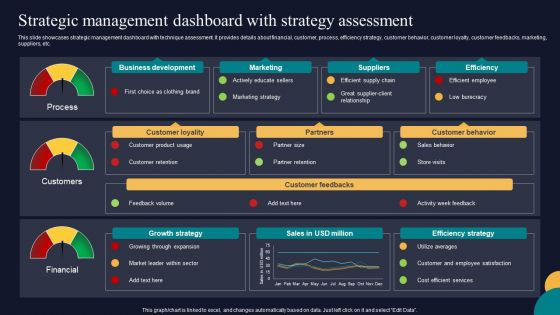
Strategic Management Dashboard With Strategy Assessment Tactics To Gain Sustainable Competitive Edge Pictures PDF
This slide showcases strategic management dashboard with technique assessment. It provides details about financial, customer, process, efficiency strategy, customer behavior, customer loyalty, customer feedbacks, marketing, suppliers, etc. Formulating a presentation can take up a lot of effort and time, so the content and message should always be the primary focus. The visuals of the PowerPoint can enhance the presenters message, so our Strategic Management Dashboard With Strategy Assessment Tactics To Gain Sustainable Competitive Edge Pictures PDF was created to help save time. Instead of worrying about the design, the presenter can concentrate on the message while our designers work on creating the ideal templates for whatever situation is needed. Slidegeeks has experts for everything from amazing designs to valuable content, we have put everything into Strategic Management Dashboard With Strategy Assessment Tactics To Gain Sustainable Competitive Edge Pictures PDF.
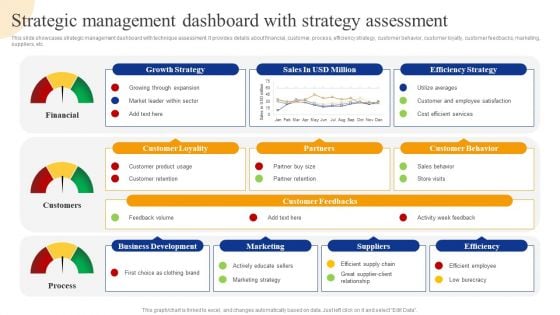
Strategic Management Dashboard With Strategy Assessment Strategic Management For Competitive Portrait PDF
This slide showcases strategic management dashboard with technique assessment. It provides details about financial, customer, process, efficiency strategy, customer behavior, customer loyalty, customer feedbacks, marketing, suppliers, etc. Do you know about Slidesgeeks Strategic Management Dashboard With Strategy Assessment Strategic Management For Competitive Portrait PDF These are perfect for delivering any kind od presentation. Using it, create PowerPoint presentations that communicate your ideas and engage audiences. Save time and effort by using our pre-designed presentation templates that are perfect for a wide range of topic. Our vast selection of designs covers a range of styles, from creative to business, and are all highly customizable and easy to edit. Download as a PowerPoint template or use them as Google Slides themes.
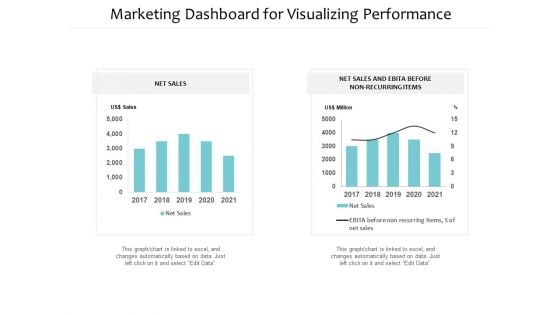
Marketing Dashboard For Visualizing Performance Ppt PowerPoint Presentation Summary Slide Download
Presenting this set of slides with name marketing dashboard for visualizing performance ppt powerpoint presentation summary slide download. The topics discussed in these slides are financial targets, financial goals, growth profitability. This is a completely editable PowerPoint presentation and is available for immediate download. Download now and impress your audience.
Kpi Dashboard Best Practices For Project Management Ppt Powerpoint Presentation Outline Samples
This is a kpi dashboard best practices for project management ppt powerpoint presentation outline samples. This is a three stage process. The stages in this process are business metrics, business kpi, business dashboard.

Key Performance Indicator Analytics Dashboard Ppt PowerPoint Presentation Model Example Topics
This is a key performance indicator analytics dashboard ppt powerpoint presentation model example topics. This is a five stage process. The stages in this process are kpi proposal, kpi plan, kpi scheme.

Car Dashboard And Speedometer Graphics Ppt PowerPoint Presentation File Graphics Template
This is a car dashboard and speedometer graphics ppt powerpoint presentation file graphics template. This is a four stage process. The stages in this process are fuel gauge, gas gauge, fuel containers.
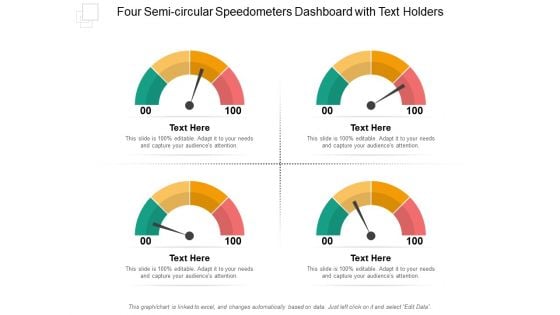
Four Semi Circular Speedometers Dashboard With Text Holders Ppt PowerPoint Presentation File Layouts
This is a four semi circular speedometers dashboard with text holders ppt powerpoint presentation file layouts. This is a four stage process. The stages in this process are fuel gauge, gas gauge, fuel containers.
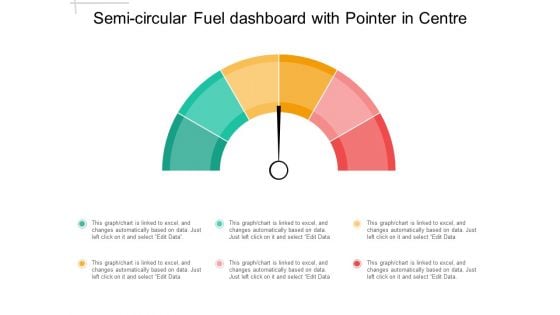
Semi Circular Fuel Dashboard With Pointer In Centre Ppt PowerPoint Presentation Outline Visuals
This is a semi circular fuel dashboard with pointer in centre ppt powerpoint presentation outline visuals. This is a three stage process. The stages in this process are fuel gauge, gas gauge, fuel containers.

Three Dashboard Speed Indicators With Text Holders Ppt PowerPoint Presentation Summary Layout
This is a three dashboard speed indicators with text holders ppt powerpoint presentation summary layout. This is a three stage process. The stages in this process are fuel gauge, gas gauge, fuel containers.
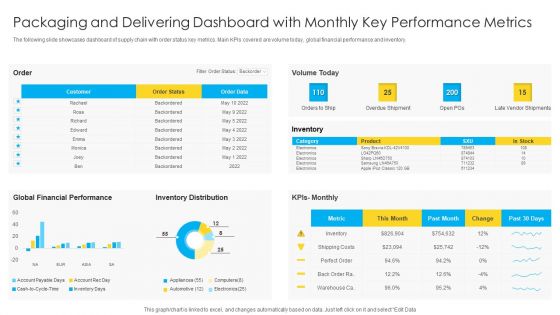
Packaging And Delivering Dashboard With Monthly Key Performance Metrics Microsoft PDF
The following slide showcases dashboard of supply chain with order status key metrics. Main KPIs covered are volume today, global financial performance and inventory. Pitch your topic with ease and precision using this Packaging And Delivering Dashboard With Monthly Key Performance Metrics Microsoft PDF. This layout presents information on Customer, Global Financial Performance, Inventory Distribution. It is also available for immediate download and adjustment. So, changes can be made in the color, design, graphics or any other component to create a unique layout.
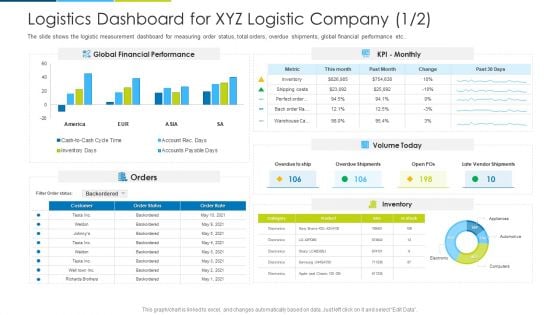
Logistics Dashboard For XYZ Logistic Company Orders Ppt Infographic Template Diagrams PDF
The slide shows the logistic measurement dashboard for measuring order status, total orders, overdue shipments, global financial performance etc. Deliver and pitch your topic in the best possible manner with this logistics dashboard for xyz logistic company orders ppt infographic template diagrams pdf. Use them to share invaluable insights on global financial performance, orders, inventory and impress your audience. This template can be altered and modified as per your expectations. So, grab it now.
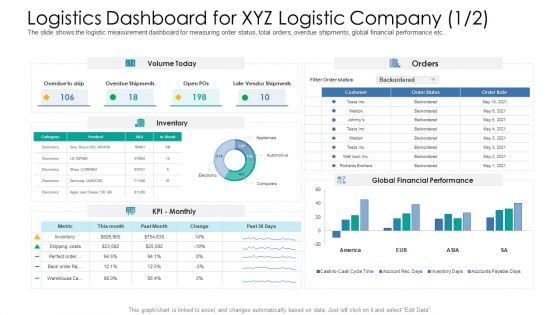
Logistics Dashboard For XYZ Logistic Company Inventory Ppt Infographic Template Background PDF
The slide shows the logistic measurement dashboard for measuring order status, total orders, overdue shipments, global financial performance etc.Deliver and pitch your topic in the best possible manner with this logistics dashboard for XYZ logistic company inventory ppt infographic template background pdf. Use them to share invaluable insights on global financial performance, orders, volume today and impress your audience. This template can be altered and modified as per your expectations. So, grab it now.
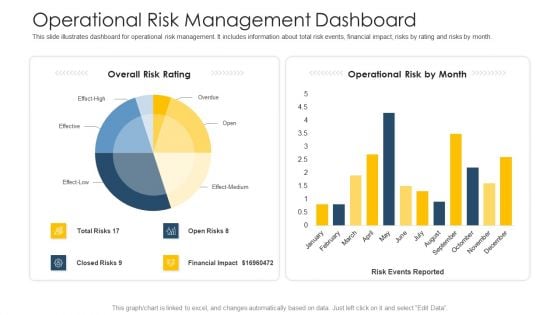
Establishing Operational Risk Framework Banking Operational Risk Management Dashboard Slides PDF
This slide illustrates dashboard for operational risk management. It includes information about total risk events, financial impact, risks by rating and risks by month. Deliver and pitch your topic in the best possible manner with this establishing operational risk framework banking operational risk management dashboard slides pdf. Use them to share invaluable insights on financial impact, operational risk, overall risk rating and impress your audience. This template can be altered and modified as per your expectations. So, grab it now.
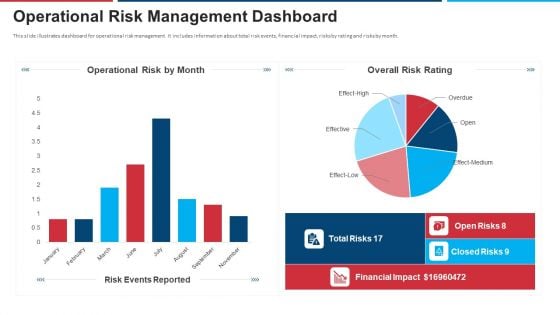
Mitigation Strategies For Operational Threat Operational Risk Management Dashboard Ppt Layouts Example PDF
This slide illustrates dashboard for operational risk management. It includes information about total risk events, financial impact, risks by rating and risks by month. Deliver and pitch your topic in the best possible manner with this mitigation strategies for operational threat operational risk management dashboard ppt layouts example pdf. Use them to share invaluable insights on financial, effective, operational risk, overall risk rating and impress your audience. This template can be altered and modified as per your expectations. So, grab it now.

Market Entry Strategy Clubs Industry Analytics Dashboard For Gym Health And Fitness Clubs Summary PDF
This slide covers the Key performance indicators for analysing social media platforms, email campaigns and website performance. Presenting market entry strategy clubs industry analytics dashboard for gym health and fitness clubs summary pdf to provide visual cues and insights. Share and navigate important information on seven stages that need your due attention. This template can be used to pitch topics like Analytics Dashboard for Gym Health and Fitness Clubs. In addtion, this PPT design contains high-resolution images, graphics, etc, that are easily editable and available for immediate download.
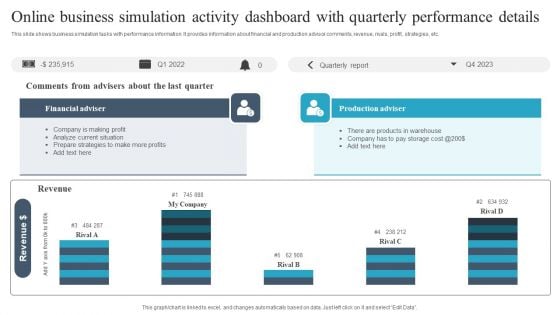
Online Business Simulation Activity Dashboard With Quarterly Performance Details Guidelines PDF
This slide shows business simulation tasks with performance information. It provides information about financial and production advisor comments, revenue, rivals, profit, strategies, etc. Pitch your topic with ease and precision using this Online Business Simulation Activity Dashboard With Quarterly Performance Details Guidelines PDF. This layout presents information on Financial Adviser, Production Adviser, Revenue. It is also available for immediate download and adjustment. So, changes can be made in the color, design, graphics or any other component to create a unique layout.
Marketing Qualified Leads MQL Performance Measurement Dashboard Ppt Icon Examples PDF
This slide shows dashboard for tracking performance of generated marketing qualified leads. It shows details related to audience, prospects and also shows details related to financial KPIs. Persuade your audience using this Marketing Qualified Leads MQL Performance Measurement Dashboard Ppt Icon Examples PDF. This PPT design covers one stages, thus making it a great tool to use. It also caters to a variety of topics including Audience, Closing Percentage, Per Lead Category, Financial KPIs. Download this PPT design now to present a convincing pitch that not only emphasizes the topic but also showcases your presentation skills.
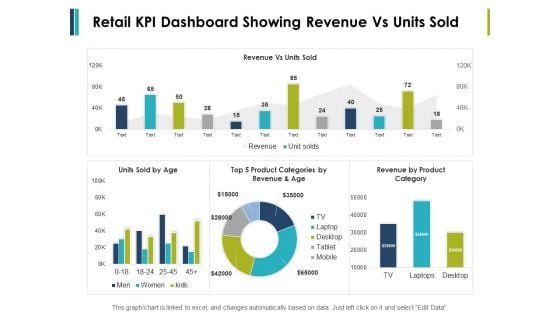
Retail Kpi Dashboard Showing Revenue Vs Units Sold Ppt PowerPoint Presentation File Formats
This is a retail kpi dashboard showing revenue vs units sold ppt powerpoint presentation file formats. This is a three stage process. The stages in this process are finance, marketing, management, investment, analysis.
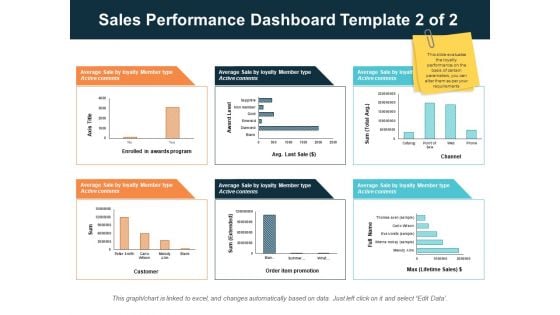
Sales Performance Dashboard Template 2 Of 2 Ppt PowerPoint Presentation Infographics Design Inspiration
This is a sales performance dashboard template 2 of 2 ppt powerpoint presentation infographics design inspiration. This is a three stage process. The stages in this process are finance, management, strategy, analysis, marketing.
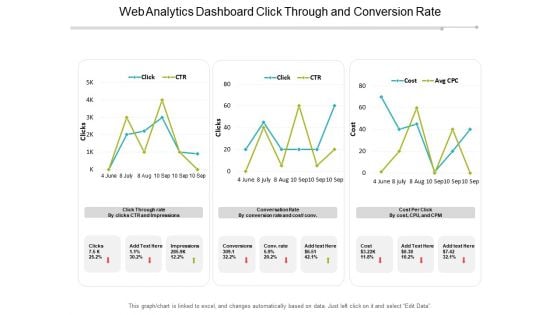
Web Analytics Dashboard Click Through And Conversion Rate Ppt PowerPoint Presentation Professional
This is a web analytics dashboard click through and conversion rate ppt powerpoint presentation professional. This is a three stage process. The stages in this process are marketing analytics, marketing performance, marketing discovery.
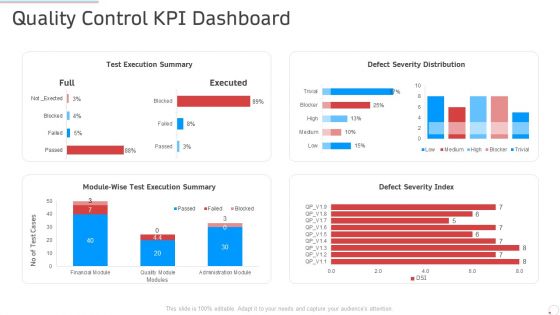
Quality Control Kpi Dashboard Manufacturing Control Ppt Infographics Master Slide PDF
Deliver an awe inspiring pitch with this creative quality control kpi dashboard manufacturing control ppt infographics master slide pdf bundle. Topics like execution, severity, financial can be discussed with this completely editable template. It is available for immediate download depending on the needs and requirements of the user.
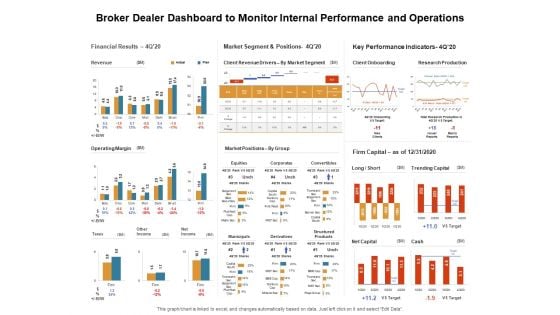
Venture Capitalist Control Board Broker Dealer Dashboard To Monitor Internal Performance And Operations Information PDF
Presenting this set of slides with name venture capitalist control board broker dealer dashboard to monitor internal performance and operations information pdf. The topics discussed in these slides are financial results, market segment and positions, key performance indicators. This is a completely editable PowerPoint presentation and is available for immediate download. Download now and impress your audience.
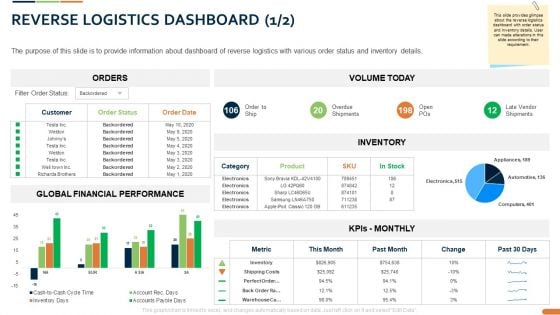
Closed Loop Supply Chain Management Reverse Logistics Dashboard Inventory Ppt Tips PDF
Presenting this set of slides with name closed loop supply chain management reverse logistics dashboard inventory ppt tips pdf. The topics discussed in these slides are customer, order status, order date, product, financial performance. This is a completely editable PowerPoint presentation and is available for immediate download. Download now and impress your audience.
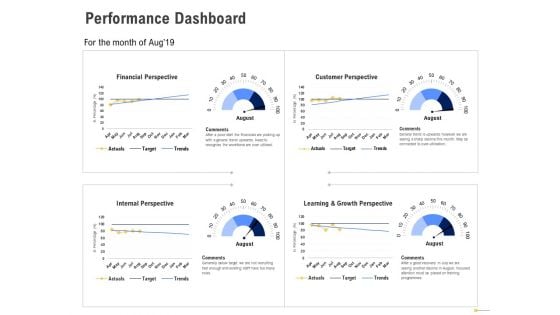
Using Balanced Scorecard Strategy Maps Drive Performance Dashboard Ppt Styles Themes PDF
Presenting this set of slides with name using balanced scorecard strategy maps drive performance dashboard ppt styles themes pdf. The topics discussed in these slides are financial perspective, customer perspective, internal perspective, learning and growth perspective. This is a completely editable PowerPoint presentation and is available for immediate download. Download now and impress your audience.
All About HRM Human Resources KPI Dashboard Sales Ppt Icon Deck PDF
Presenting this set of slides with name all about hrm human resources kpi dashboard sales ppt icon deck pdf. The topics discussed in these slides are manufacturing department, sales department, engineering department, financial department. This is a completely editable PowerPoint presentation and is available for immediate download. Download now and impress your audience.
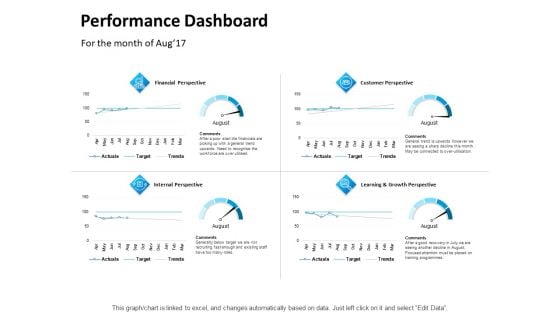
Balanced Scorecard Outline Performance Dashboard Ppt PowerPoint Presentation Outline Slides PDF
Presenting this set of slides with name balanced scorecard outline performance dashboard ppt powerpoint presentation outline slides pdf. The topics discussed in these slides are financial perspective, customer perspective, internal perspective, learning and growth perspective, actual, target, trade. This is a completely editable PowerPoint presentation and is available for immediate download. Download now and impress your audience.


 Continue with Email

 Home
Home


