Financial Kpis
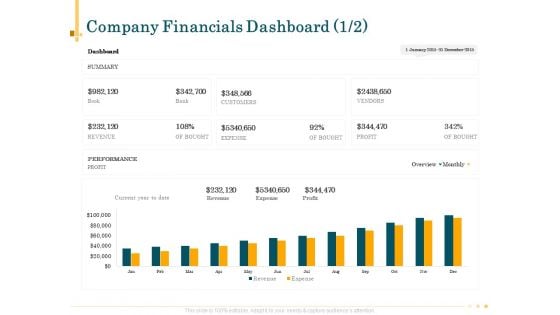
Outsource Bookkeeping Service Manage Financial Transactions Company Financials Dashboard Profit Information PDF
Presenting this set of slides with name outsource bookkeeping service manage financial transactions company financials dashboard profit information pdf. The topics discussed in these slide is company financials dashboard. This is a completely editable PowerPoint presentation and is available for immediate download. Download now and impress your audience.
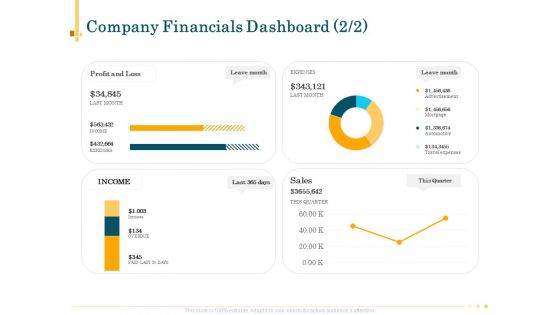
Outsource Bookkeeping Service Manage Financial Transactions Company Financials Dashboard Topics PDF
Presenting this set of slides with name outsource bookkeeping service manage financial transactions company financials dashboard topics pdf. The topics discussed in these slides are performance, revenue, expense, profit. This is a completely editable PowerPoint presentation and is available for immediate download. Download now and impress your audience.
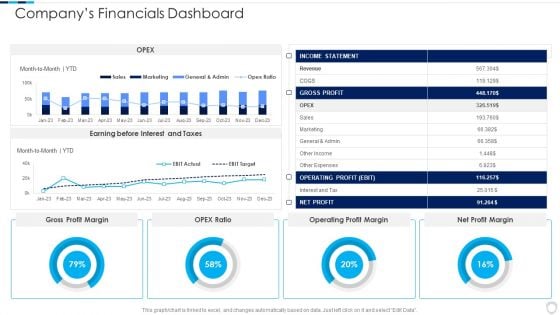
Financial Report Of An IT Firm Companys Financials Dashboard Infographics PDF
Deliver an awe inspiring pitch with this creative Financial Report Of An IT Firm Companys Financials Dashboard Infographics PDF bundle. Topics like Operating Profit, Gross Profit, Income Statement can be discussed with this completely editable template. It is available for immediate download depending on the needs and requirements of the user.

Strategies For Dynamic Supply Chain Agility Supply Chain Kpi Dashboard For Effective Financial Analysis Demonstration PDF
Mentioned slide illustrates KPI dashboard that can be used by managers to assess financial health of supply chain business. KPIs covered are supply chain costs versus sales, cash to order cycle, warehouse operating cost distribution etc. The Strategies For Dynamic Supply Chain Agility Supply Chain Kpi Dashboard For Effective Financial Analysis Demonstration PDF is a compilation of the most recent design trends as a series of slides. It is suitable for any subject or industry presentation, containing attractive visuals and photo spots for businesses to clearly express their messages. This template contains a variety of slides for the user to input data, such as structures to contrast two elements, bullet points, and slides for written information. Slidegeeks is prepared to create an impression.
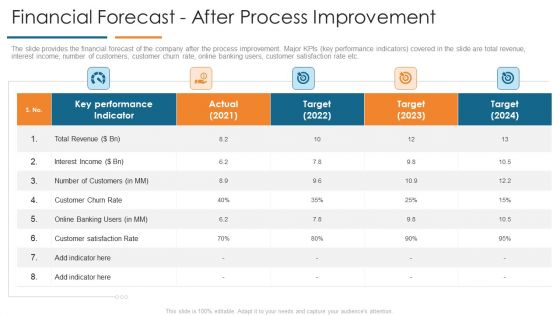
Financial Forecast After Process Improvement Develop Organizational Productivity By Enhancing Business Process Brochure PDF
The slide provides the financial forecast of the company after the process improvement. Major KPIs key performance indicators covered in the slide are total revenue, interest income, number of customers, customer churn rate, online banking users, customer satisfaction rate etc. Deliver an awe inspiring pitch with this creative financial forecast after process improvement develop organizational productivity by enhancing business process brochure pdf bundle. Topics like revenue, interest income, performance indicator, actual, target can be discussed with this completely editable template. It is available for immediate download depending on the needs and requirements of the user.
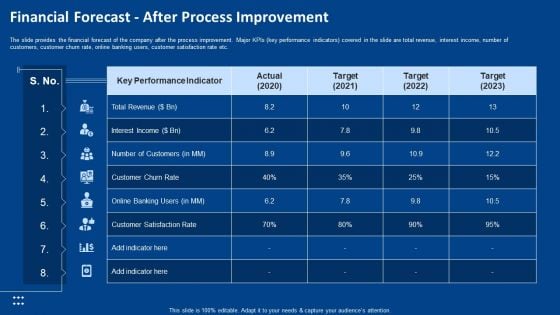
Procedure Advancements Banking Department Financial Forecast After Process Improvement Template PDF
The slide provides the financial forecast of the company after the process improvement. Major KPIs key performance indicators covered in the slide are total revenue, interest income, number of customers, customer churn rate, online banking users, customer satisfaction rate etc. Deliver and pitch your topic in the best possible manner with this procedure advancements banking department financial forecast after process improvement template pdf. Use them to share invaluable insights on total revenue, interest income, customer satisfaction rate, customer churn rate, online banking users and impress your audience. This template can be altered and modified as per your expectations. So, grab it now.
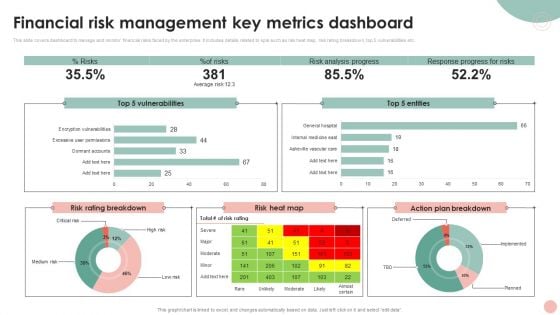
Company Risk Assessment Plan Financial Risk Management Key Metrics Dashboard Brochure PDF
This slide covers dashboard to manage and monitor financial risks faced by the enterprise. It includes details related to kpis such as risk heat map, risk rating breakdown, top 5 vulnerabilities etc. Crafting an eye catching presentation has never been more straightforward. Let your presentation shine with this tasteful yet straight forward Company Risk Assessment Plan Financial Risk Management Key Metrics Dashboard Brochure PDF template. It offers a minimalistic and classy look that is great for making a statement. The colors have been employed intelligently to add a bit of playfulness while still remaining professional. Construct the ideal Company Risk Assessment Plan Financial Risk Management Key Metrics Dashboard Brochure PDF that effortlessly grabs the attention of your audience. Begin now and be certain to wow your customers.
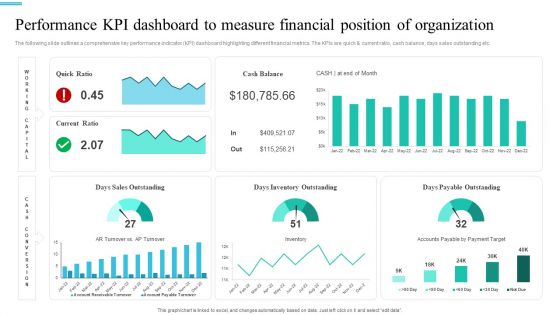
Monetary Planning And Evaluation Guide Performance KPI Dashboard To Measure Financial Position Of Organization Ppt File Slides PDF
The following slide outlines a comprehensive key performance indicator KPI dashboard highlighting different financial metrics. The KPIs are quick and current ratio, cash balance, days sales outstanding etc. The best PPT templates are a great way to save time, energy, and resources. Slidegeeks have 100 percent editable powerpoint slides making them incredibly versatile. With these quality presentation templates, you can create a captivating and memorable presentation by combining visually appealing slides and effectively communicating your message. Download Monetary Planning And Evaluation Guide Performance KPI Dashboard To Measure Financial Position Of Organization Ppt File Slides PDF from Slidegeeks and deliver a wonderful presentation.
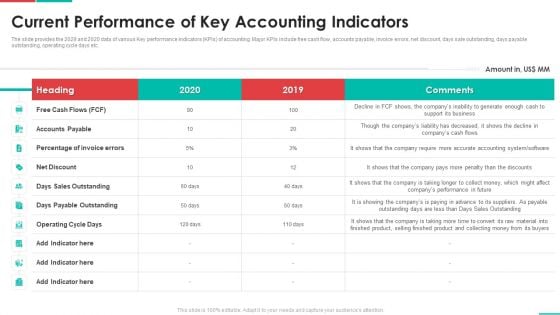
Roadmap For Financial Accounting Transformation Current Performance Of Key Accounting Indicators Elements PDF
The slide provides the 2029 and 2020 data of various Key performance indicators KPIs of accounting. Major KPIs include free cash flow, accounts payable, invoice errors, net discount, days sale outstanding, days payable outstanding, operating cycle days etc. Deliver an awe inspiring pitch with this creative roadmap for financial accounting transformation current performance of key accounting indicators elements pdf bundle. Topics like accounts payable, operating cycle days, days payable outstanding, net discount can be discussed with this completely editable template. It is available for immediate download depending on the needs and requirements of the user.
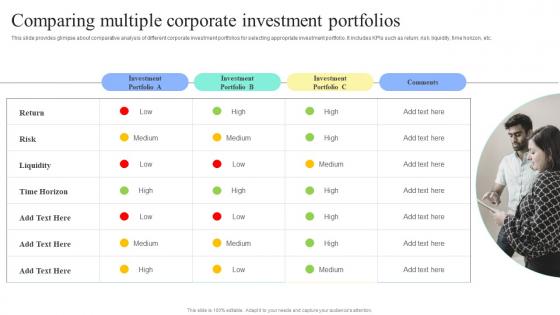
Strategic Financial Planning And Administration Comparing Multiple Corporate Investment Demonstration PDF
This slide provides glimpse about comparative analysis of different corporate investment portfolios for selecting appropriate investment portfolio. It includes KPIs such as return, risk, liquidity, time horizon, etc. Make sure to capture your audiences attention in your business displays with our gratis customizable Strategic Financial Planning And Administration Comparing Multiple Corporate Investment Demonstration PDF. These are great for business strategies, office conferences, capital raising or task suggestions. If you desire to acquire more customers for your tech business and ensure they stay satisfied, create your own sales presentation with these plain slides. This slide provides glimpse about comparative analysis of different corporate investment portfolios for selecting appropriate investment portfolio. It includes KPIs such as return, risk, liquidity, time horizon, etc.
Strategic Financial Planning And Administration Tracking The Cashflow Improvements Cash Themes PDF
This slide showcases the KPIs that would help our business organization to track the improvements in the new cash management process. It includes quick ratio, cash balance, current ratio, days inventory outstanding, etc. Slidegeeks is one of the best resources for PowerPoint templates. You can download easily and regulate Strategic Financial Planning And Administration Tracking The Cashflow Improvements Cash Themes PDF for your personal presentations from our wonderful collection. A few clicks is all it takes to discover and get the most relevant and appropriate templates. Use our Templates to add a unique zing and appeal to your presentation and meetings. All the slides are easy to edit and you can use them even for advertisement purposes. This slide showcases the KPIs that would help our business organization to track the improvements in the new cash management process. It includes quick ratio, cash balance, current ratio, days inventory outstanding, etc.
Company Financial Performance Indicators Dashboard With Working Capital And Cash Conversion Icons PDF
This slide shows dashboard of finance KPIs . It covers working capital, cash conversion cycle, vendor payment error rate ,current assets and liabilities. Showcasing this set of slides titled Company Financial Performance Indicators Dashboard With Working Capital And Cash Conversion Icons PDF. The topics addressed in these templates are Current Working Capital, Current Liabilities, Working Capital. All the content presented in this PPT design is completely editable. Download it and make adjustments in color, background, font etc. as per your unique business setting.
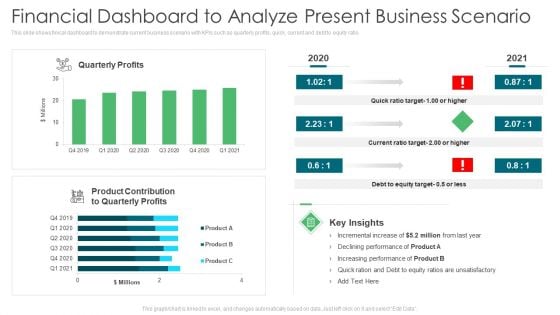
Environmental Assessment Financial Dashboard To Analyze Present Business Scenario Ppt Infographics Ideas PDF
This slide shows finical dashboard to demonstrate current business scenario with KPIs such as quarterly profits, quick, current and debt to equity ratio. Deliver an awe inspiring pitch with this creative environmental assessment financial dashboard to analyze present business scenario ppt infographics ideas pdf bundle. Topics like product contribution, increasing performance, equity target can be discussed with this completely editable template. It is available for immediate download depending on the needs and requirements of the user.
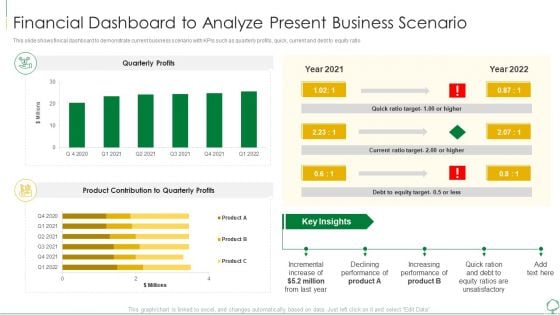
Environmental Examination Tools And Approaches Financial Dashboard To Analyze Sample PDF
This slide shows finical dashboard to demonstrate current business scenario with KPIs such as quarterly profits, quick, current and debt to equity ratio. Deliver and pitch your topic in the best possible manner with this environmental examination tools and approaches financial dashboard to analyze sample pdf. Use them to share invaluable insights on performance, product, equity and impress your audience. This template can be altered and modified as per your expectations. So, grab it now.
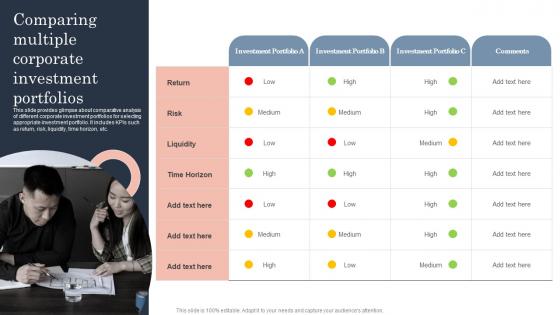
Comparing Multiple Corporate Investment Guide To Corporate Financial Growth Plan Summary Pdf
This slide provides glimpse about comparative analysis of different corporate investment portfolios for selecting appropriate investment portfolio. It includes KPIs such as return, risk, liquidity, time horizon, etc.Make sure to capture your audiences attention in your business displays with our gratis customizable Comparing Multiple Corporate Investment Guide To Corporate Financial Growth Plan Summary Pdf. These are great for business strategies, office conferences, capital raising or task suggestions. If you desire to acquire more customers for your tech business and ensure they stay satisfied, create your own sales presentation with these plain slides. This slide provides glimpse about comparative analysis of different corporate investment portfolios for selecting appropriate investment portfolio. It includes KPIs such as return, risk, liquidity, time horizon, etc.
Tracking The Cashflow Improvements With Cash Guide To Corporate Financial Growth Plan Pictures Pdf
This slide showcases the KPIs that would help our business organization to track the improvements in the new cash management process. It includes quick ratio, cash balance, current ratio, days inventory outstanding, etc.Want to ace your presentation in front of a live audience Our Tracking The Cashflow Improvements With Cash Guide To Corporate Financial Growth Plan Pictures Pdf can help you do that by engaging all the users towards you.. Slidegeeks experts have put their efforts and expertise into creating these impeccable powerpoint presentations so that you can communicate your ideas clearly. Moreover, all the templates are customizable, and easy-to-edit and downloadable. Use these for both personal and commercial use. This slide showcases the KPIs that would help our business organization to track the improvements in the new cash management process. It includes quick ratio, cash balance, current ratio, days inventory outstanding, etc.
Tracking The Cashflow Improvements Cash Assessing Corporate Financial Techniques Clipart Pdf
This slide showcases the KPIs that would help our business organization to track the improvements in the new cash management process. It includes quick ratio, cash balance, current ratio, days inventory outstanding, etc. Slidegeeks is one of the best resources for PowerPoint templates. You can download easily and regulate Tracking The Cashflow Improvements Cash Assessing Corporate Financial Techniques Clipart Pdf for your personal presentations from our wonderful collection. A few clicks is all it takes to discover and get the most relevant and appropriate templates. Use our Templates to add a unique zing and appeal to your presentation and meetings. All the slides are easy to edit and you can use them even for advertisement purposes. This slide showcases the KPIs that would help our business organization to track the improvements in the new cash management process. It includes quick ratio, cash balance, current ratio, days inventory outstanding, etc.
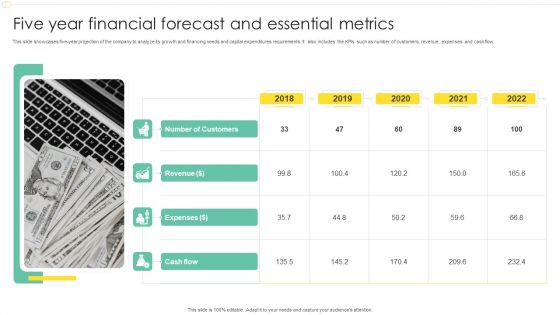
Five Year Financial Forecast And Essential Metrics Ppt Infographics Shapes PDF
This slide showcases five-year projection of the company to analyze its growth and financing needs and capital expenditures requirements. It also includes the KPIs such as number of customers, revenue , expenses and cashflow. Presenting Five Year Financial Forecast And Essential Metrics Ppt Infographics Shapes PDF to dispense important information. This template comprises five stages. It also presents valuable insights into the topics including Number Customers, Revenue, Expenses, Cash Flow, 2018 To 2022. This is a completely customizable PowerPoint theme that can be put to use immediately. So, download it and address the topic impactfully.
Roadmap For Financial Accounting Transformation Key Performance Indicators To Track The Success Of Accounting Icons PDF
The slide shows key Performance Indicator KPI which will help the company to track the success of Accounting and Finance Transformation. Major KPIs include revenue, operating profit margin, net profit margin, invoice errors, net discount etc. Deliver an awe inspiring pitch with this creative roadmap for financial accounting transformation key performance indicators to track the success of accounting icons pdf bundle. Topics like revenue, operating profit margin, net profit margin, invoice errors, net discount can be discussed with this completely editable template. It is available for immediate download depending on the needs and requirements of the user.
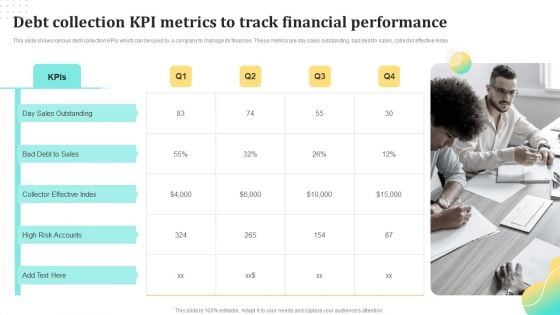
Debt Collection Kpi Metrics To Track Financial Performance Ppt Show Elements PDF
This slide shows various debt collection KPIs which can be used by a company to manage its finances. These metrics are day sales outstanding, bad debt to sales, collector effective Index. Persuade your audience using this Debt Collection Kpi Metrics To Track Financial Performance Ppt Show Elements PDF. This PPT design covers four stages, thus making it a great tool to use. It also caters to a variety of topics including Day Sales Outstanding, Collector Effective Index, High Risk Accounts. Download this PPT design now to present a convincing pitch that not only emphasizes the topic but also showcases your presentation skills.
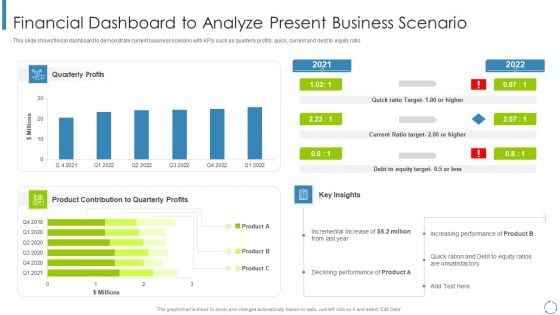
Internal And External Business Environment Analysis Financial Dashboard To Analyze Present Business Scenario Topics PDF
This slide shows finical dashboard to demonstrate current business scenario with KPIs such as quarterly profits, quick, current and debt to equity ratio Deliver and pitch your topic in the best possible manner with this internal and external business environment analysis financial dashboard to analyze present business scenario topics pdf Use them to share invaluable insights on product contribution to quarterly, incremental increase, declining performance and impress your audience. This template can be altered and modified as per your expectations. So, grab it now.
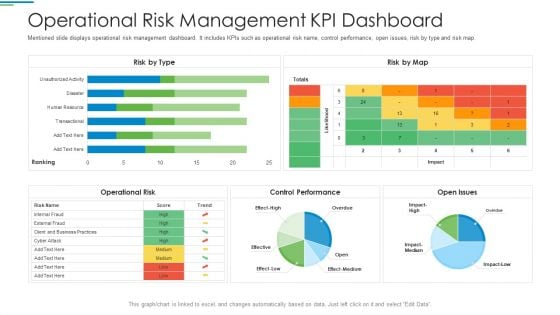
Operational Risk Management Structure In Financial Companies Operational Risk Management Kpi Dashboard Download PDF
Mentioned slide displays operational risk management dashboard. It includes KPIs such as operational risk name, control performance, open issues, risk by type and risk map. Deliver and pitch your topic in the best possible manner with this operational risk management structure in financial companies operational risk management kpi dashboard download pdf. Use them to share invaluable insights on operational risk name, control performance, open issues, risk by type and risk map and impress your audience. This template can be altered and modified as per your expectations. So, grab it now.
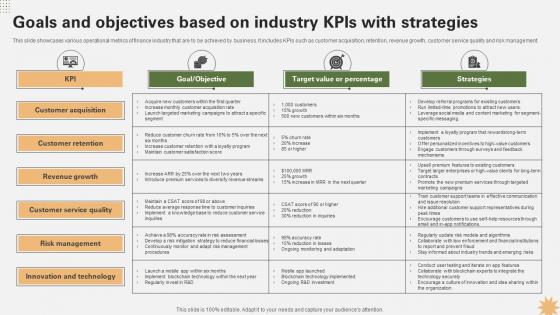
Goals And Objectives Based On Industry Strategy For Launching A Financial Strategy SS V
This slide showcases various operational metrics of finance industry that are to be achieved by business. It includes KPIs such as customer acquisition, retention, revenue growth, customer service quality and risk management. Are you in need of a template that can accommodate all of your creative concepts This one is crafted professionally and can be altered to fit any style. Use it with Google Slides or PowerPoint. Include striking photographs, symbols, depictions, and other visuals. Fill, move around, or remove text boxes as desired. Test out color palettes and font mixtures. Edit and save your work, or work with colleagues. Download Goals And Objectives Based On Industry Strategy For Launching A Financial Strategy SS V and observe how to make your presentation outstanding. Give an impeccable presentation to your group and make your presentation unforgettable. This slide showcases various operational metrics of finance industry that are to be achieved by business. It includes KPIs such as customer acquisition, retention, revenue growth, customer service quality and risk management.
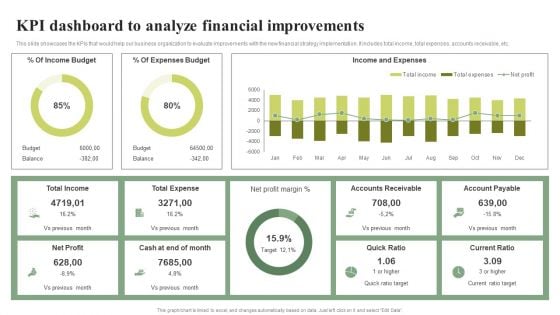
KPI Dashboard To Analyze Financial Improvements Effective Planning For Monetary Portrait PDF
This slide showcases the KPIs that would help our business organization to evaluate improvements with the new financial strategy implementation. It includes total income, total expenses, accounts receivable, etc.Find highly impressive KPI Dashboard To Analyze Financial Improvements Effective Planning For Monetary Portrait PDF on Slidegeeks to deliver a meaningful presentation. You can save an ample amount of time using these presentation templates. No need to worry to prepare everything from scratch because Slidegeeks experts have already done a huge research and work for you. You need to download KPI Dashboard To Analyze Financial Improvements Effective Planning For Monetary Portrait PDF for your upcoming presentation. All the presentation templates are 100precent editable and you can change the color and personalize the content accordingly. Download now,
Adjusting Financial Strategies And Planning Tracking The Cashflow Improvements With Cash Management Diagrams PDF
This slide showcases the KPIs that would help our business organization to track the improvements in the new cash management process. It includes quick ratio, cash balance, current ratio, days inventory outstanding, etc. Retrieve professionally designed Adjusting Financial Strategies And Planning Tracking The Cashflow Improvements With Cash Management Diagrams PDF to effectively convey your message and captivate your listeners. Save time by selecting pre made slideshows that are appropriate for various topics, from business to educational purposes. These themes come in many different styles, from creative to corporate, and all of them are easily adjustable and can be edited quickly. Access them as PowerPoint templates or as Google Slides themes. You do not have to go on a hunt for the perfect presentation because Slidegeeks got you covered from everywhere.
Key Financial Ratios Template 2 Ppt PowerPoint Presentation Icon Slide Download
This is a key financial ratios template 2 ppt powerpoint presentation icon slide download. This is a six stage process. The stages in this process are price to earnings, debt to equity ratio, current ratio, return on, equity, return on , assets, return on investment.
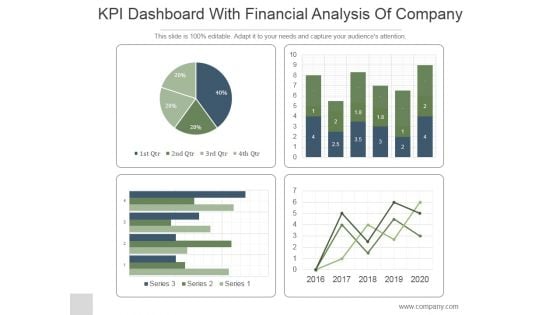
KPI Dashboard With Financial Analysis Of Company Ppt PowerPoint Presentation Backgrounds
This is a kpi dashboard with financial analysis of company ppt powerpoint presentation backgrounds. This is a four stage process. The stages in this process are business, strategy, marketing, line graph, finance.

Supply Chain Kpi Dashboard For Effective Financial Analysis Stand Out Digital Supply Chain Tactics Enhancing Graphics PDF
Mentioned slide illustrates KPI dashboard that can be used by managers to assess financial health of supply chain business. KPIs covered are supply chain costs versus sales, cash to order cycle, warehouse operating cost distribution etc.Coming up with a presentation necessitates that the majority of the effort goes into the content and the message you intend to convey. The visuals of a PowerPoint presentation can only be effective if it supplements and supports the story that is being told. Keeping this in mind our experts created Supply Chain Kpi Dashboard For Effective Financial Analysis Stand Out Digital Supply Chain Tactics Enhancing Graphics PDF to reduce the time that goes into designing the presentation. This way, you can concentrate on the message while our designers take care of providing you with the right template for the situation.
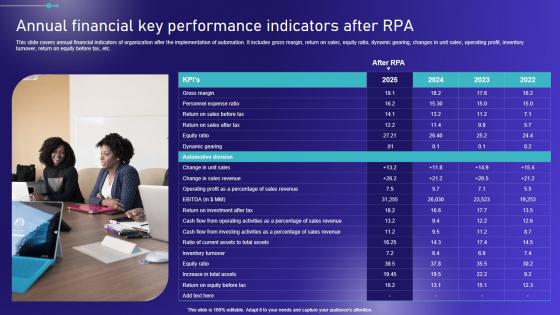
Annual Financial Key Performance Indicators After Embracing Robotic Process Elements PDF
This slide covers annual financial indicators of organization after the implementation of automation. It includes gross margin, return on sales, equity ratio, dynamic gearing, changes in unit sales, operating profit, inventory turnover, return on equity before tax, etc. Slidegeeks is one of the best resources for PowerPoint templates. You can download easily and regulate Annual Financial Key Performance Indicators After Embracing Robotic Process Elements PDF for your personal presentations from our wonderful collection. A few clicks is all it takes to discover and get the most relevant and appropriate templates. Use our Templates to add a unique zing and appeal to your presentation and meetings. All the slides are easy to edit and you can use them even for advertisement purposes. This slide covers annual financial indicators of organization after the implementation of automation. It includes gross margin, return on sales, equity ratio, dynamic gearing, changes in unit sales, operating profit, inventory turnover, return on equity before tax, etc.
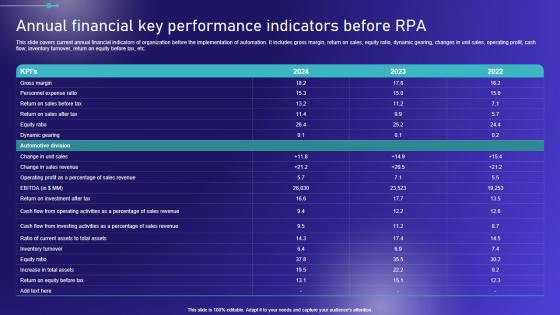
Annual Financial Key Performance Indicators Before Embracing Robotic Process Graphics PDF
This slide covers current annual financial indicators of organization before the implementation of automation. It includes gross margin, return on sales, equity ratio, dynamic gearing, changes in unit sales, operating profit, cash flow, inventory turnover, return on equity before tax, etc. Want to ace your presentation in front of a live audience Our Annual Financial Key Performance Indicators Before Embracing Robotic Process Graphics PDF can help you do that by engaging all the users towards you. Slidegeeks experts have put their efforts and expertise into creating these impeccable powerpoint presentations so that you can communicate your ideas clearly. Moreover, all the templates are customizable, and easy-to-edit and downloadable. Use these for both personal and commercial use. This slide covers current annual financial indicators of organization before the implementation of automation. It includes gross margin, return on sales, equity ratio, dynamic gearing, changes in unit sales, operating profit, cash flow, inventory turnover, return on equity before tax, etc.
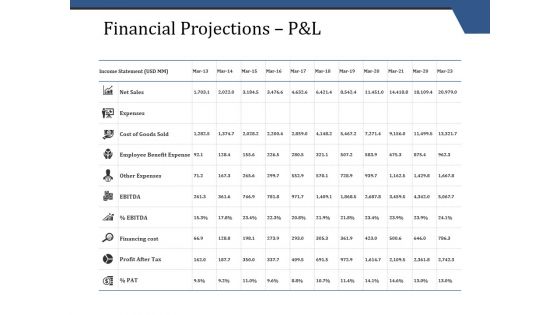
Financial Projections P And L Template 1 Ppt PowerPoint Presentation Portfolio Layouts
This is a financial projections p and l template 1 ppt powerpoint presentation portfolio layouts. This is a three stage process. The stages in this process are financial, marketing, investment, analysis, business.
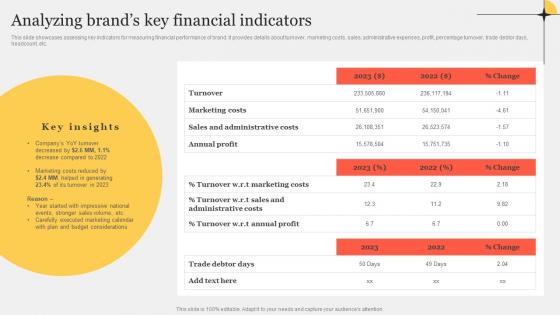
Analyzing Brands Key Financial Indicators Improving Customer Interaction Through Microsoft Pdf
This slide showcases assessing key indicators for measuring financial performance of brand. It provides details about turnover, marketing costs, sales, administrative expenses, profit, percentage turnover, trade debtor days, headcount, etc.Find highly impressive Analyzing Brands Key Financial Indicators Improving Customer Interaction Through Microsoft Pdf on Slidegeeks to deliver a meaningful presentation. You can save an ample amount of time using these presentation templates. No need to worry to prepare everything from scratch because Slidegeeks experts have already done a huge research and work for you. You need to download Analyzing Brands Key Financial Indicators Improving Customer Interaction Through Microsoft Pdf for your upcoming presentation. All the presentation templates are 100Precent editable and you can change the color and personalize the content accordingly. Download now. This slide showcases assessing key indicators for measuring financial performance of brand. It provides details about turnover, marketing costs, sales, administrative expenses, profit, percentage turnover, trade debtor days, headcount, etc.

Bar Chart With Magnifying Glass For Financial Analysis Ppt Powerpoint Presentation Infographics Designs Download
This is a bar chart with magnifying glass for financial analysis ppt powerpoint presentation infographics designs download. This is a three stage process. The stages in this process are business metrics, business kpi, business dashboard.
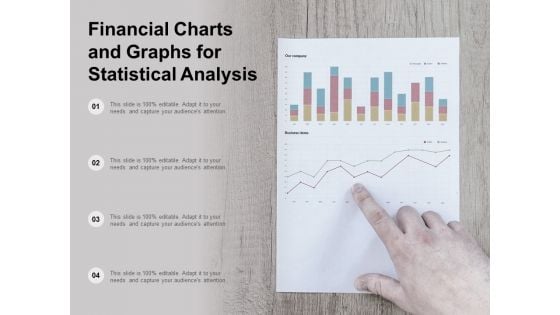
Financial Charts And Graphs For Statistical Analysis Ppt Powerpoint Presentation Show Layout
This is a financial charts and graphs for statistical analysis ppt powerpoint presentation show layout. This is a four stage process. The stages in this process are business metrics, business kpi, business dashboard.

Financial Management Kpi Metrics Management Ppt Powerpoint Presentation Infographic Template Graphic Images
This is a financial management kpi metrics management ppt powerpoint presentation infographic template graphic images. This is a four stage process. The stages in this process are finance, marketing, management, investment, analysis.
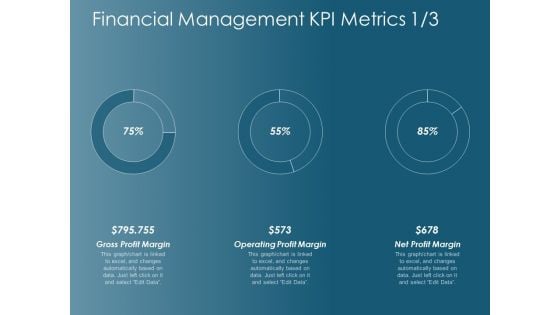
Financial Management Kpi Metrics Operating Profit Margin Ppt Powerpoint Presentation Infographic Template Images
This is a financial management kpi metrics operating profit margin ppt powerpoint presentation infographic template images. This is a three stage process. The stages in this process are finance, marketing, management, investment, analysis.
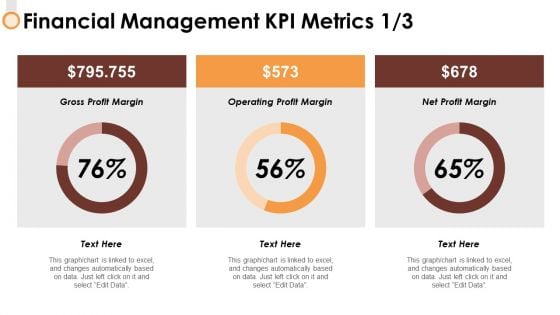
Financial Management Kpi Metrics 1 3 Ppt PowerPoint Presentation Ideas Mockup
This is a financial management kpi metrics 1 3 ppt powerpoint presentation ideas mockup. This is a three stage process. The stages in this process are finance, strategy, marketing, compare, business.
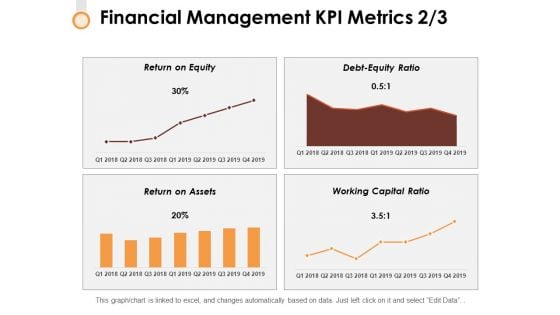
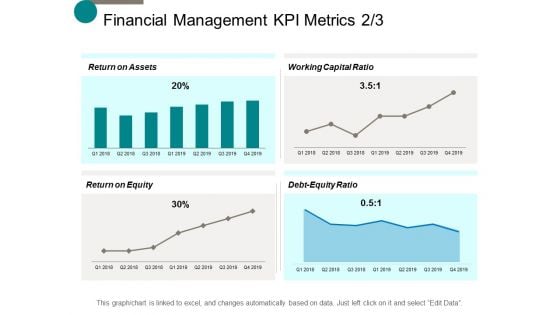
Financial Management Kpi Metrics 2 3 Ppt PowerPoint Presentation Professional Objects
This is a financial management kpi metrics 2 3 ppt powerpoint presentation professional objects. This is a four stage process. The stages in this process are finance, strategy, marketing, management, business.
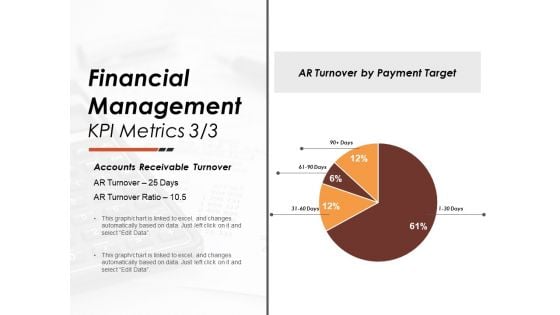
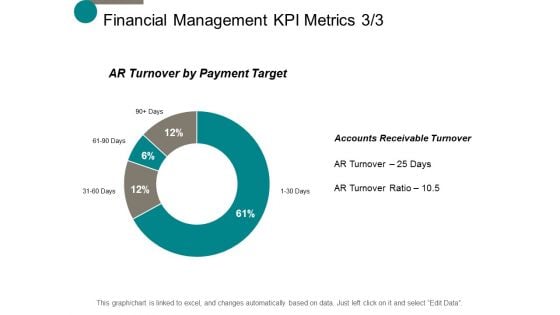
Financial Management Kpi Metrics 3 3 Ppt PowerPoint Presentation Summary Themes
This is a financial management kpi metrics 3 3 ppt powerpoint presentation summary themes. This is a four stage process. The stages in this process are finance, strategy, marketing, management, business.
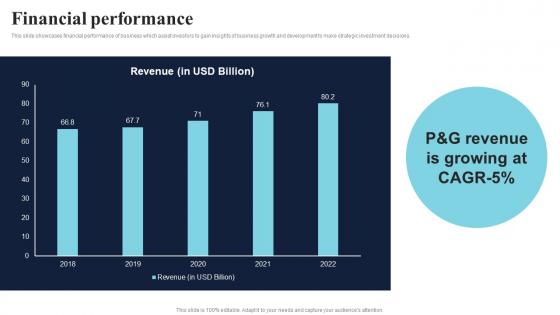
Financial Performance Healthcare Product Company Fund Raising Pitch Deck Diagrams Pdf
This slide showcases financial performance of business which assist investors to gain insights of business growth and development to make strategic investment decisions. Take your projects to the next level with our ultimate collection of Financial Performance Healthcare Product Company Fund Raising Pitch Deck Diagrams Pdf. Slidegeeks has designed a range of layouts that are perfect for representing task or activity duration, keeping track of all your deadlines at a glance. Tailor these designs to your exact needs and give them a truly corporate look with your own brand colors they will make your projects stand out from the rest This slide showcases financial performance of business which assist investors to gain insights of business growth and development to make strategic investment decisions.

New Product Development Performance Evaluation Financial Ppt PowerPoint Presentation Ideas Professional PDF
Presenting this set of slides with name new product development performance evaluation financial ppt powerpoint presentation ideas professional pdf. This is a four stage process. The stages in this process are million, financial. This is a completely editable PowerPoint presentation and is available for immediate download. Download now and impress your audience.
Icon For Monthly Financial Metrics Report Showcasing Company Statistics Ideas PDF
Presenting Icon For Monthly Financial Metrics Report Showcasing Company Statistics Ideas PDF to dispense important information. This template comprises three stages. It also presents valuable insights into the topics including Monthly Financial, Metrics Report Showcasing, Company Statistics. This is a completely customizable PowerPoint theme that can be put to use immediately. So, download it and address the topic impactfully.
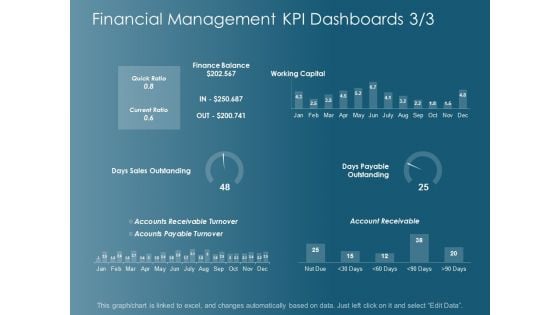
Financial Management Kpi Dashboards Strategy Ppt Powerpoint Presentation Gallery Graphics Template
This is a financial management kpi dashboards strategy ppt powerpoint presentation gallery graphics template. This is a six stage process. The stages in this process are finance, marketing, management, investment, analysis.
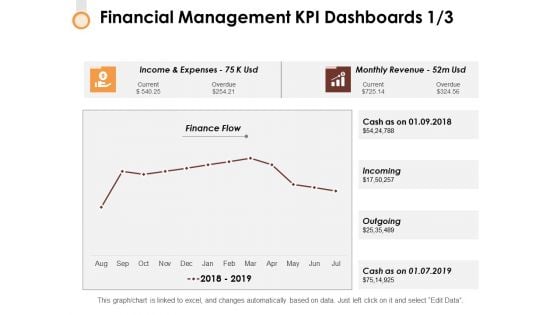
Financial Management Kpi Dashboards 1 3 Ppt PowerPoint Presentation Outline Background
This is a financial management kpi dashboards 1 3 ppt powerpoint presentation outline background. This is a four stage process. The stages in this process are finance, strategy, marketing, compare, business.
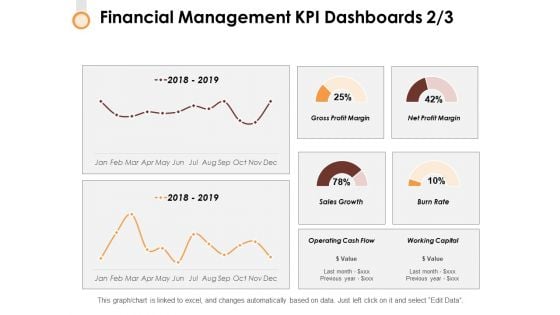
Financial Management Kpi Dashboards 2 3 Ppt PowerPoint Presentation Infographic Template Format Ideas
This is a financial management kpi dashboards 2 3 ppt powerpoint presentation infographic template format ideas. This is a two stage process. The stages in this process are finance, strategy, marketing, compare, business.
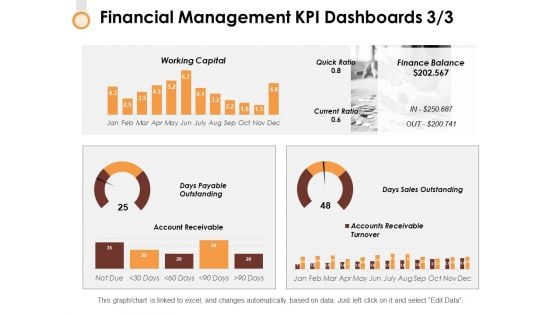
Financial Management Kpi Dashboards 3 3 Ppt PowerPoint Presentation Layouts Graphics Template
This is a financial management kpi dashboards 3 3 ppt powerpoint presentation layouts graphics template. This is a two stage process. The stages in this process are finance, strategy, marketing, compare, business.

Financial Comparison Enterprise Software Solution Providing Company Profile CP SS V
Following slide provides information about software solutions offering company financial comparison. It includes financial metrics such as revenue, cost of goods sold, gross profit and net profit.Welcome to our selection of the Financial Comparison Enterprise Software Solution Providing Company Profile CP SS V. These are designed to help you showcase your creativity and bring your sphere to life. Planning and Innovation are essential for any business that is just starting out. This collection contains the designs that you need for your everyday presentations. All of our PowerPoints are 100 percent editable, so you can customize them to suit your needs. This multi-purpose template can be used in various situations. Grab these presentation templates today. Following slide provides information about software solutions offering company financial comparison. It includes financial metrics such as revenue, cost of goods sold, gross profit and net profit.
Icon For Annual Financial Performance Dashboard For Capital Fund Raising Ppt Layouts Layout PDF
Presenting Icon For Annual Financial Performance Dashboard For Capital Fund Raising Ppt Layouts Layout PDF to dispense important information. This template comprises three stages. It also presents valuable insights into the topics including Icon, Annual Financial ,Performance Dashboard, Capital Fund Raising. This is a completely customizable PowerPoint theme that can be put to use immediately. So, download it and address the topic impactfully.
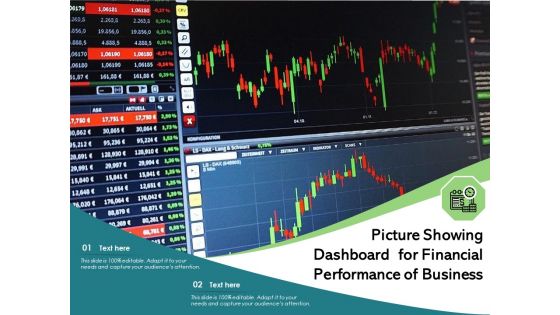
Picture Showing Dashboard For Financial Performance Of Business Ppt PowerPoint Presentation Portfolio Master Slide PDF
Presenting picture showing dashboard for financial performance of business ppt powerpoint presentation portfolio master slide pdf to dispense important information. This template comprises two stages. It also presents valuable insights into the topics including picture showing dashboard for financial performance of business. This is a completely customizable PowerPoint theme that can be put to use immediately. So, download it and address the topic impactfully.
Business Financial Report Dashboard Vector Icon Ppt PowerPoint Presentation File Graphics PDF
Presenting business financial report dashboard vector icon ppt powerpoint presentation file graphics pdf to dispense important information. This template comprises three stages. It also presents valuable insights into the topics including business financial report dashboard vector icon. This is a completely customizable PowerPoint theme that can be put to use immediately. So, download it and address the topic impactfully.

Financial Metrics Of Commercial Vehicles Luxury Automobile Vehicles PPT Slide CP SS V
This slide showcases the financial metrics of commercial vehicles. It includes metrics such as sales volume in units, revenue in crores, domestic market share and EBITDA percent and Y-O-Y growth. Make sure to capture your audiences attention in your business displays with our gratis customizable Financial Metrics Of Commercial Vehicles Luxury Automobile Vehicles PPT Slide CP SS V. These are great for business strategies, office conferences, capital raising or task suggestions. If you desire to acquire more customers for your tech business and ensure they stay satisfied, create your own sales presentation with these plain slides. This slide showcases the financial metrics of commercial vehicles. It includes metrics such as sales volume in units, revenue in crores, domestic market share and EBITDA percent and Y-O-Y growth.

Financial Metrics Of Land Rover Jaguar Luxury Automobile Vehicles PPT PowerPoint CP SS V
This slide showcases the financial metrics of Land Rover Jaguar. It includes metrics such as sales volume in units including CJLR, revenue million, Free cash flowpost interest million, EBITDA and Y-O-Y growth. Coming up with a presentation necessitates that the majority of the effort goes into the content and the message you intend to convey. The visuals of a PowerPoint presentation can only be effective if it supplements and supports the story that is being told. Keeping this in mind our experts created Financial Metrics Of Land Rover Jaguar Luxury Automobile Vehicles PPT PowerPoint CP SS V to reduce the time that goes into designing the presentation. This way, you can concentrate on the message while our designers take care of providing you with the right template for the situation. This slide showcases the financial metrics of Land Rover Jaguar. It includes metrics such as sales volume in units including CJLR, revenue million, Free cash flowpost interest million, EBITDA and Y-O-Y growth.

Financial Metrics Of Passenger Vehicles Luxury Automobile Vehicles PPT Slide CP SS V
This slide showcases the financial metrics of passenger vehicles. It includes metrics such as sales volume in units, revenue in crores, market share and EBITDA percent and Y-O-Y growth. This modern and well-arranged Financial Metrics Of Passenger Vehicles Luxury Automobile Vehicles PPT Slide CP SS V provides lots of creative possibilities. It is very simple to customize and edit with the Powerpoint Software. Just drag and drop your pictures into the shapes. All facets of this template can be edited with Powerpoint, no extra software is necessary. Add your own material, put your images in the places assigned for them, adjust the colors, and then you can show your slides to the world, with an animated slide included. This slide showcases the financial metrics of passenger vehicles. It includes metrics such as sales volume in units, revenue in crores, market share and EBITDA percent and Y-O-Y growth.

Metrics Relevant To Chief Financial Officer In Go To Market Business Tactics Ideas Pdf
This slide presents metrics relevant for CFOs Chief financial officer in go to market strategy, helpful in assessing plan and determining probability of success. It includes pipeline coverage, lead conversion rate, sales team tenure and market listening Showcasing this set of slides titled Metrics Relevant To Chief Financial Officer In Go To Market Business Tactics Ideas Pdf. The topics addressed in these templates are Research Competitors, Develop Messaging, Set Targets. All the content presented in this PPT design is completely editable. Download it and make adjustments in color, background, font etc. as per your unique business setting. This slide presents metrics relevant for CFOs Chief financial officer in go to market strategy, helpful in assessing plan and determining probability of success. It includes pipeline coverage, lead conversion rate, sales team tenure and market listening

Financial Metrics Of Tata Motors Finance Luxury Automobile Vehicles PPT Template CP SS V
This slide showcases the financial metrics of Tata Motors Finance. It includes metrics such as assets under management, cv market share, profit before tax, return on equity, gross non-performing assets and net non-performing assets. This Financial Metrics Of Tata Motors Finance Luxury Automobile Vehicles PPT Template CP SS V is perfect for any presentation, be it in front of clients or colleagues. It is a versatile and stylish solution for organizing your meetings. The Financial Metrics Of Tata Motors Finance Luxury Automobile Vehicles PPT Template CP SS V features a modern design for your presentation meetings. The adjustable and customizable slides provide unlimited possibilities for acing up your presentation. Slidegeeks has done all the homework before launching the product for you. So, do not wait, grab the presentation templates today This slide showcases the financial metrics of Tata Motors Finance. It includes metrics such as assets under management, cv market share, profit before tax, return on equity, gross non-performing assets and net non-performing assets.
Financial Management Kpi Metrics Business Ppt Powerpoint Presentation Gallery File Formats
This is a financial management kpi metrics business ppt powerpoint presentation gallery file formats. This is a four stage process. The stages in this process are finance, marketing, management, investment, analysis.
Financial Management Kpi Metrics Process Ppt Powerpoint Presentation Slides Graphics Download
This is a financial management kpi metrics process ppt powerpoint presentation slides graphics download. This is a four stage process. The stages in this process are finance, marketing, management, investment, analysis.

Financial Metrics Of Electric Vehicles Luxury Automobile Vehicles PPT Sample CP SS V
This slide showcases the financial metrics of passenger vehicles. It includes metrics such as sales volume in units, EV penetration percent, market share and public charging and Y-O-Y growth. Formulating a presentation can take up a lot of effort and time, so the content and message should always be the primary focus. The visuals of the PowerPoint can enhance the presenters message, so our Financial Metrics Of Electric Vehicles Luxury Automobile Vehicles PPT Sample CP SS V was created to help save time. Instead of worrying about the design, the presenter can concentrate on the message while our designers work on creating the ideal templates for whatever situation is needed. Slidegeeks has experts for everything from amazing designs to valuable content, we have put everything into Financial Metrics Of Electric Vehicles Luxury Automobile Vehicles PPT Sample CP SS V This slide showcases the financial metrics of passenger vehicles. It includes metrics such as sales volume in units, EV penetration percent, market share and public charging and Y-O-Y growth.
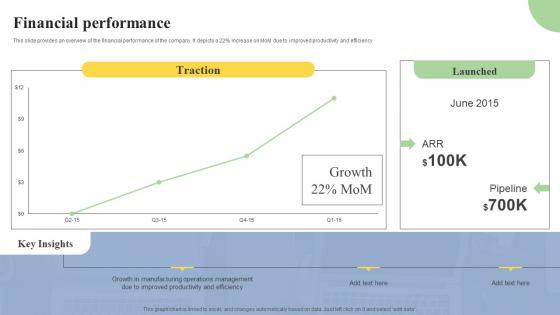
Financial Performance Cloud Based ERP Software Investor Financing Elevator Pitch Deck Formats Pdf
This slide provides an overview of the financial performance of the company. It depicts a 22percent increase on MoM due to improved productivity and efficiency From laying roadmaps to briefing everything in detail, our templates are perfect for you. You can set the stage with your presentation slides. All you have to do is download these easy to edit and customizable templates. Financial Performance Cloud Based ERP Software Investor Financing Elevator Pitch Deck Formats Pdf will help you deliver an outstanding performance that everyone would remember and praise you for. Do download this presentation today. This slide provides an overview of the financial performance of the company. It depicts a 22percent increase on MoM due to improved productivity and efficiency
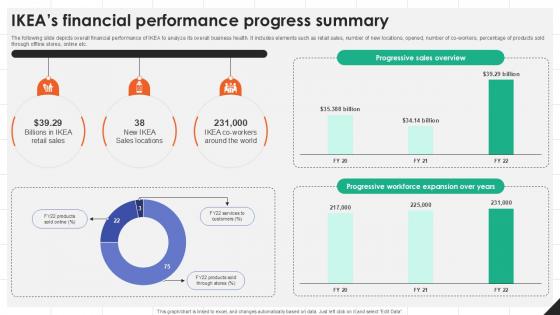
IKEAs Financial Performance Progress IKEAs Successful Market Expansion PPT Sample Strategy SS V
The following slide depicts overall financial performance of IKEA to analyze its overall business health. It includes elements such as retail sales, number of new locations, opened, number of co-workers, percentage of products sold through offline stores, online etc. Take your projects to the next level with our ultimate collection of IKEAs Financial Performance Progress IKEAs Successful Market Expansion PPT Sample Strategy SS V. Slidegeeks has designed a range of layouts that are perfect for representing task or activity duration, keeping track of all your deadlines at a glance. Tailor these designs to your exact needs and give them a truly corporate look with your own brand colors they will make your projects stand out from the rest The following slide depicts overall financial performance of IKEA to analyze its overall business health. It includes elements such as retail sales, number of new locations, opened, number of co-workers, percentage of products sold through offline stores, online etc.


 Continue with Email

 Home
Home


