Financial Kpis

Economic Fairness Financial Balance Opportunity Employee Increase Ppt PowerPoint Presentation Complete Deck
Presenting this set of slides with name economic fairness financial balance opportunity employee increase ppt powerpoint presentation complete deck. The topics discussed in these slides are financial balance, opportunity, employee increase, measures, social justice. This is a completely editable PowerPoint presentation and is available for immediate download. Download now and impress your audience.
Annual Financial Performance Administration Dashboard With Key Metrics Ppt PowerPoint Presentation Icon Visual Aids PDF
Showcasing this set of slides titled Annual Financial Performance Administration Dashboard With Key Metrics Ppt PowerPoint Presentation Icon Visual Aids PDF. The topics addressed in these templates are Accounts Receivable, Accounts Payable, Planned Profit Margin. All the content presented in this PPT design is completely editable. Download it and make adjustments in color, background, font etc. as per your unique business setting.
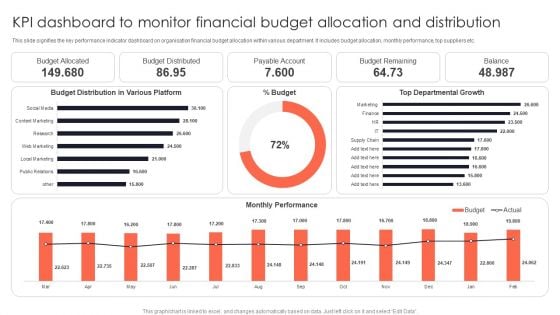
KPI Dashboard To Monitor Financial Budget Allocation And Distribution Portrait PDF
This slide signifies the key performance indicator dashboard on organisation financial budget allocation within various department. It includes budget allocation, monthly performance, top suppliers etc.Deliver an awe inspiring pitch with this creative KPI Dashboard To Monitor Financial Budget Allocation And Distribution Portrait PDF bundle. Topics like Budget Allocated, Budget Distributed, Payable Account can be discussed with this completely editable template. It is available for immediate download depending on the needs and requirements of the user.

Customer Relationship Management In Freehold Property Agenda Financial Ppt Pictures Files PDF
Presenting this set of slides with name customer relationship management in freehold property agenda financial ppt pictures files pdf. This is a four stage process. The stages in this process are business, growth, product developments, financial, performance. This is a completely editable PowerPoint presentation and is available for immediate download. Download now and impress your audience.

Types Of Financial Instruments We Trade In Ppt Powerpoint Presentation Styles Design Inspiration
This is a types of financial instruments we trade in ppt powerpoint presentation styles design inspiration. This is a three stage process. The stages in this process are primary, derivatives, combinations, business, management.
Environmental Assessment Financial Dashboard For Business Impact Tracking Ppt Layouts Guidelines PDF
This slide shows financial dashboard for business impact tracking with key performance indicators like quick ratio, current ratio, monthly cash flow etc Deliver and pitch your topic in the best possible manner with this environmental assessment financial dashboard for business impact tracking ppt layouts guidelines pdf. Use them to share invaluable insights on sales outstanding, cash balance, accounts payable and impress your audience. This template can be altered and modified as per your expectations. So, grab it now.
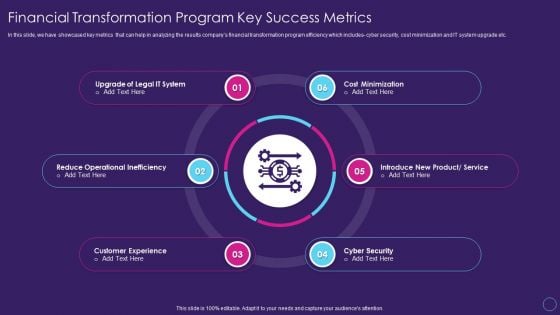
Financial Transformation Program Key Success Metrics Digital Transformation Toolkit Accounting Finance Portrait PDF
In this slide, we have showcased key metrics that can help in analyzing the results companys financial transformation program efficiency which includes cyber security, cost minimization and IT system upgrade etc. Presenting financial transformation program key success metrics digital transformation toolkit accounting finance portrait pdf to provide visual cues and insights. Share and navigate important information on six stages that need your due attention. This template can be used to pitch topics like customer experience, reduce operational inefficiency, cyber security, cost minimization. In addtion, this PPT design contains high resolution images, graphics, etc, that are easily editable and available for immediate download.
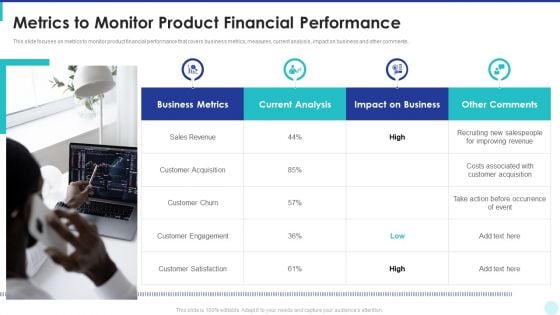
Optimization Of Product Development Life Cycle Metrics To Monitor Product Financial Performance Introduction PDF
This slide focuses on metrics to monitor product financial performance that covers business metrics, measures, current analysis, impact on business and other comments. Presenting optimization of product development life cycle metrics to monitor product financial performance introduction pdf to provide visual cues and insights. Share and navigate important information on four stages that need your due attention. This template can be used to pitch topics like business metrics, measures, current analysis, impact on business, other comments. In addtion, this PPT design contains high resolution images, graphics, etc, that are easily editable and available for immediate download.
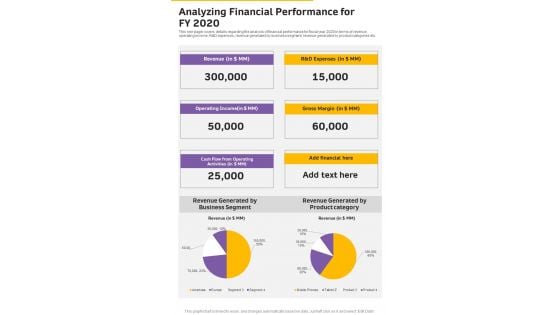
Analyzing Financial Performance For FY 2020 Template 24 One Pager Documents
This one pager covers details regarding the analysis of financial performance for fiscal year 2020 in terms of revenue, operating income, R AND D expenses, revenue generated by business segment, revenue generated by product categories etc. Presenting you an exemplary Analyzing Financial Performance For FY 2020 Template 24 One Pager Documents. Our one-pager comprises all the must-have essentials of an inclusive document. You can edit it with ease, as its layout is completely editable. With such freedom, you can tweak its design and other elements to your requirements. Download this Analyzing Financial Performance For FY 2020 Template 24 One Pager Documents brilliant piece now.
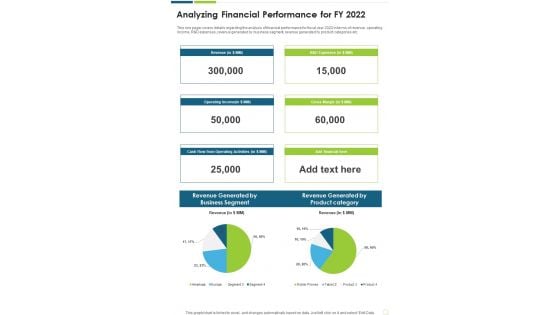
Analyzing Financial Performance For FY 2022 Template 229 One Pager Documents
This one pager covers details regarding the analysis of financial performance for fiscal year 2022 in terms of revenue, operating income, R AND D expenses, revenue generated by business segment, revenue generated by product categories etc. Presenting you an exemplary Analyzing Financial Performance For FY 2022 Template 229 One Pager Documents. Our one-pager comprises all the must-have essentials of an inclusive document. You can edit it with ease, as its layout is completely editable. With such freedom, you can tweak its design and other elements to your requirements. Download this Analyzing Financial Performance For FY 2022 Template 229 One Pager Documents brilliant piece now.
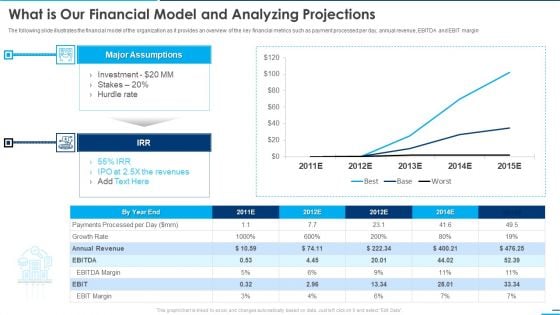
Square Company Investor What Is Our Financial Model And Analyzing Projections Ppt Layouts Master Slide PDF
The following slide illustrates the financial model of the organization as it provides an overview of the key financial metrics such as payment processed per day, annual revenue, EBITDA and EBIT margin. Deliver and pitch your topic in the best possible manner with this square company investor what is our financial model and analyzing projections ppt layouts master slide pdf. Use them to share invaluable insights on growth rate, payments, margin, annual revenue and impress your audience. This template can be altered and modified as per your expectations. So, grab it now.

Financial Analysis Vector Bar Graph With Magnifying Glass Ppt PowerPoint Presentation Gallery Design Ideas
This is a financial analysis vector bar graph with magnifying glass ppt powerpoint presentation gallery design ideas. This is a four stage process. The stages in this process are marketing analytics, marketing performance, marketing discovery.
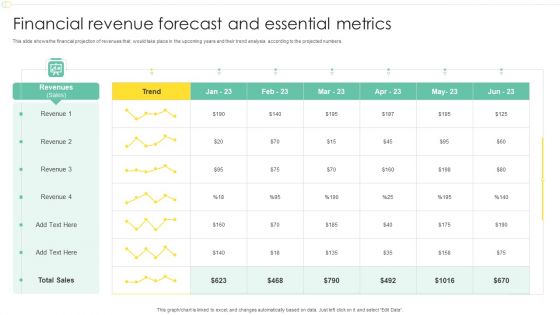
Financial Revenue Forecast And Essential Metrics Ppt Model Infographic Template PDF
This slide shows the financial projection of revenues that would take place in the upcoming years and their trend analysis according to the projected numbers. Showcasing this set of slides titled Financial Revenue Forecast And Essential Metrics Ppt Model Infographic Template PDF. The topics addressed in these templates are Revenues, Sales, Trend. All the content presented in this PPT design is completely editable. Download it and make adjustments in color, background, font etc. as per your unique business setting.
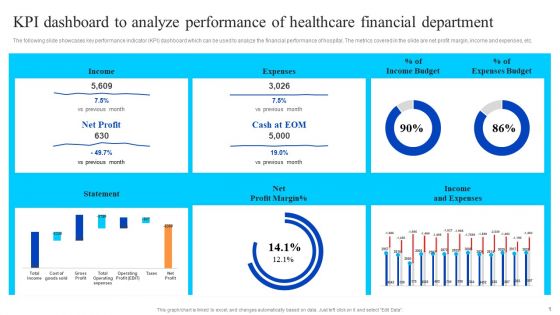
KPI Dashboard To Analyze Performance Of Healthcare Financial Department Summary PDF
The following slide showcases key performance indicator KPI dashboard which can be used to analyze the financial performance of hospital. The metrics covered in the slide are net profit margin, income and expenses, etc. Do you have an important presentation coming up Are you looking for something that will make your presentation stand out from the rest Look no further than KPI Dashboard To Analyze Performance Of Healthcare Financial Department Summary PDF. With our professional designs, you can trust that your presentation will pop and make delivering it a smooth process. And with Slidegeeks, you can trust that your presentation will be unique and memorable. So why wait Grab KPI Dashboard To Analyze Performance Of Healthcare Financial Department Summary PDF today and make your presentation stand out from the rest.
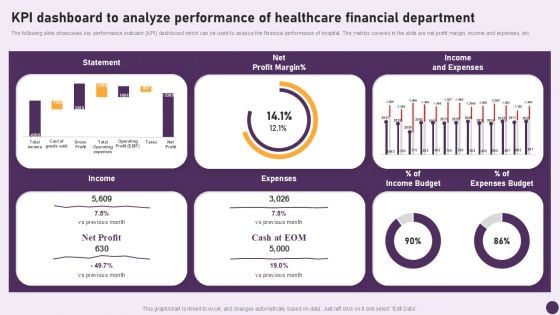
Guide To Healthcare Services Administration KPI Dashboard To Analyze Performance Healthcare Financial Demonstration PDF
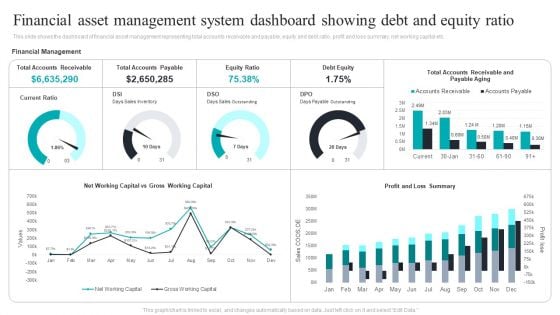
Financial Asset Management System Dashboard Showing Debt And Equity Ratio Graphics PDF
This slide shows the dashboard of financial asset management representing total accounts receivable and payable, equity and debt ratio, profit and loss summary, net working capital etc. Showcasing this set of slides titled Financial Asset Management System Dashboard Showing Debt And Equity Ratio Graphics PDF. The topics addressed in these templates are Financial Asset, Management System, Debt And Equity Ratio. All the content presented in this PPT design is completely editable. Download it and make adjustments in color, background, font etc. as per your unique business setting.
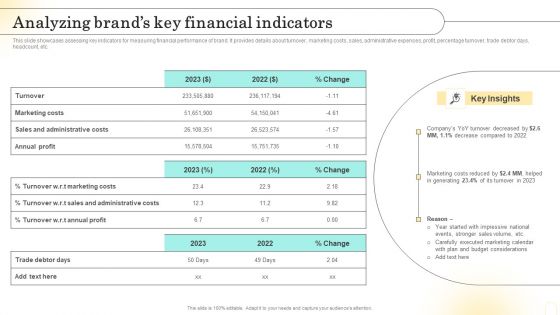
Emotional Marketing Strategy To Nurture Analyzing Brands Key Financial Indicators Demonstration PDF
This slide showcases assessing key indicators for measuring financial performance of brand. It provides details about turnover, marketing costs, sales, administrative expenses, profit, percentage turnover, trade debtor days, headcount, etc. Create an editable Emotional Marketing Strategy To Nurture Analyzing Brands Key Financial Indicators Demonstration PDF that communicates your idea and engages your audience. Whether youre presenting a business or an educational presentation, pre-designed presentation templates help save time. Emotional Marketing Strategy To Nurture Analyzing Brands Key Financial Indicators Demonstration PDF is highly customizable and very easy to edit, covering many different styles from creative to business presentations. Slidegeeks has creative team members who have crafted amazing templates. So, go and get them without any delay.
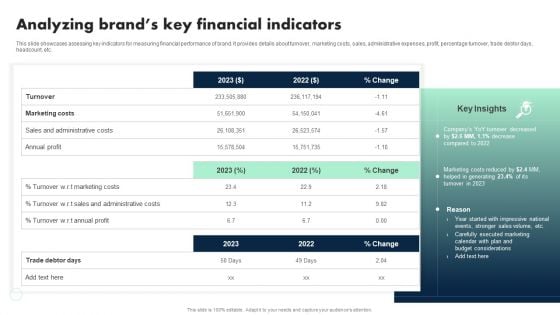
Apple Emotional Marketing Strategy Analyzing Brands Key Financial Indicators Rules PDF
This slide showcases assessing key indicators for measuring financial performance of brand. It provides details about turnover, marketing costs, sales, administrative expenses, profit, percentage turnover, trade debtor days, headcount, etc. Here you can discover an assortment of the finest PowerPoint and Google Slides templates. With these templates, you can create presentations for a variety of purposes while simultaneously providing your audience with an eye catching visual experience. Download Apple Emotional Marketing Strategy Analyzing Brands Key Financial Indicators Rules PDF to deliver an impeccable presentation. These templates will make your job of preparing presentations much quicker, yet still, maintain a high level of quality. Slidegeeks has experienced researchers who prepare these templates and write high quality content for you. Later on, you can personalize the content by editing the Apple Emotional Marketing Strategy Analyzing Brands Key Financial Indicators Rules PDF.
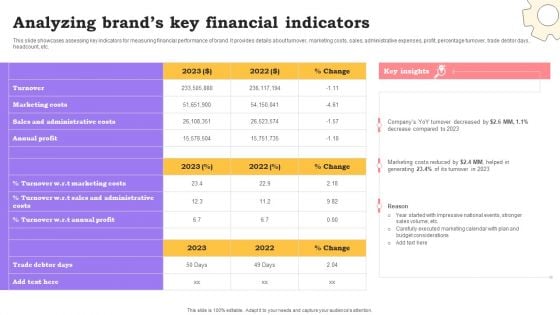
Marketing Commodities And Offerings Analyzing Brands Key Financial Indicators Demonstration PDF
This slide showcases assessing key indicators for measuring financial performance of brand. It provides details about turnover, marketing costs, sales, administrative expenses, profit, percentage turnover, trade debtor days, headcount, etc. Here you can discover an assortment of the finest PowerPoint and Google Slides templates. With these templates, you can create presentations for a variety of purposes while simultaneously providing your audience with an eye catching visual experience. Download Marketing Commodities And Offerings Analyzing Brands Key Financial Indicators Demonstration PDF to deliver an impeccable presentation. These templates will make your job of preparing presentations much quicker, yet still, maintain a high level of quality. Slidegeeks has experienced researchers who prepare these templates and write high quality content for you. Later on, you can personalize the content by editing the Marketing Commodities And Offerings Analyzing Brands Key Financial Indicators Demonstration PDF.
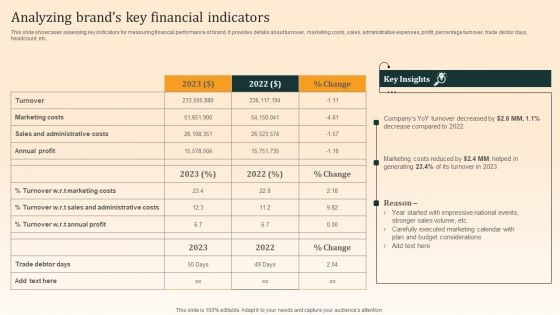
Nike Emotional Branding Strategy Analyzing Brands Key Financial Indicators Summary PDF
This slide showcases assessing key indicators for measuring financial performance of brand. It provides details about turnover, marketing costs, sales, administrative expenses, profit, percentage turnover, trade debtor days, headcount, etc. Create an editable Nike Emotional Branding Strategy Analyzing Brands Key Financial Indicators Summary PDF that communicates your idea and engages your audience. Whether youre presenting a business or an educational presentation, pre designed presentation templates help save time. Nike Emotional Branding Strategy Analyzing Brands Key Financial Indicators Summary PDF is highly customizable and very easy to edit, covering many different styles from creative to business presentations. Slidegeeks has creative team members who have crafted amazing templates. So, go and get them without any delay.
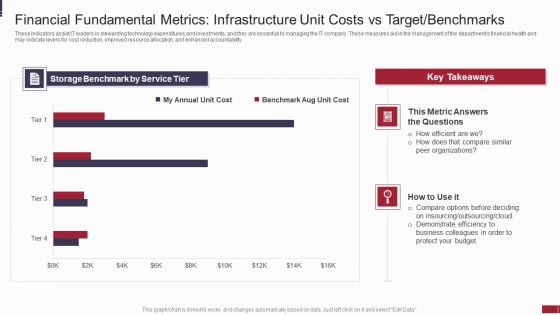
IT Value Story Significant To Corporate Leadership Financial Fundamental Metrics Infrastructure Ideas PDF
This template covers fundamental financial metrics IT spend vs Plan for both opex and capex budgets, and application and service total cost, which aligns business value communication to IT values. Deliver an awe inspiring pitch with this creative it value story significant to corporate leadership financial fundamental metrics infrastructure ideas pdf bundle. Topics like budget, planned, cost, service, application can be discussed with this completely editable template. It is available for immediate download depending on the needs and requirements of the user.

Communicate Company Value To Your Stakeholders Financial Fundamental Metrics Infrastructure Diagrams PDF
This template covers fundamental financial metrics IT spend vs Plan for both opex and capex budgets, and application and service total cost, which aligns business value communication to IT values. Deliver an awe inspiring pitch with this creative communicate company value to your stakeholders financial fundamental metrics infrastructure diagrams pdf bundle. Topics like project investments, service, cost, application, planned can be discussed with this completely editable template. It is available for immediate download depending on the needs and requirements of the user.
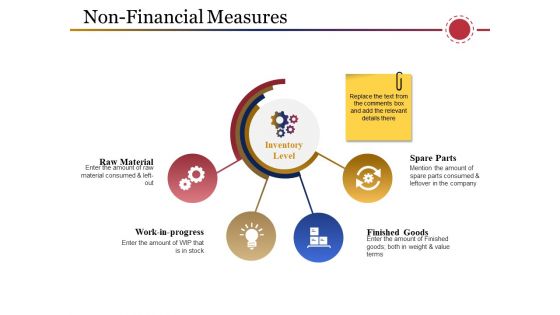
Non Financial Measures Template 2 Ppt PowerPoint Presentation Pictures Infographic Template
This is a non financial measures template 2 ppt powerpoint presentation pictures infographic template. This is a four stage process. The stages in this process are raw material, work in progress, finished goods, spare parts.
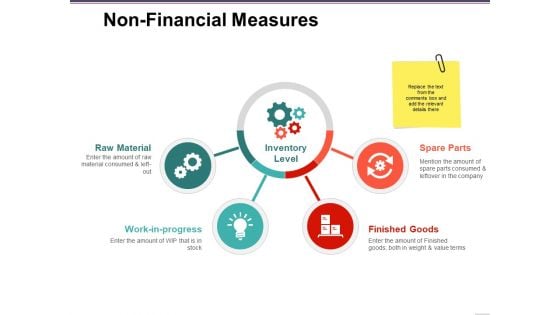
Non Financial Measures Template 2 Ppt PowerPoint Presentation Outline Design Templates
This is a non financial measures template 2 ppt powerpoint presentation outline design templates. This is a four stage process. The stages in this process are raw material, work in progress, inventory level, finished goods, spare parts.
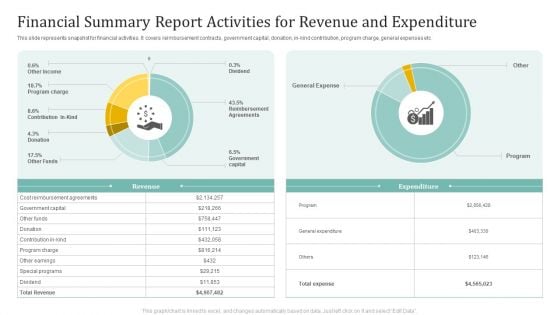
Financial Summary Report Activities For Revenue And Expenditure Ppt Inspiration Display PDF
This slide represents snapshot for financial activities. It covers reimbursement contracts, government capital, donation, in-kind contribution, program charge, general expenses etc. Pitch your topic with ease and precision using this Financial Summary Report Activities For Revenue And Expenditure Ppt Inspiration Display PDF. This layout presents information on Government Capital, Other Funds, Program Charge. It is also available for immediate download and adjustment. So, changes can be made in the color, design, graphics or any other component to create a unique layout.
Strategy To Improve Team Proficiency Company Financial Performance Dashboard Icons PDF
This slide provides detailed interpretation of statistics metrics provided in the previous slide highlighting the improvements in organization current human capital state. Deliver and pitch your topic in the best possible manner with this strategy to improve team proficiency company financial performance dashboard icons pdf. Use them to share invaluable insights on company financial performance dashboard and impress your audience. This template can be altered and modified as per your expectations. So, grab it now.
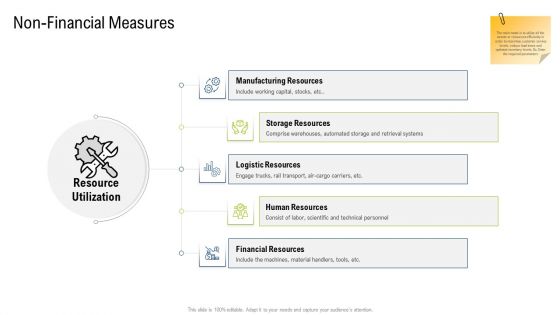
Multiple Phases For Supply Chain Management Non Financial Measures Capital Microsoft PDF
This is a multiple phases for supply chain management non financial measures capital microsoft pdf template with various stages. Focus and dispense information on five stages using this creative set, that comes with editable features. It contains large content boxes to add your information on topics like human resources, financial resources, logistic resources, storage resources, manufacturing resources. You can also showcase facts, figures, and other relevant content using this PPT layout. Grab it now.

Financial Inventory Metrics Systems Ppt PowerPoint Presentation Pictures Files Cpb Pdf
Presenting this set of slides with name financial inventory metrics systems ppt powerpoint presentation pictures files cpb pdf. This is an editable Powerpoint three stages graphic that deals with topics like financial inventory metrics systems to help convey your message better graphically. This product is a premium product available for immediate download and is 100 percent editable in Powerpoint. Download this now and use it in your presentations to impress your audience.
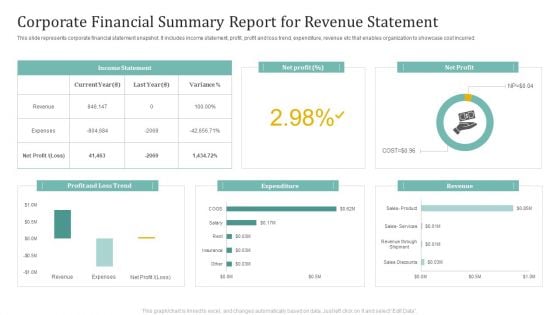
Corporate Financial Summary Report For Revenue Statement Ppt Ideas Graphic Images
This slide represents corporate financial statement snapshot. It includes income statement, profit, profit and loss trend, expenditure, revenue etc that enables organization to showcase cost incurred. Showcasing this set of slides titled Corporate Financial Summary Report For Revenue Statement Ppt Ideas Graphic Images. The topics addressed in these templates are Income Statement, Net Profit, Expenditure. All the content presented in this PPT design is completely editable. Download it and make adjustments in color, background, font etc. as per your unique business setting.
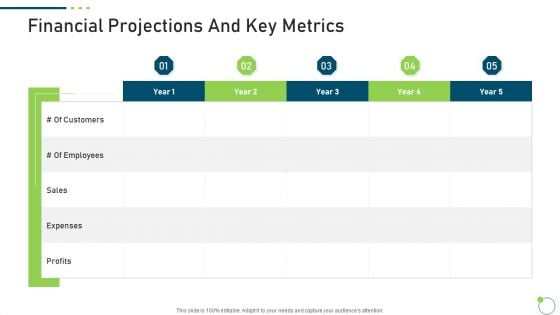
Investor Pitch Deck New Venture Capital Raising Financial Projections And Key Metrics Ideas PDF
Deliver and pitch your topic in the best possible manner with this investor pitch deck new venture capital raising financial projections and key metrics ideas pdf. Use them to share invaluable insights on sales, expenses, profits and impress your audience. This template can be altered and modified as per your expectations. So, grab it now.
Financial Measurement Healthcare Ppt PowerPoint Presentation File Designs Download Cpb Pdf
Presenting this set of slides with name financial measurement healthcare ppt powerpoint presentation file designs download cpb pdf. This is an editable Powerpoint three stages graphic that deals with topics like financial measurement healthcare to help convey your message better graphically. This product is a premium product available for immediate download and is 100 percent editable in Powerpoint. Download this now and use it in your presentations to impress your audience.
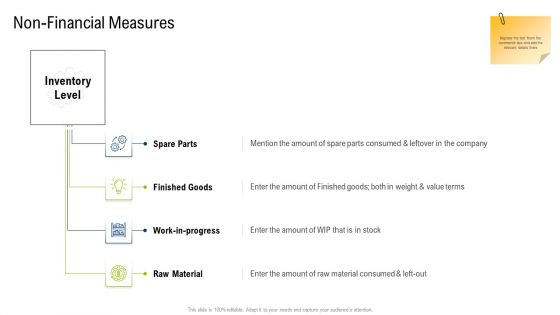
Multiple Phases For Supply Chain Management Non Financial Measures Spare Mockup PDF
This is a multiple phases for supply chain management non financial measures spare mockup pdf template with various stages. Focus and dispense information on three stages using this creative set, that comes with editable features. It contains large content boxes to add your information on topics like Non financial measures. You can also showcase facts, figures, and other relevant content using this PPT layout. Grab it now.
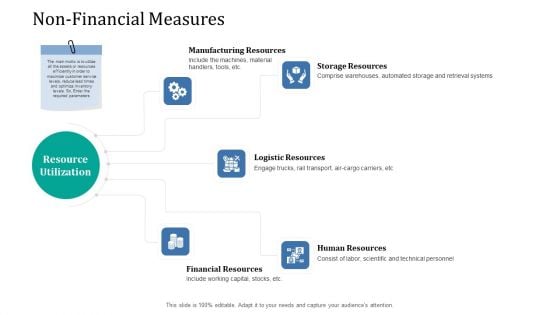
Supply Network Management Growth Non Financial Measures Resources Ppt Styles Templates PDF
This is a supply network management growth non financial measures resources ppt styles templates pdf template with various stages. Focus and dispense information on five stages using this creative set, that comes with editable features. It contains large content boxes to add your information on topics like manufacturing resources, storage resources, logistic resources, human resources, financial resources. You can also showcase facts, figures, and other relevant content using this PPT layout. Grab it now.
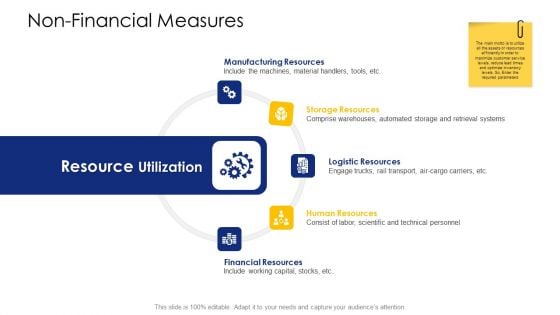
Logistic Network Administration Solutions Non Financial Measures Resources Ppt Styles Templates PDF
This is a logistic network administration solutions non financial measures resources ppt styles templates pdf template with various stages. Focus and dispense information on five stages using this creative set, that comes with editable features. It contains large content boxes to add your information on topics like manufacturing resources, storage resources, logistic resources, human resources, financial resources. You can also showcase facts, figures, and other relevant content using this PPT layout. Grab it now.

Analyzing Impact Of New Financial Strategic Planning Effective Planning For Monetary Elements PDF
This slide showcases the impact assessment of new financial strategy plan on key financial metrics involved. It includes parameters such as revenues, total revenue, revenue growth, expenses, margin EBITDA, etc.Explore a selection of the finest Analyzing Impact Of New Financial Strategic Planning Effective Planning For Monetary Elements PDF here. With a plethora of professionally designed and pre-made slide templates, you can quickly and easily find the right one for your upcoming presentation. You can use our Analyzing Impact Of New Financial Strategic Planning Effective Planning For Monetary Elements PDF to effectively convey your message to a wider audience. Slidegeeks has done a lot of research before preparing these presentation templates. The content can be personalized and the slides are highly editable. Grab templates today from Slidegeeks.
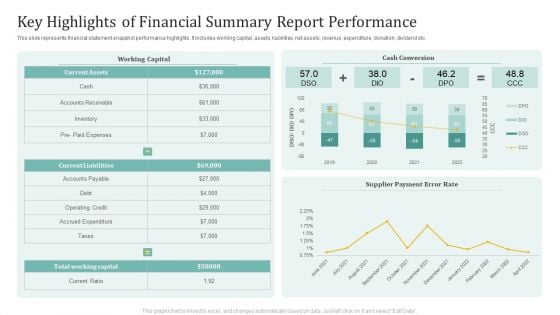
Key Highlights Of Financial Summary Report Performance Ppt Outline Slides PDF
This slide represents financial statement snapshot performance highlights. It includes working capital, assets, liabilities, net assets, revenue, expenditure, donation, dividend etc. Showcasing this set of slides titled Key Highlights Of Financial Summary Report Performance Ppt Outline Slides PDF. The topics addressed in these templates are Working Capital, Cash Conversion, Supplier Payment, Error Rate. All the content presented in this PPT design is completely editable. Download it and make adjustments in color, background, font etc. as per your unique business setting.
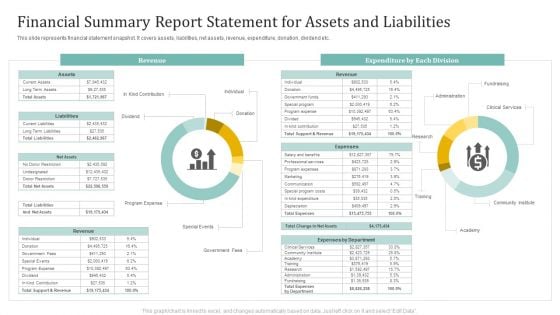
Financial Summary Report Statement For Assets And Liabilities Ppt Slides Guide PDF
This slide represents financial statement snapshot. It covers assets, liabilities, net assets, revenue, expenditure, donation, dividend etc. Pitch your topic with ease and precision using this Financial Summary Report Statement For Assets And Liabilities Ppt Slides Guide PDF. This layout presents information on Revenue, Expenditure Each Division, Fundraising. It is also available for immediate download and adjustment. So, changes can be made in the color, design, graphics or any other component to create a unique layout.
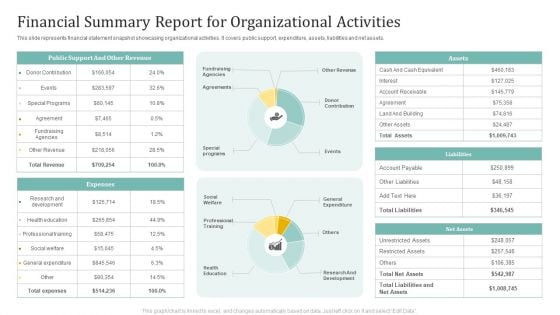
Financial Summary Report For Organizational Activities Ppt Summary Graphics Template PDF
This slide represents financial statement snapshot showcasing organizational activities. It covers public support, expenditure, assets, liabilities and net assets. Pitch your topic with ease and precision using this Financial Summary Report For Organizational Activities Ppt Summary Graphics Template PDF. This layout presents information on Public Support, Other Revenue, Expenses. It is also available for immediate download and adjustment. So, changes can be made in the color, design, graphics or any other component to create a unique layout.
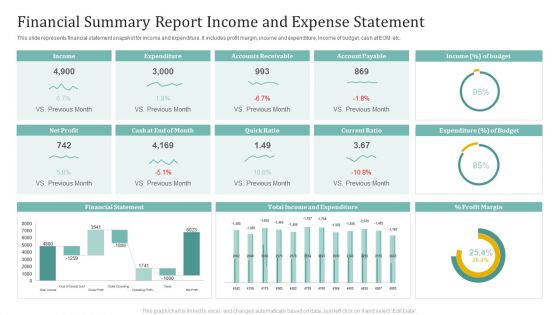
Financial Summary Report Income And Expense Statement Ppt File Background Designs PDF
This slide represents financial statement snapshot for income and expenditure. It includes profit margin, income and expenditure, income of budget, cash at EOM etc. Showcasing this set of slides titled Financial Summary Report Income And Expense Statement Ppt File Background Designs PDF. The topics addressed in these templates are Income, Expenditure, Accounts Receivable, Account Payable. All the content presented in this PPT design is completely editable. Download it and make adjustments in color, background, font etc. as per your unique business setting.
Cyber Security Administration In Organization Financial Performance Tracking Dashboard Microsoft PDF
This slide presents the dashboard which will help firm in tracking the fiscal performance. This dashboard displays revenues and expenses trends and payment received analysis. Deliver and pitch your topic in the best possible manner with this cyber security administration in organization financial performance tracking dashboard microsoft pdf. Use them to share invaluable insights on financial performance tracking dashboard and impress your audience. This template can be altered and modified as per your expectations. So, grab it now.
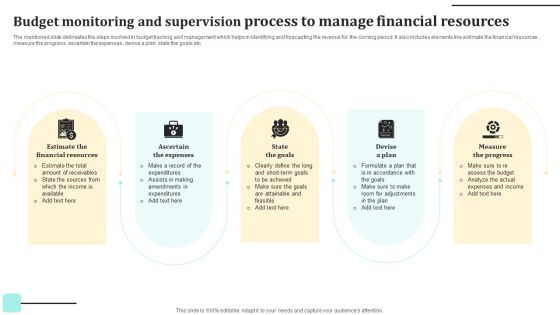
Budget Monitoring And Supervision Process To Manage Financial Resources Mockup PDF
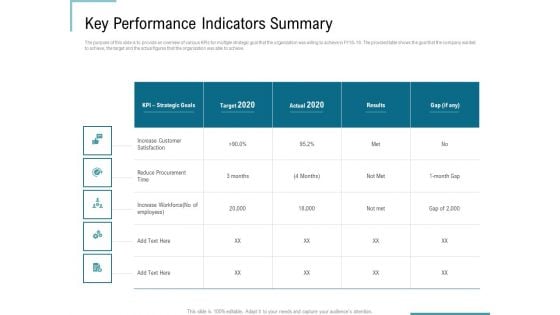
Corporate Execution Financial Liability Report Key Performance Indicators Summary Rules PDF
Presenting this set of slides with name corporate execution financial liability report key performance indicators summary rules pdf. The topics discussed in these slides are procurement, strategic, goals, target, procurement. This is a completely editable PowerPoint presentation and is available for immediate download. Download now and impress your audience.
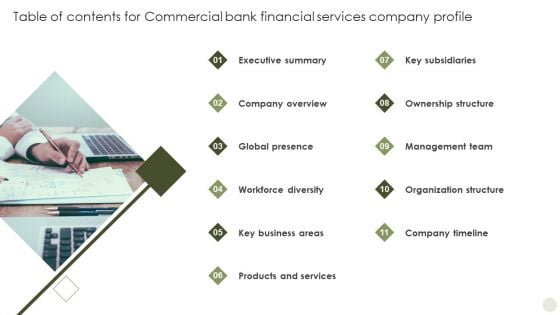
Table Of Contents For Commercial Bank Financial Services Company Profile Graphics PDF
This is a Table Of Contents For Commercial Bank Financial Services Company Profile Graphics PDF template with various stages. Focus and dispense information on one stages using this creative set, that comes with editable features. It contains large content boxes to add your information on topics like Business Model, Financial Snapshot, Workforce Diversity, Global Presence, Management Team. You can also showcase facts, figures, and other relevant content using this PPT layout. Grab it now.
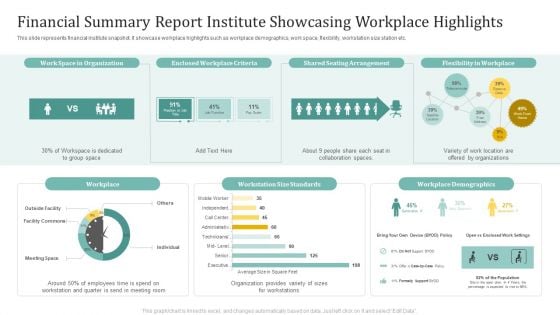
Financial Summary Report Institute Showcasing Workplace Highlights Ppt Infographics Inspiration PDF
This slide represents financial institute snapshot. It showcase workplace highlights such as workplace demographics, work space, flexibility, workstation size station etc. Pitch your topic with ease and precision using this Financial Summary Report Institute Showcasing Workplace Highlights Ppt Infographics Inspiration PDF. This layout presents information on Shared Seating Arrangement, Flexibility Workplace, Workplace. It is also available for immediate download and adjustment. So, changes can be made in the color, design, graphics or any other component to create a unique layout.
Ways To Enhance Organizations Profitability Financial Performance Tracking Dashboard Slides PDF
This slide presents the dashboard which will help firm in tracking the financial performance. This dashboard displays number of customers, vendors and revenues generated, expenses and profit incurred. Deliver and pitch your topic in the best possible manner with this ways to enhance organizations profitability financial performance tracking dashboard slides pdf Use them to share invaluable insights on asset rationalization, adjusting liability, capital moderation and impress your audience. This template can be altered and modified as per your expectations. So, grab it now.
Strategic Plan For Corporate Recovery Financial Performance Tracking Dashboard Summary PDF
This slide presents the dashboard which will help firm in tracking the financial performance. This dashboard displays number of customers, vendors and revenues generated, expenses and profit incurred. Deliver an awe inspiring pitch with this creative strategic plan for corporate recovery financial performance tracking dashboard summary pdf bundle. Topics like performance, profit, revenue, expense, customers can be discussed with this completely editable template. It is available for immediate download depending on the needs and requirements of the user.
Strawman Proposal For Enterprise Critical Thinking Financial Performance Tracking Dashboard Demonstration PDF
This slide presents the dashboard which will help firm in tracking the financial performance. This dashboard displays number of customers, vendors and revenues generated, expenses and profit incurred. Deliver an awe inspiring pitch with this creative strawman proposal for enterprise critical thinking financial performance tracking dashboard demonstration pdf bundle. Topics like current year to date, revenue, expense, profit can be discussed with this completely editable template. It is available for immediate download depending on the needs and requirements of the user.
Manual To Develop Strawman Proposal Financial Performance Tracking Dashboard Pictures PDF
This slide presents the dashboard which will help firm in tracking the financial performance. This dashboard displays number of customers, vendors and revenues generated, expenses and profit incurred. Deliver and pitch your topic in the best possible manner with this Manual To Develop Strawman Proposal Financial Performance Tracking Dashboard Pictures PDF. Use them to share invaluable insights on Profit, Revenue, Expense and impress your audience. This template can be altered and modified as per your expectations. So, grab it now.
Financial Performance Indicators Healthcare Ppt PowerPoint Presentation Pictures Designs Cpb Pdf
Presenting this set of slides with name financial performance indicators healthcare ppt powerpoint presentation pictures designs cpb pdf. This is an editable Powerpoint four stages graphic that deals with topics like financial performance indicators healthcare to help convey your message better graphically. This product is a premium product available for immediate download and is 100 percent editable in Powerpoint. Download this now and use it in your presentations to impress your audience.
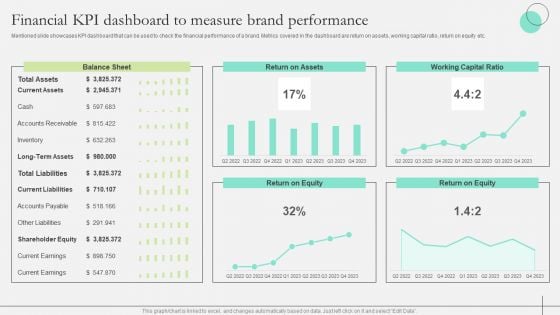
Comprehensive Guide To Strengthen Brand Equity Financial KPI Dashboard Measure Brand Structure PDF
Mentioned slide showcases KPI dashboard that can be used to check the financial performance of a brand. Metrics covered in the dashboard are return on assets, working capital ratio, return on equity etc. Take your projects to the next level with our ultimate collection of Comprehensive Guide To Strengthen Brand Equity Financial KPI Dashboard Measure Brand Structure PDF. Slidegeeks has designed a range of layouts that are perfect for representing task or activity duration, keeping track of all your deadlines at a glance. Tailor these designs to your exact needs and give them a truly corporate look with your own brand colors they will make your projects stand out from the rest

Key Financial Chart Digital Marketings Strategies PPT PowerPoint CP SS V
This slide showcases the sales of Aerospace company. It includes sales growth and net income growth of five years. Sales growth measures the ability of sales team to increase revenue over a fixed period of time. Coming up with a presentation necessitates that the majority of the effort goes into the content and the message you intend to convey. The visuals of a PowerPoint presentation can only be effective if it supplements and supports the story that is being told. Keeping this in mind our experts created Key Financial Chart Digital Marketings Strategies PPT PowerPoint CP SS V to reduce the time that goes into designing the presentation. This way, you can concentrate on the message while our designers take care of providing you with the right template for the situation. This slide showcases the sales of Aerospace company. It includes sales growth and net income growth of five years. Sales growth measures the ability of sales team to increase revenue over a fixed period of time.

Online Financial Transaction Mobile Banking Dashboard Ppt PowerPoint Presentation Gallery Professional PDF
Persuade your audience using this online financial transaction mobile banking dashboard ppt powerpoint presentation gallery professional pdf. This PPT design covers three stages, thus making it a great tool to use. It also caters to a variety of topics including online financial transaction mobile banking dashboard. Download this PPT design now to present a convincing pitch that not only emphasizes the topic but also showcases your presentation skills.
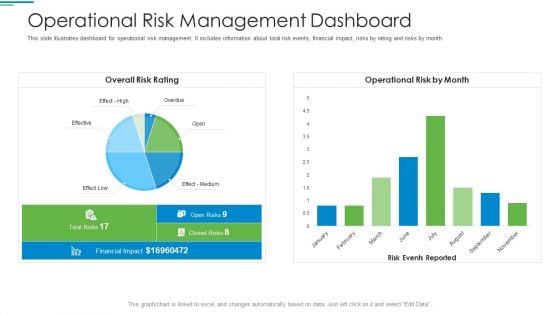
Operational Risk Management Structure In Financial Companies Operational Risk Management Dashboard Rules PDF
This slide illustrates dashboard for operational risk management. It includes information about total risk events, financial impact, risks by rating and risks by month. Deliver an awe inspiring pitch with this creative operational risk management structure in financial companies operational risk management dashboard rules pdf bundle. Topics like overall risk rating, operational risk by month can be discussed with this completely editable template. It is available for immediate download depending on the needs and requirements of the user.
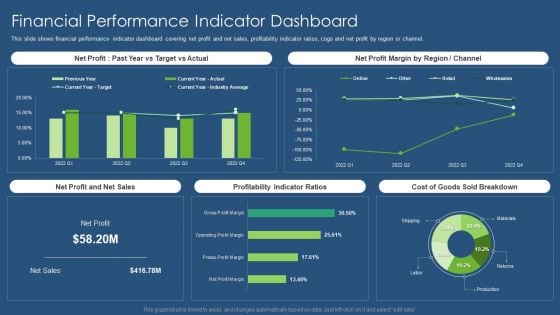
Sustainability Calculation With KPI Financial Performance Indicator Dashboard Infographics PDF Template PDF
This slide shows financial performance indicator dashboard covering net profit and net sales, profitability indicator ratios, cogs and net profit by region or channel. Deliver an awe inspiring pitch with this creative sustainability calculation with kpi financial performance indicator dashboard infographics pdf bundle. Topics like net profit margin, net profit and net sales, profitability indicator ratios, sold breakdown can be discussed with this completely editable template. It is available for immediate download depending on the needs and requirements of the user.
Financial Environment Dashboard For Tracking Growth In Banking Industry Slides PDF
This slide covers financial environment dashboard for tracking growth in banking industry which includes overall regional and sub-regional growth of banking services Pitch your topic with ease and precision using this Financial Environment Dashboard For Tracking Growth In Banking Industry Slides PDF This layout presents information on Best Demonstrated, Worst Demonstrated, Average Variance It is also available for immediate download and adjustment. So, changes can be made in the color, design, graphics or any other component to create a unique layout.
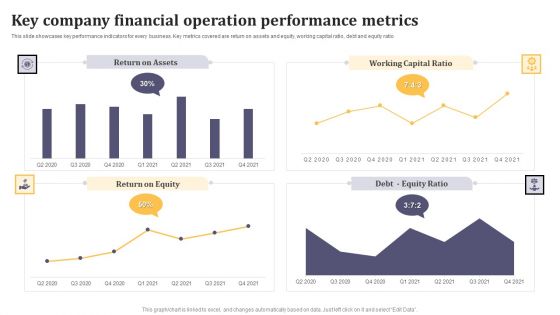
Key Company Financial Operation Performance Metrics Ppt Infographic Template Example Introduction PDF
This slide showcases key performance indicators for every business. Key metrics covered are return on assets and equity, working capital ratio, debt and equity ratio. Showcasing this set of slides titled Key Company Financial Operation Performance Metrics Ppt Infographic Template Example Introduction PDF. The topics addressed in these templates are Return on Assets, Working Capital Ratio, Return on Equity. All the content presented in this PPT design is completely editable. Download it and make adjustments in color, background, font etc. as per your unique business setting.
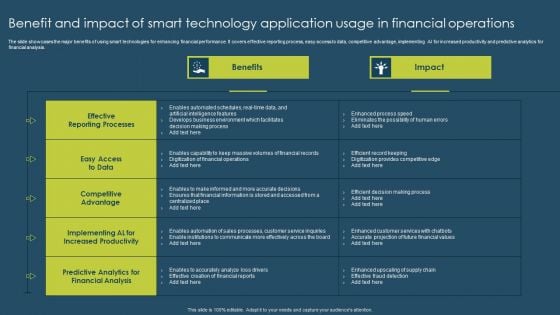
Benefit And Impact Of Smart Technology Application Usage In Financial Operations Summary PDF
The slide showcases the major benefits of using smart technologies for enhancing financial performance. It covers effective reporting process, easy access to data, competitive advantage, implementing AI for increased productivity and predictive analytics for financial analysis. Showcasing this set of slides titled Benefit And Impact Of Smart Technology Application Usage In Financial Operations Summary PDF. The topics addressed in these templates are Benefits, Impact. All the content presented in this PPT design is completely editable. Download it and make adjustments in color, background, font etc. as per your unique business setting.
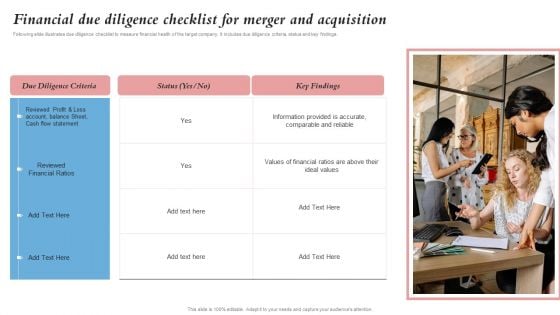
Financial Due Diligence Checklist For Merger And Acquisition Merger And Integration Procedure Topics PDF
Following slide illustrates due diligence checklist to measure financial health of the target company. It includes due diligence criteria, status and key findings.This is a Financial Due Diligence Checklist For Merger And Acquisition Merger And Integration Procedure Topics PDF template with various stages. Focus and dispense information on one stage using this creative set, that comes with editable features. It contains large content boxes to add your information on topics like Information Provided, Accurate Comparable, Values Financial. You can also showcase facts, figures, and other relevant content using this PPT layout. Grab it now.
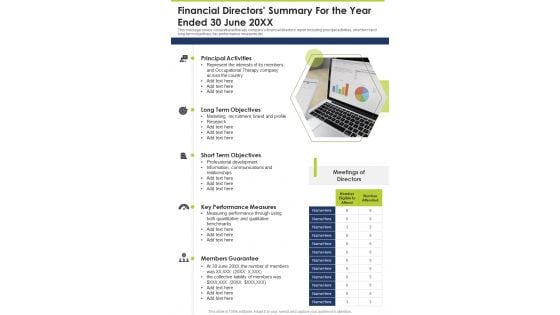
Financial Directors Summary For The Year Ended 30 June 20XX One Pager Documents
This one page covers occupational therapy companys financial directors report including principal activities, short term and long-term objectives, key performance measures etc. Presenting you a fantastic Financial Directors Summary For The Year Ended 30 June 20XX One Pager Documents. This piece is crafted on hours of research and professional design efforts to ensure you have the best resource. It is completely editable and its design allow you to rehash its elements to suit your needs. Get this Financial Directors Summary For The Year Ended 30 June 20XX One Pager Documents A4 One-pager now.
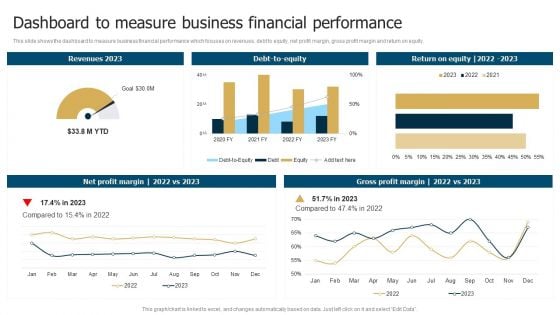
Business Restructuring Process Dashboard To Measure Business Financial Performance Rules PDF
This slide shows the dashboard to measure business financial performance which focuses on revenues, debt to equity, net profit margin, gross profit margin and return on equity. If you are looking for a format to display your unique thoughts, then the professionally designed Business Restructuring Process Dashboard To Measure Business Financial Performance Rules PDF is the one for you. You can use it as a Google Slides template or a PowerPoint template. Incorporate impressive visuals, symbols, images, and other charts. Modify or reorganize the text boxes as you desire. Experiment with shade schemes and font pairings. Alter, share or cooperate with other people on your work. Download Business Restructuring Process Dashboard To Measure Business Financial Performance Rules PDF and find out how to give a successful presentation. Present a perfect display to your team and make your presentation unforgettable.


 Continue with Email

 Home
Home


